
Intelligent Detection and Odor Recognition of Cigarette Packaging Paper Boxes Based on a Homemade Electronic Nose


Abstract
1. Introduction
2. Materials and Methods
2.1. Materials
- Preparation of Qualified Samples: Begin by selecting a piece of cigarette packaging paper, weighing approximately 10 g. Carefully fold the paper in such a manner that the printed surface is exposed, enhancing the release of volatile organic compounds. Next, place the folded paper into a sample container bottle. Allow the sample to stand at room temperature, specifically at an indoor temperature of 24 degrees Celsius, facilitating the natural volatilization of the compounds.
- Preparation of Odor Samples: Following the procedure for preparing qualified samples, select another piece of cigarette packaging paper and fold it accordingly. Place this folded paper into a sample container bottle as well. Utilizing a micro-injector, introduce 3 microliters of an ethyl acetate solution into the bottle to act as the odor source. Let the sample undergo volatilization at room temperature, maintaining an indoor temperature of 24 degrees Celsius.
- Preparation of Qualified Samples: Begin by carefully opening each box of the finished cigarette samples. Remove the cigarettes, the tin foil, and the cardboard, ensuring the cigarette box remains intact. Subsequently, place this intact cigarette box into a sample container bottle. Allow the box to volatilize at room temperature, set at an indoor temperature of 24 degrees Celsius, to facilitate the natural emission of volatile compounds.
- Preparation of Odor Samples: Follow the initial steps as in the preparation of qualified samples by removing the cigarettes, tin foil, and cardboard from the packaging box, keeping the cigarette box intact. Place the intact box into a sample container bottle. Then, using a micro-injector, introduce 3 microliters of an ethyl acetate solution into the bottle to serve as the odor source. Permit the sample to volatilize at room temperature, maintaining an indoor temperature of 24 degrees Celsius.
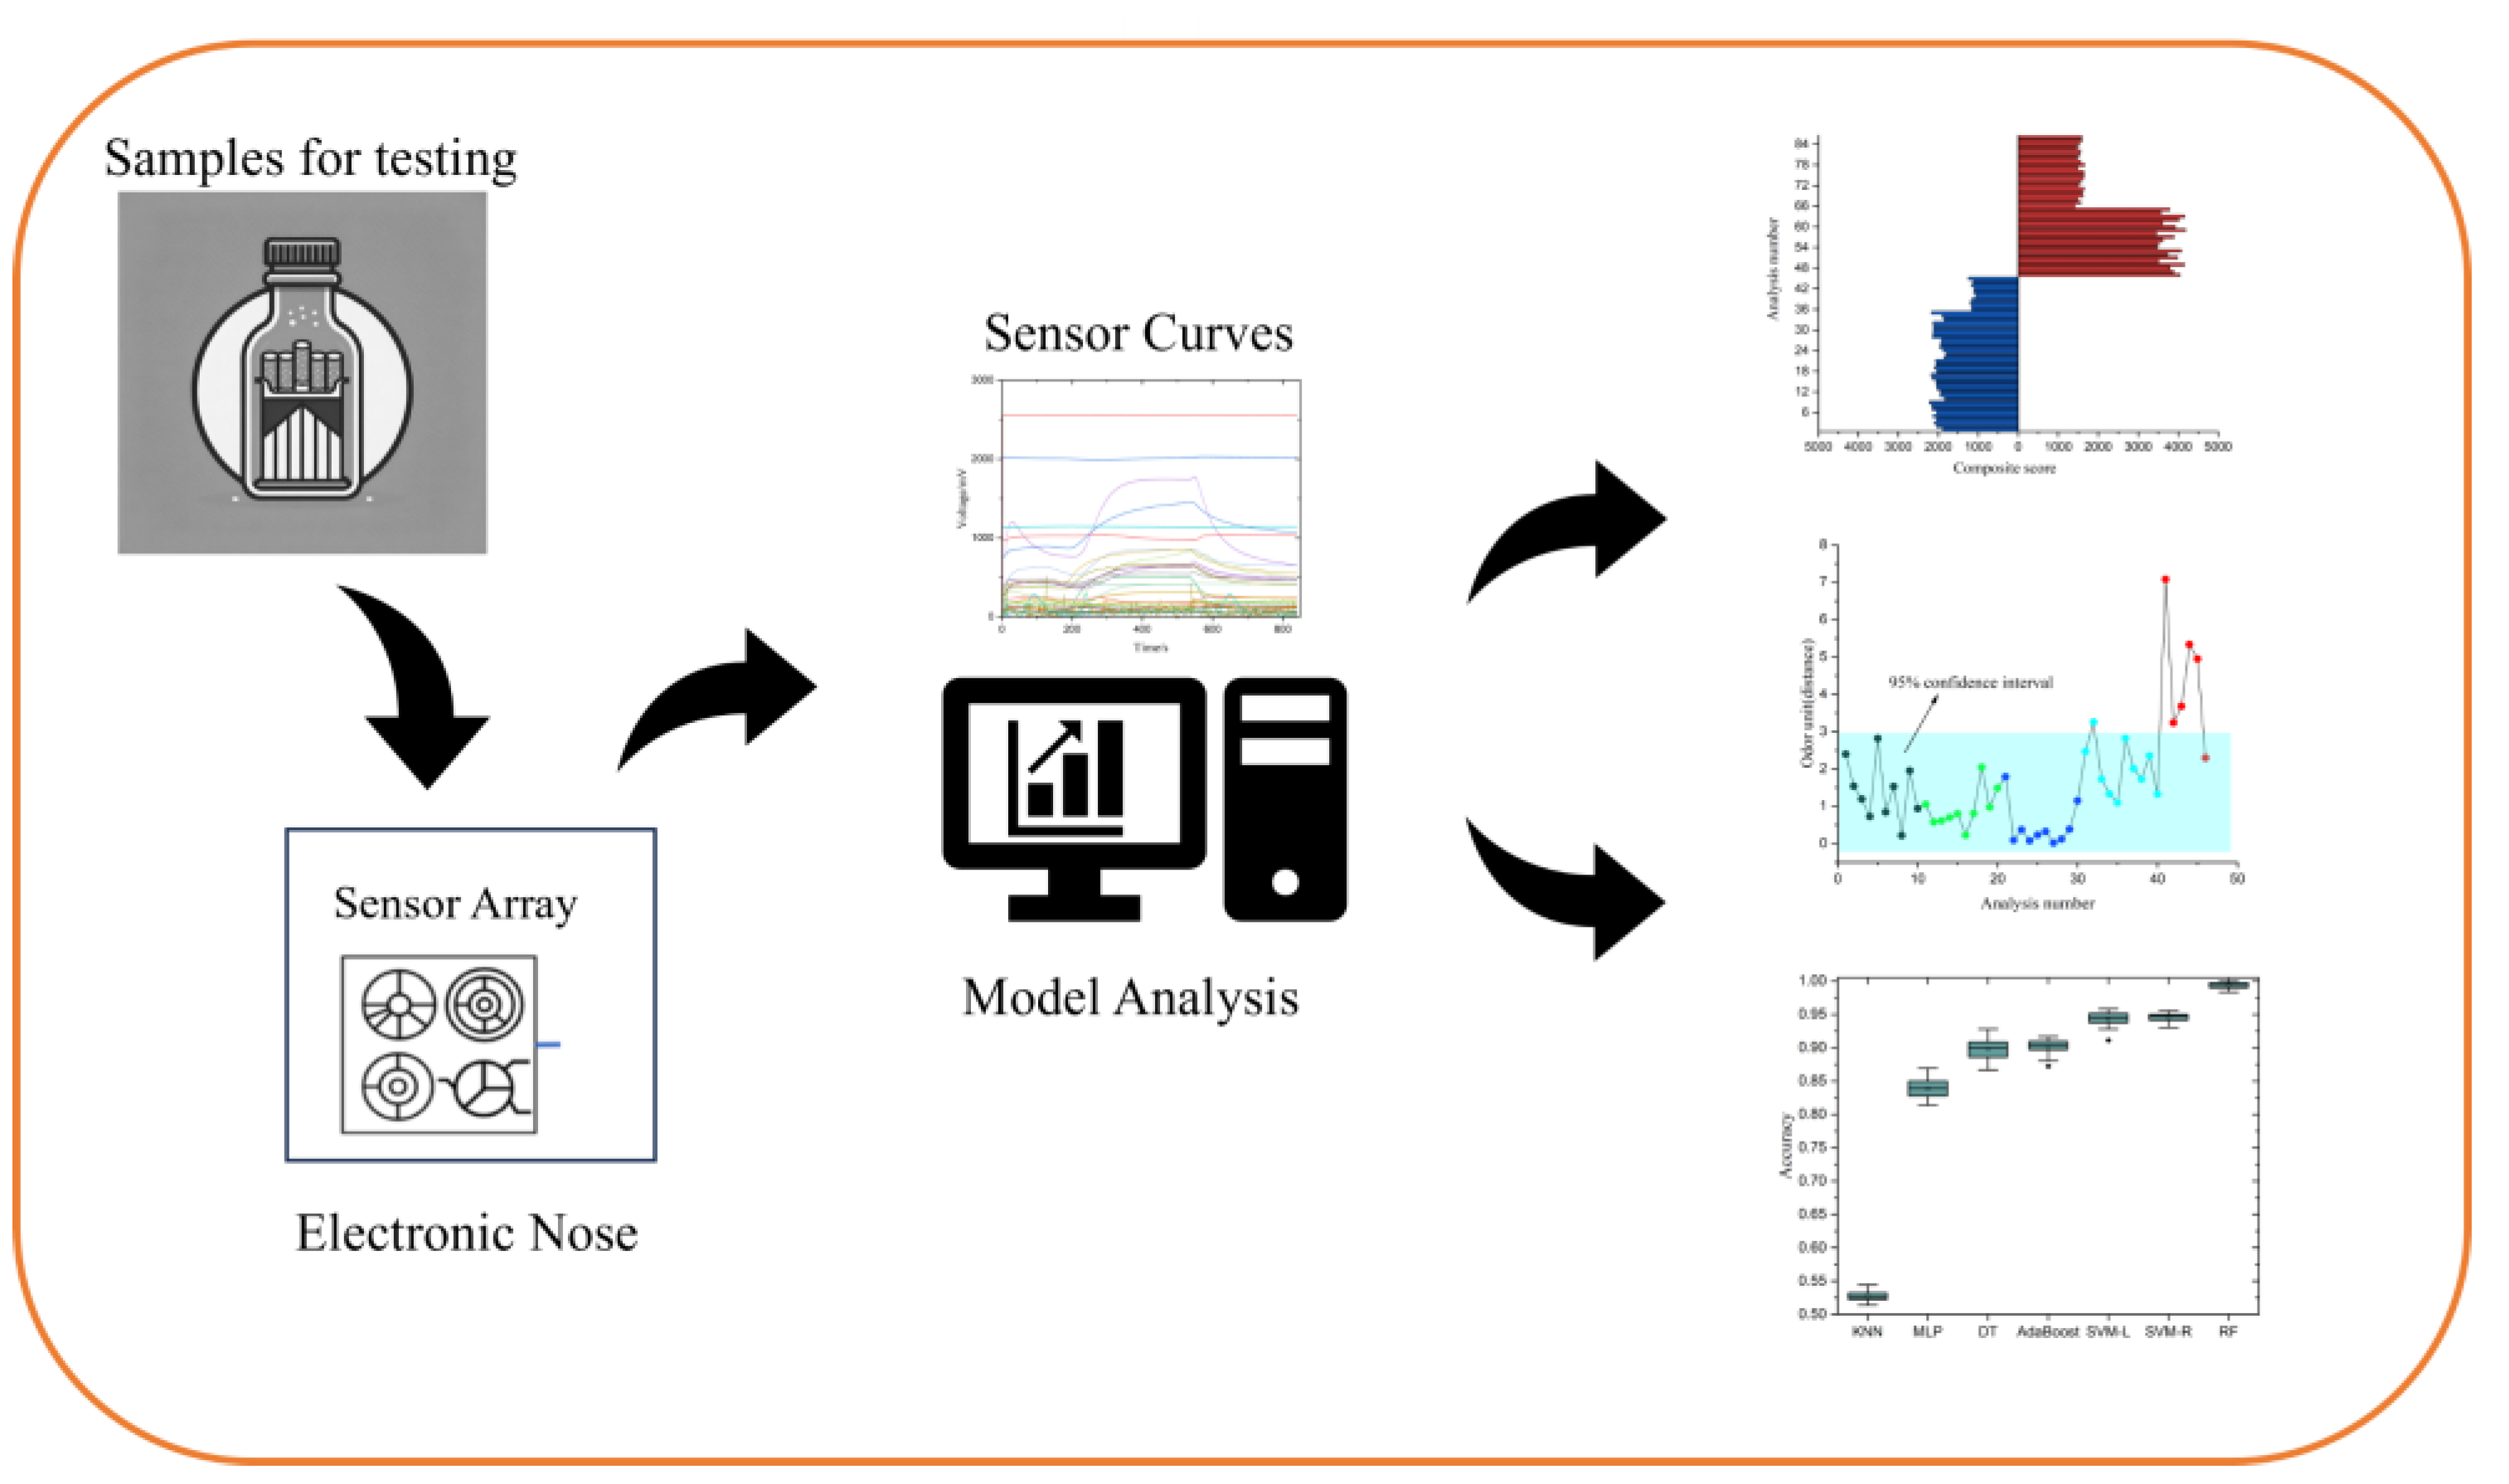
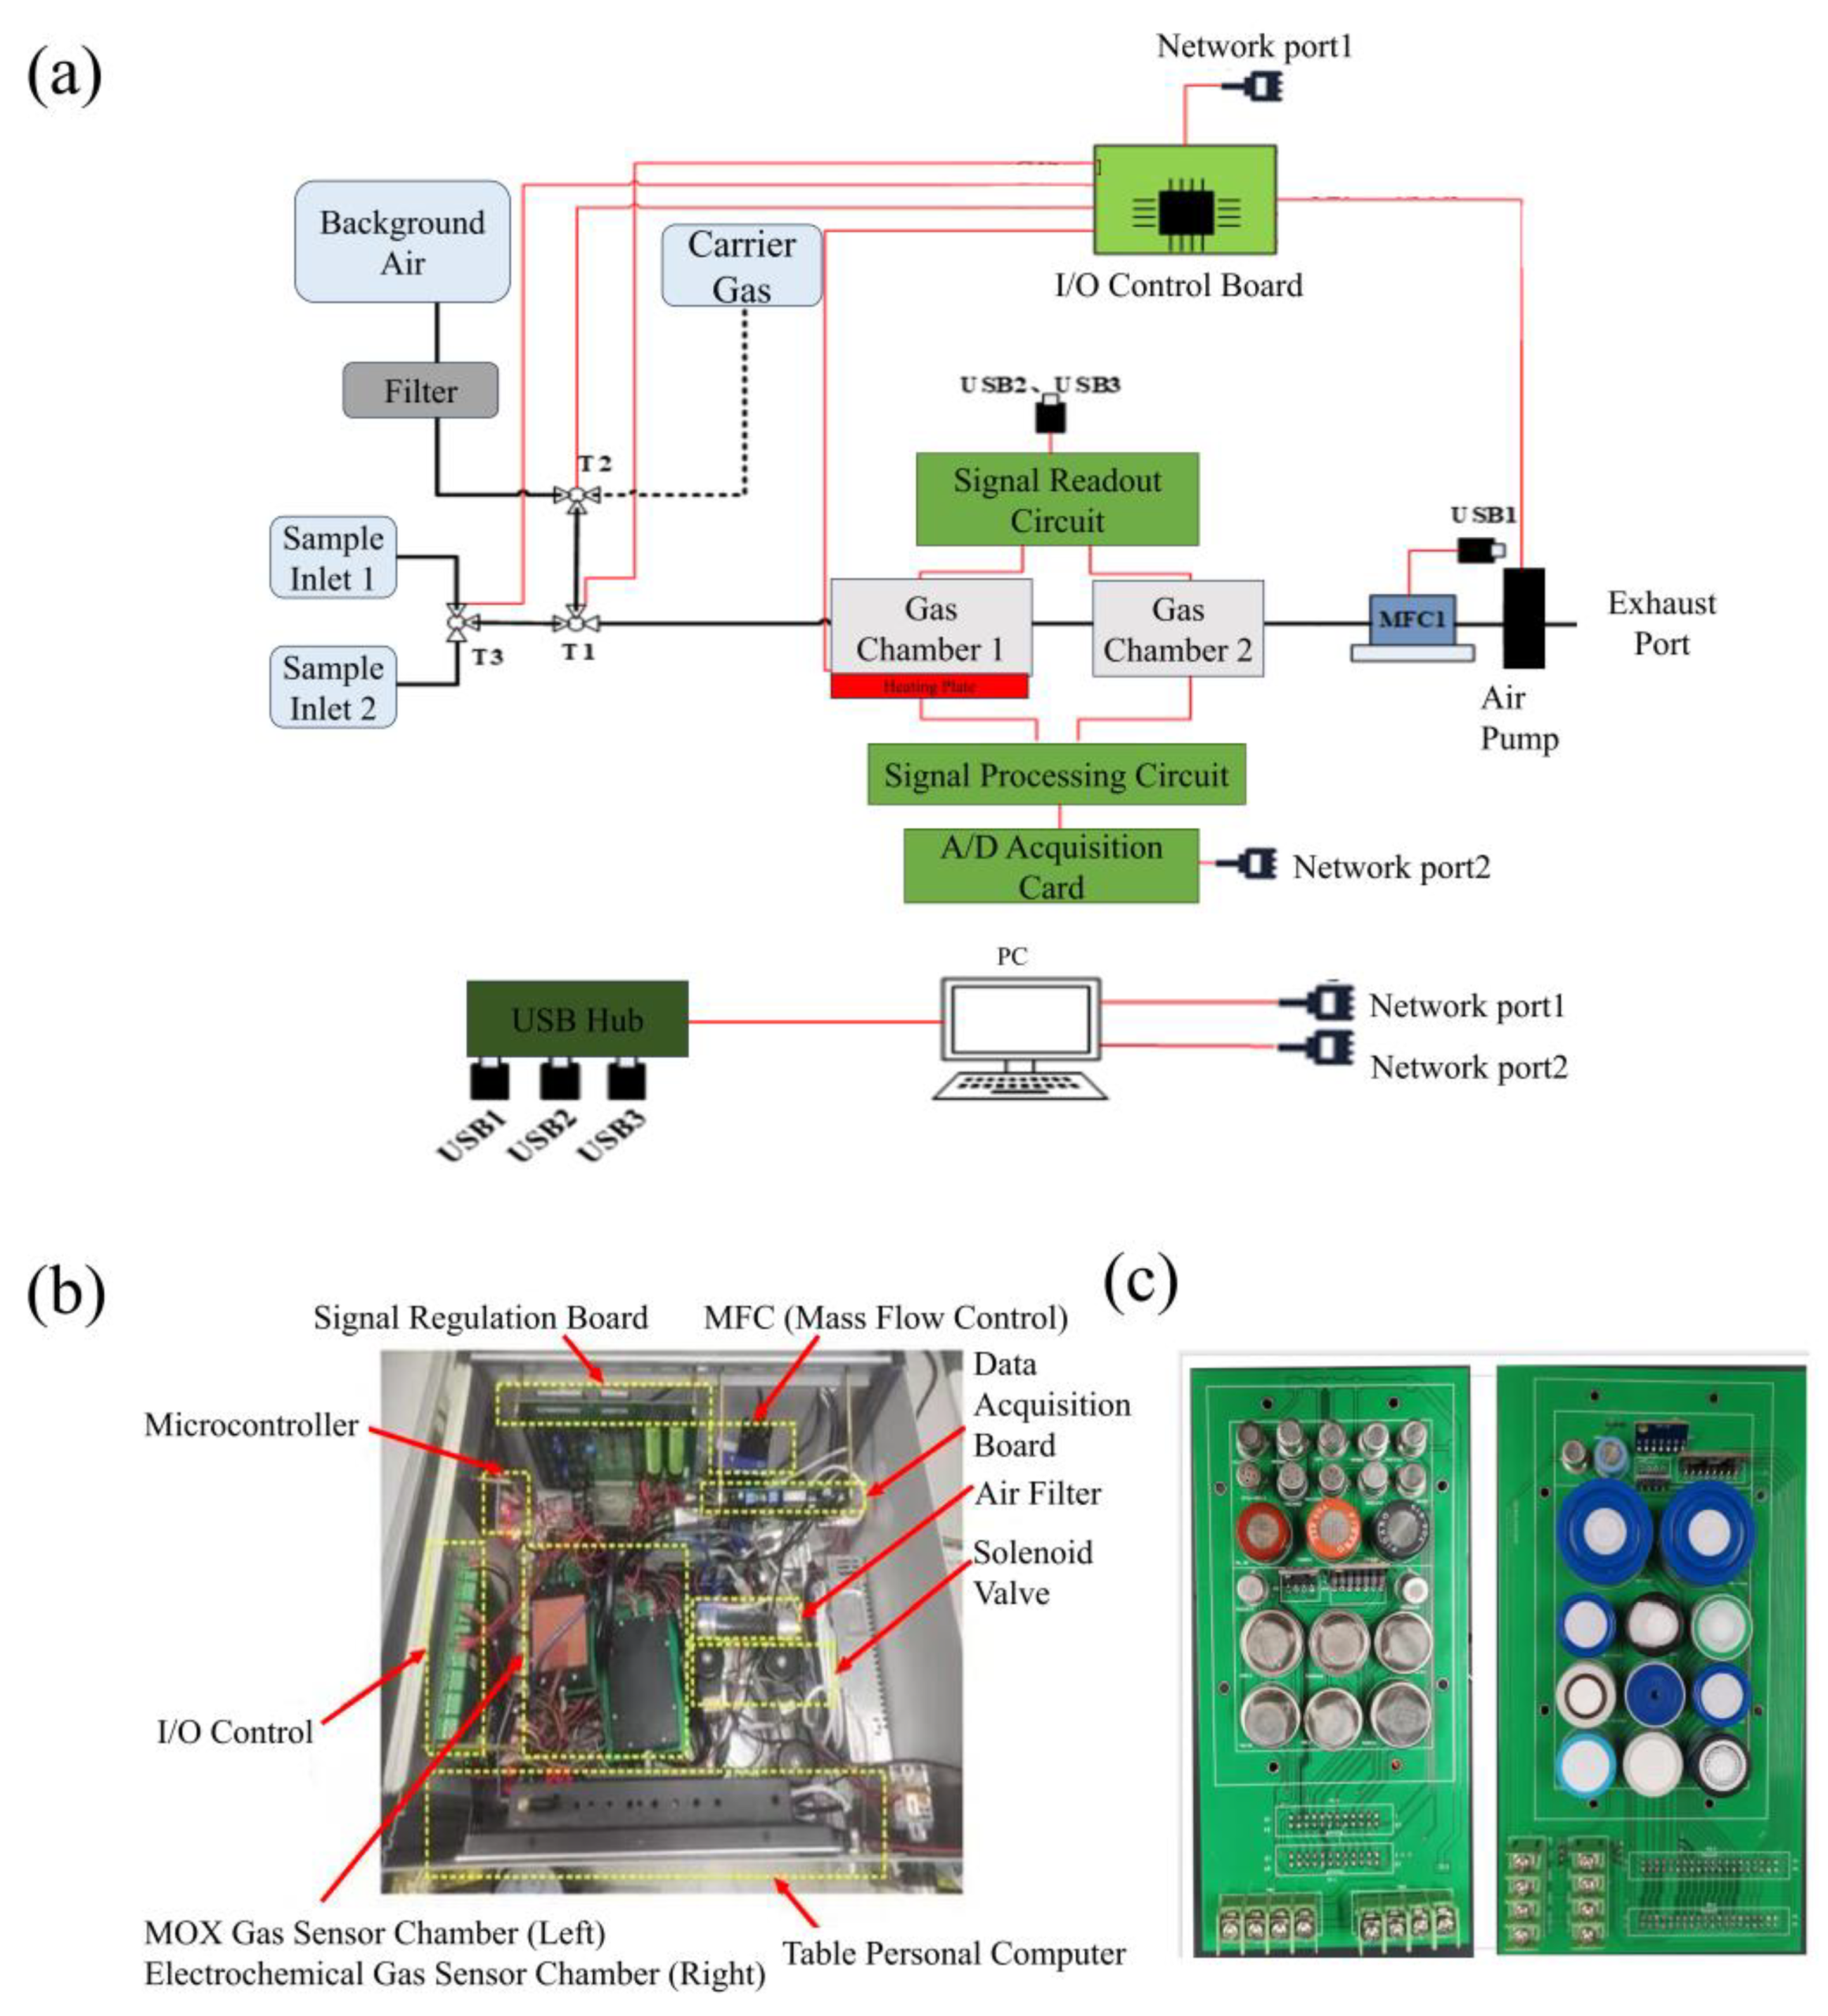
2.2. Experimental Setup
2.3. Data Processing
3. Results and Discussion
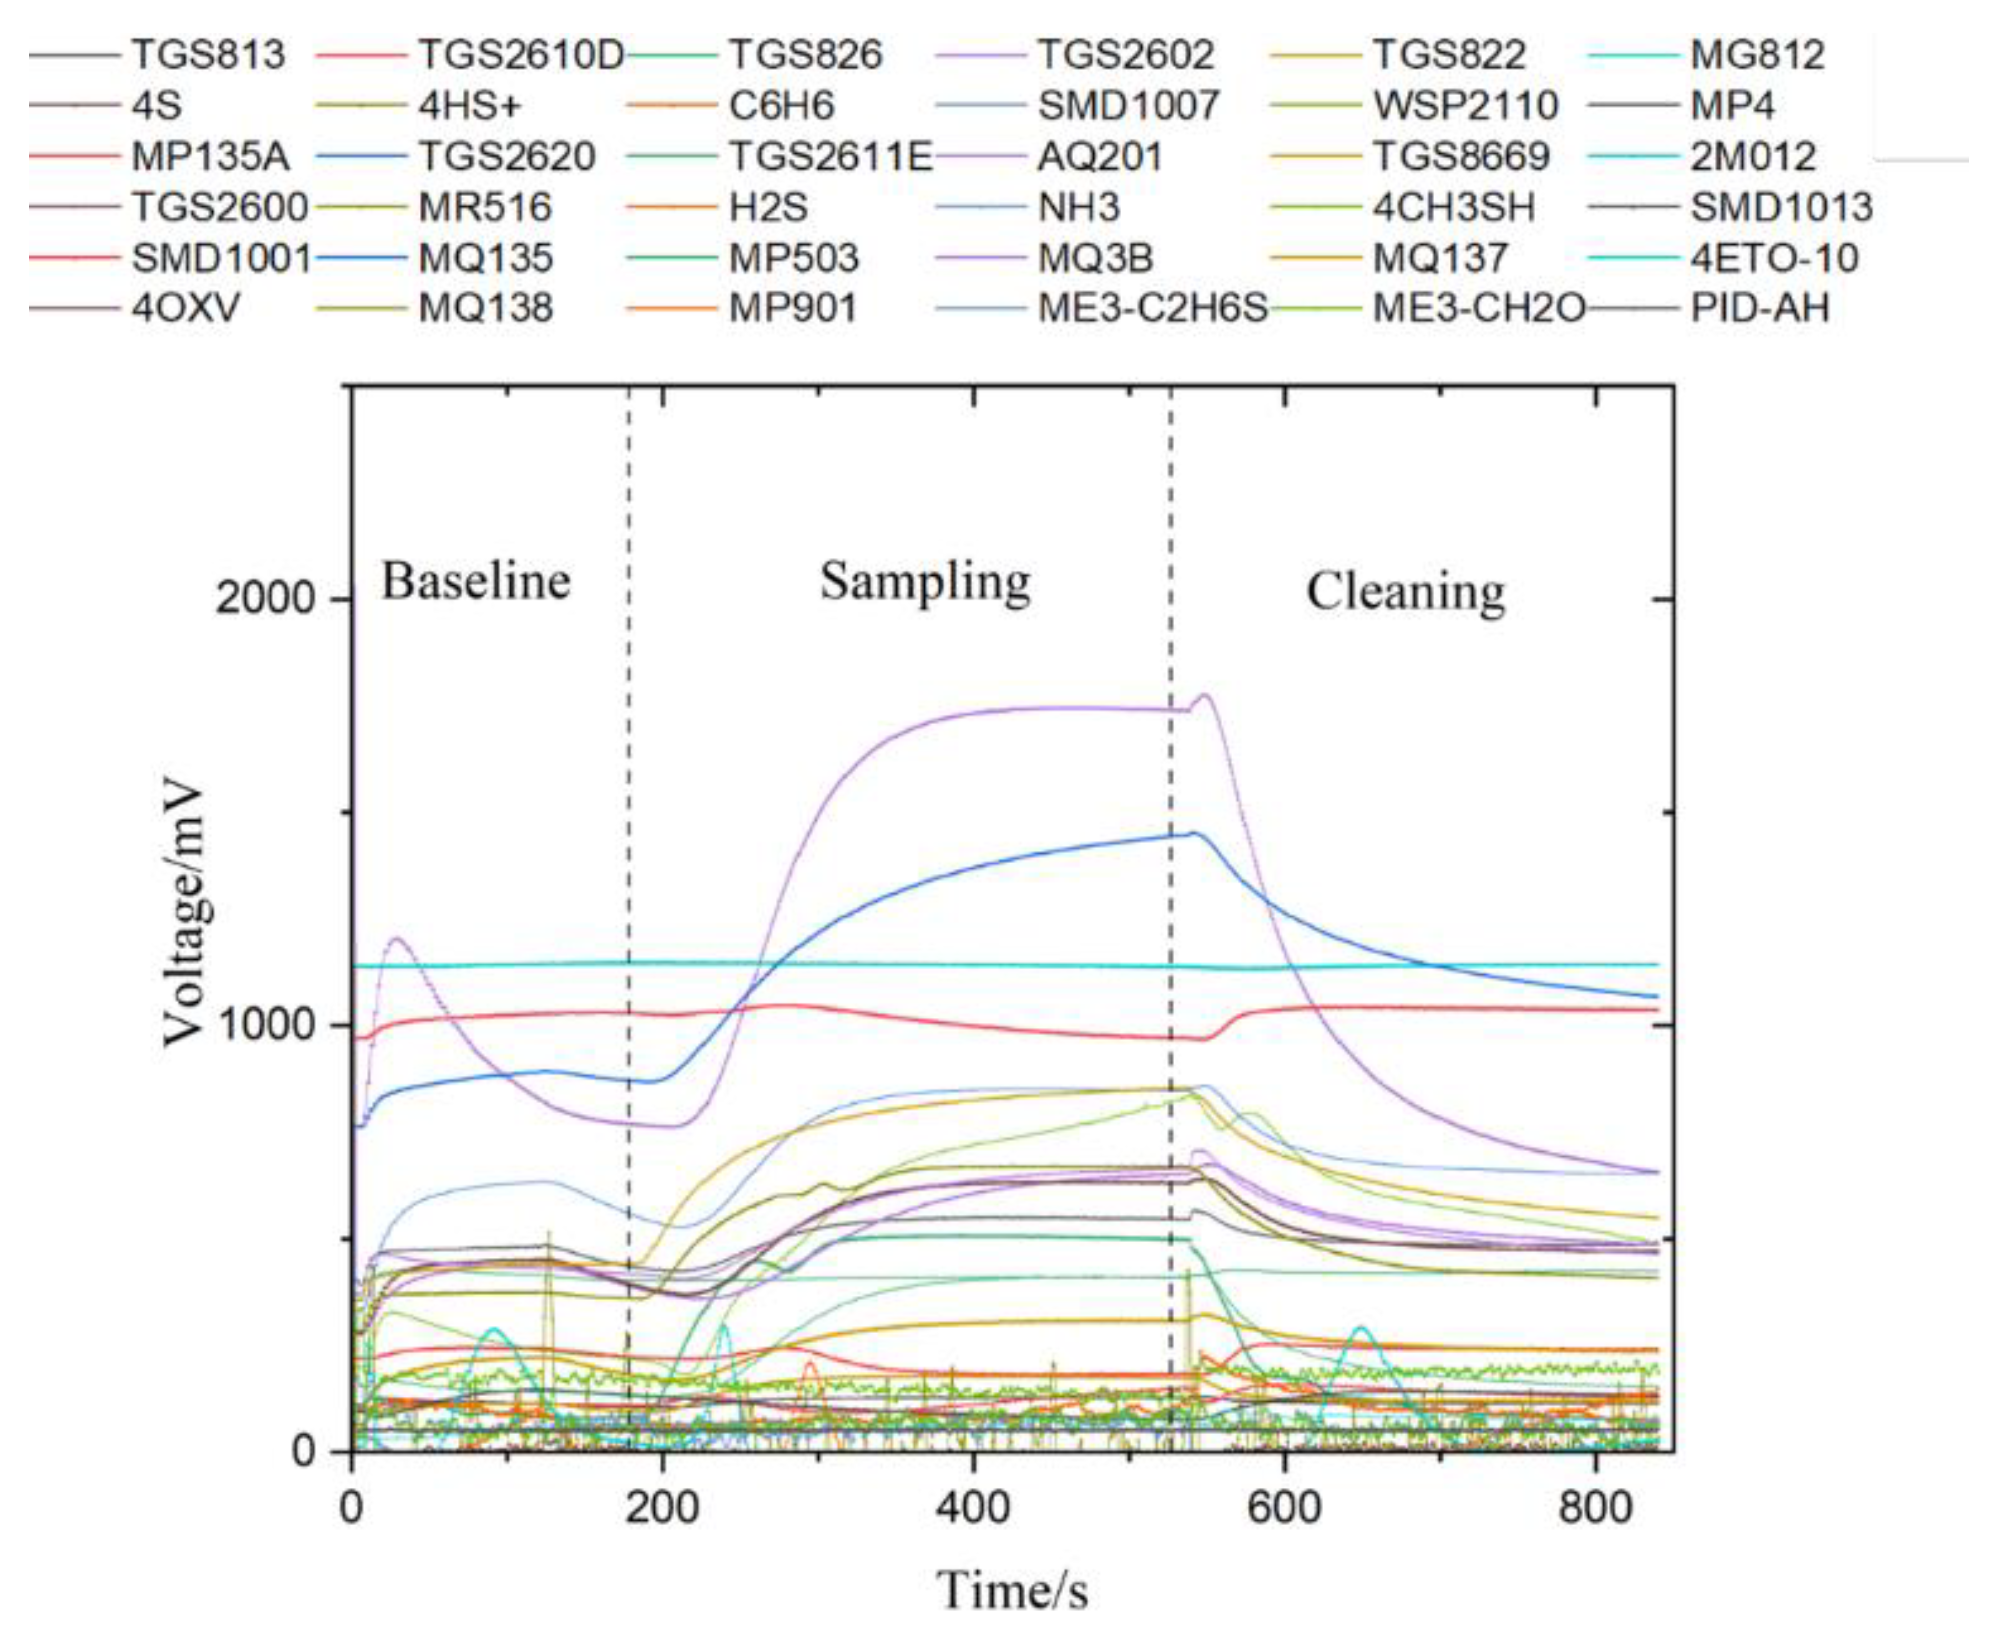
3.1. Analysis of the Specificity and Sensitivity of the Sensor on the Sample’s VOCs
3.2. Feature Selection and Validity Verification
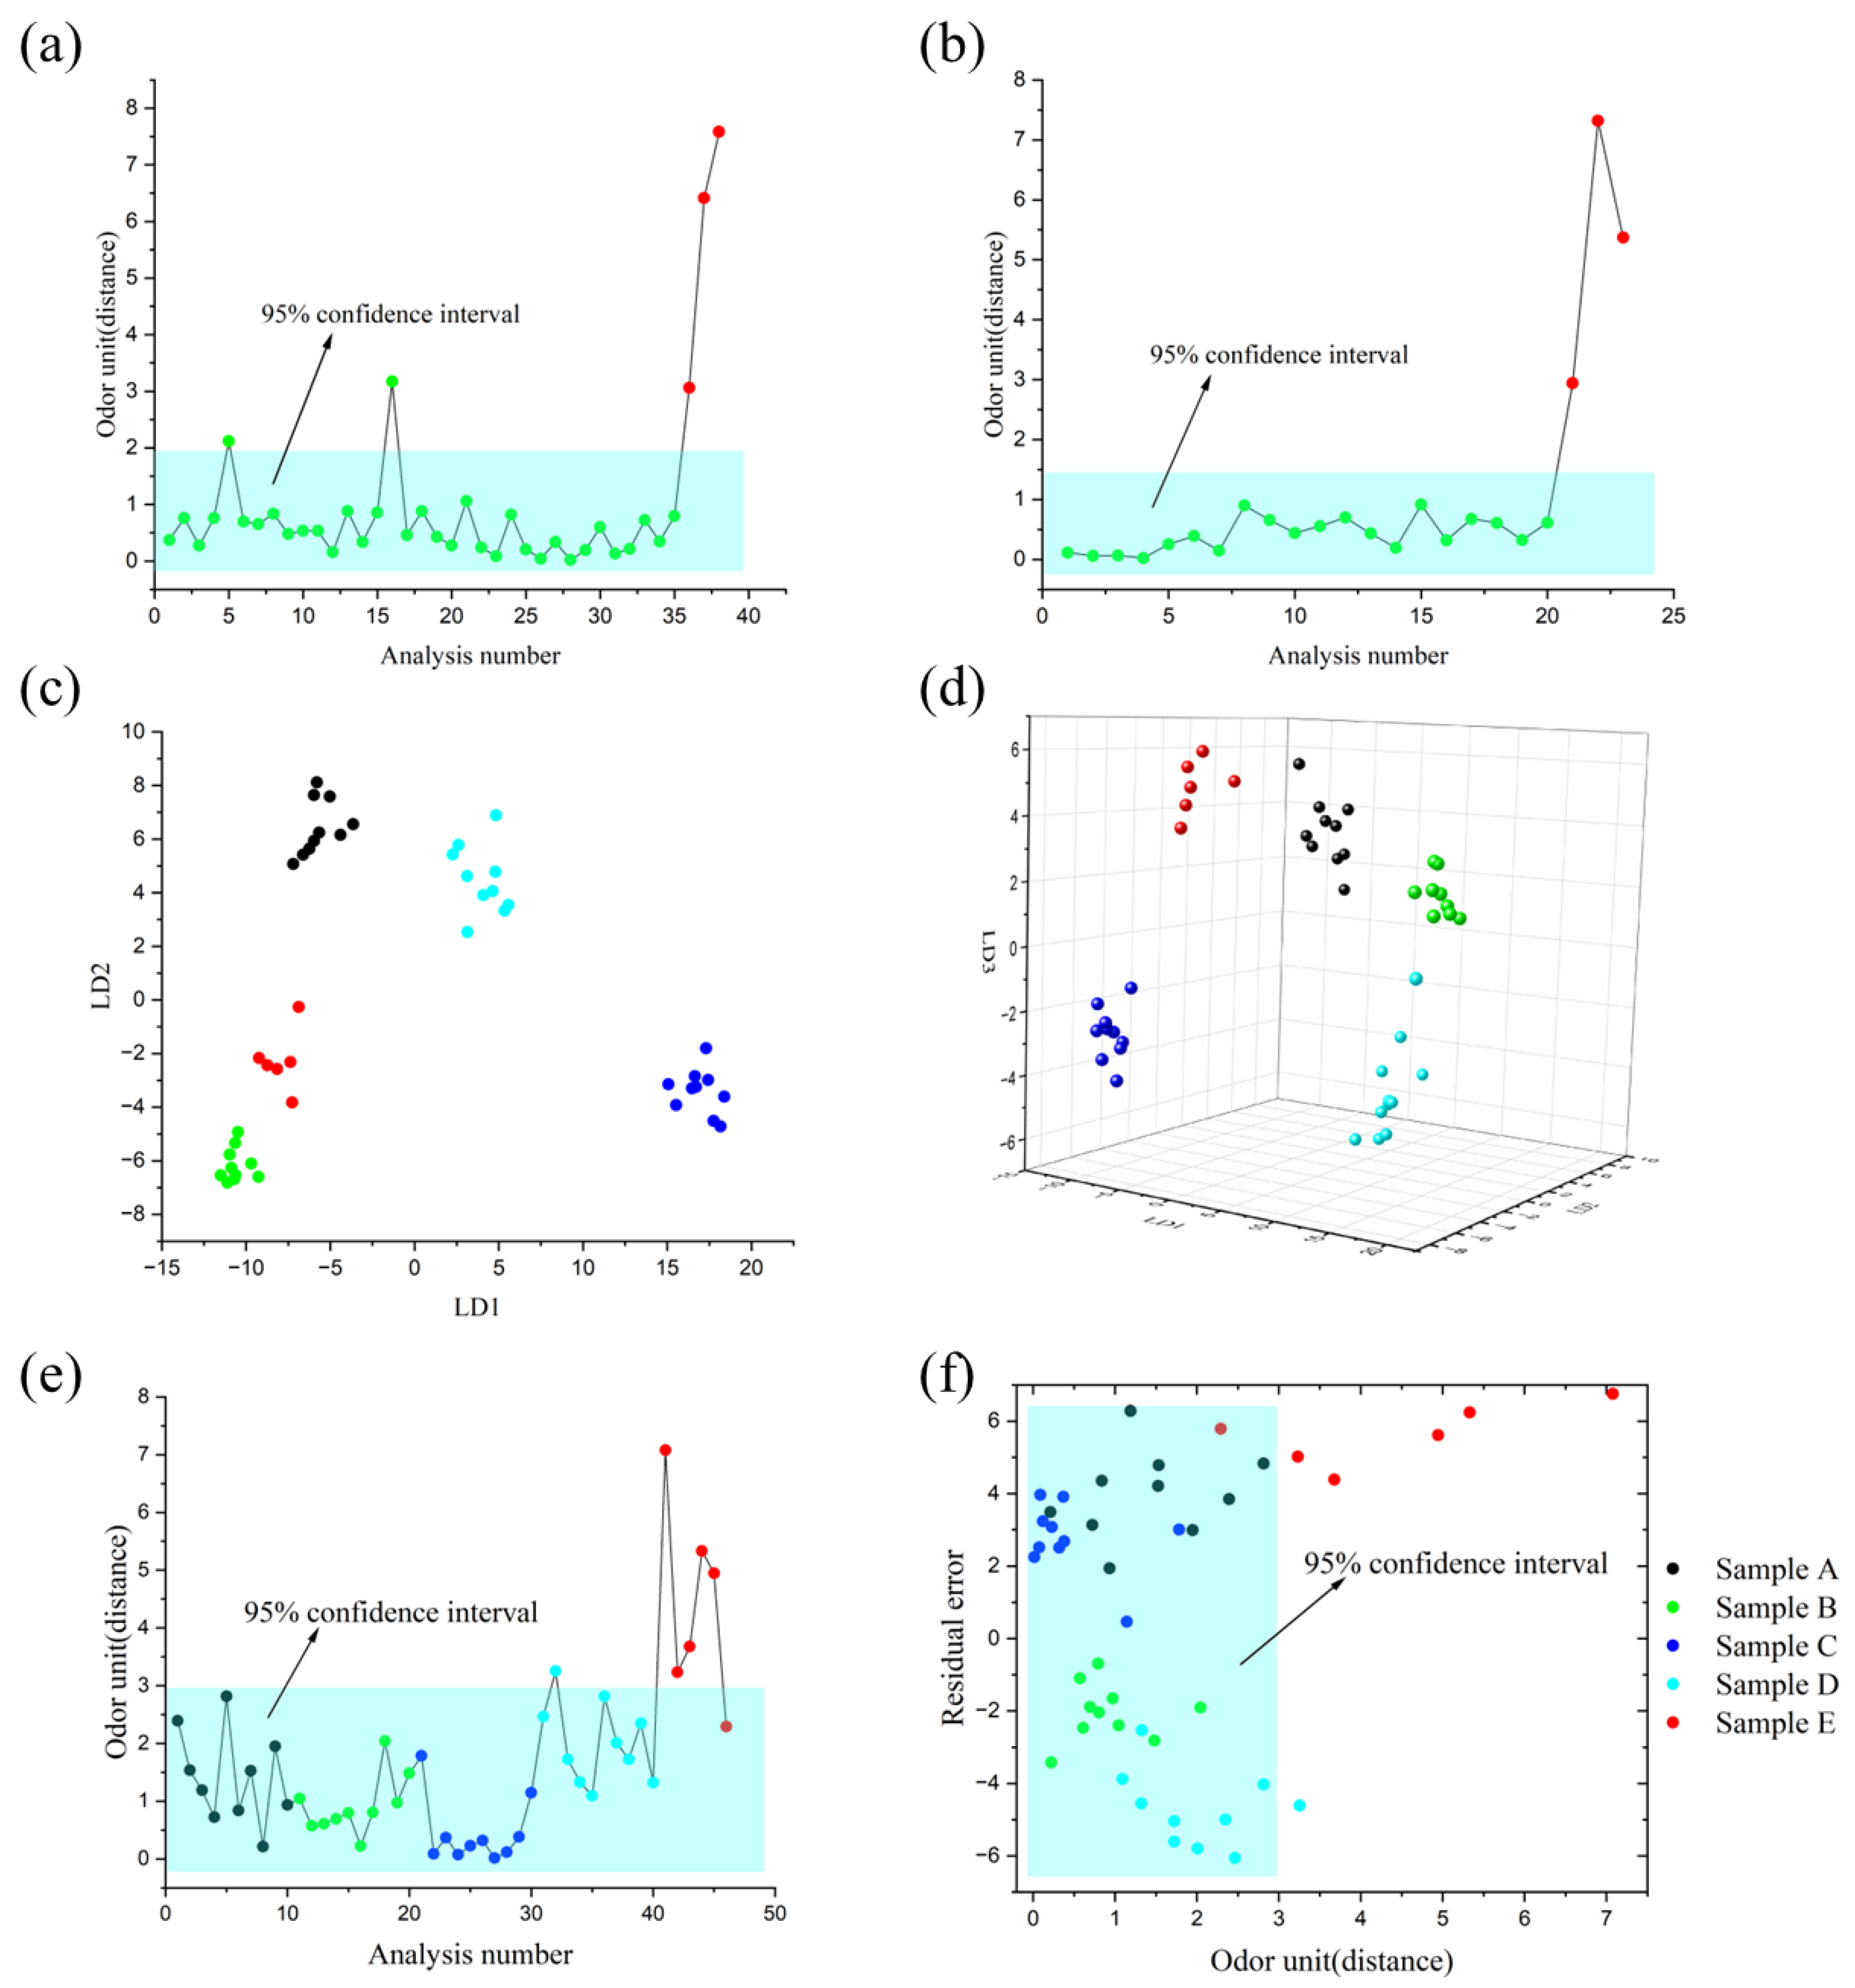
3.3. Evaluation of the Odor Quality Stability of Cigarette Box Packaging Paper
3.4. Box Packaging Paper Quality Stability Discrimination
3.5. Cigarette Box Packaging Paper Odor Classification
4. Conclusions
Supplementary Materials
Author Contributions
Funding
Data Availability Statement
Conflicts of Interest
References
- Statista. Statista Tobacco-Global Market Value 2021–2026. Available online: www.statista.com/forecasts/1098876/tobacco-global-market-value (accessed on 2 March 2024).
- Ghebreyesus t a the Changed Face of the Tobacco Industry. Available online: www.who.int/director-general/speeches/detail/the-changed-face-of-the-tobacco-industry (accessed on 2 March 2023).
- Chinadaily China Intensifies Crackdown on Smuggled, Counterfeit Cigarettes. Available online: http://www.chinadaily.com.cn/business/2017-07/21/content_30201115.htm (accessed on 2 March 2024).
- Chinadaily Chinese Police Bust Counterfeit Cigarette Gang. Available online: http://www.chinadaily.com.cn/china/2016-10/20/content_27122177.htm (accessed on 2 March 2024).
- Cheng, L.; Meng, Q.-H.; Lilienthal, A.J.; Qi, P.-F. Development of compact electronic noses: A review. Meas. Sci. Technol. 2021, 32, 062002. [Google Scholar] [CrossRef]
- Pareek, V.; Chaudhury, S.; Singh, S. Handling non-stationarity in E-nose design: A review. Sens. Rev. 2021, 42, 39–61. [Google Scholar] [CrossRef]
- Wilson, A.D.; Baietto, M. Applications and advances in electronic-nose technologies. Sensors 2009, 9, 5099–5148. [Google Scholar] [CrossRef]
- Ye, Z.; Liu, Y.; Li, Q. Recent progress in smart electronic nose technologies enabled with machine learning methods. Sensors 2021, 21, 7620. [Google Scholar] [CrossRef]
- Guo, W.; Kong, H.; Wu, J.; Gan, F. Odor discrimination by similarity measures of abstract odor factor maps from electronic noses. Sensors 2018, 18, 2658. [Google Scholar] [CrossRef] [PubMed]
- Luo, D.; Hosseini, H.; Stewart, J.R. Application of ANN with extracted parameters from an electronic nose in cigarette brand identification. Sens. Actuators B Chem. 2004, 99, 253–257. [Google Scholar] [CrossRef]
- Wu, Z.; Zhang, H.; Sun, W.; Lu, N.; Yan, M.; Wu, Y.; Hua, Z.; Fan, S. Development of a low-cost portable electronic nose for cigarette brands identification. Sensors 2020, 20, 4239. [Google Scholar] [CrossRef]
- Chen, H.; Huo, D.; Zhang, J. Gas recognition in E-Nose system: A review. IEEE Trans. Biomed. Circuits Syst. 2022, 16, 169–184. [Google Scholar] [CrossRef] [PubMed]
- Esteves, C.H.A.; Iglesias, B.A.; Ogawa, T.; Araki, K.; Hoehne, L.; Gruber, J. Identification of tobacco types and cigarette brands using an electronic nose based on conductive polymer/porphyrin composite sensors. ACS Omega 2018, 3, 6476–6482. [Google Scholar] [CrossRef]
- Brudzewski, K.; Osowski, S.; Golembiecka, A. Differential electronic nose and support vector machine for fast recognition of tobacco. Expert Syst. Appl. 2012, 39, 9886–9891. [Google Scholar] [CrossRef]
- Wei, M.; Liu, X.; Xie, P.; Lei, Y.; Yu, H.; Han, A.; Xie, L.; Jia, H.; Lin, S.; Bai, Y.; et al. Characterization of volatile profiles and correlated contributing compounds in pan-fried steaks from different Chinese yellow cattle breeds through gc-q-orbitrap, e-nose, and sensory evaluation. Molecules 2022, 27, 3593. [Google Scholar] [CrossRef] [PubMed]
- Khan, S.; Alam, M.A.; Ram, N.S.; Mirza, K.; Chowdary, V. Noise reduction of time-series satellite data using various de-noising algorithms. Int. J. Tech. Res. Sci. 2020, 55–69. [Google Scholar] [CrossRef] [PubMed]
- Eo, M.; Han, J.; Rhee, W. Deep learning framework with essential pre-processing techniques for improving mixed-gas concentration prediction. IEEE Access 2023, 11, 25467–25479. [Google Scholar] [CrossRef]
- Li, X.; Guo, J.; Xu, W.; Cao, J. Optimization of the mixed gas detection method based on neural network algorithm. ACS Sensors 2023, 8, 822–828. [Google Scholar] [CrossRef] [PubMed]
- Qian, J.; Lu, M.; Tian, F.; Liu, R. Study on sensor array optimization of medical electronic nose for wound infection detection. IEEE Trans. Circuits Syst. II Express Briefs 2022, 69, 1867–1871. [Google Scholar] [CrossRef]
- Qian, J.; Zhang, A.; Tian, F.; Zhang, Y. A pre-concentration system design for electronic nose via finite element method. IEEE Trans. Circuits Syst. II Express Briefs 2021, 68, 3592–3596. [Google Scholar] [CrossRef]
- Wu, Z.; Tian, F.; Covington, J.A.; Li, H.; Deng, S. Chemical selection for the calibration of general-purpose electronic noses based on Silhouette coefficients. IEEE Trans. Instrum. Meas. 2023, 72, 9500309. [Google Scholar] [CrossRef]
- Qian, J.; Tian, F.; Zhang, S.; Liu, R. A novel conformal design for multi-sensor system synthesis. IEEE Trans. Circuits Syst. II Express Briefs 2021, 68, 1532–1536. [Google Scholar] [CrossRef]
- Qian, J.; Luo, Y.; Tian, F.; Liu, R.; Yang, T. Design of multisensor electronic nose based on conformal sensor chamber. IEEE Trans. Ind. Electron. 2021, 68, 6276–6285. [Google Scholar] [CrossRef]
- Vergara, A.; Llobet, E. Sensor selection and chemo-sensory optimization: Toward an adaptable chemo-sensory system. Front. Neuroeng. 2012, 4, 19. [Google Scholar] [CrossRef]
- Scott, S.M.; James, D.; Ali, Z. Data analysis for electronic nose systems. Microchim. Acta 2006, 156, 183–207. [Google Scholar] [CrossRef]
- Yu, H.; Wang, J.; Xiao, H.; Liu, M. Quality grade identification of green tea using the eigenvalues of PCA based on the E-nose signals. Sens. Actuators B Chem. 2009, 140, 378–382. [Google Scholar] [CrossRef]
- Qiu, S.; Wang, J. The prediction of food additives in the fruit juice based on electronic nose with chemometrics. Food Chem. 2017, 230, 208–214. [Google Scholar] [CrossRef] [PubMed]
- Mirzaee-Ghaleh, E.; Taheri-Garavand, A.; Ayari, F.; Lozano, J. Identification of fresh-chilled and frozen-thawed chicken meat and estimation of their shelf life using an e-nose machine coupled fuzzy knn. Food Anal. Methods 2019, 13, 678–689. [Google Scholar] [CrossRef]
- Schroeder, V.; Evans, E.D.; Wu, Y.M.; Voll, C.A.; McDonald, B.R.; Savagatrup, S.; Swager, T.M. Chemiresistive sensor array and machine learning classification of food. ACS Sens. 2019, 4, 2101–2108. [Google Scholar] [CrossRef] [PubMed]
- Zhao, L.; Qian, J.; Tian, F.; Liu, R.; Liu, B.; Zhang, S.; Lu, M. A weighted discriminative extreme learning machine design for lung cancer detection by an electronic nose system. IEEE Trans. Instrum. Meas. 2021, 70, 2509709. [Google Scholar] [CrossRef]
- Liang, Z.; Xue, Q.; Tian, F.; Xu, C.; Wang, C.; Yang, L.; Guo, T. A sparse reconstruction domain transfer method for interference suppression in artificial olfactory system. IEEE Sens. J. 2022, 22, 6717–6730. [Google Scholar] [CrossRef]
- Liu, R.; Wang, F.; Tian, F.; Qian, J.; Chen, X.; Cui, S.; Yi, L. Mtmi-dcnn: A psr-based method for time series sensor data classification. IEEE Sens. J. 2022, 22, 6806–6817. [Google Scholar] [CrossRef]
- Yan, J.; Guo, X.; Duan, S.; Jia, P.; Wang, L.; Peng, C.; Zhang, S. Electronic nose feature extraction methods: A review. Sensors 2015, 15, 27804–27831. [Google Scholar] [CrossRef]
- Sun, H.; Tian, F.; Liang, Z.; Sun, T.; Yu, B.; Yang, S.X.; He, Q.; Zhang, L.; Liu, X. Sensor array optimization of electronic nose for detection of bacteria in wound infection. IEEE Trans. Ind. Electron. 2017, 64, 7350–7358. [Google Scholar] [CrossRef]
- Abdi, H.; Williams, L.J. Principal component analysis. Wiley Interdiscip. Rev. Comput. Stat. 2010, 2, 433–459. [Google Scholar] [CrossRef]
- Nelson, L.S. Introduction to statistical quality control. J. Qual. Technol. 2018, 19, 233–236. [Google Scholar] [CrossRef]
- Chen, Z.; Harrington, P.d.B. Automatic soft independent modeling for class analogies. Anal. Chim. Acta 2019, 1090, 47–56. [Google Scholar] [CrossRef] [PubMed]


| Feature Number | Source |
|---|---|
| 1 | The 3 min steady-state average value after the sampling stage. |
| 2 | the maximum value at the sampling stage minus the baseline value. |
| 3 | Slope vector during the sampling stage: K = || = 5, the minimum value of K. |
| 4 | Slope vector during the sampling stage: K = || = 5, the maximum value of K. |
| 5 | The steady-state average of the response during the cleaning phase. |
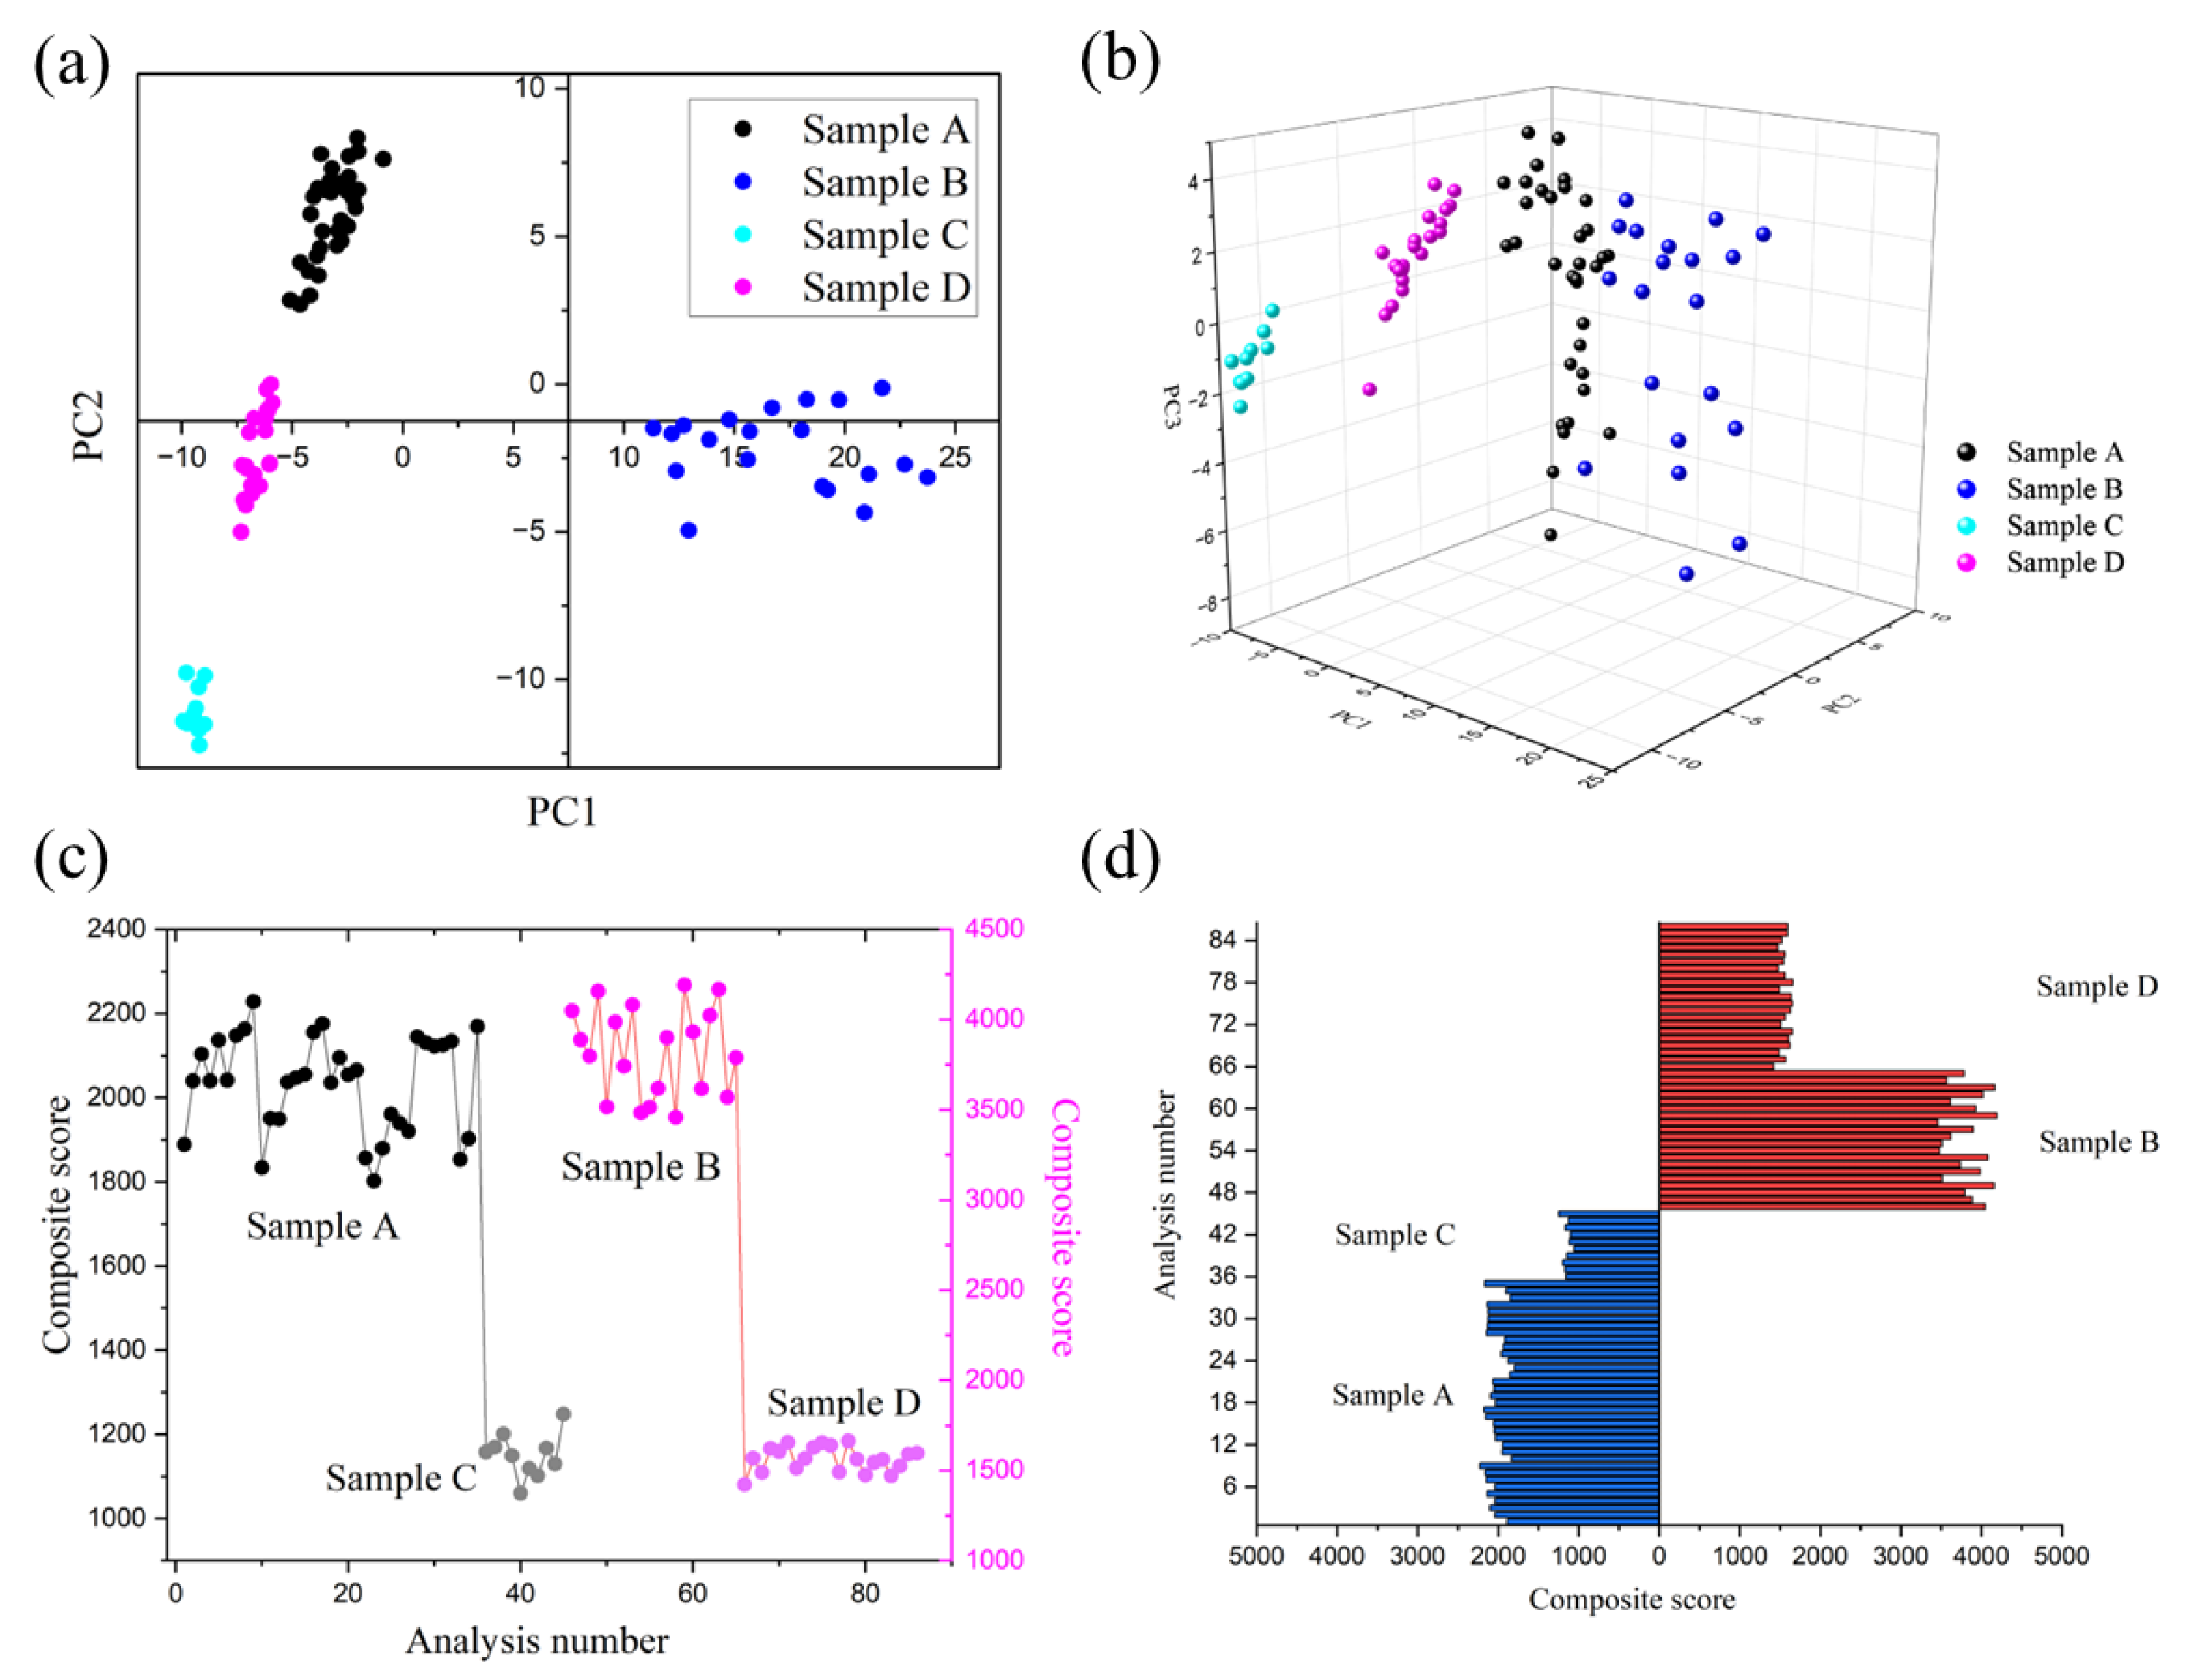
| Sample | RSD |
|---|---|
| A | 0.0566 |
| B | 0.0649 |
| C | 0.0455 |
| D | 0.0440 |
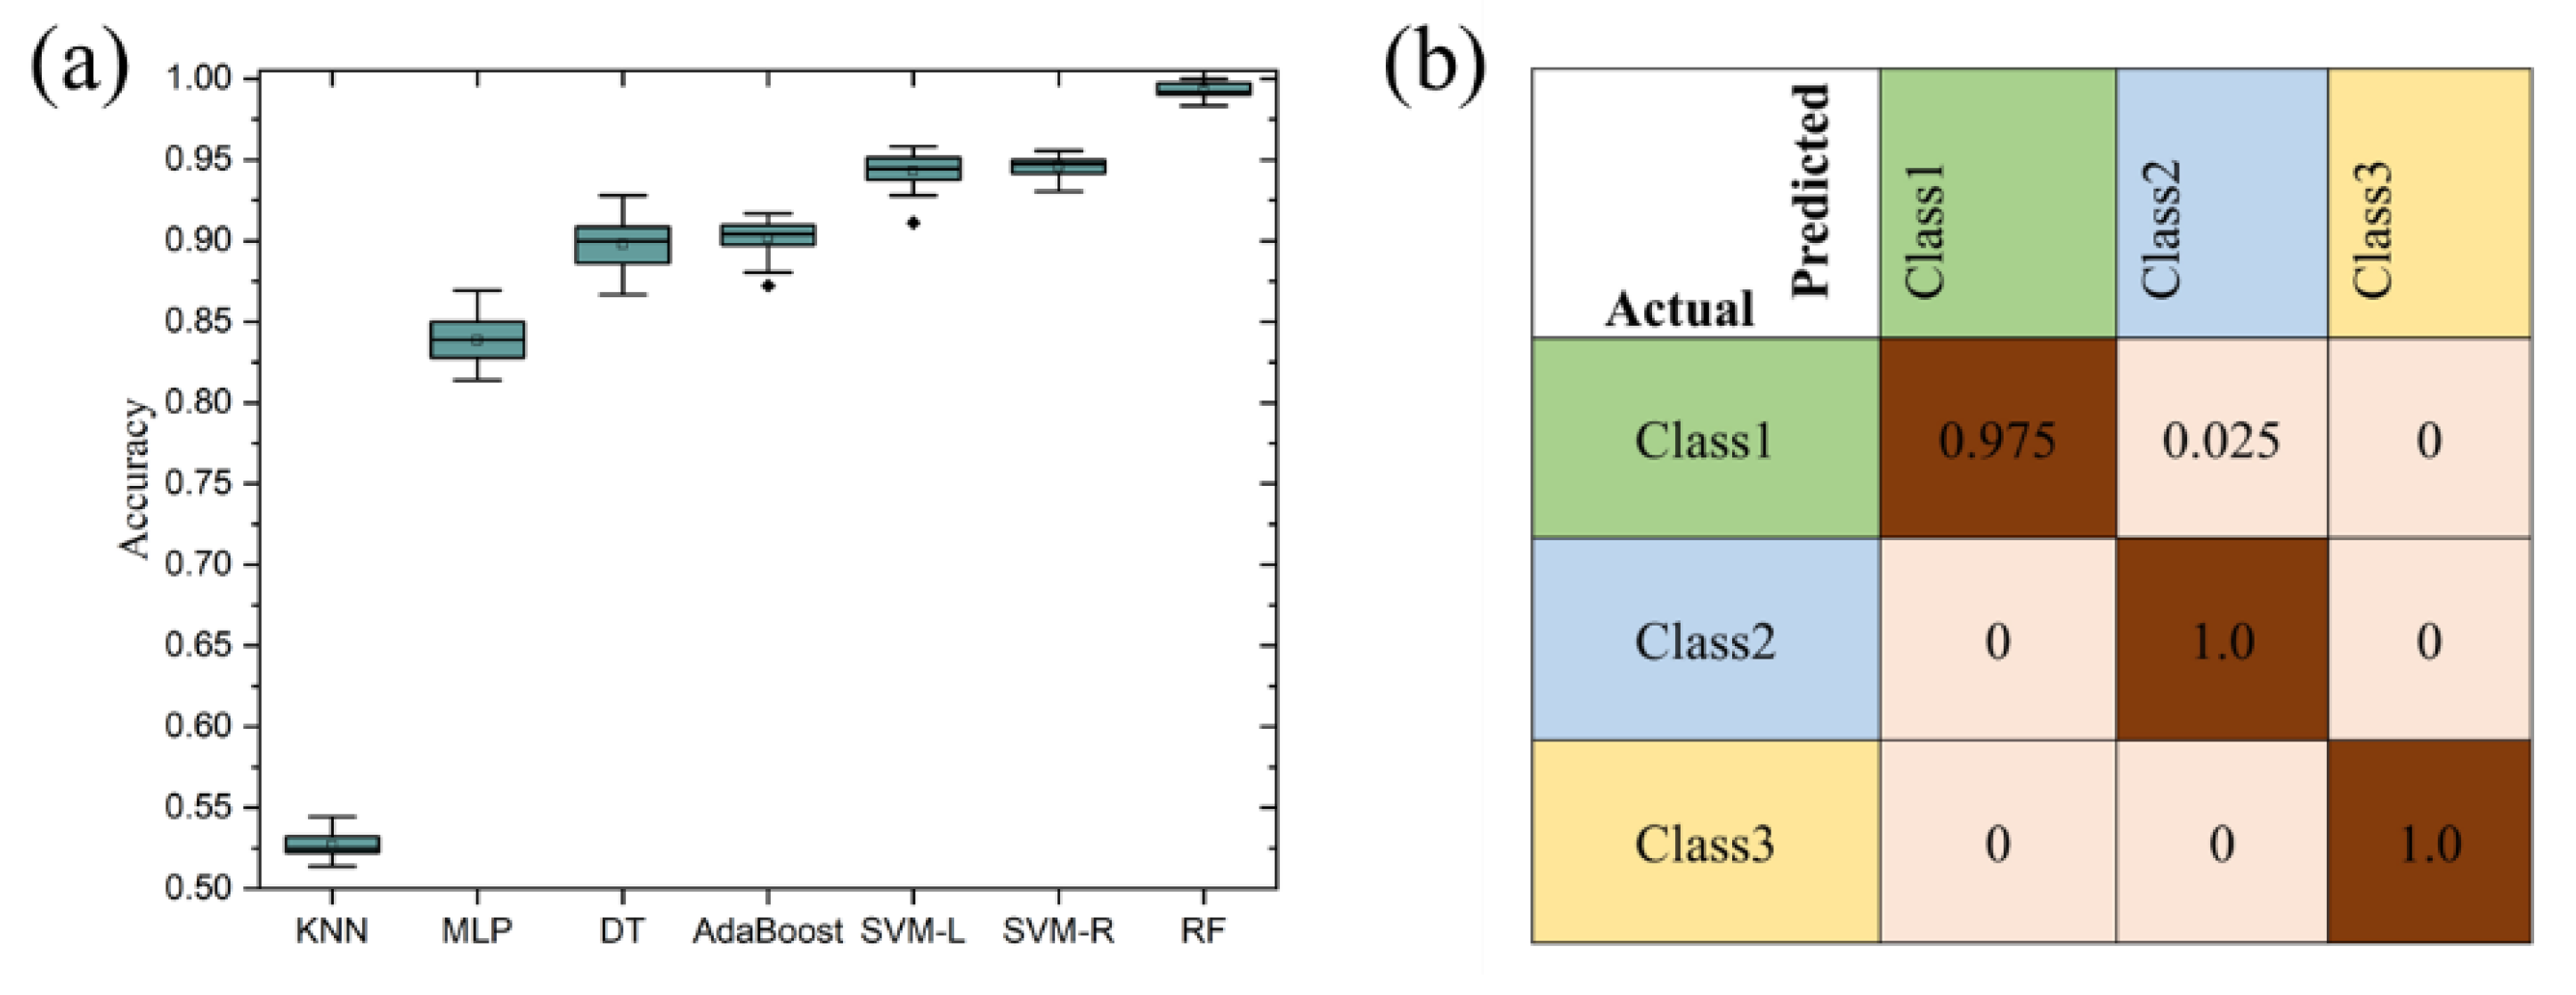
| Classification Algorithm | Accuracy | Precision | Recall | F1 |
|---|---|---|---|---|
| KNNs | 0.5277 | 0.5268 | 0.5261 | 0.4785 |
| MLP | 0.8472 | 0.8502 | 0.8473 | 0.8420 |
| DTs | 0.8952 | 0.8964 | 0.8954 | 0.8907 |
| AdaBoost | 0.9016 | 0.9025 | 0.9013 | 0.8975 |
| SVM-L | 0.9413 | 0.9424 | 0.9413 | 0.9393 |
| SVM-R | 0.9452 | 0.9463 | 0.9464 | 0.9439 |
| RF | 0.9938 | 0.9939 | 0.9936 | 0.9934 |
Disclaimer/Publisher’s Note: The statements, opinions and data contained in all publications are solely those of the individual author(s) and contributor(s) and not of MDPI and/or the editor(s). MDPI and/or the editor(s) disclaim responsibility for any injury to people or property resulting from any ideas, methods, instructions or products referred to in the content. |
© 2024 by the authors. Licensee MDPI, Basel, Switzerland. This article is an open access article distributed under the terms and conditions of the Creative Commons Attribution (CC BY) license (https://creativecommons.org/licenses/by/4.0/).
Share and Cite
Wang, X.; Li, H.; Wang, Y.; Fu, B.; Ai, B. Intelligent Detection and Odor Recognition of Cigarette Packaging Paper Boxes Based on a Homemade Electronic Nose. Micromachines 2024, 15, 458. https://doi.org/10.3390/mi15040458
Wang X, Li H, Wang Y, Fu B, Ai B. Intelligent Detection and Odor Recognition of Cigarette Packaging Paper Boxes Based on a Homemade Electronic Nose. Micromachines. 2024; 15(4):458. https://doi.org/10.3390/mi15040458
Chicago/Turabian StyleWang, Xingguo, Hao Li, Yunlong Wang, Bo Fu, and Bin Ai. 2024. "Intelligent Detection and Odor Recognition of Cigarette Packaging Paper Boxes Based on a Homemade Electronic Nose" Micromachines 15, no. 4: 458. https://doi.org/10.3390/mi15040458
APA StyleWang, X., Li, H., Wang, Y., Fu, B., & Ai, B. (2024). Intelligent Detection and Odor Recognition of Cigarette Packaging Paper Boxes Based on a Homemade Electronic Nose. Micromachines, 15(4), 458. https://doi.org/10.3390/mi15040458