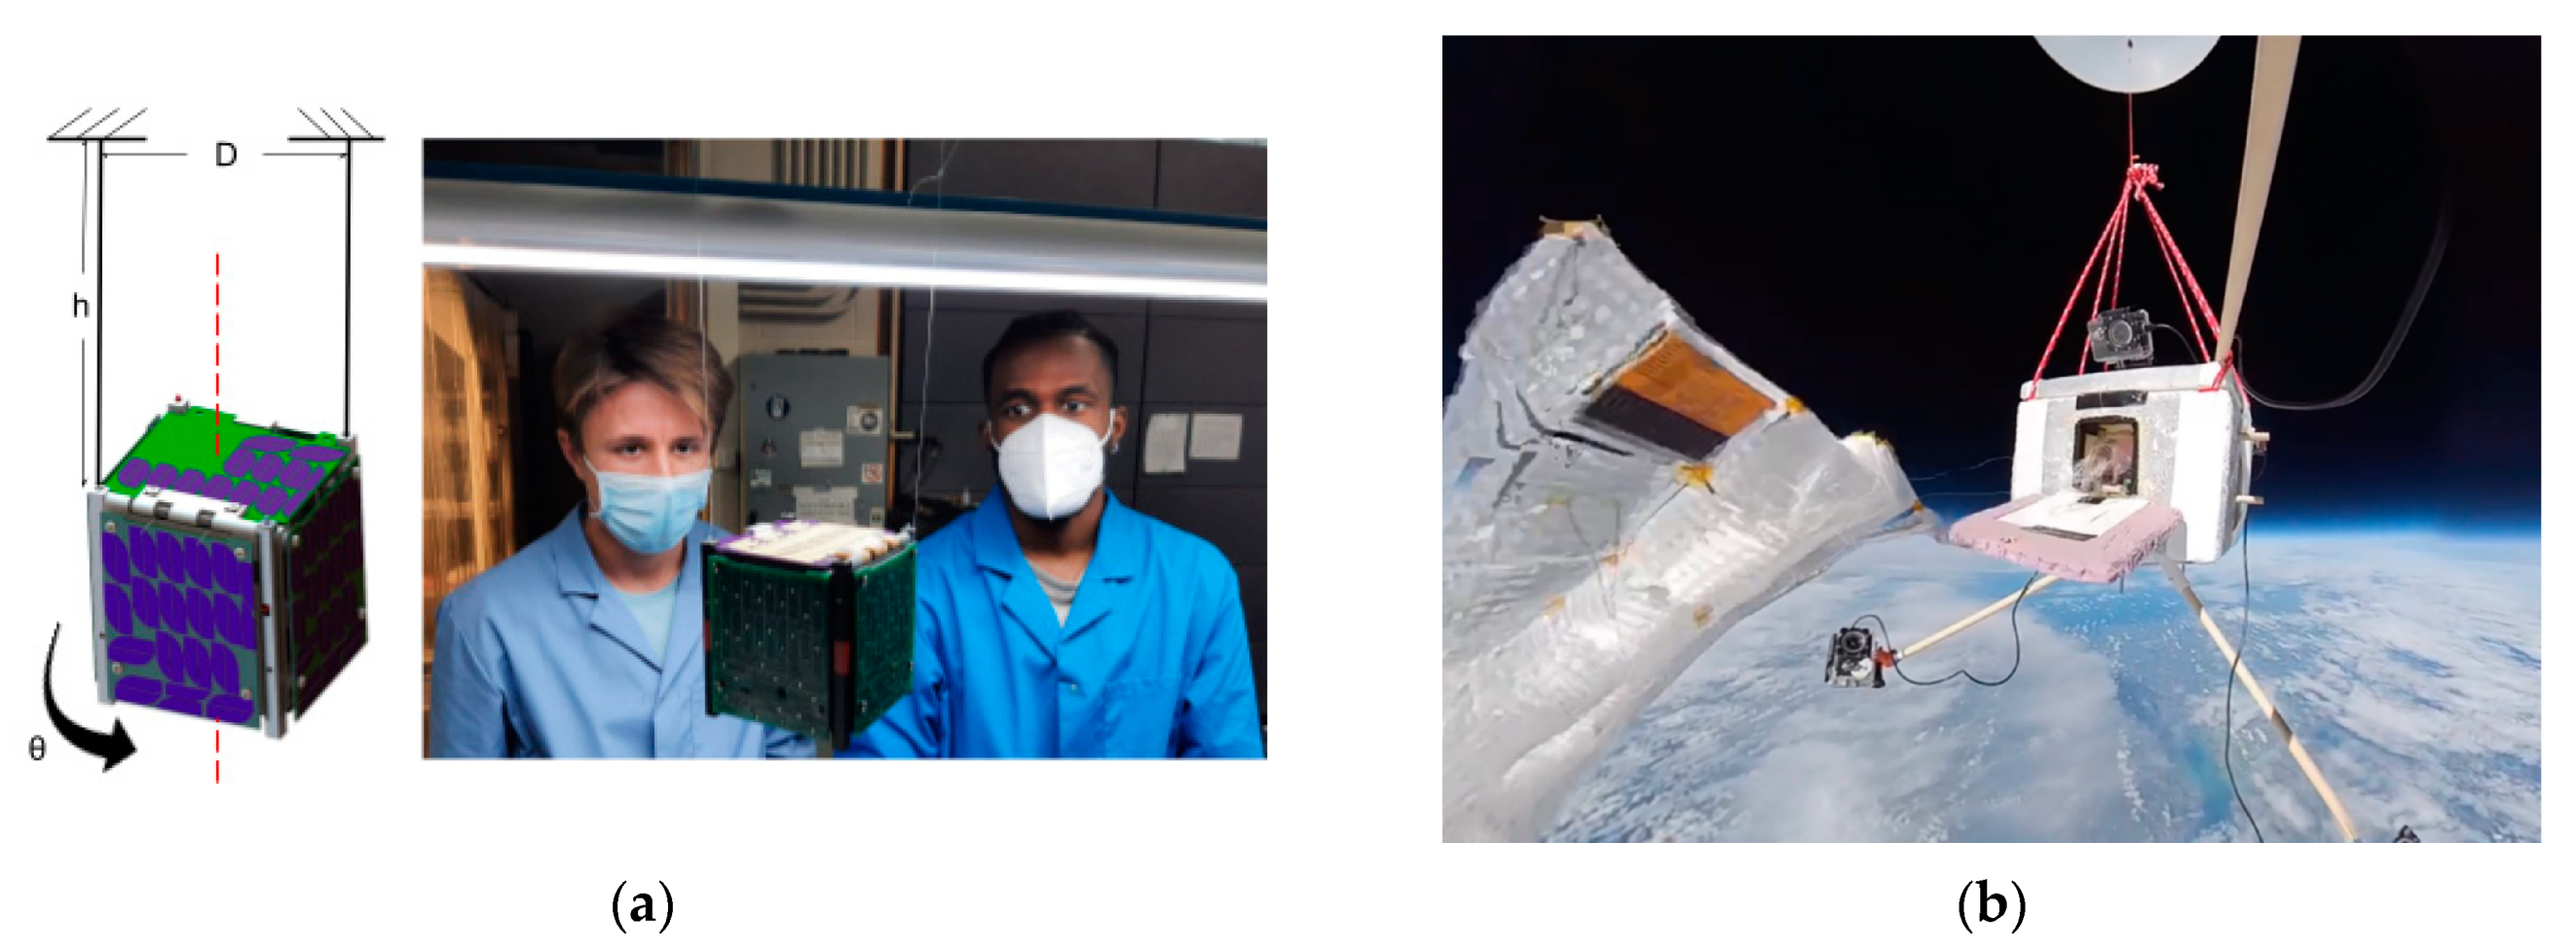
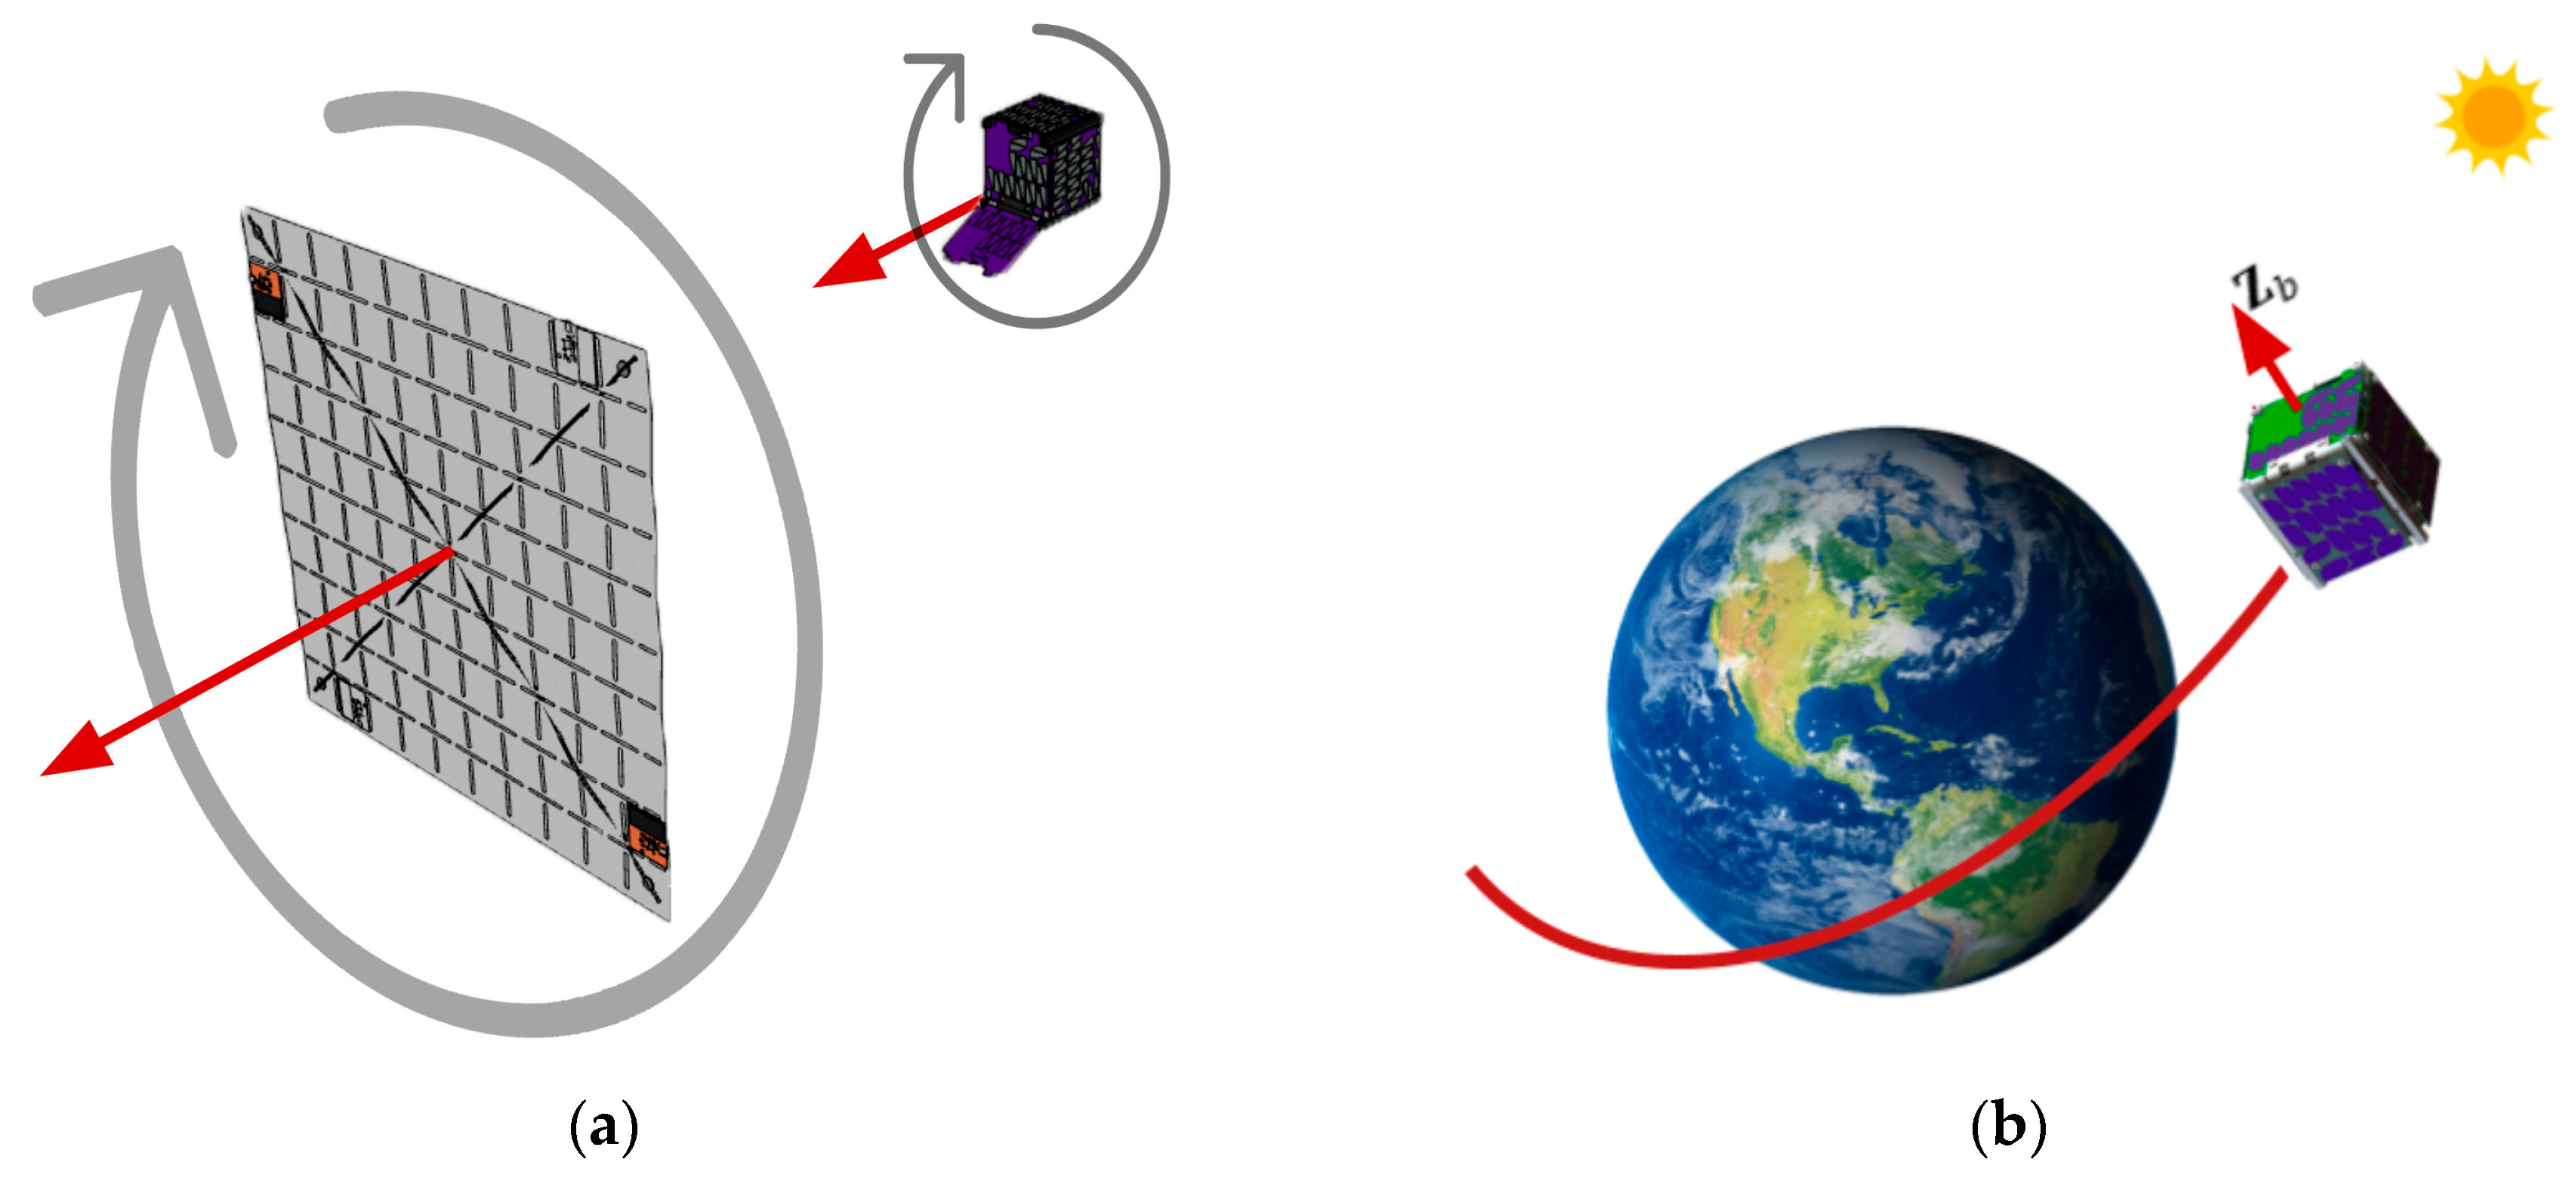
Figure 1.
(a) Moment of inertia testing for CubeSat attitude control system development; (b) balloon test to validate ChipSat long-range radio frequency capabilities.
Figure 1.
(a) Moment of inertia testing for CubeSat attitude control system development; (b) balloon test to validate ChipSat long-range radio frequency capabilities.
Figure 2.
The systems engineering “Vee Diagram”.
Figure 2.
The systems engineering “Vee Diagram”.
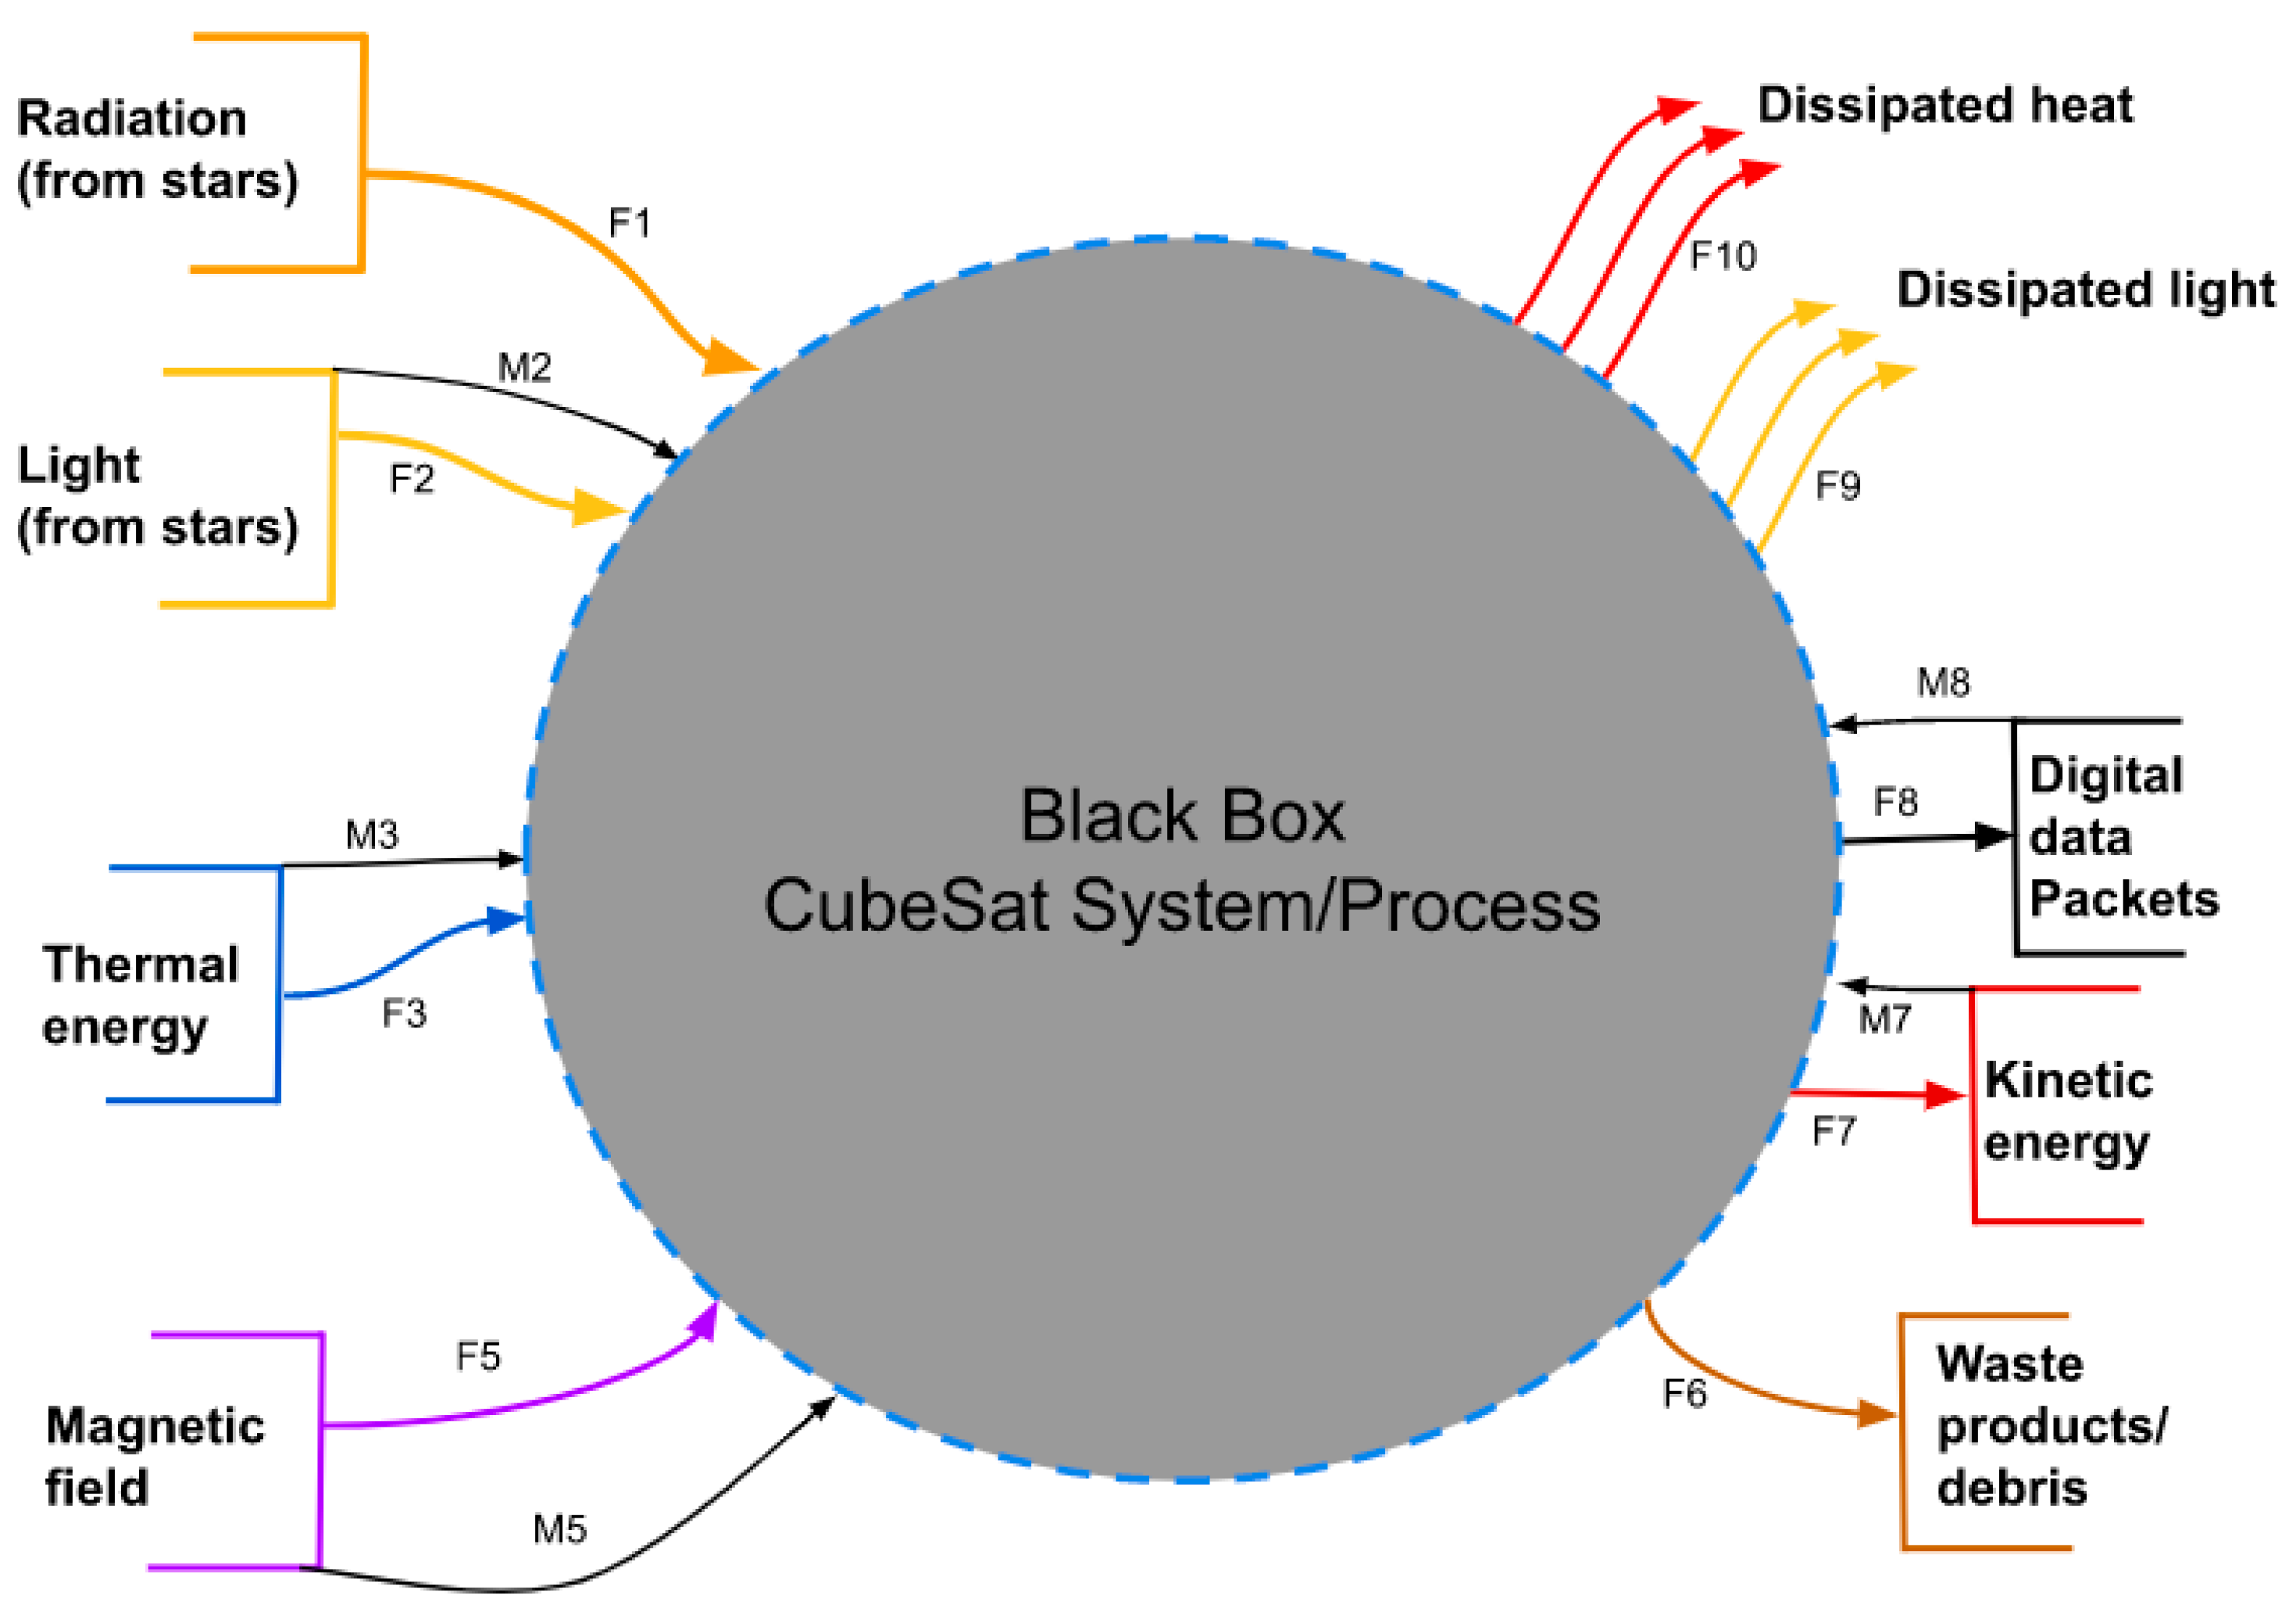
Figure 3.
Black box diagram (George E. Mobus and Michael C. Kalton, p. 604 [
33]).
Figure 3.
Black box diagram (George E. Mobus and Michael C. Kalton, p. 604 [
33]).
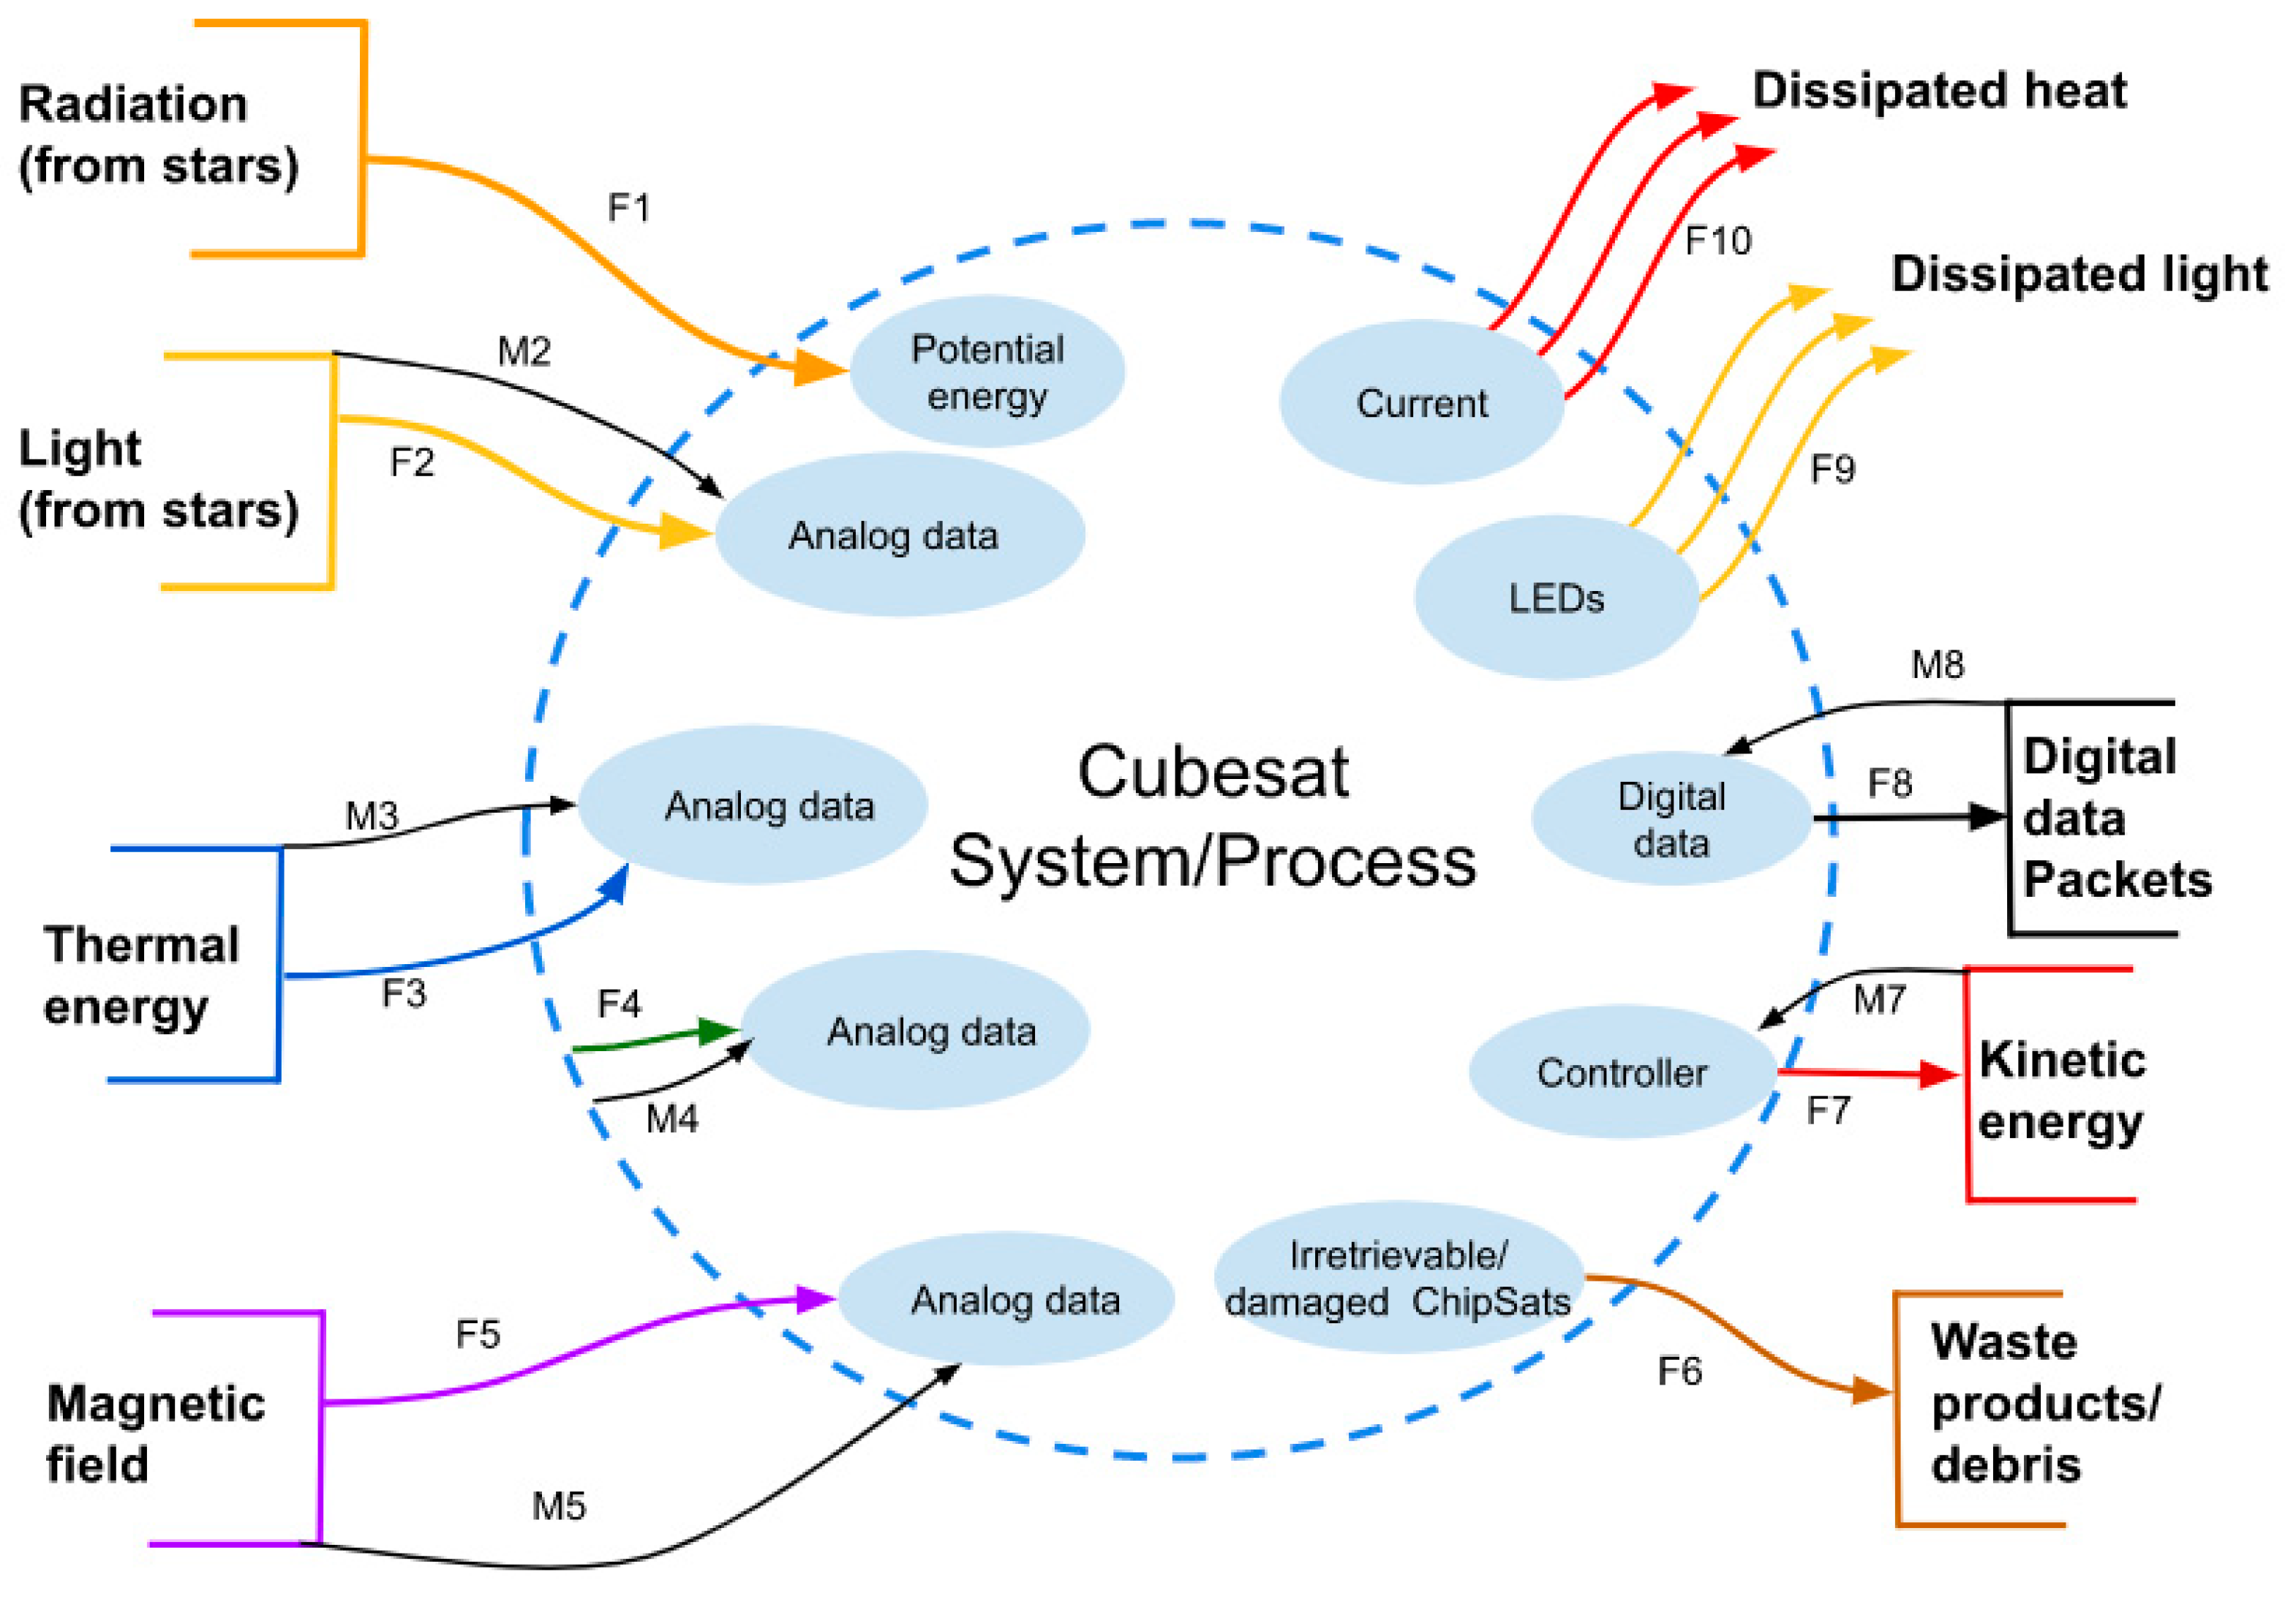
Figure 4.
Subsystem black box diagram (George E. Mobus Michael C. Kalton, p. 607 [
33]).
Figure 4.
Subsystem black box diagram (George E. Mobus Michael C. Kalton, p. 607 [
33]).
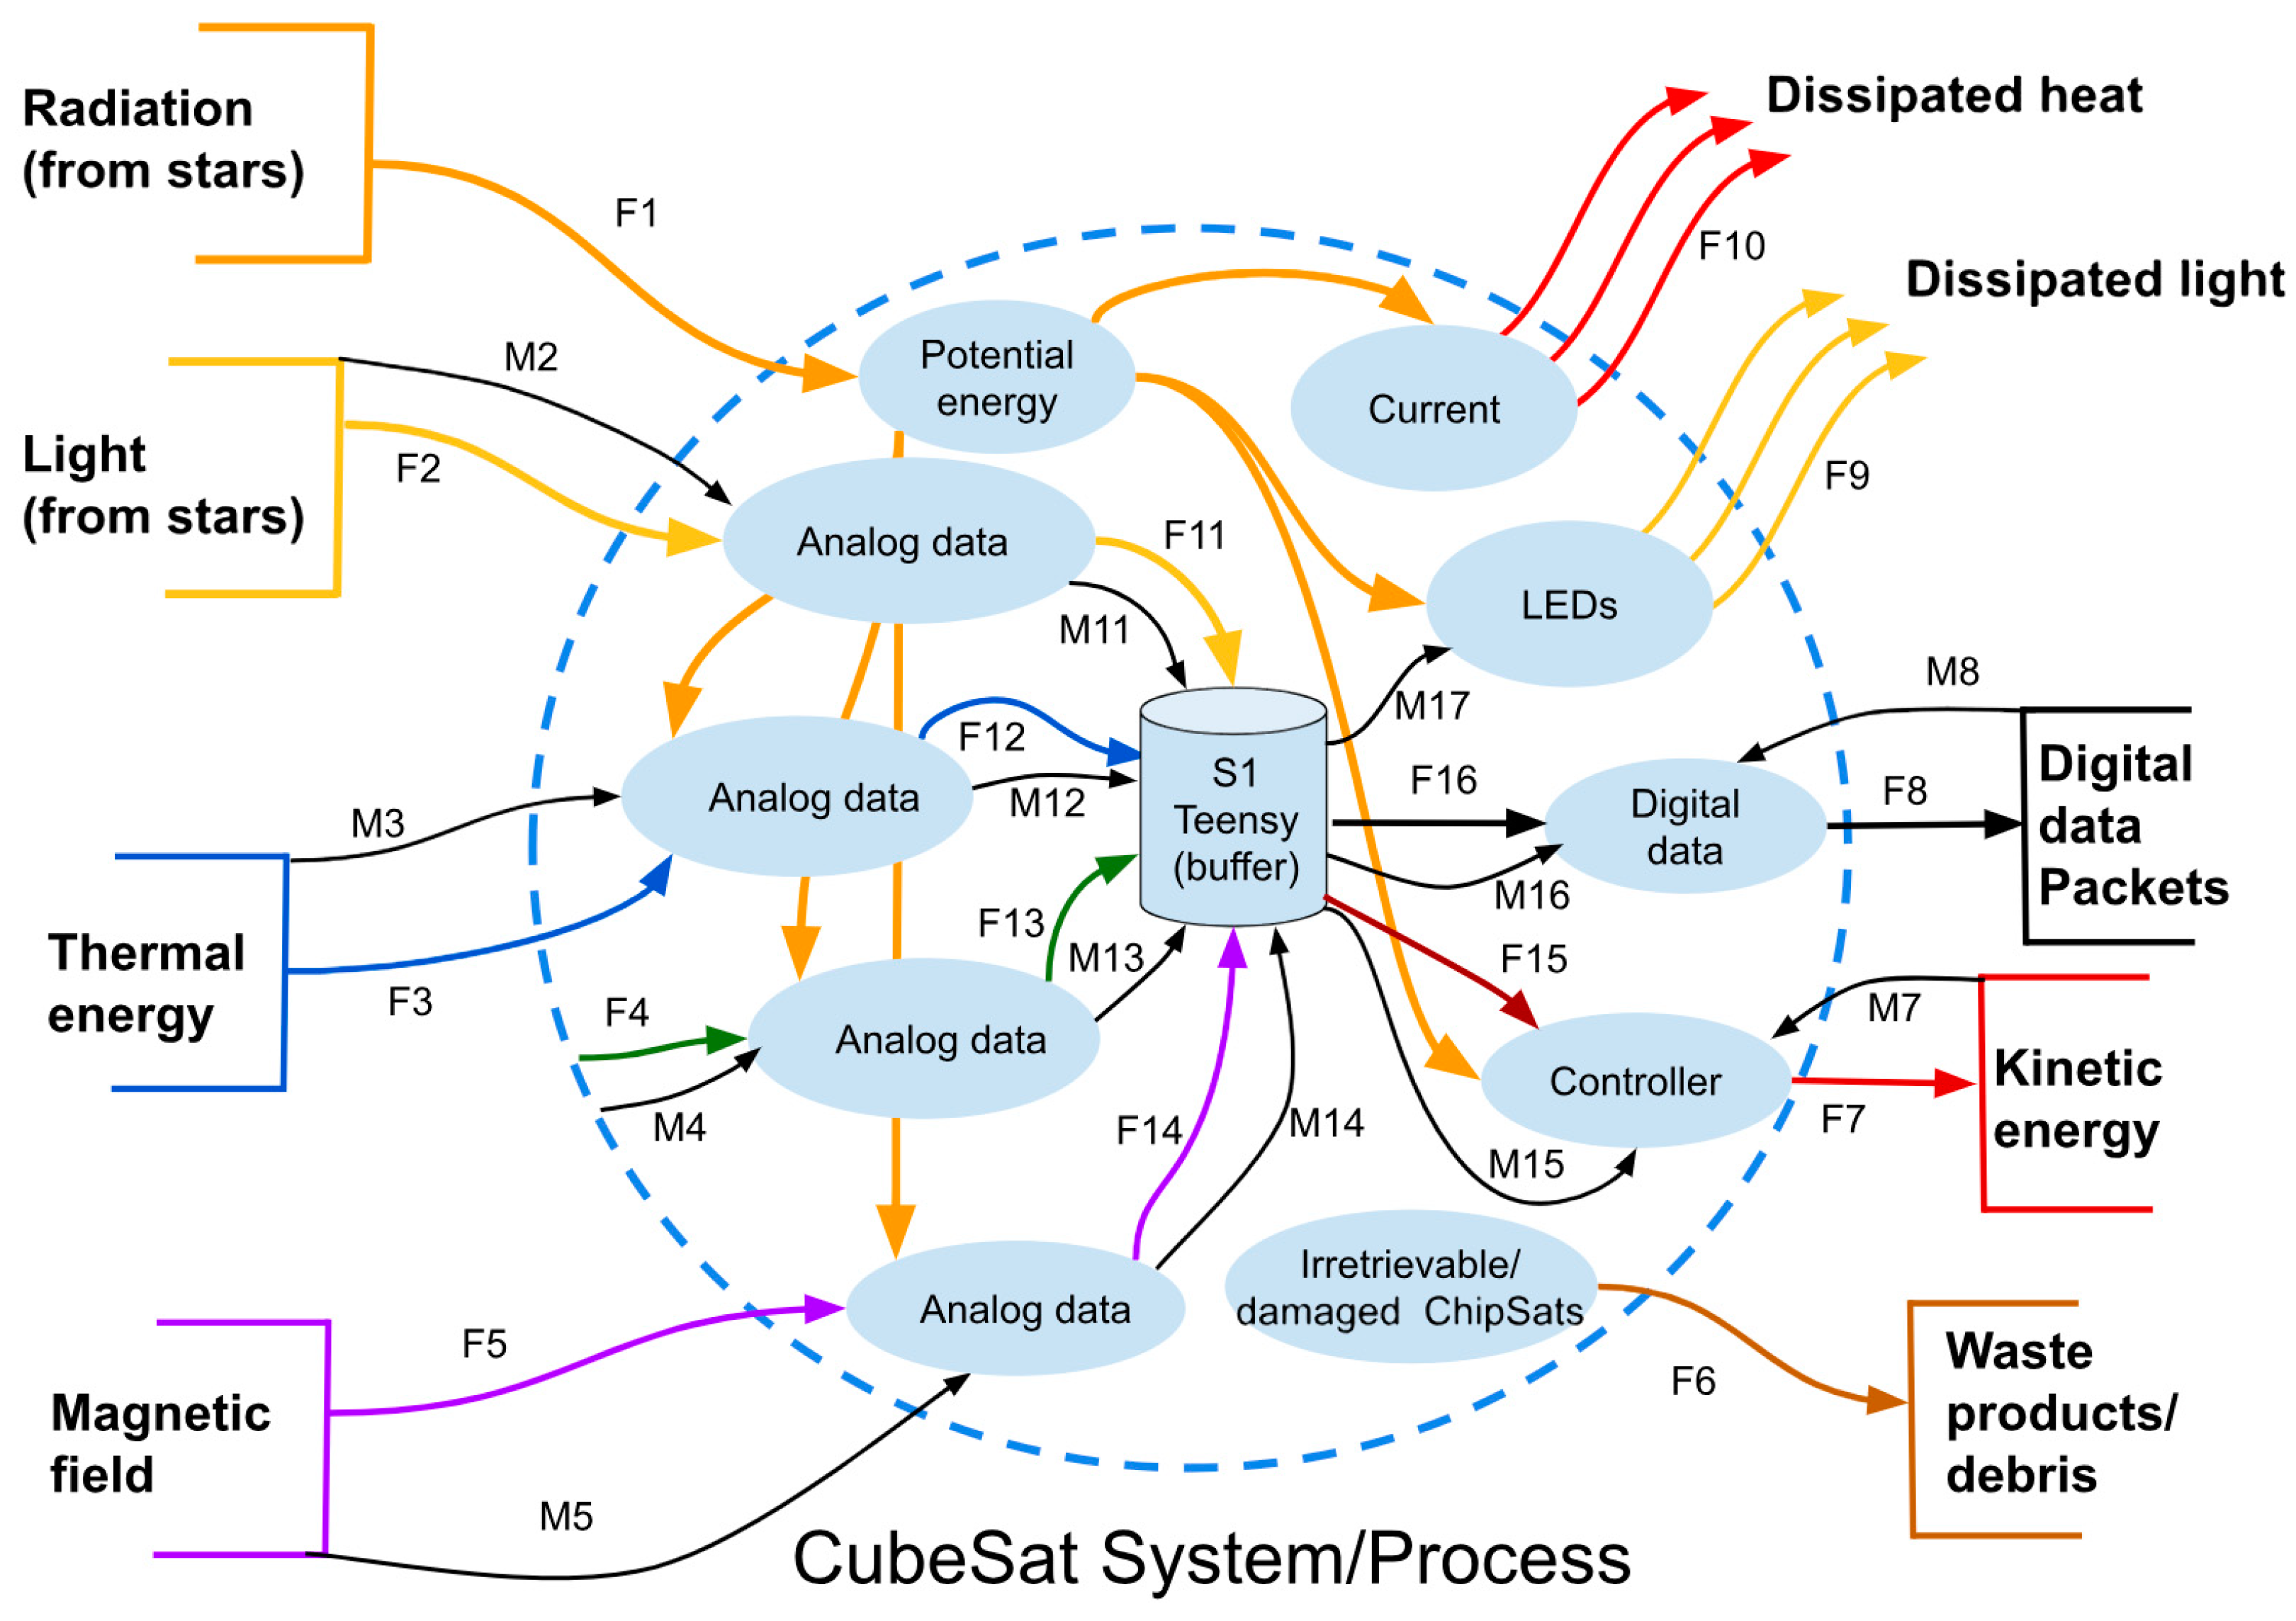
Figure 5.
Process diagram (George E. Mobus Michael C. Kalton, p. 609 [
33]).
Figure 5.
Process diagram (George E. Mobus Michael C. Kalton, p. 609 [
33]).
Figure 6.
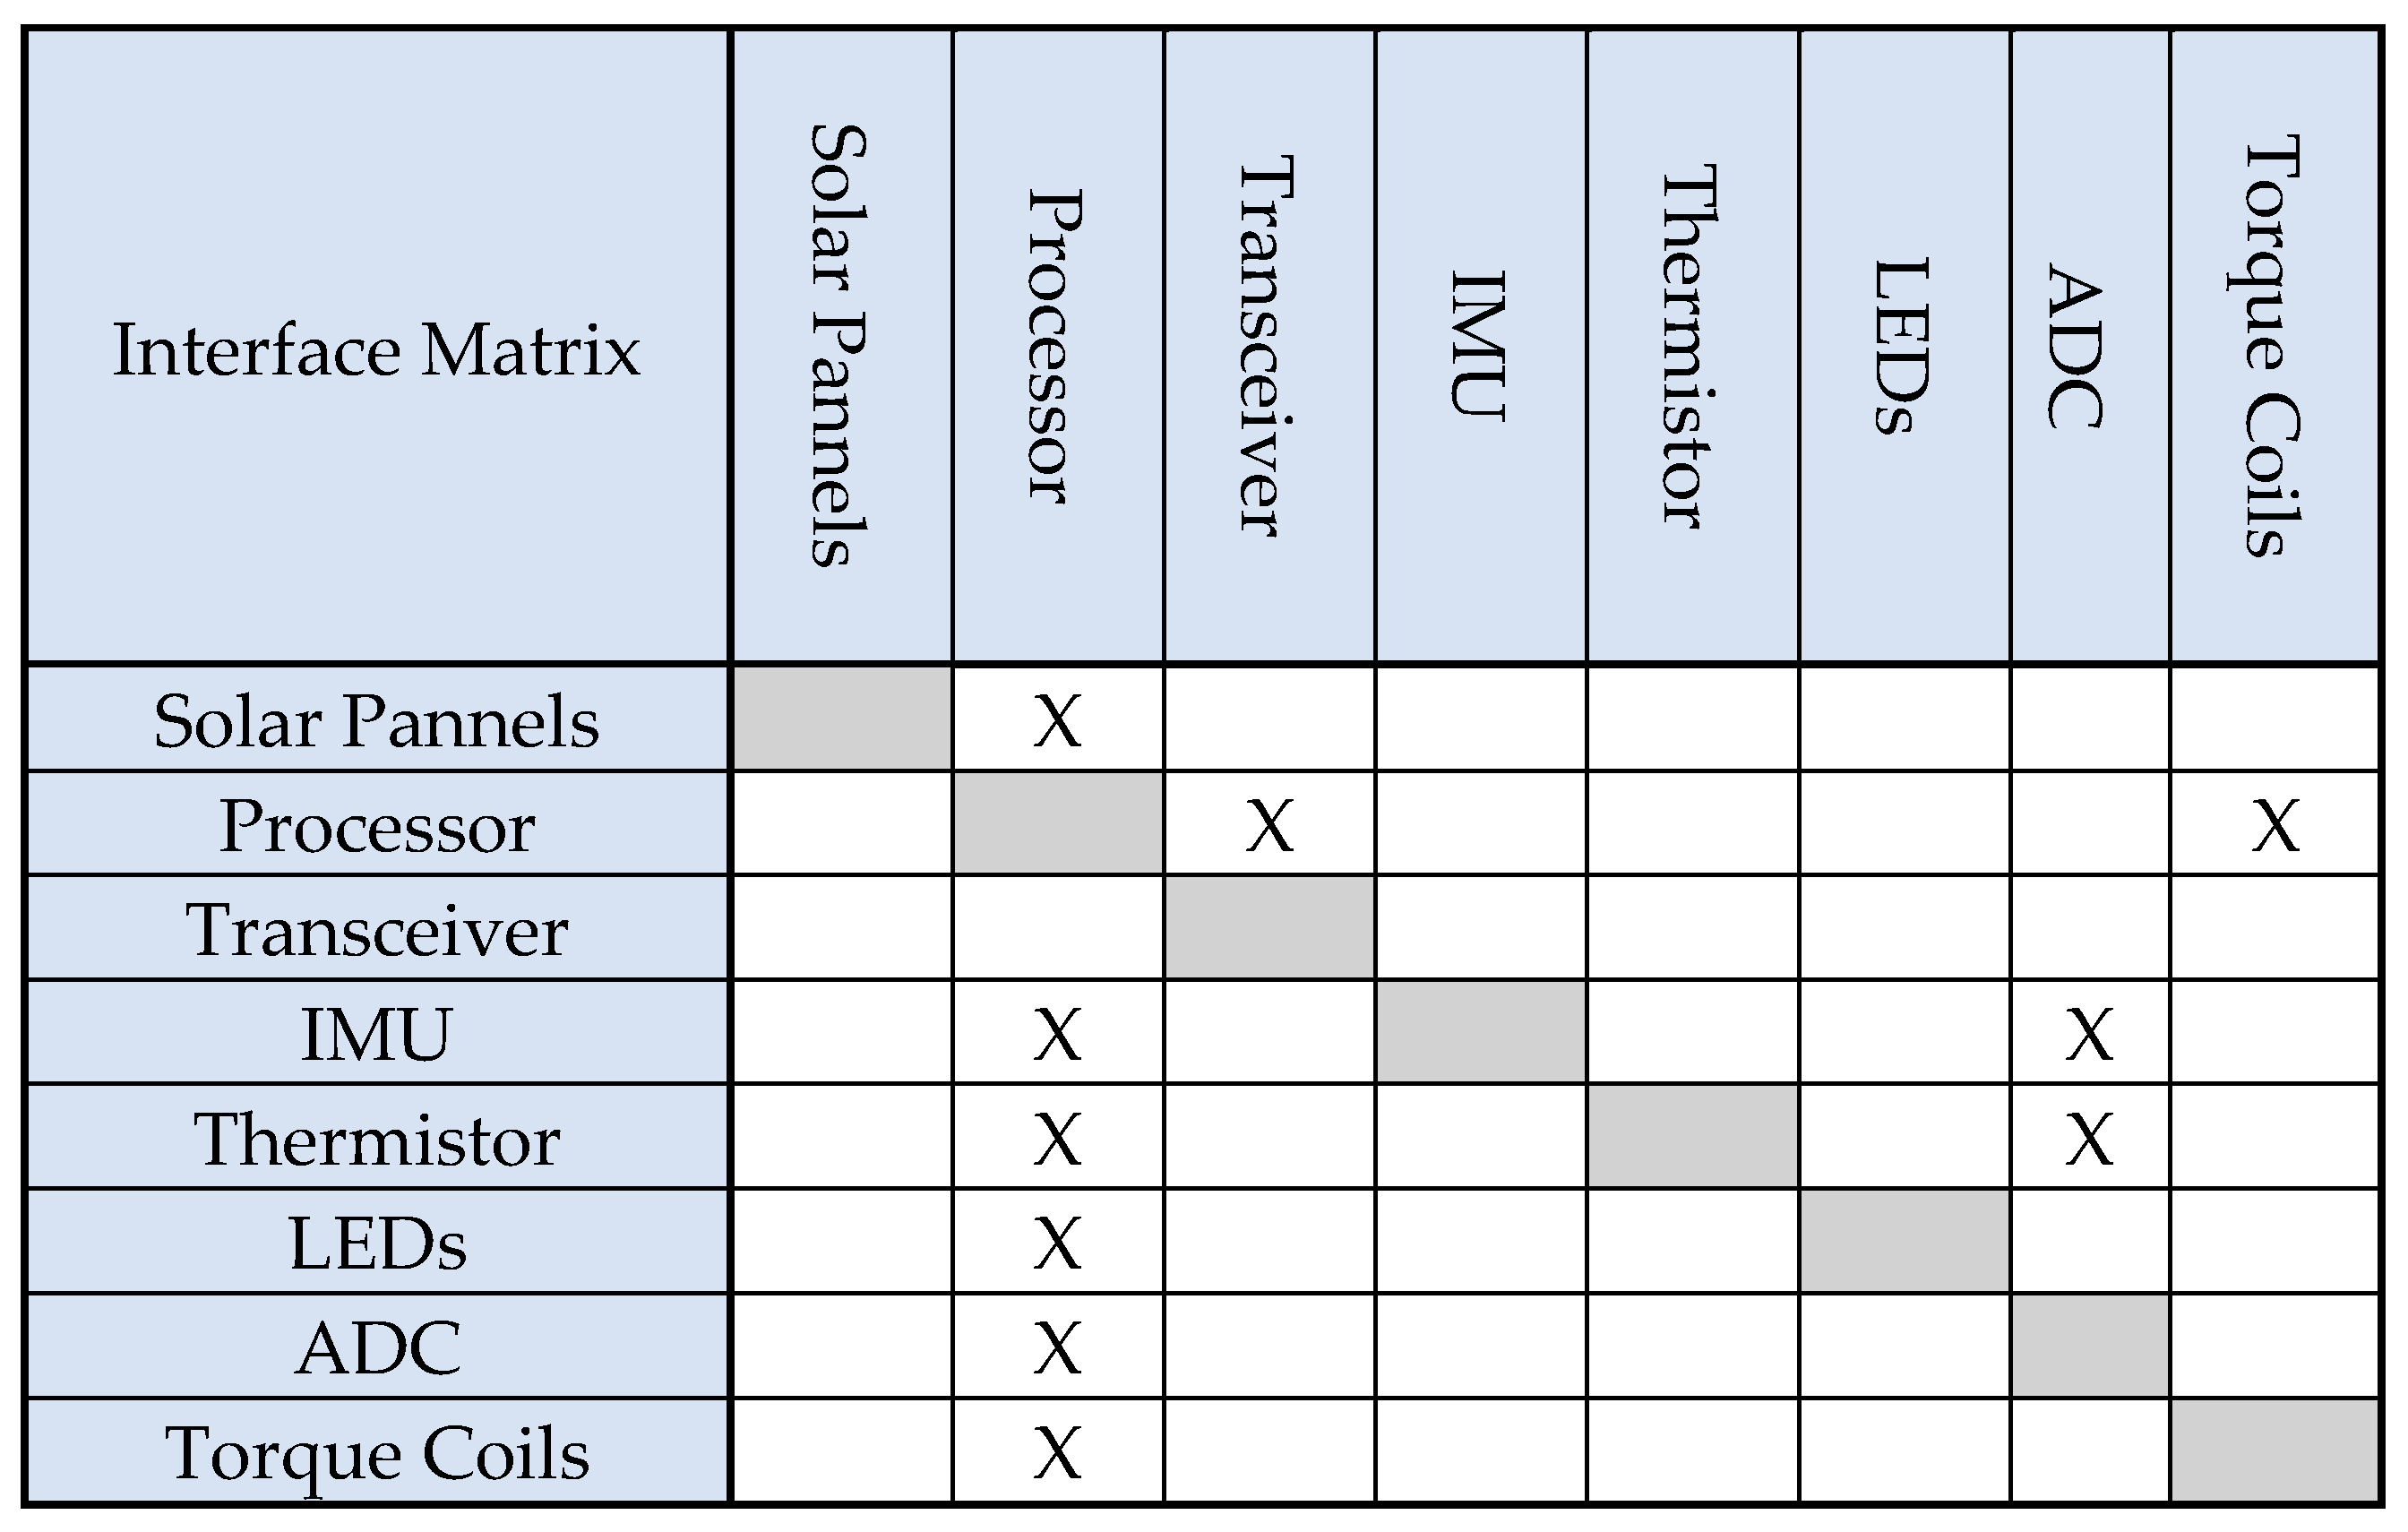
Interface matrix.
Figure 6.
Interface matrix.
Figure 7.
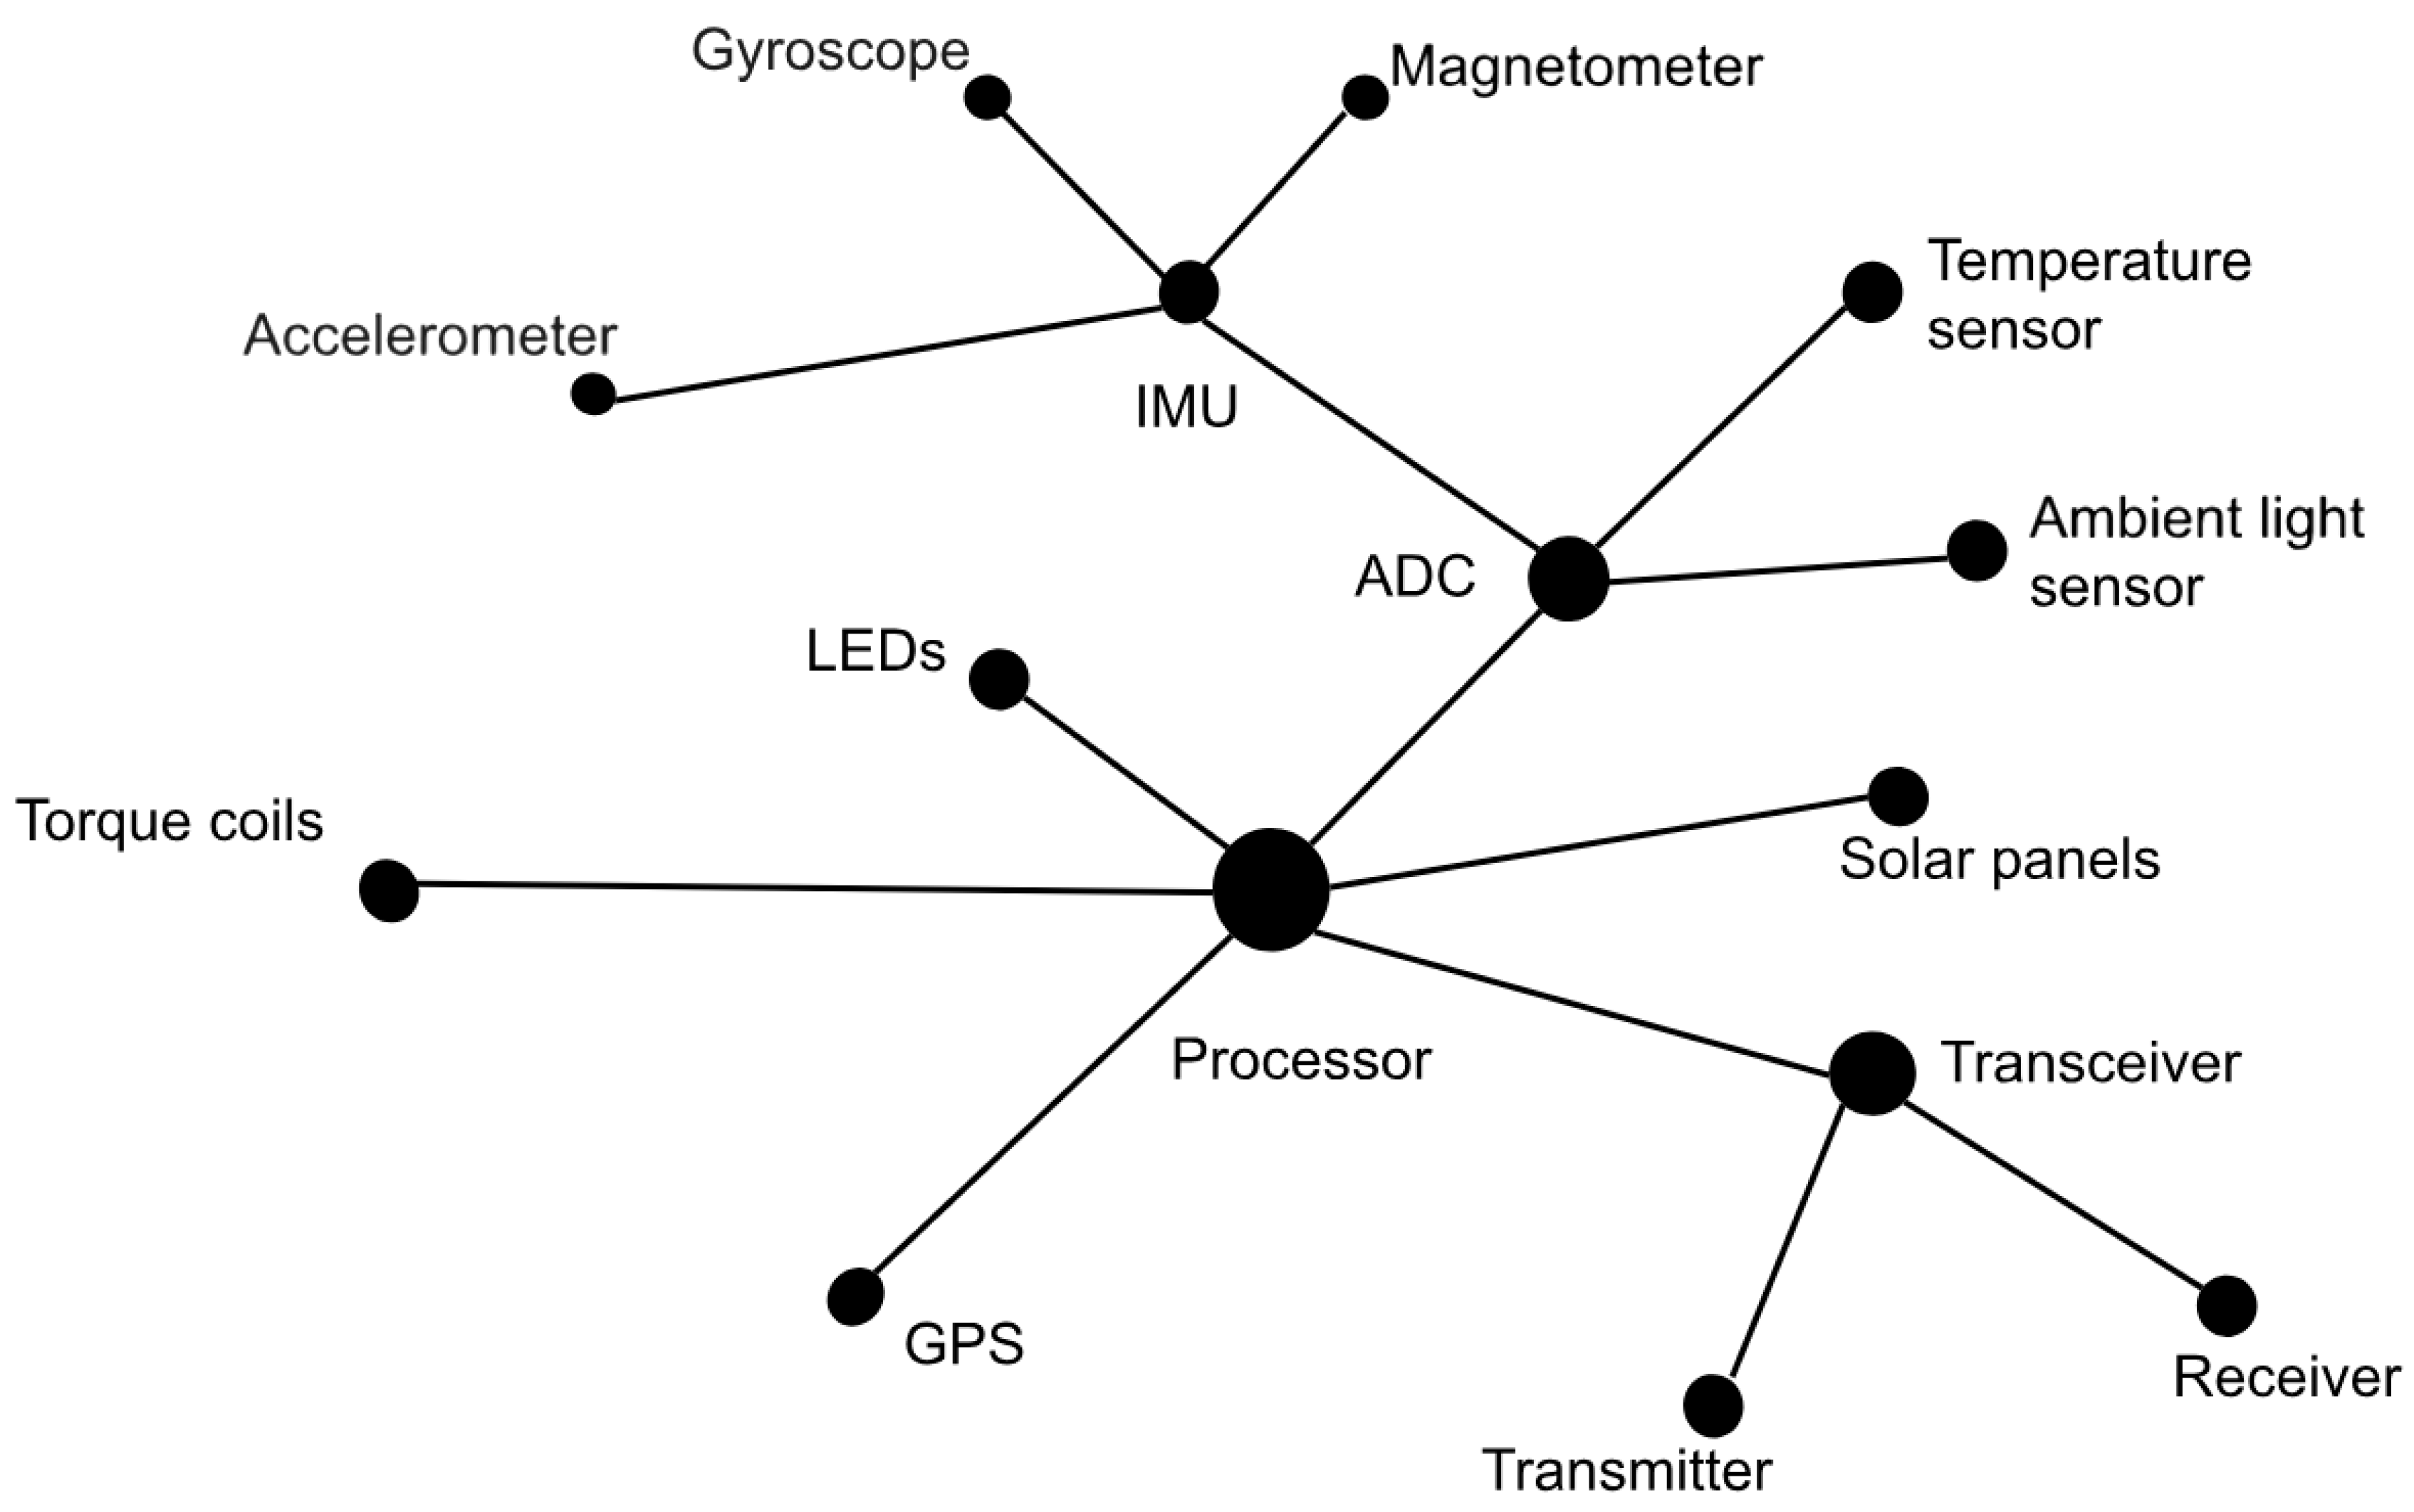
Network diagram.
Figure 7.
Network diagram.
Figure 8.
Full network diagram.
Figure 8.
Full network diagram.
Figure 9.
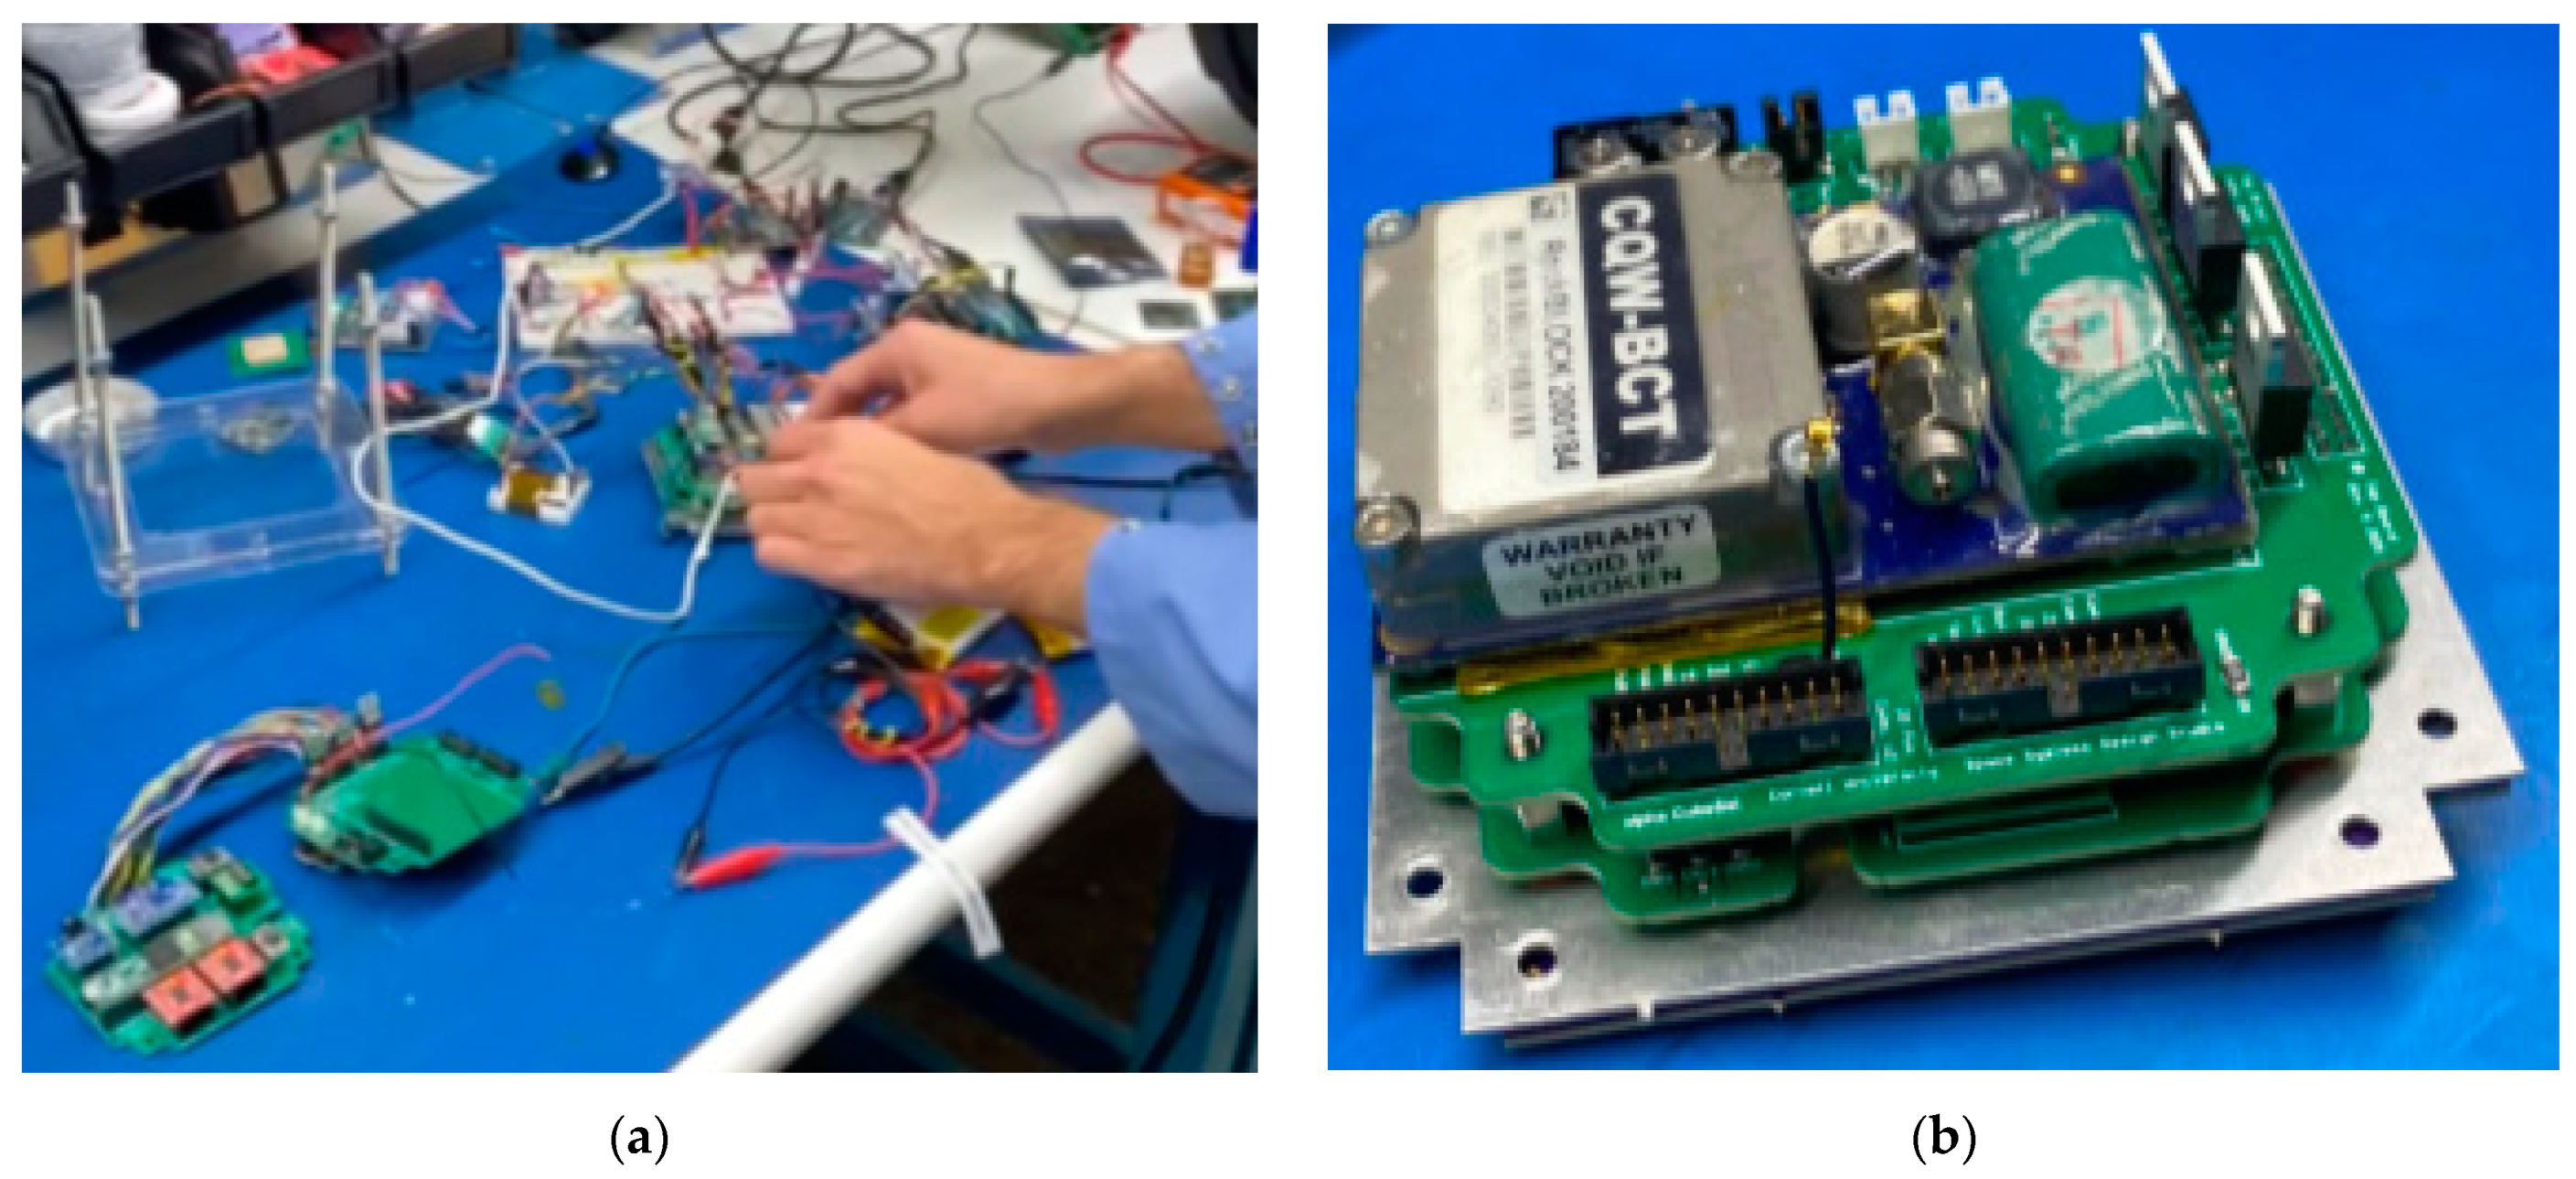
(a) Integration testing flight hardware; (b) flight-ready electronics aboard the CubeSat.
Figure 9.
(a) Integration testing flight hardware; (b) flight-ready electronics aboard the CubeSat.
Figure 10.
Connecting to TI launchpads on SmartRF Studio 7.
Figure 10.
Connecting to TI launchpads on SmartRF Studio 7.
Figure 11.
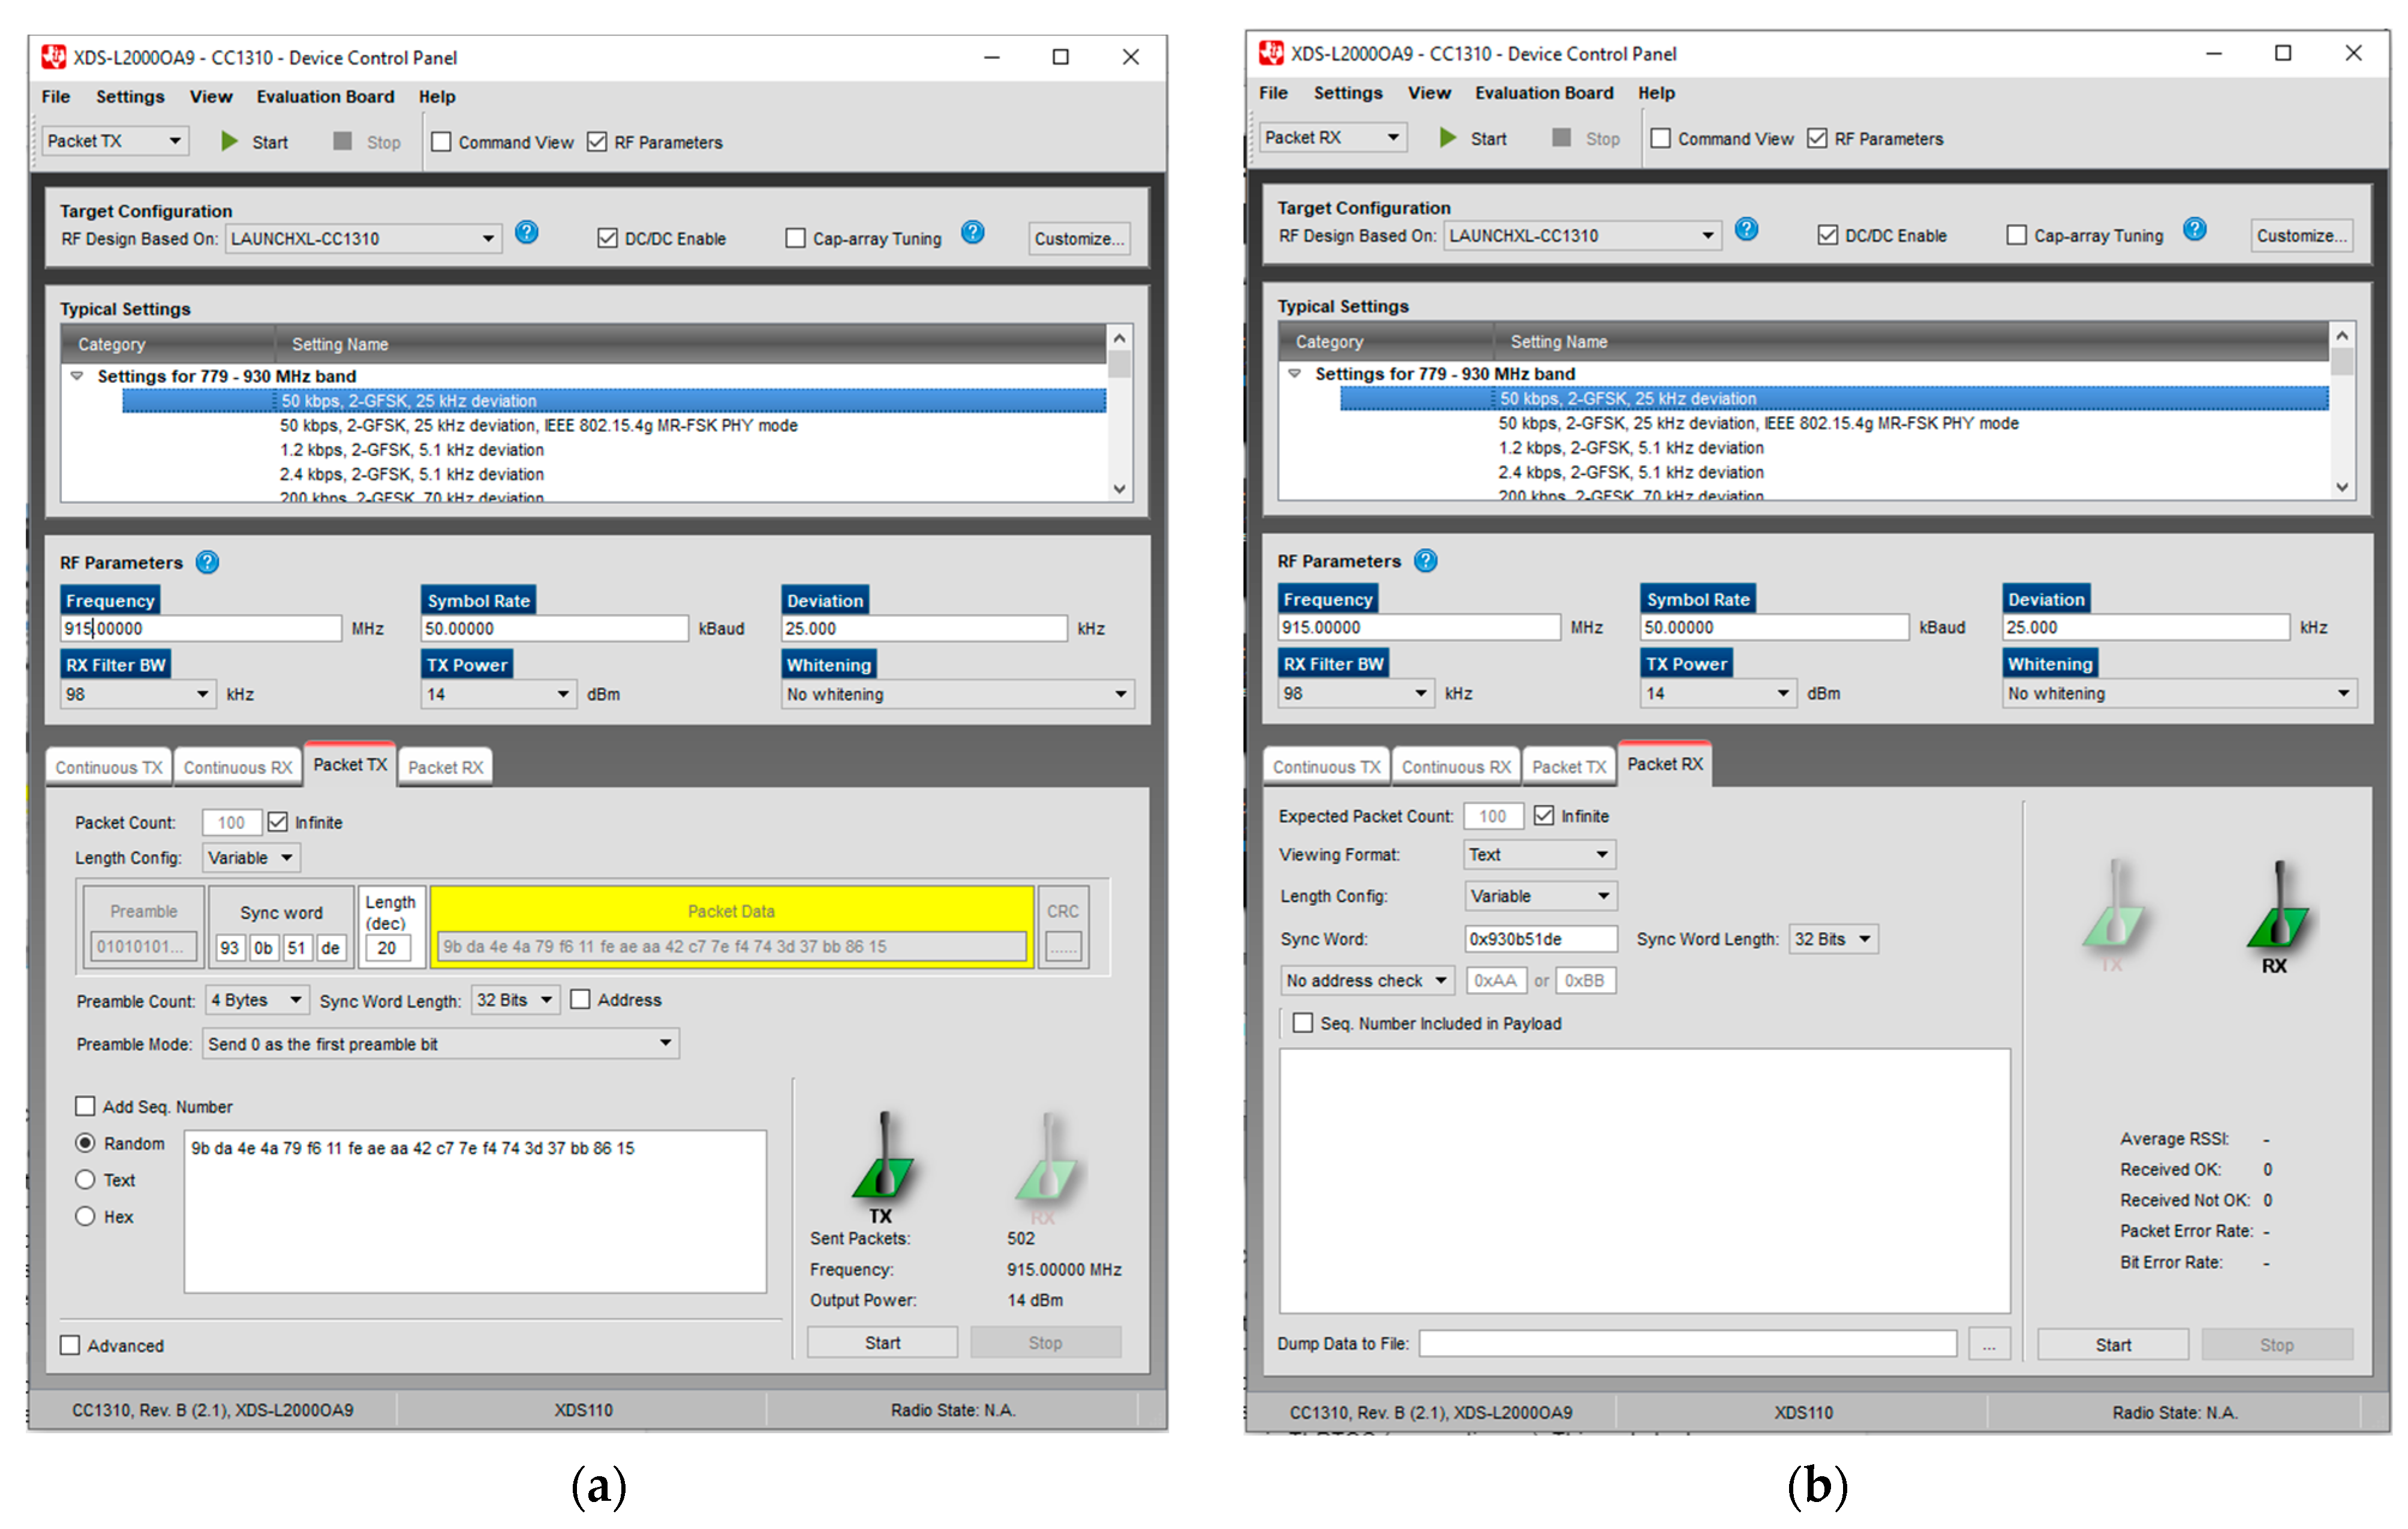
(a) Configuring the PacketTX in SmartRF Studio 7. (b) Configuring the PacketRX in SmartRF Studio 7.
Figure 11.
(a) Configuring the PacketTX in SmartRF Studio 7. (b) Configuring the PacketRX in SmartRF Studio 7.
Figure 12.
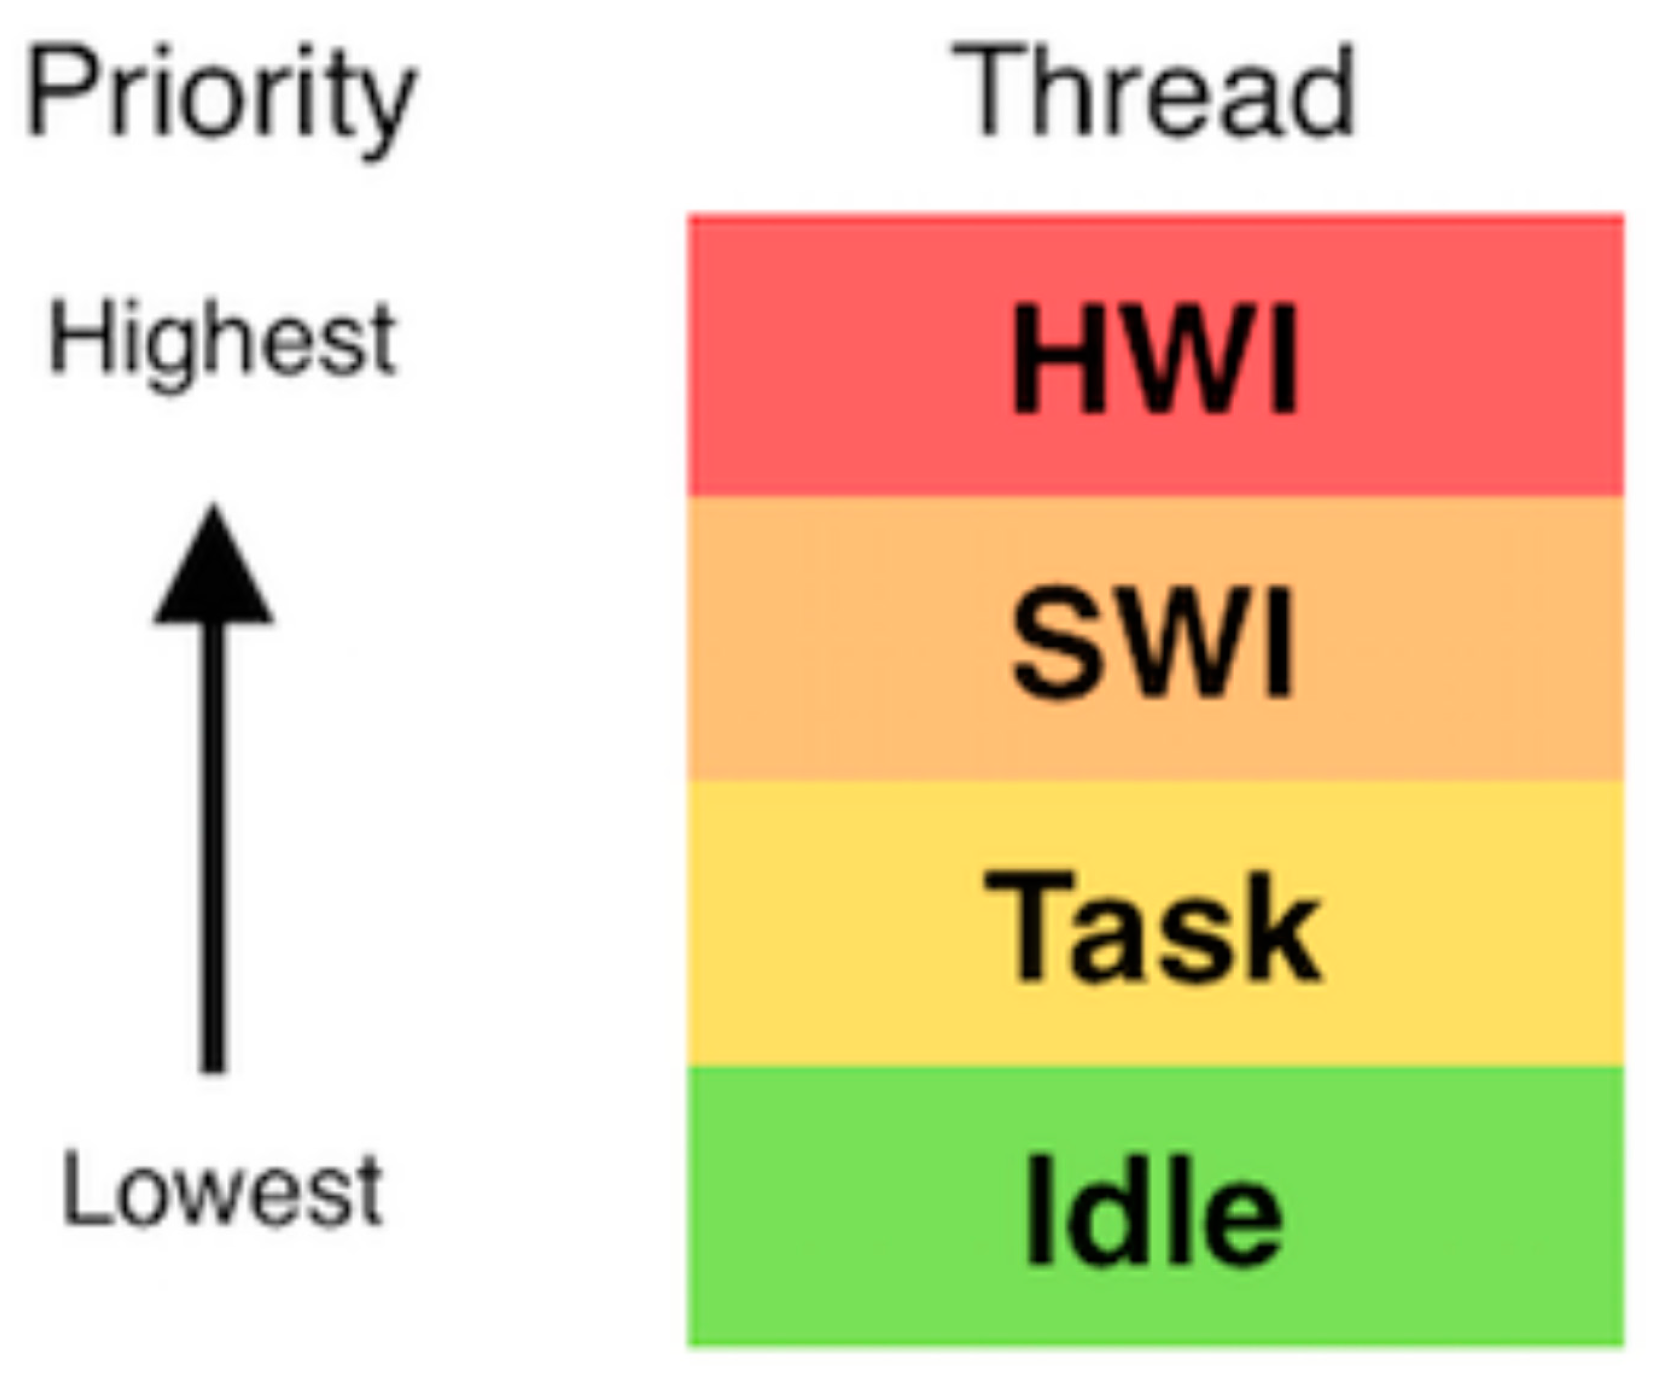
TI-RTOS kernel priority levels. Image Credit: TI [
34].
Figure 12.
TI-RTOS kernel priority levels. Image Credit: TI [
34].
Figure 13.
Semaphore process flow.
Figure 13.
Semaphore process flow.
Figure 14.
TI-RTOS semaphore APIs.
Figure 14.
TI-RTOS semaphore APIs.
Figure 15.
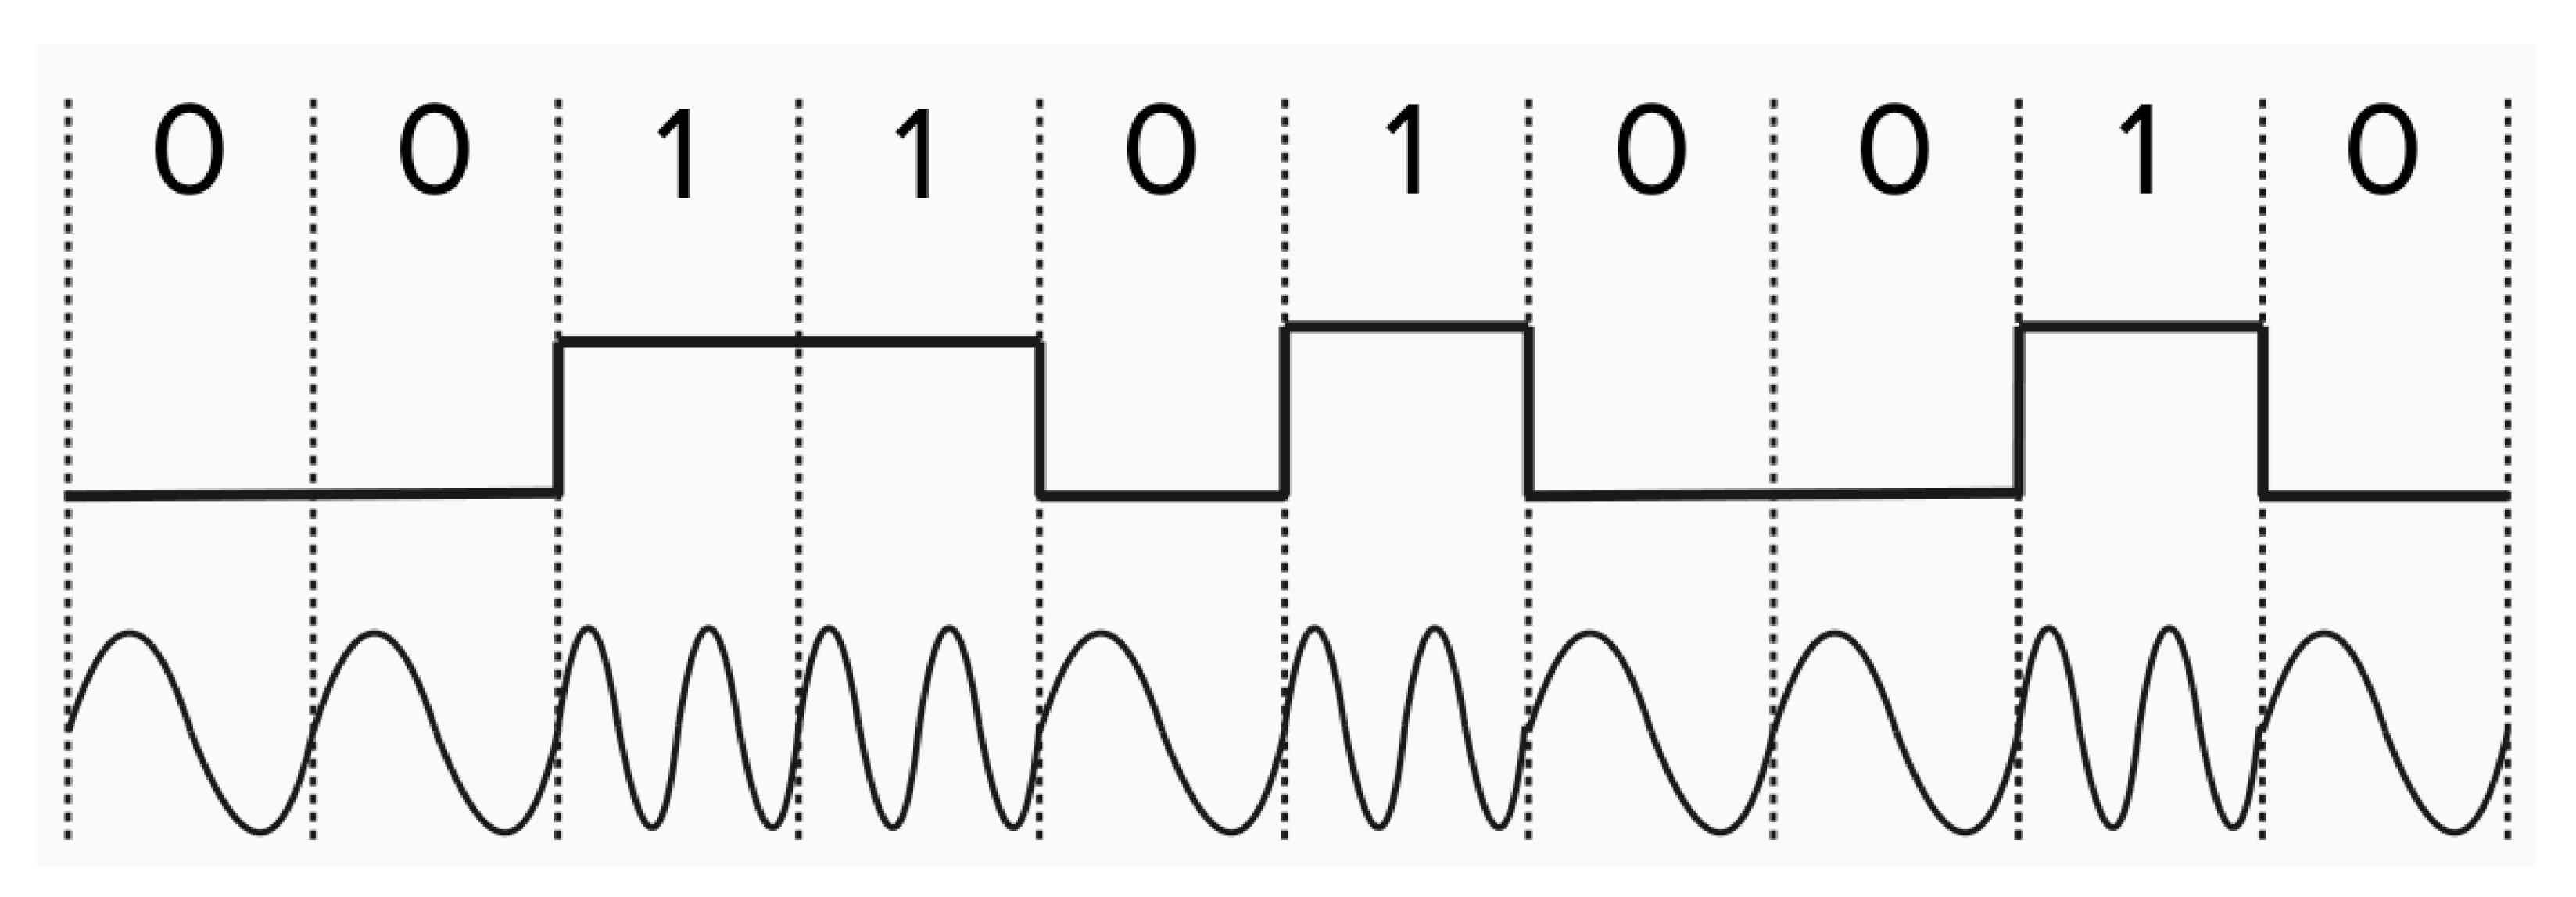
Binary frequency shift keying (BFSK).
Figure 15.
Binary frequency shift keying (BFSK).
Figure 16.
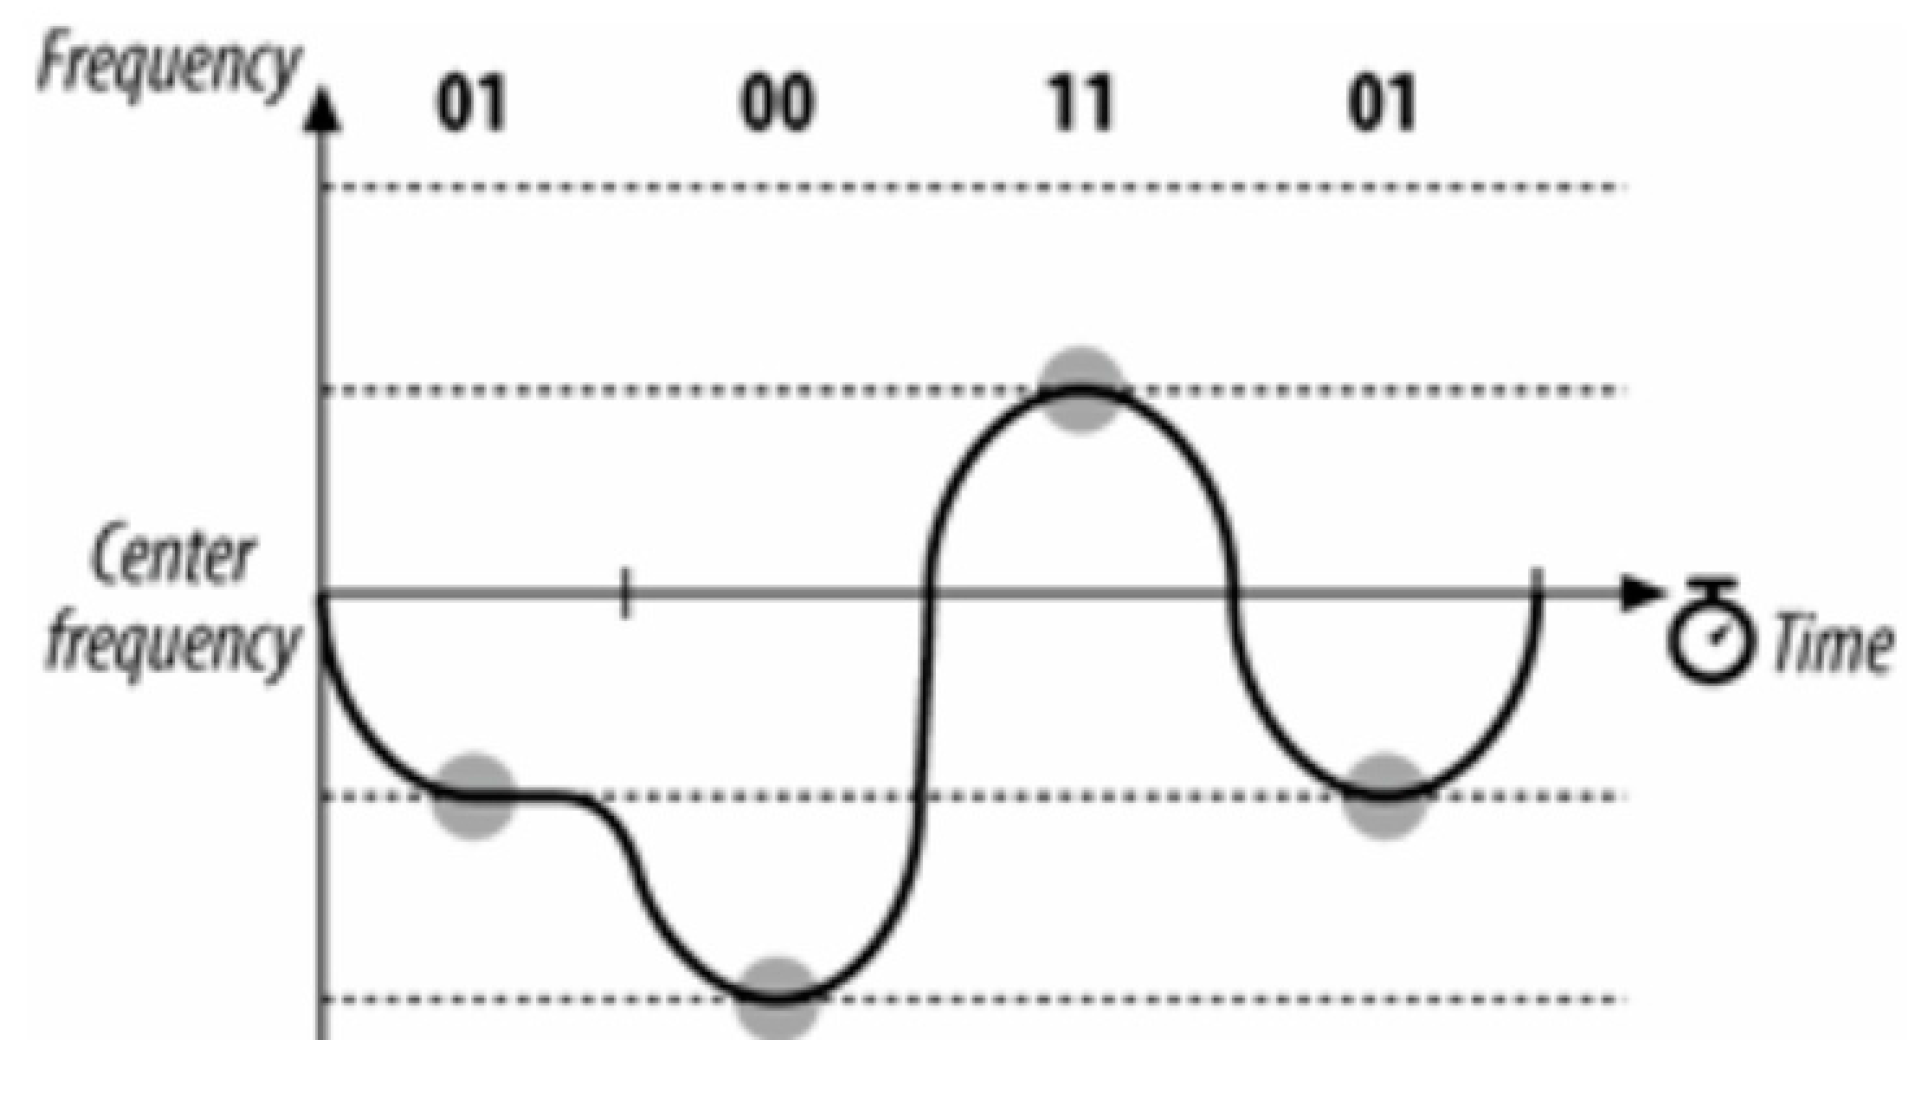
Dual Gaussian frequency shift keying (2DFSK). Note that the
y axis in this instance displays frequency. Image Credit: “802.11 Wireless Networks: The Definitive Guide” [
36].
Figure 16.
Dual Gaussian frequency shift keying (2DFSK). Note that the
y axis in this instance displays frequency. Image Credit: “802.11 Wireless Networks: The Definitive Guide” [
36].
Figure 17.
4 GFSKs. Four different frequencies corresponding to the four different possible 2-bit sequences. Image Credit: “802.11 Wireless Networks: The Definitive Guide” [
36].
Figure 17.
4 GFSKs. Four different frequencies corresponding to the four different possible 2-bit sequences. Image Credit: “802.11 Wireless Networks: The Definitive Guide” [
36].
Figure 18.
Four-channel Gaussian frequency shift keying (GFSK). Image Credit: “802.11 Wireless Networks: The Definitive Guide” [
36].
Figure 18.
Four-channel Gaussian frequency shift keying (GFSK). Image Credit: “802.11 Wireless Networks: The Definitive Guide” [
36].
Figure 19.
Data packet formulation.
Figure 19.
Data packet formulation.
Figure 20.
Binary matrix multiplication of the LHS G matrix with the data.
Figure 20.
Binary matrix multiplication of the LHS G matrix with the data.
Figure 22.
Addition of a preamble.
Figure 22.
Addition of a preamble.
Figure 23.
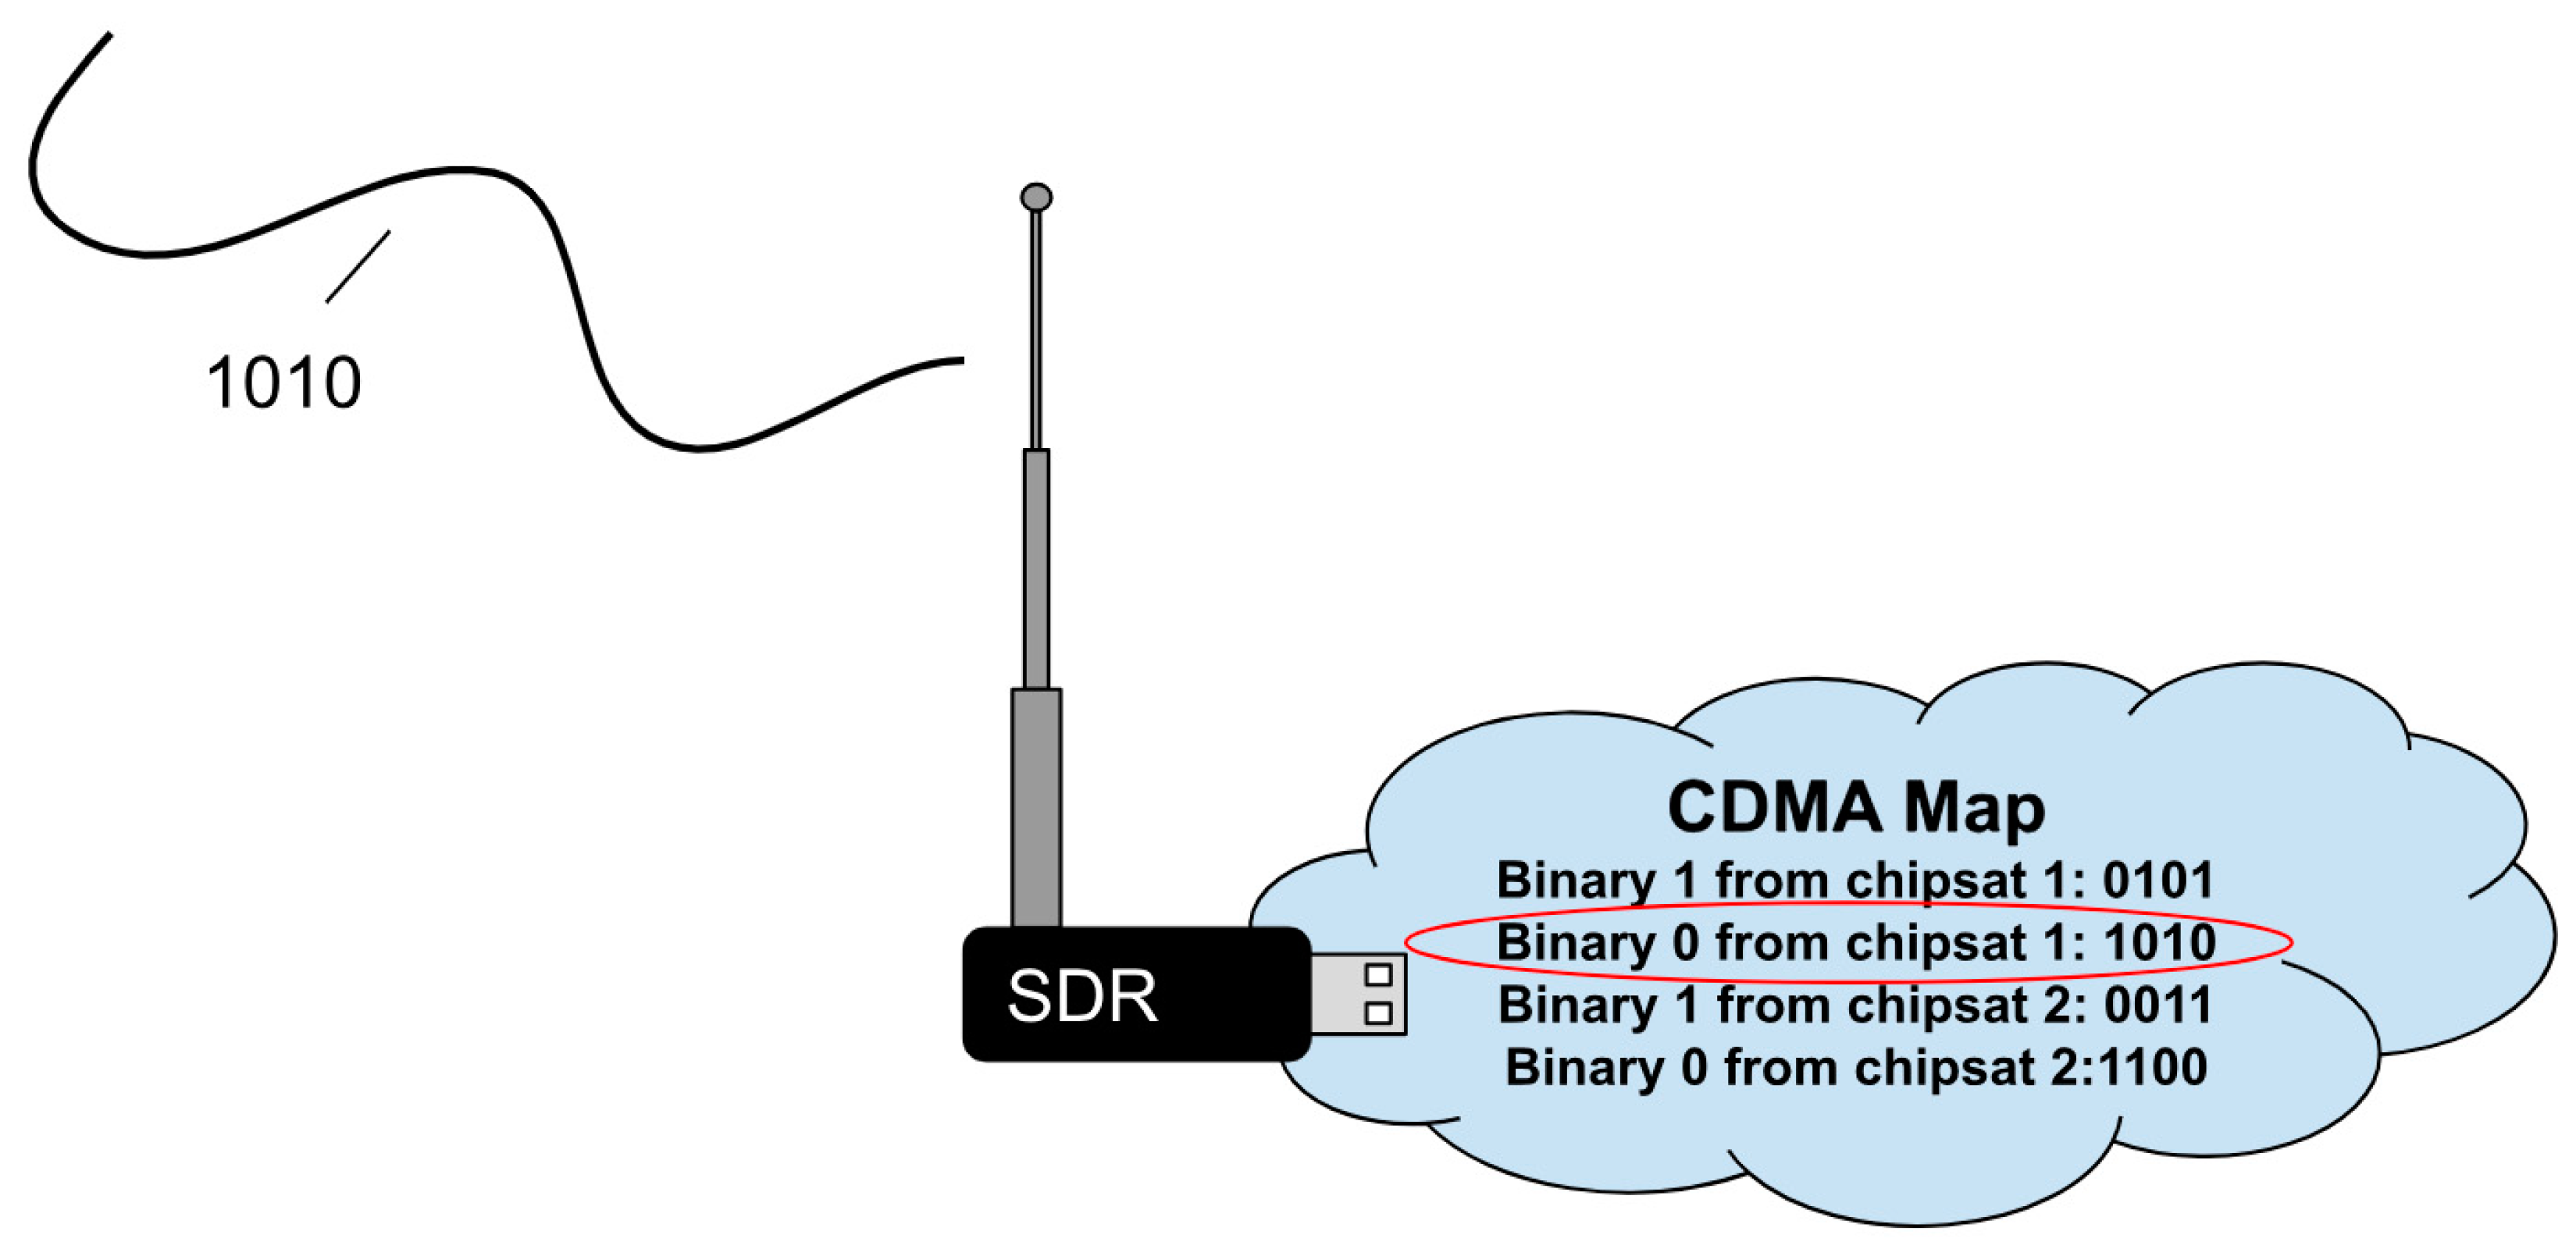
CDMA allows the receiver to recognize which device is transmitting.
Figure 23.
CDMA allows the receiver to recognize which device is transmitting.
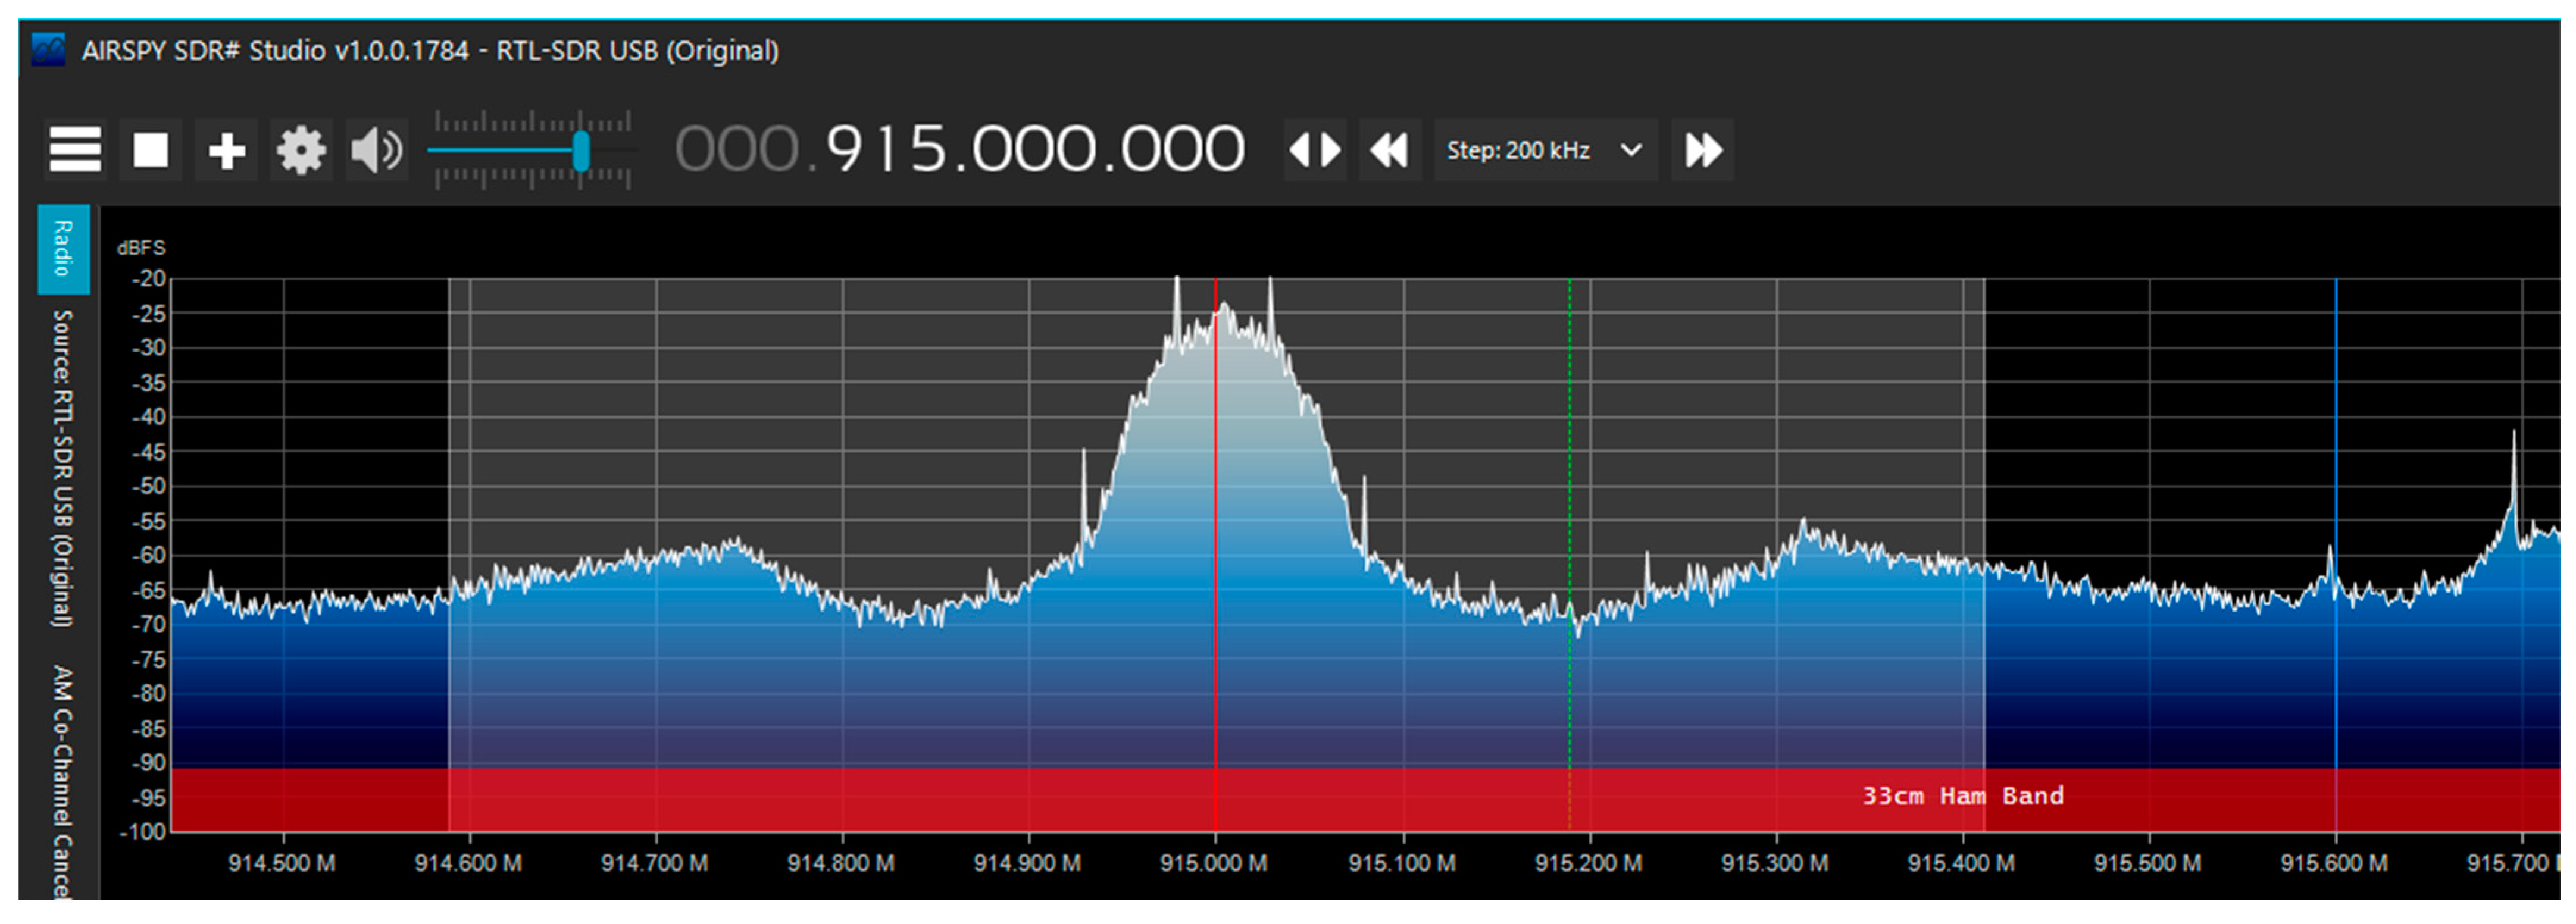
Figure 24.
AIRSPY dashboard identifies ChipSat transmissions at 915 MHz.
Figure 24.
AIRSPY dashboard identifies ChipSat transmissions at 915 MHz.
Figure 25.
Photo from a balloon launch.
Figure 25.
Photo from a balloon launch.
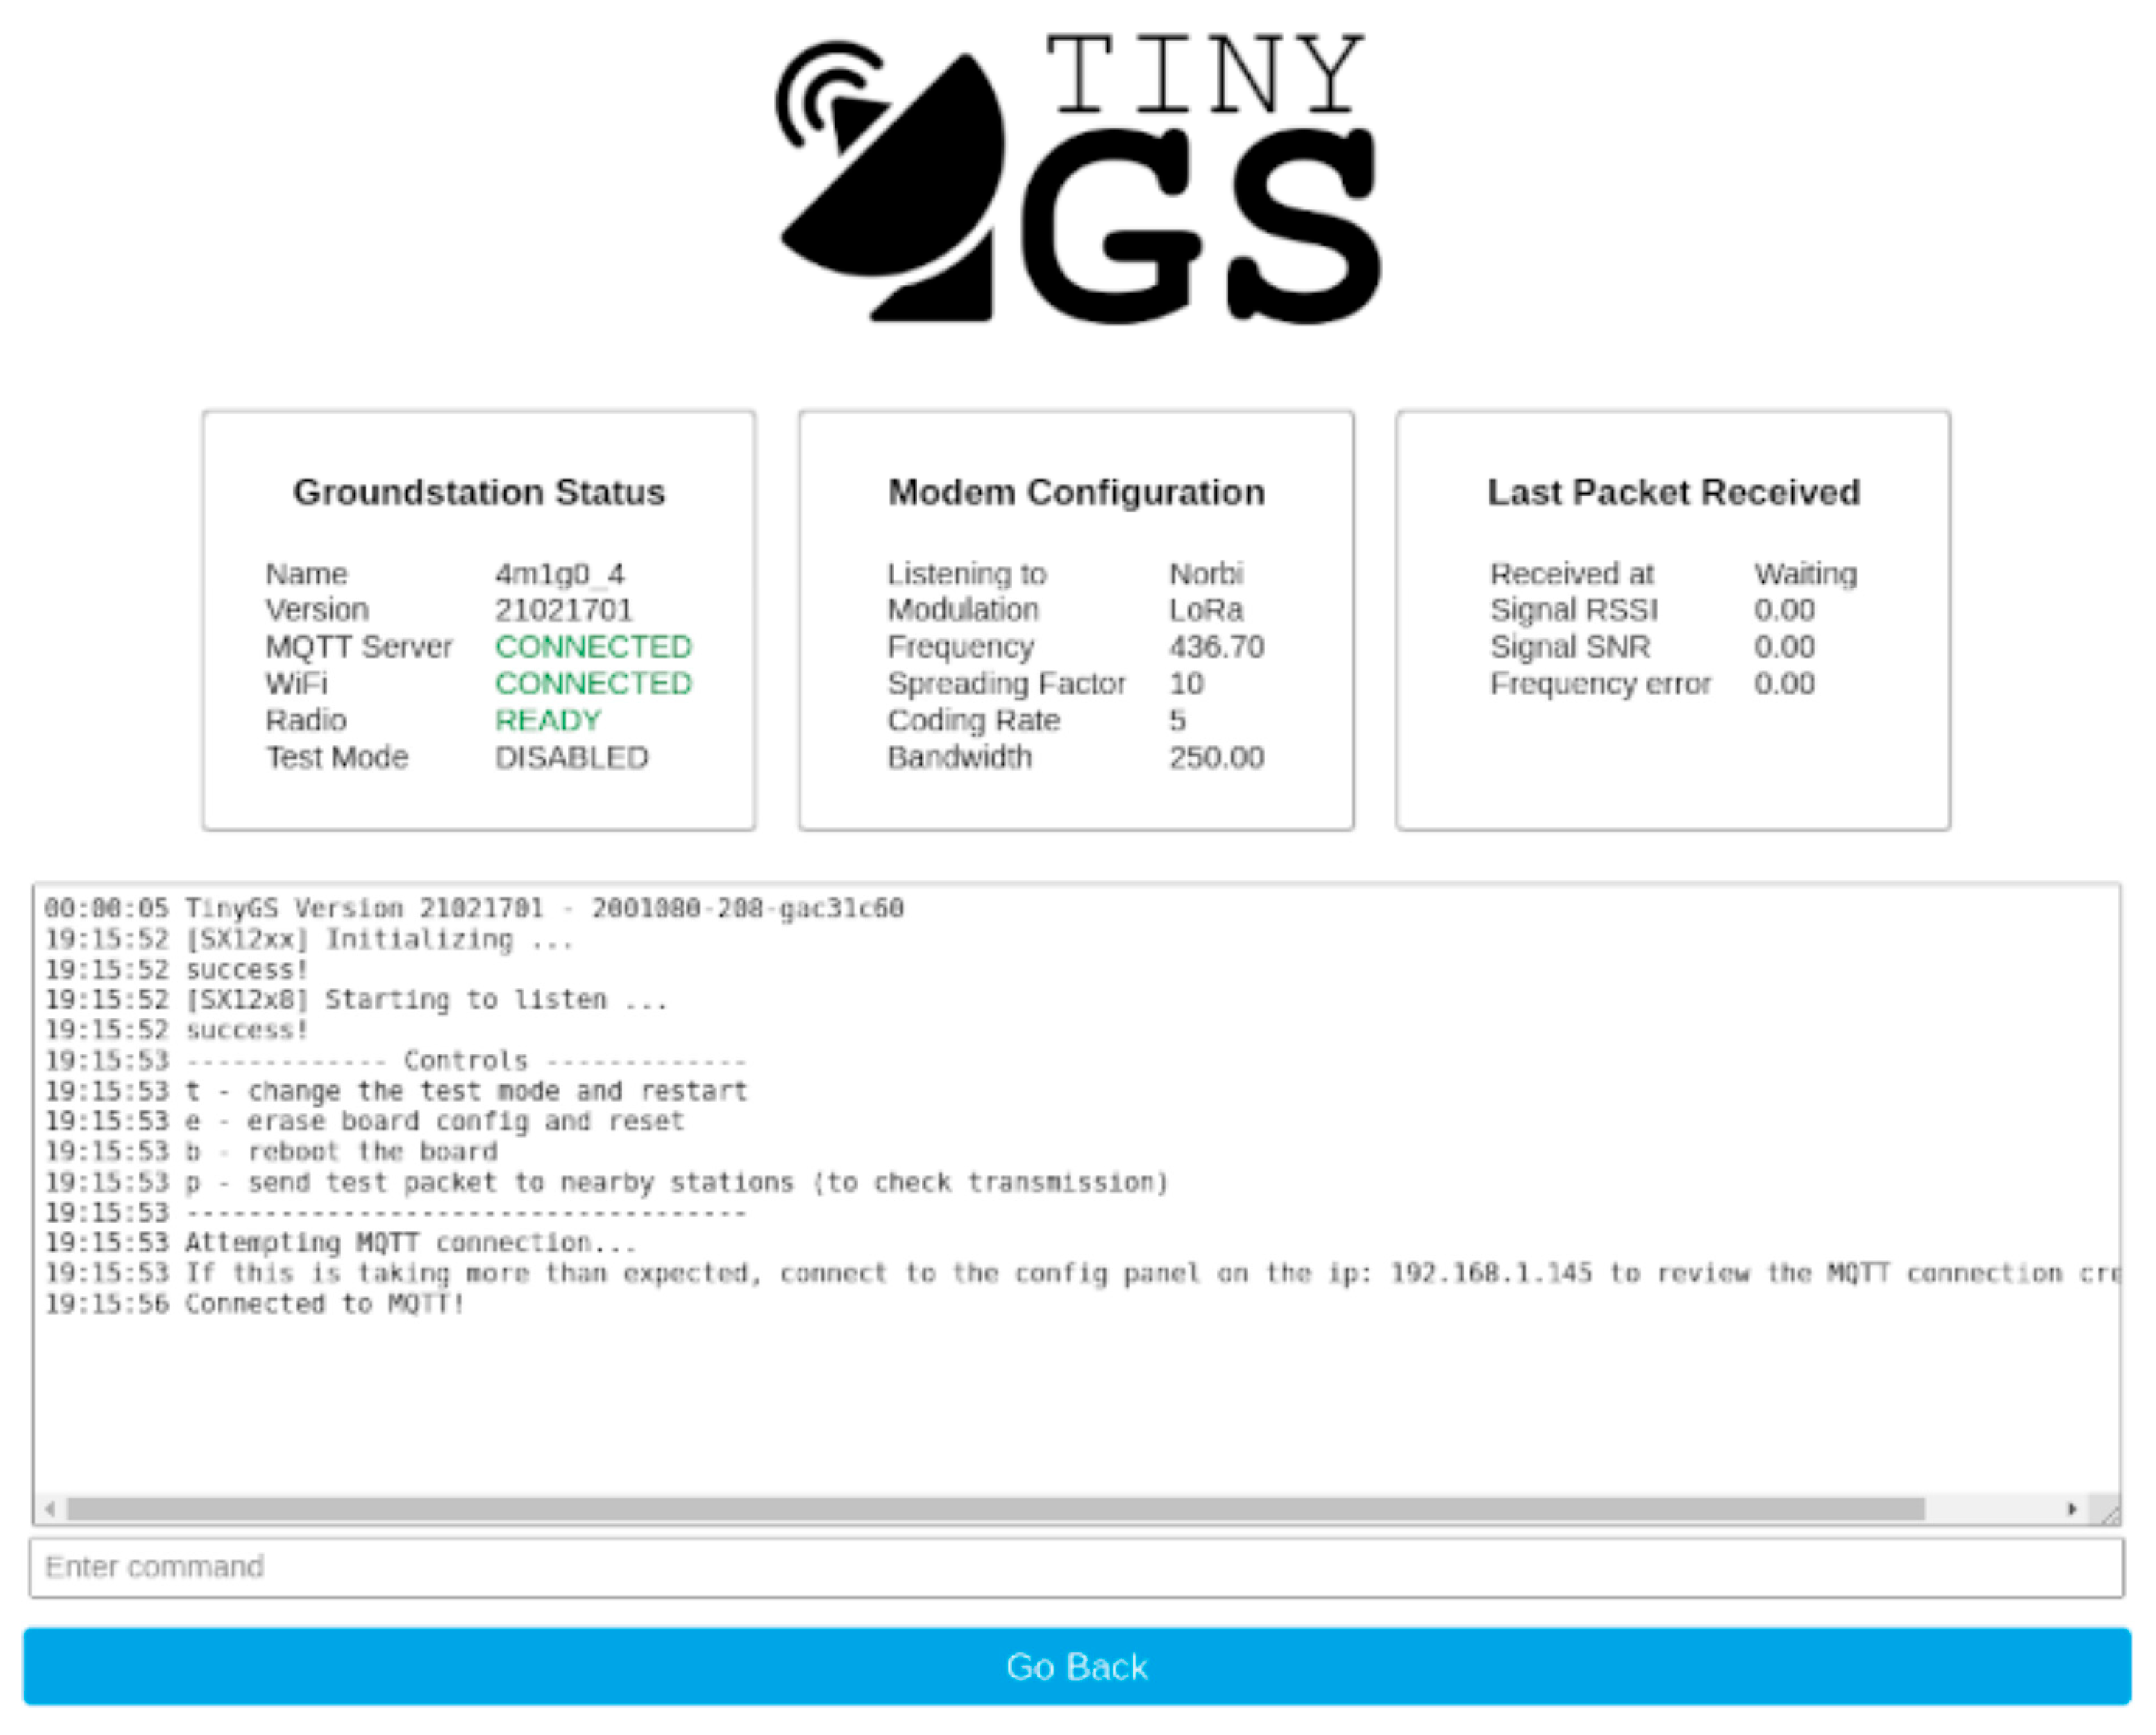
Figure 26.
Example TinyGS dashboard.
Figure 26.
Example TinyGS dashboard.
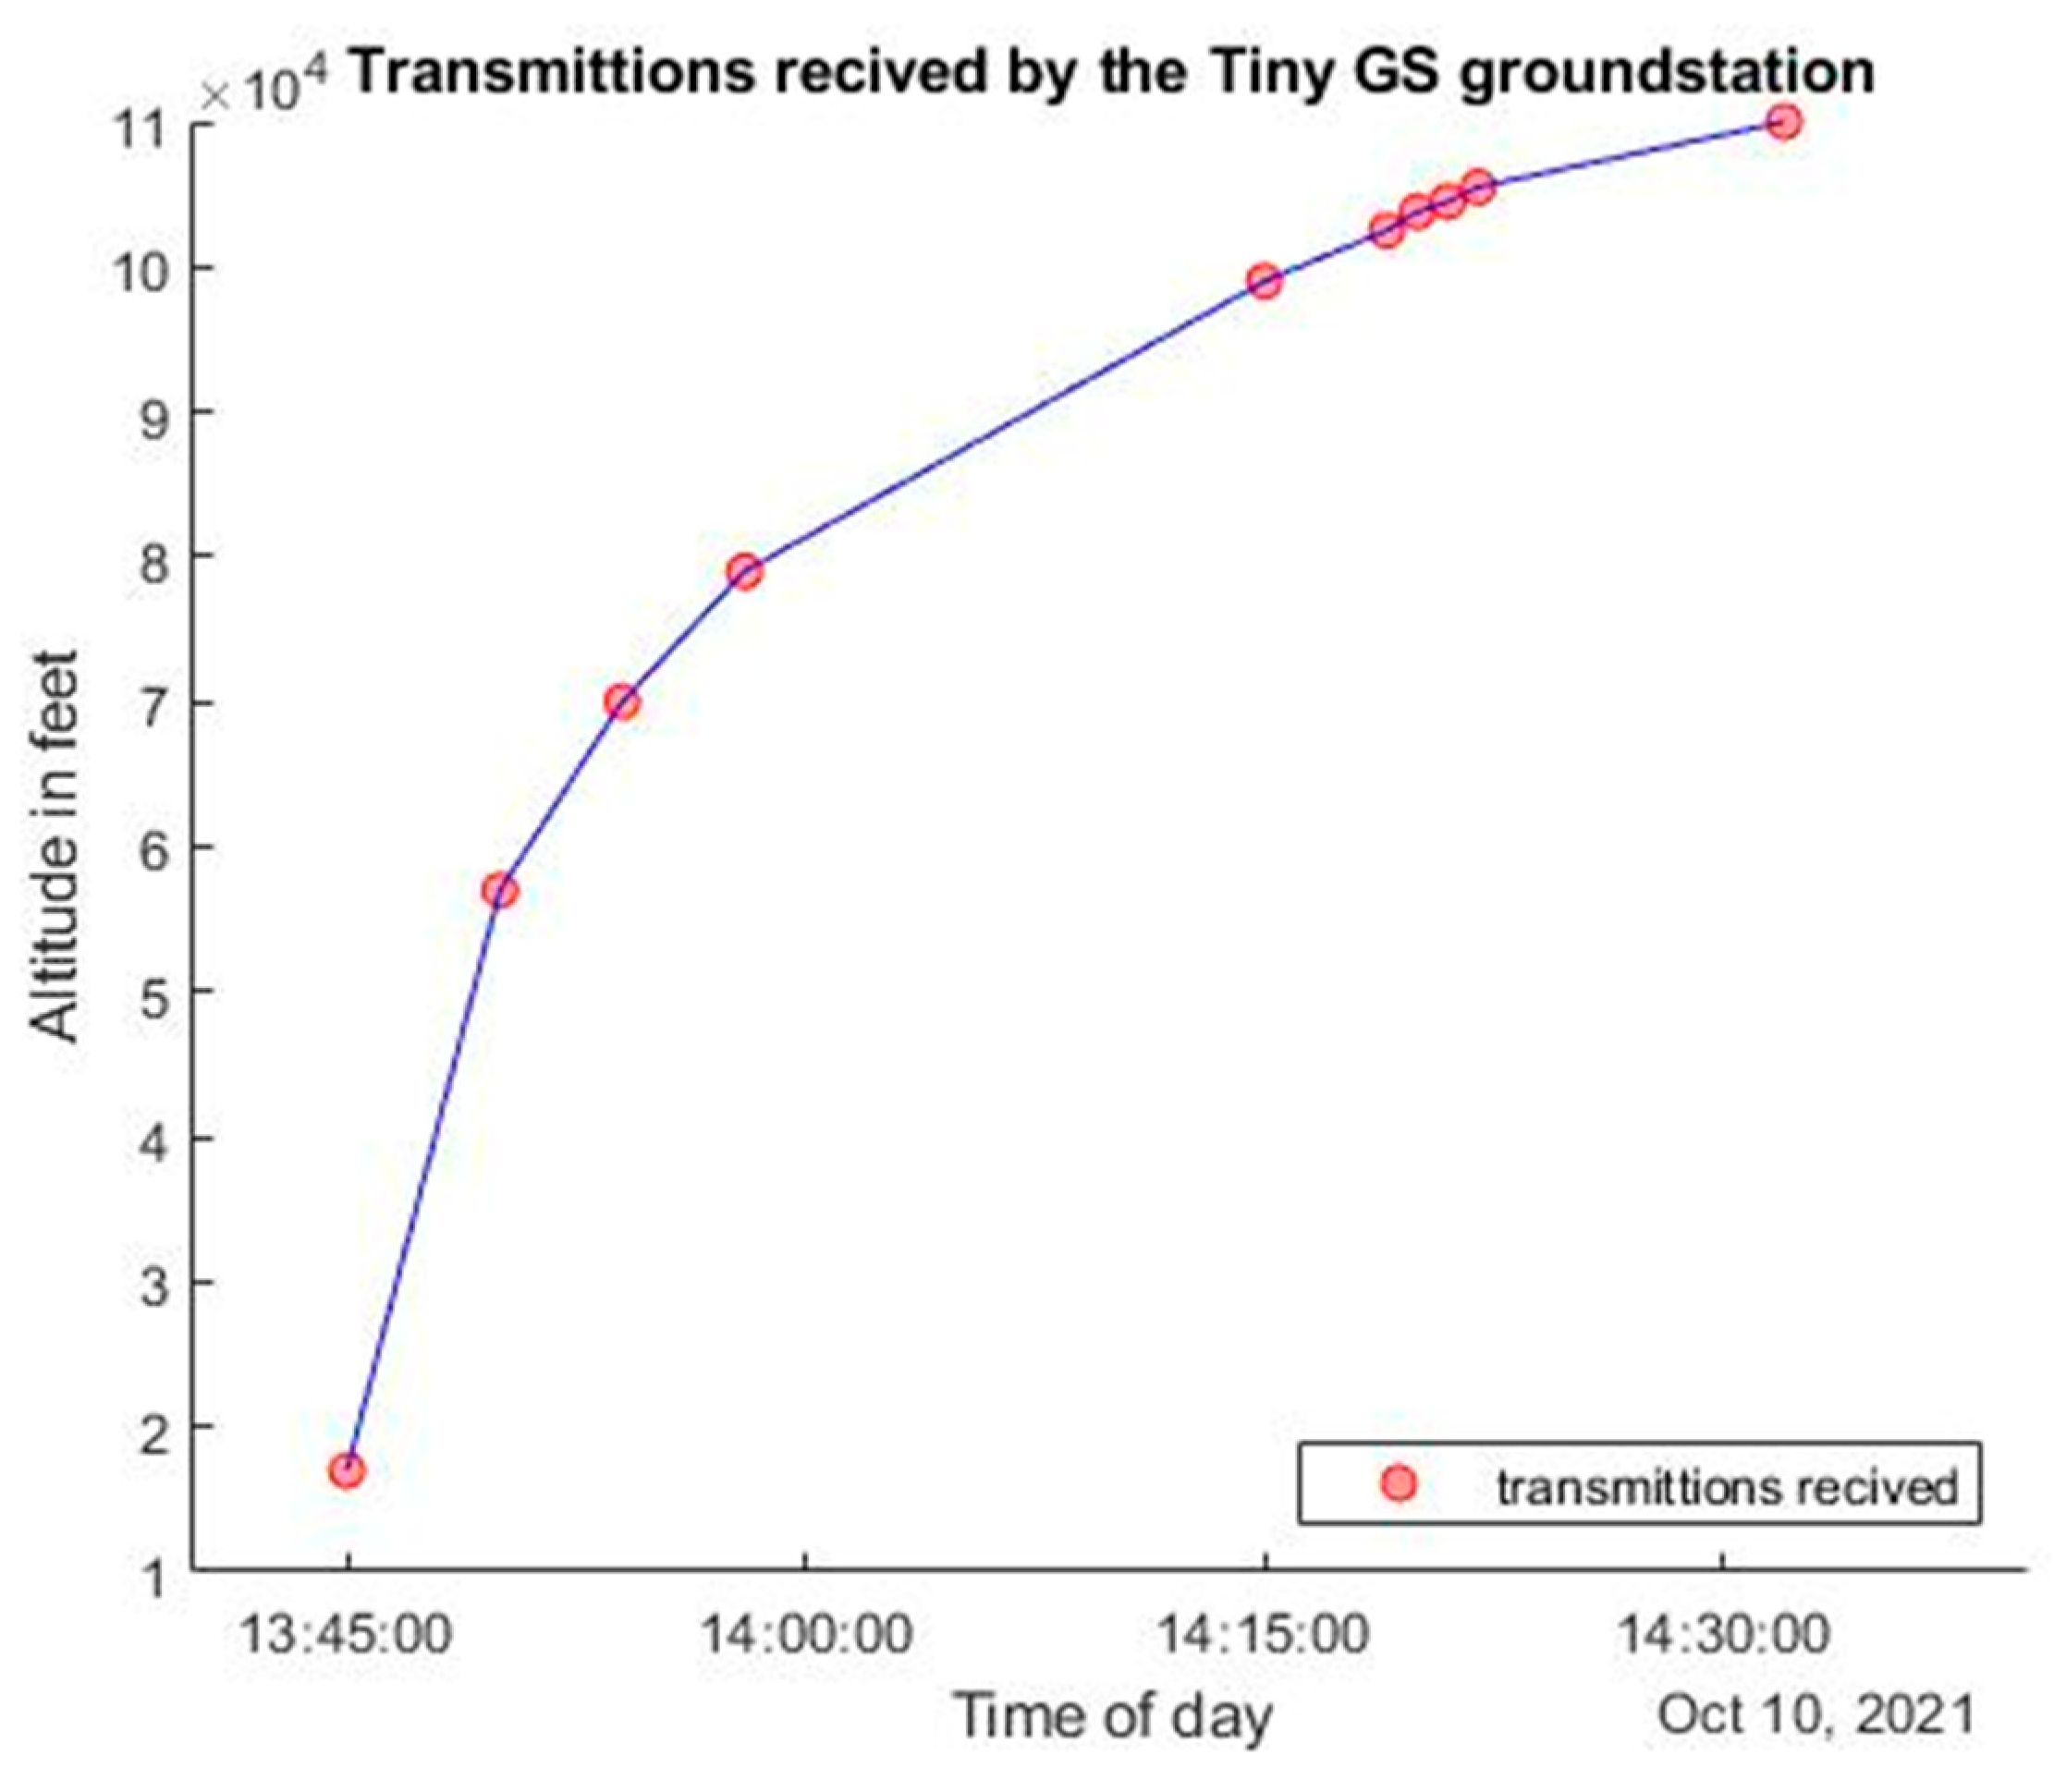
Figure 27.
Satellite height as a function of TinyGS transmission timestamps.
Figure 27.
Satellite height as a function of TinyGS transmission timestamps.
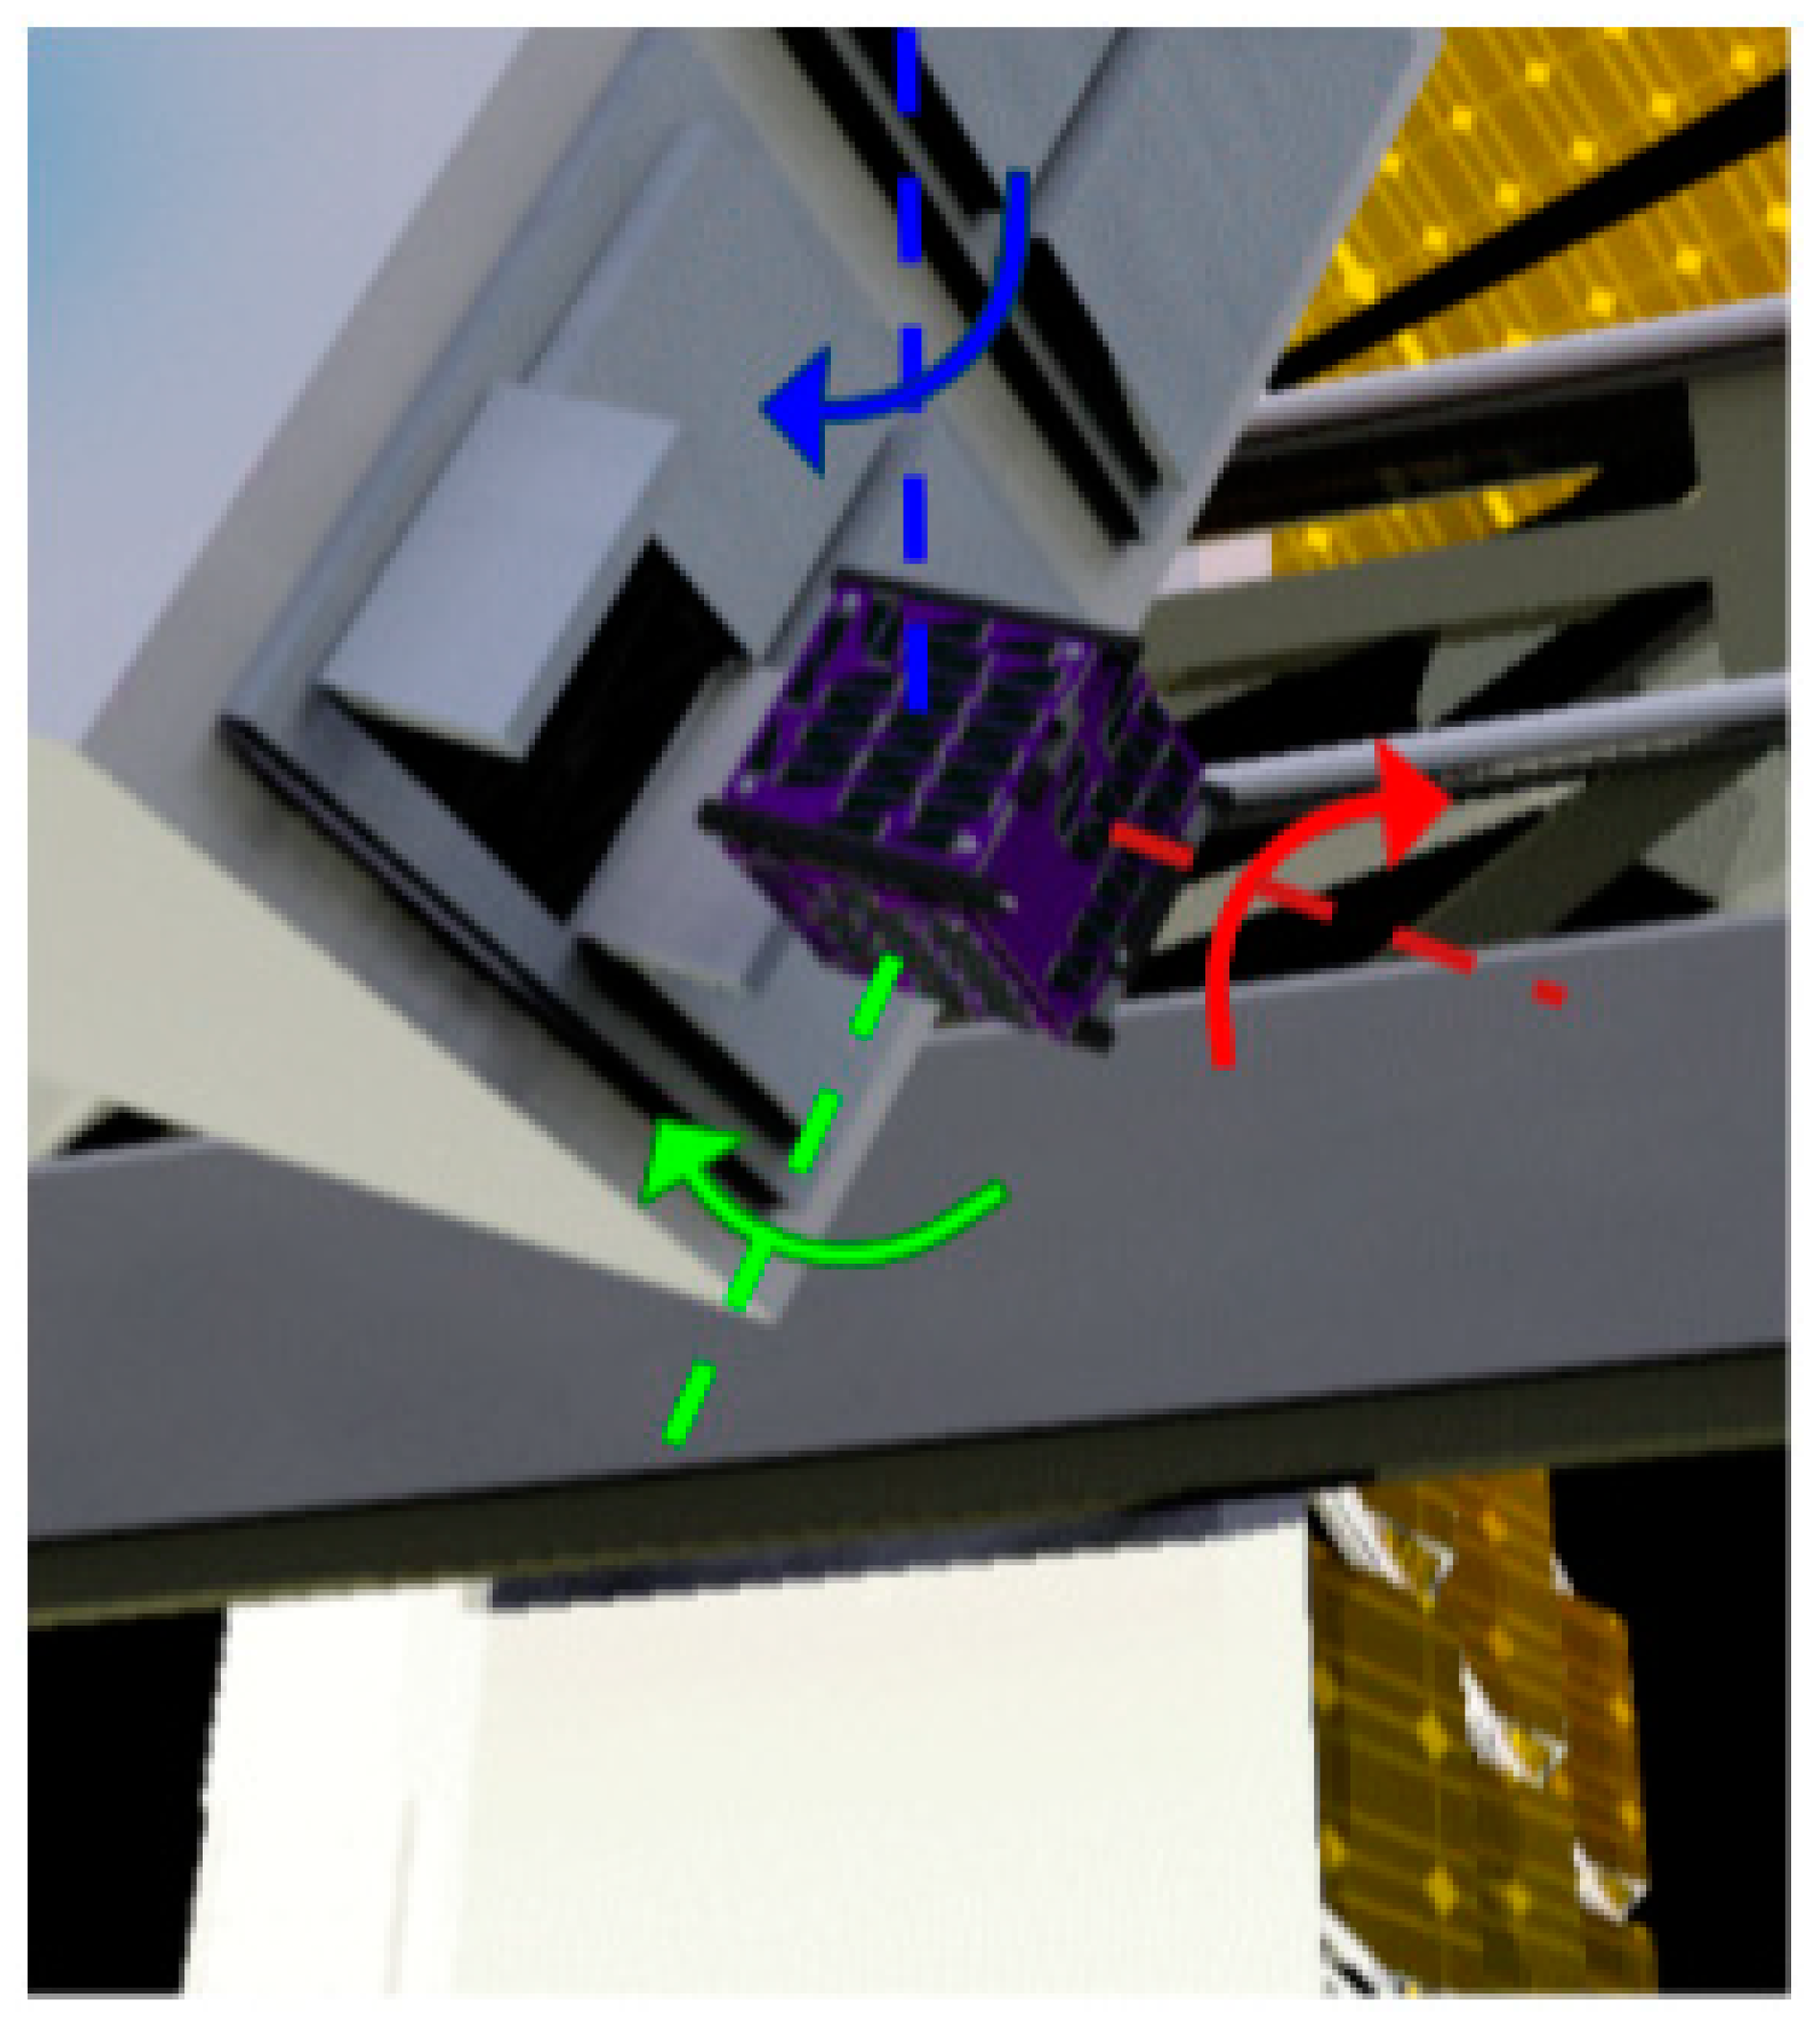
Figure 28.
CubeSat detumble after deployer ejection. The blue, red, and green arrows symbolizes the initial spin of the satellite along its three respective axes. Image Credit: Josh Umansky-Castro.
Figure 28.
CubeSat detumble after deployer ejection. The blue, red, and green arrows symbolizes the initial spin of the satellite along its three respective axes. Image Credit: Josh Umansky-Castro.
Figure 29.
(a) CubeSat and light sail spin stabilization; (b) CubeSat achieves pointing. Image Credit: Josh Umansky-Castro.
Figure 29.
(a) CubeSat and light sail spin stabilization; (b) CubeSat achieves pointing. Image Credit: Josh Umansky-Castro.
Figure 30.
Torque coils made in-house.
Figure 30.
Torque coils made in-house.
Figure 31.
Passive ACS techniques used in Alpha: (a) lead weights to increase the moment rotational moment of inertia; (b) steel weights to balance the center of mass toward the middle of the CubeSat; (c) the rotational z axis and the geometric z axis within 5 deg for stability. Image Credit: Josh Umansky-Castro.
Figure 32.
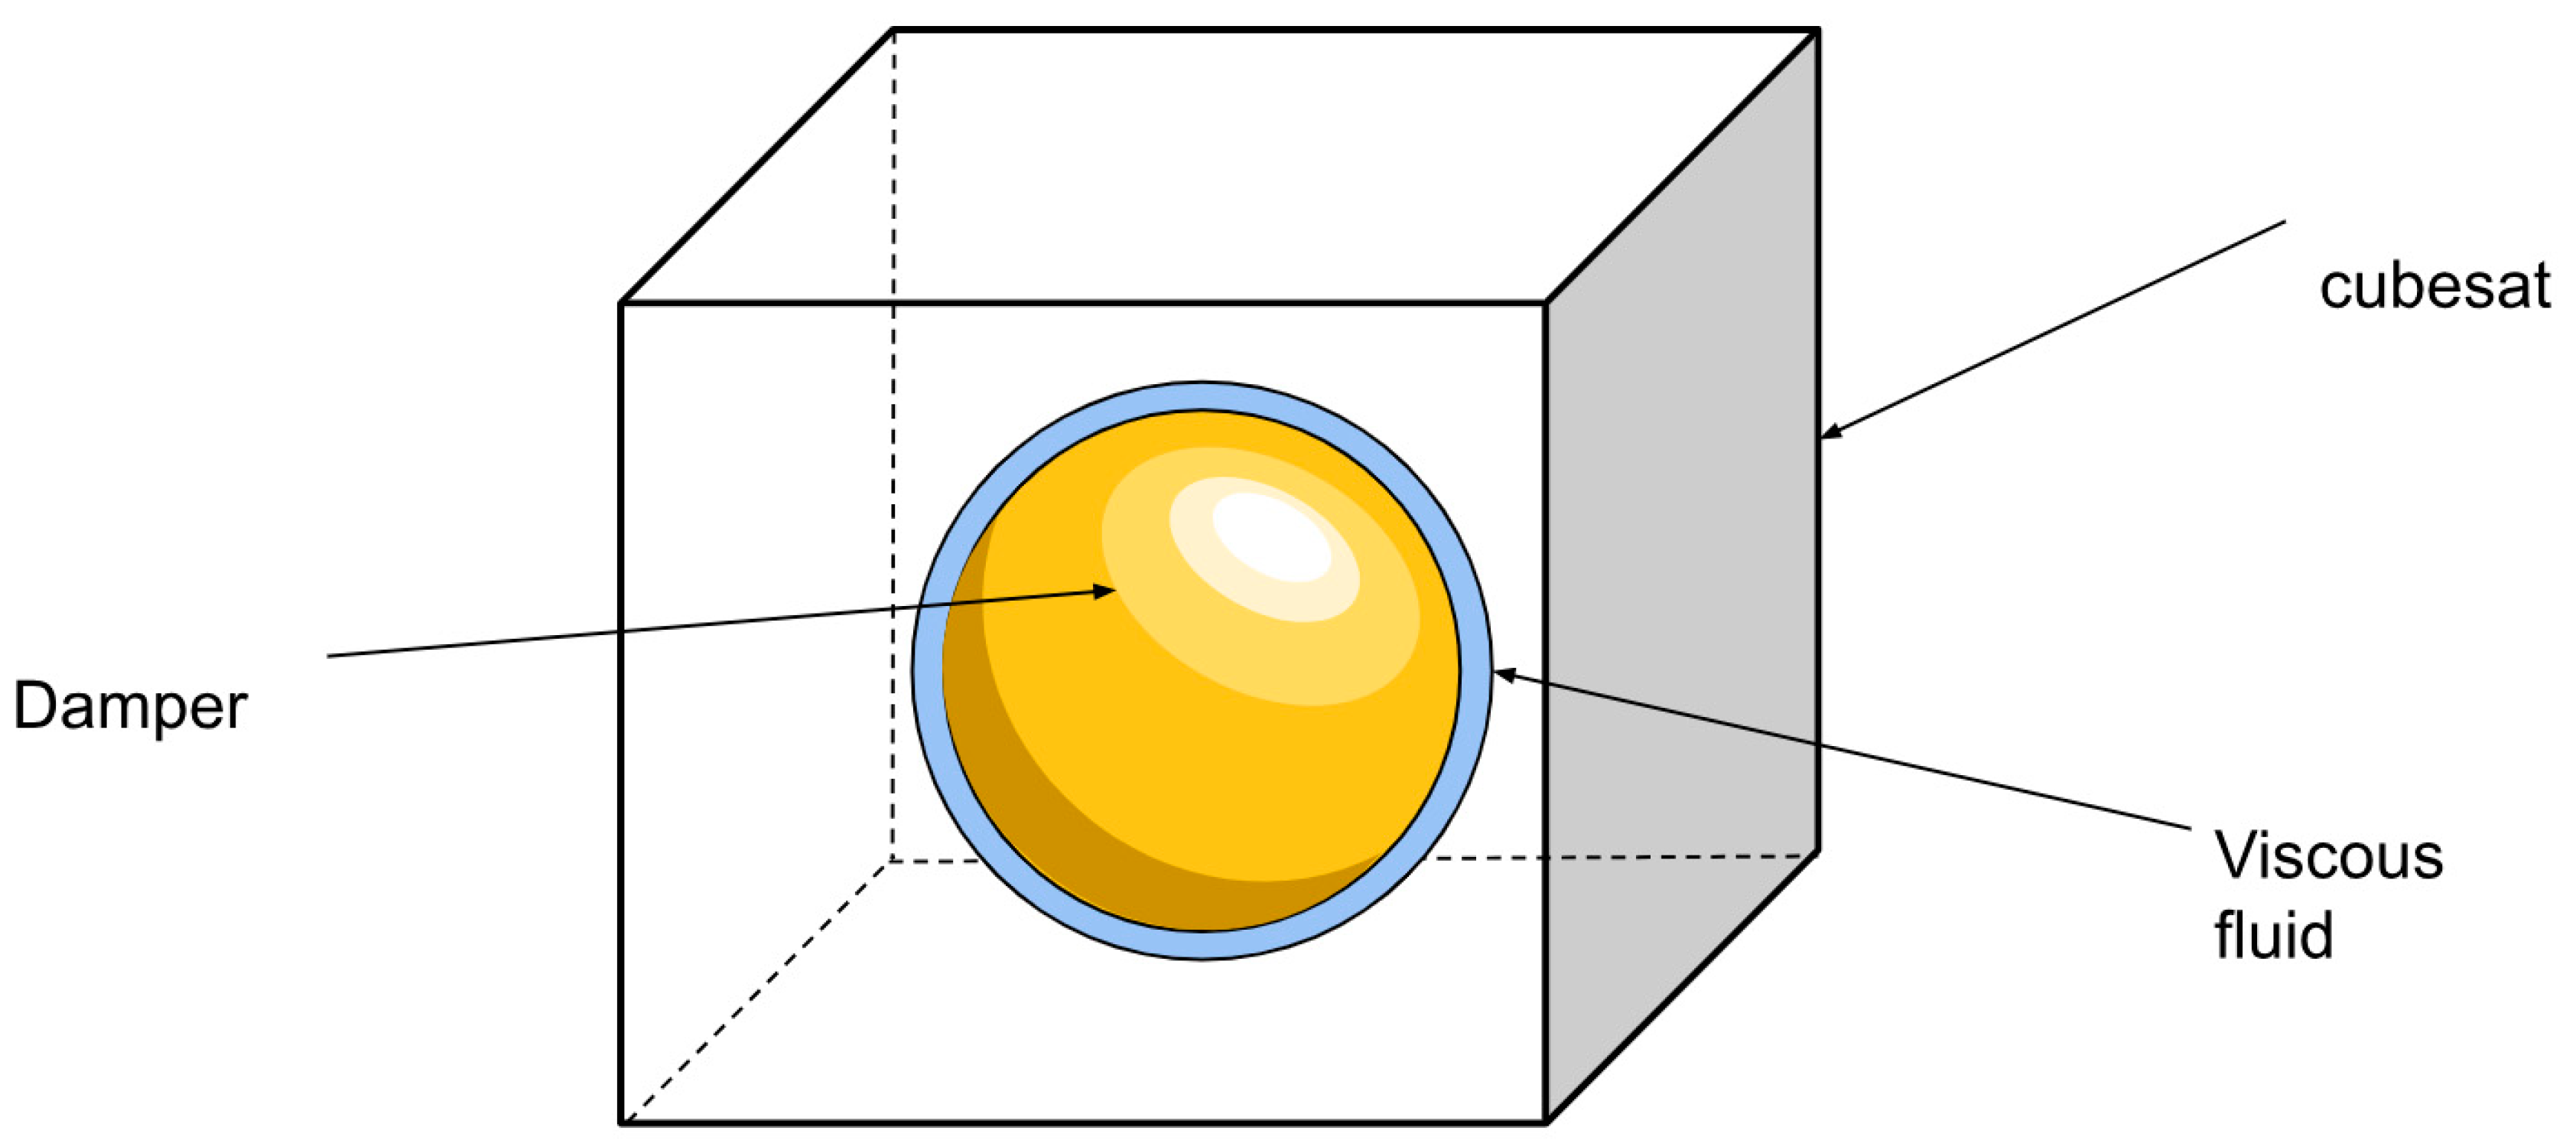
Kane damper model.
Figure 32.
Kane damper model.
Figure 33.
PD feedback block model.
Figure 33.
PD feedback block model.
Figure 34.
Unrealistic convergence of Kane controller.
Figure 34.
Unrealistic convergence of Kane controller.
Figure 35.
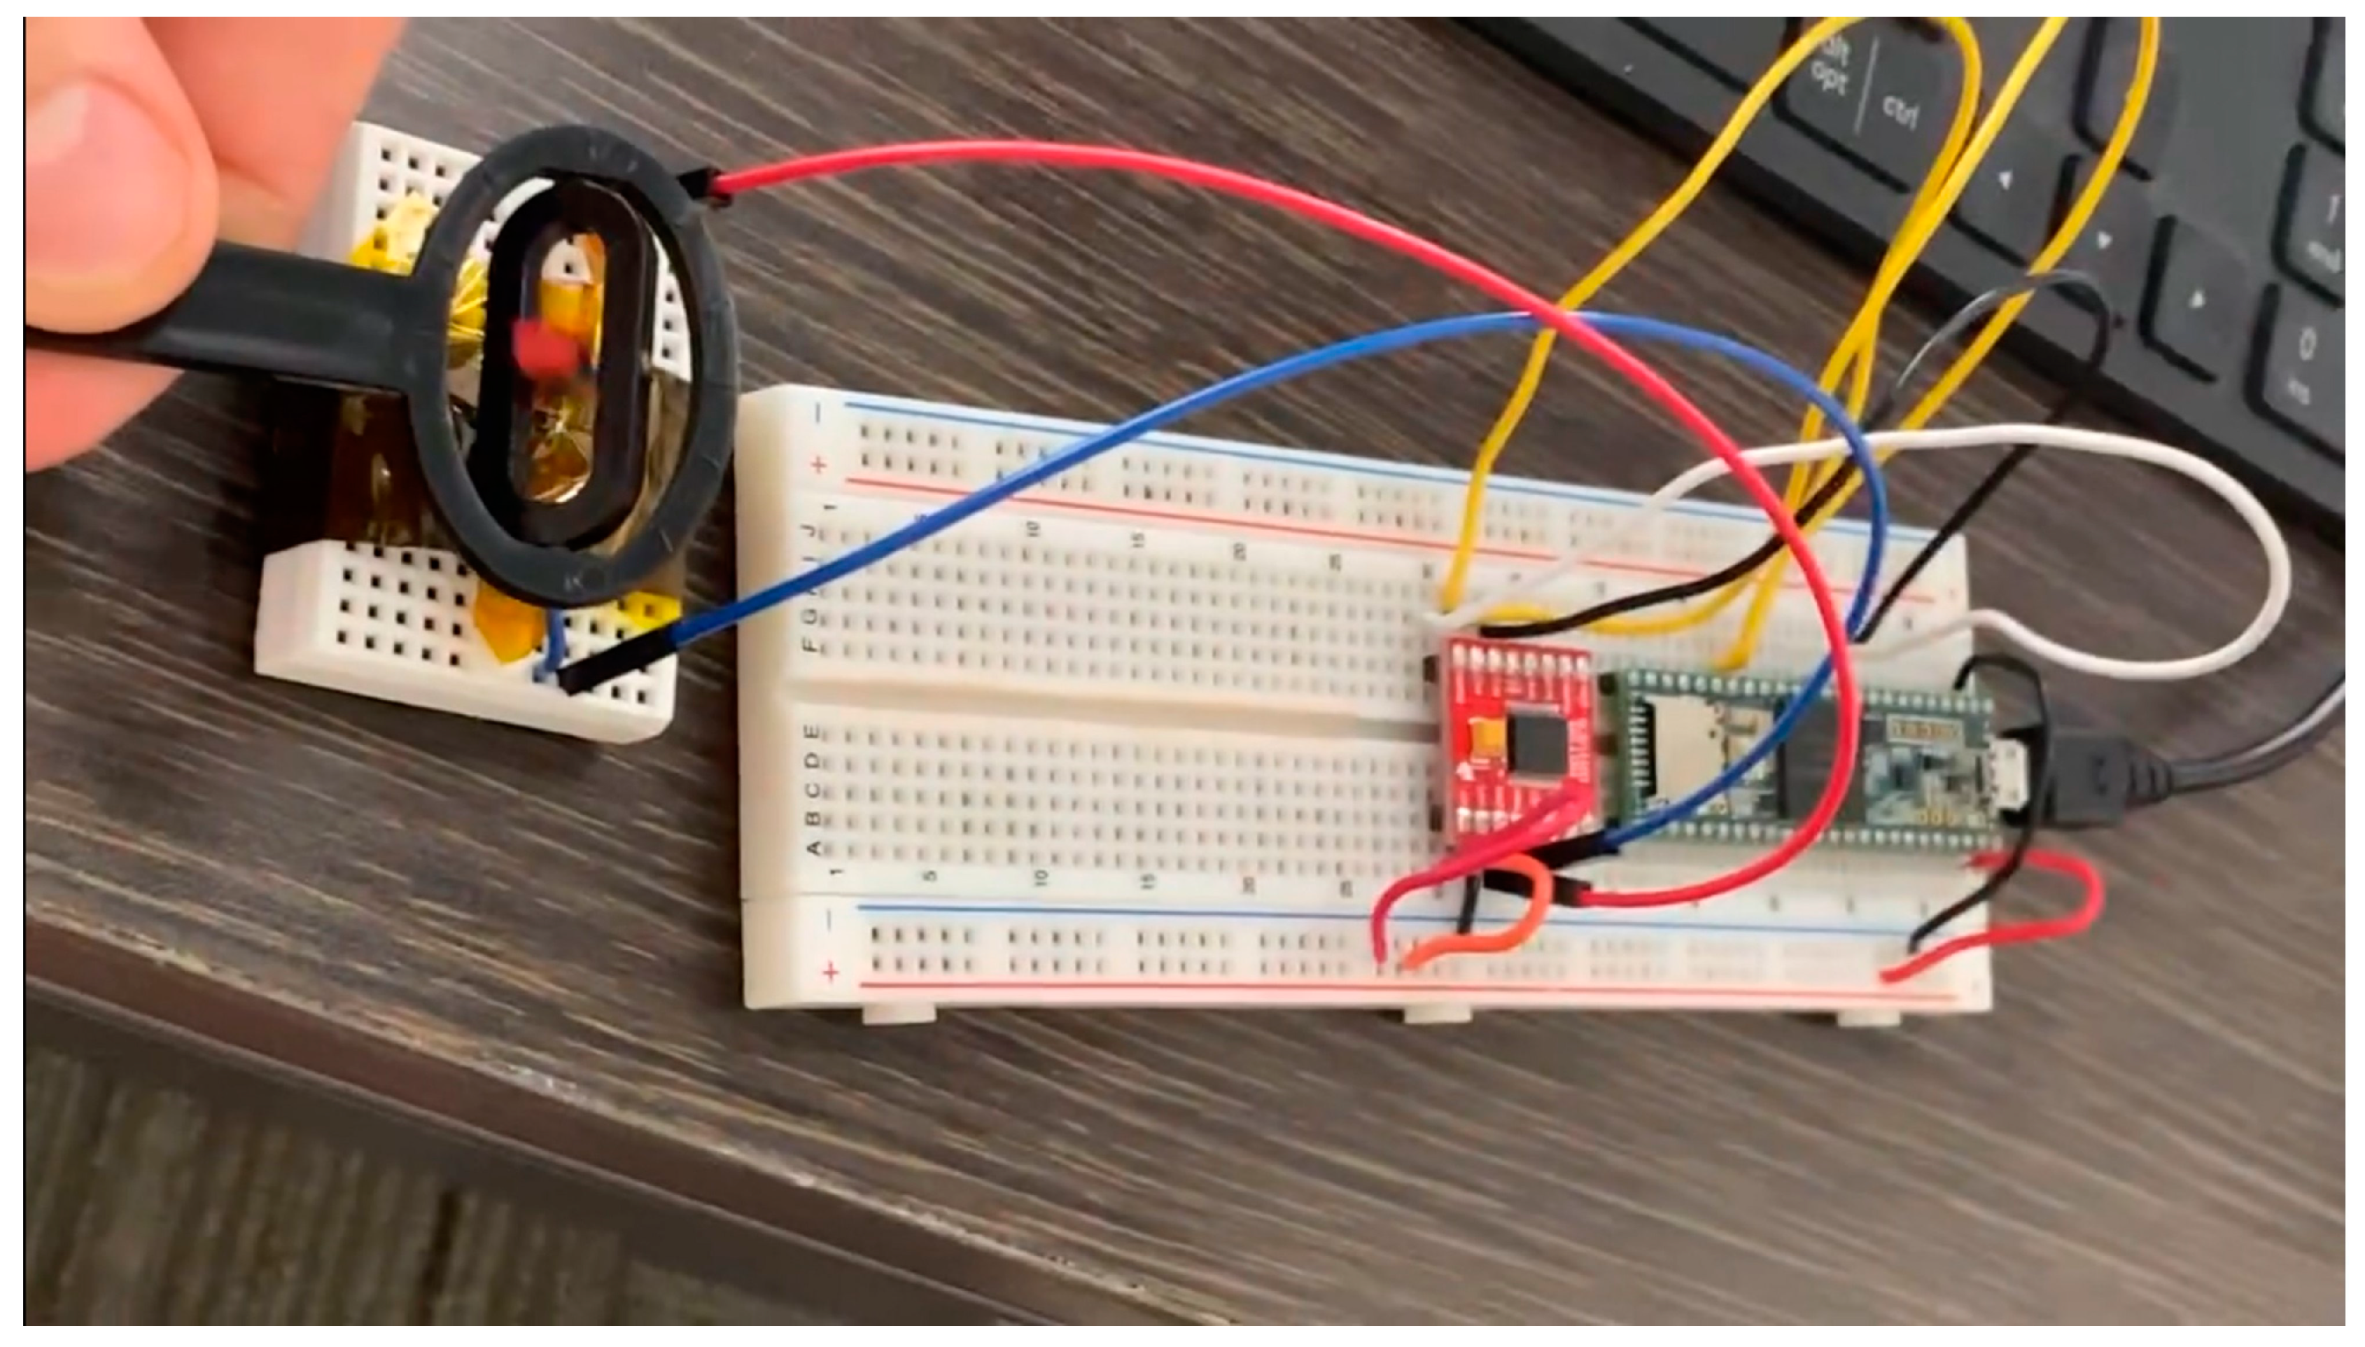
Moment of inertia testing setup [
40]. (
a) Diagram of setup; (
b) Live picture of setup as tested.
Figure 35.
Moment of inertia testing setup [
40]. (
a) Diagram of setup; (
b) Live picture of setup as tested.
Figure 36.
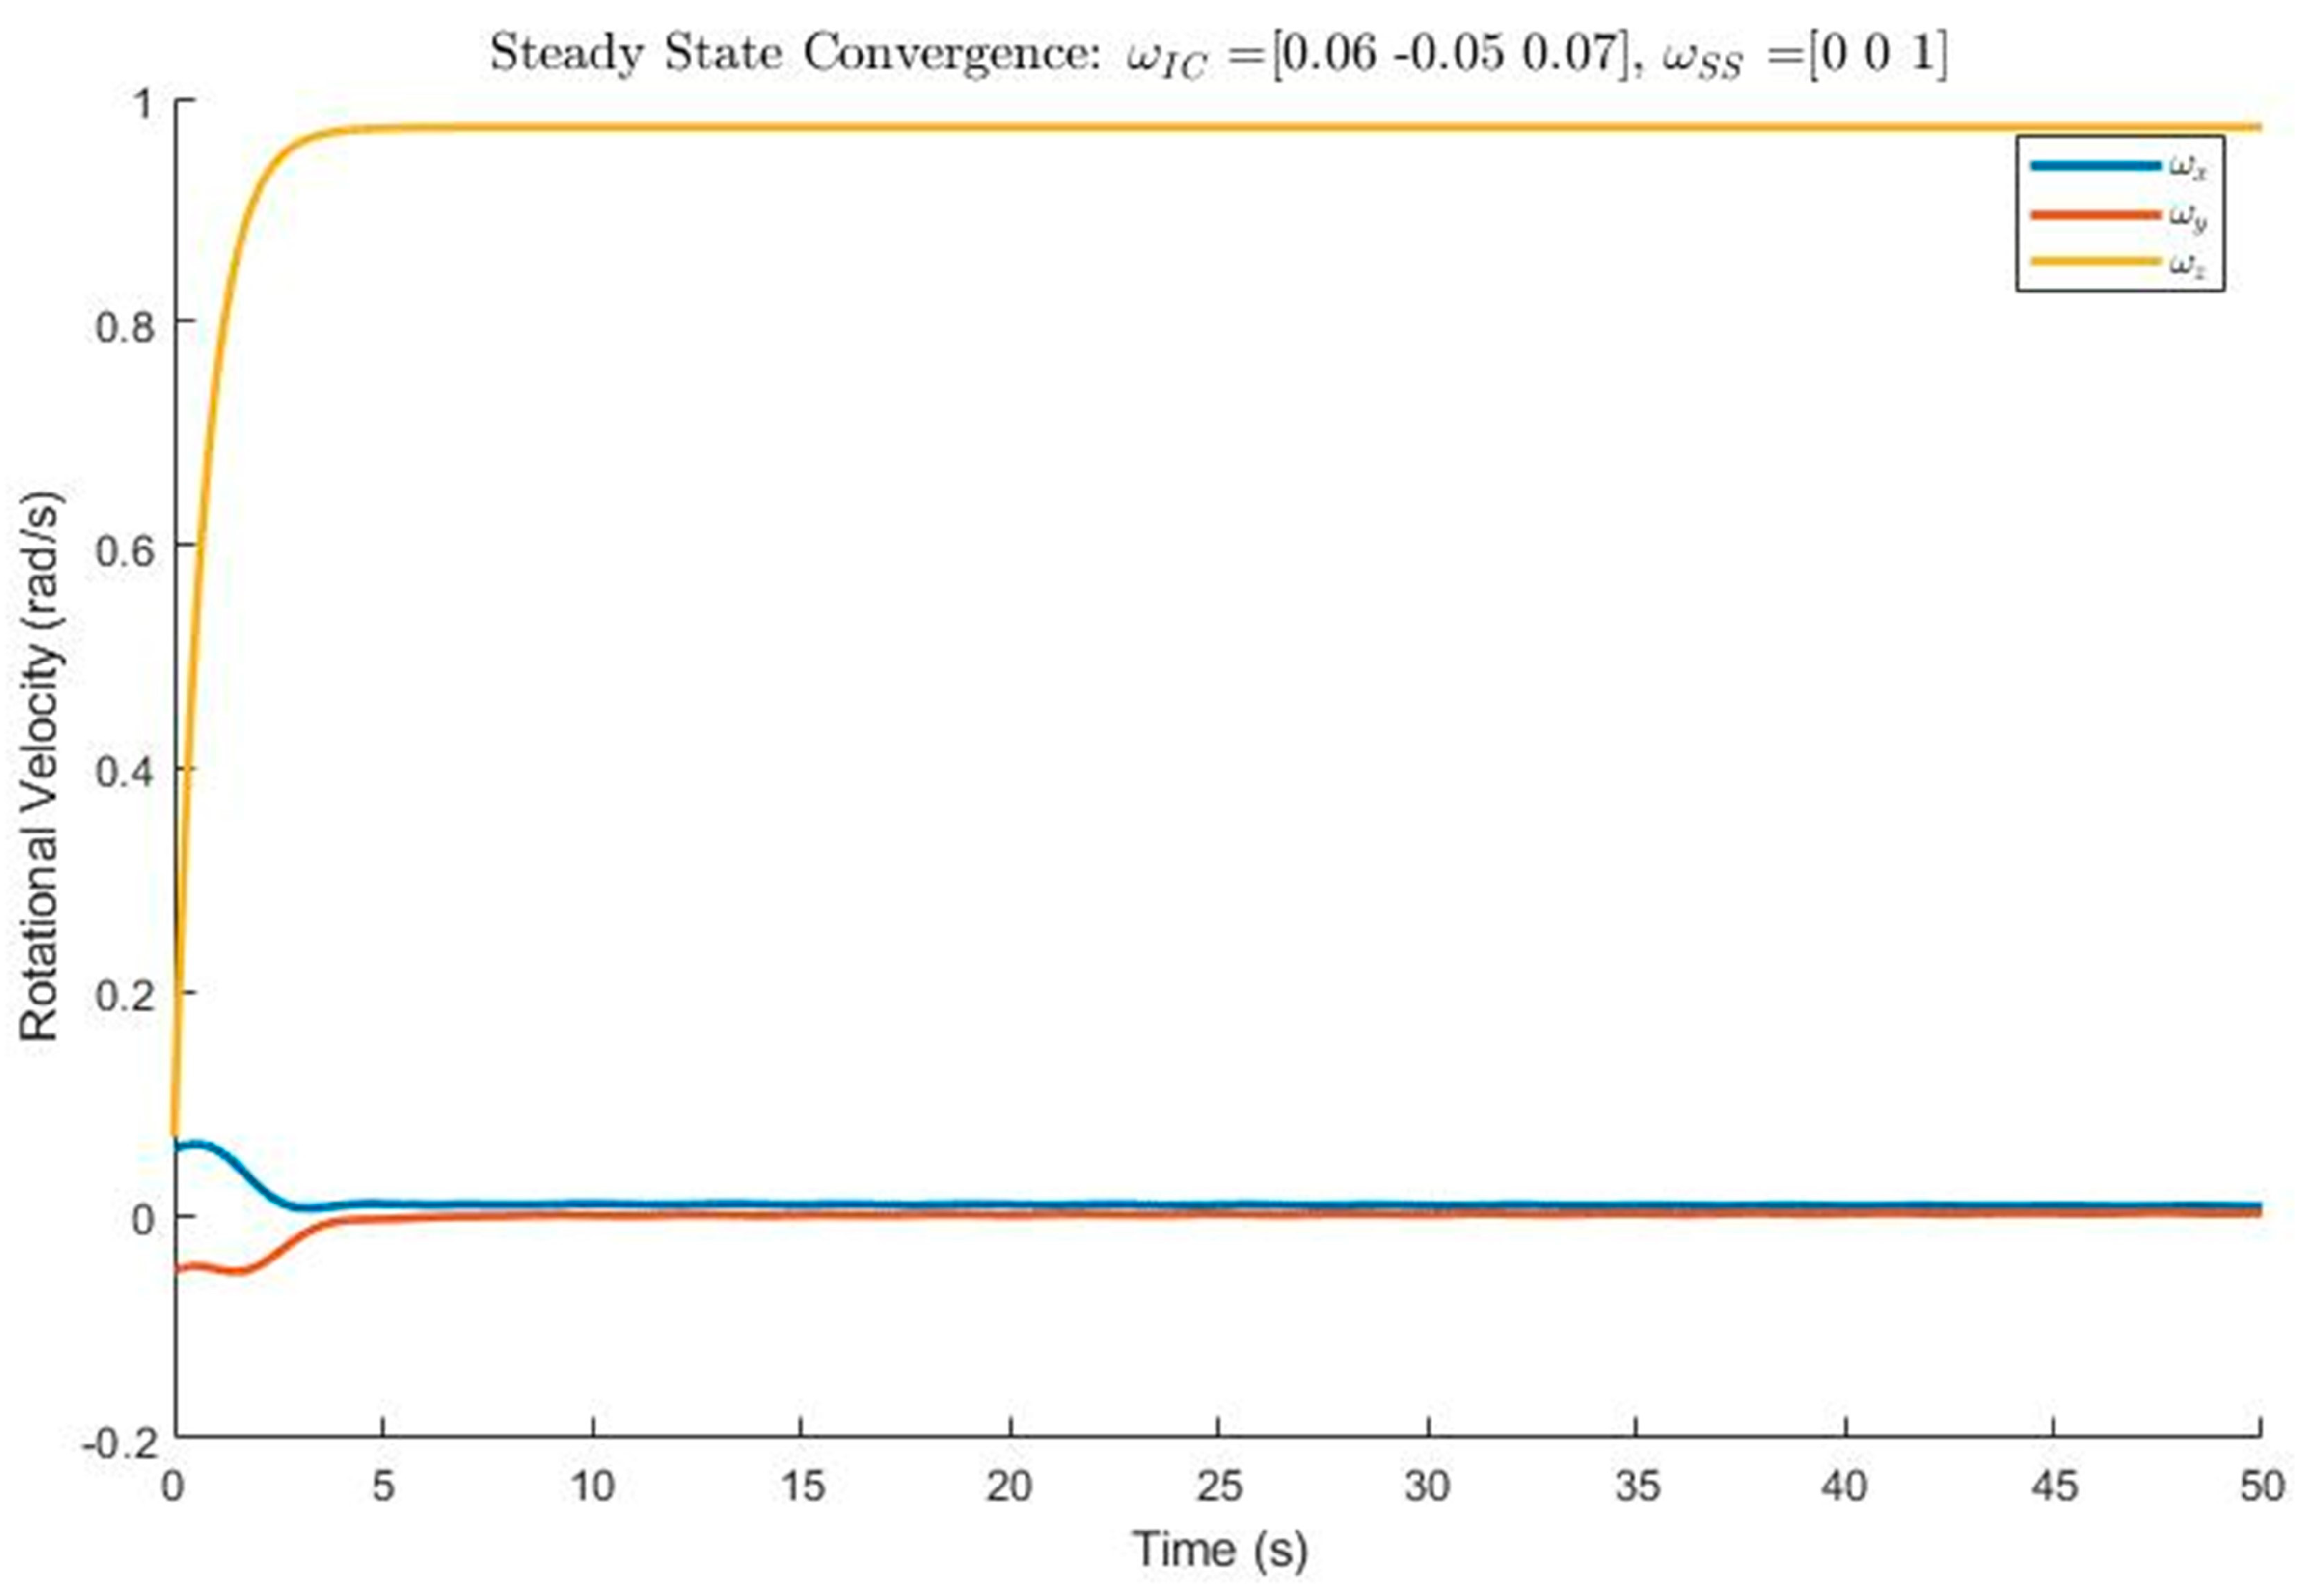
True convergence of Kane controller.
Figure 36.
True convergence of Kane controller.
Figure 37.
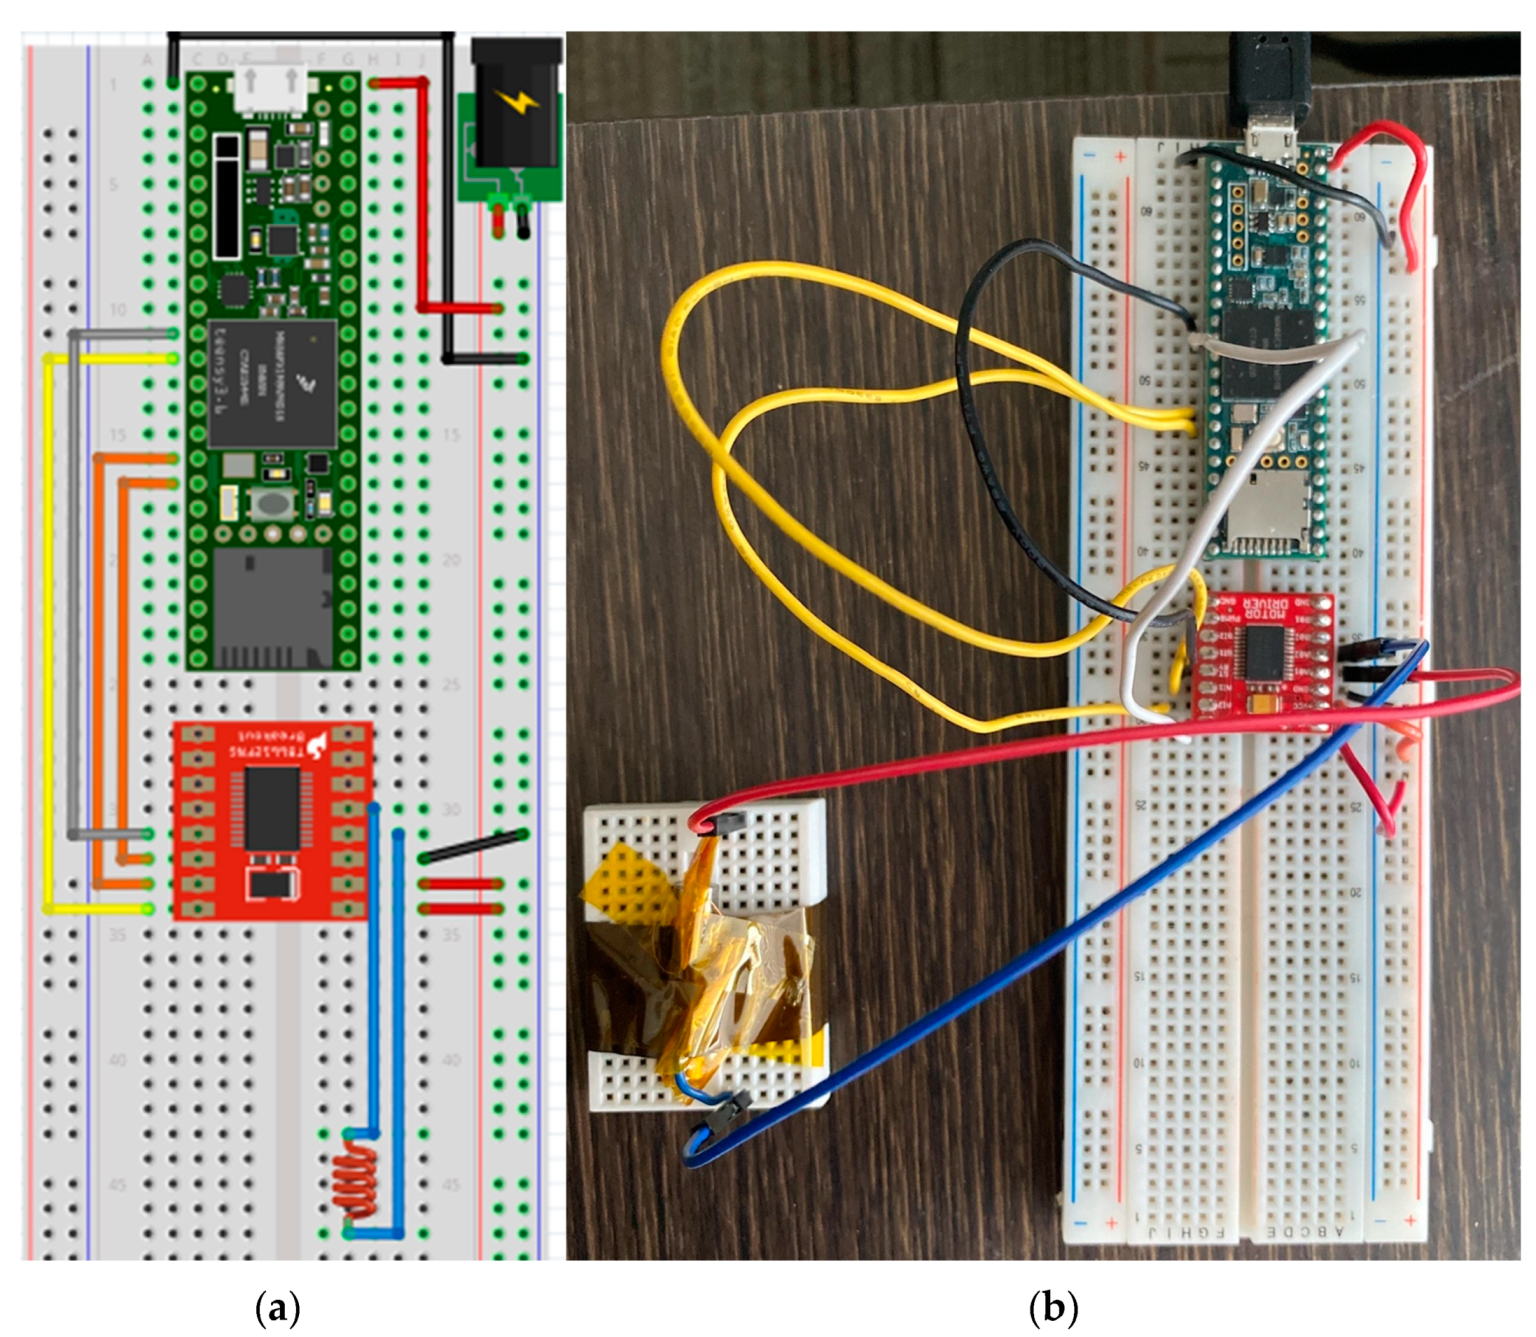
Circuit setup (a) Wire diagram of the ACS endurance testing; (b) Live picture of setup as tested.
Figure 37.
Circuit setup (a) Wire diagram of the ACS endurance testing; (b) Live picture of setup as tested.
Figure 38.
The gyrocompass measuring the magnetic field of the torque coil.
Figure 38.
The gyrocompass measuring the magnetic field of the torque coil.
Figure 39.
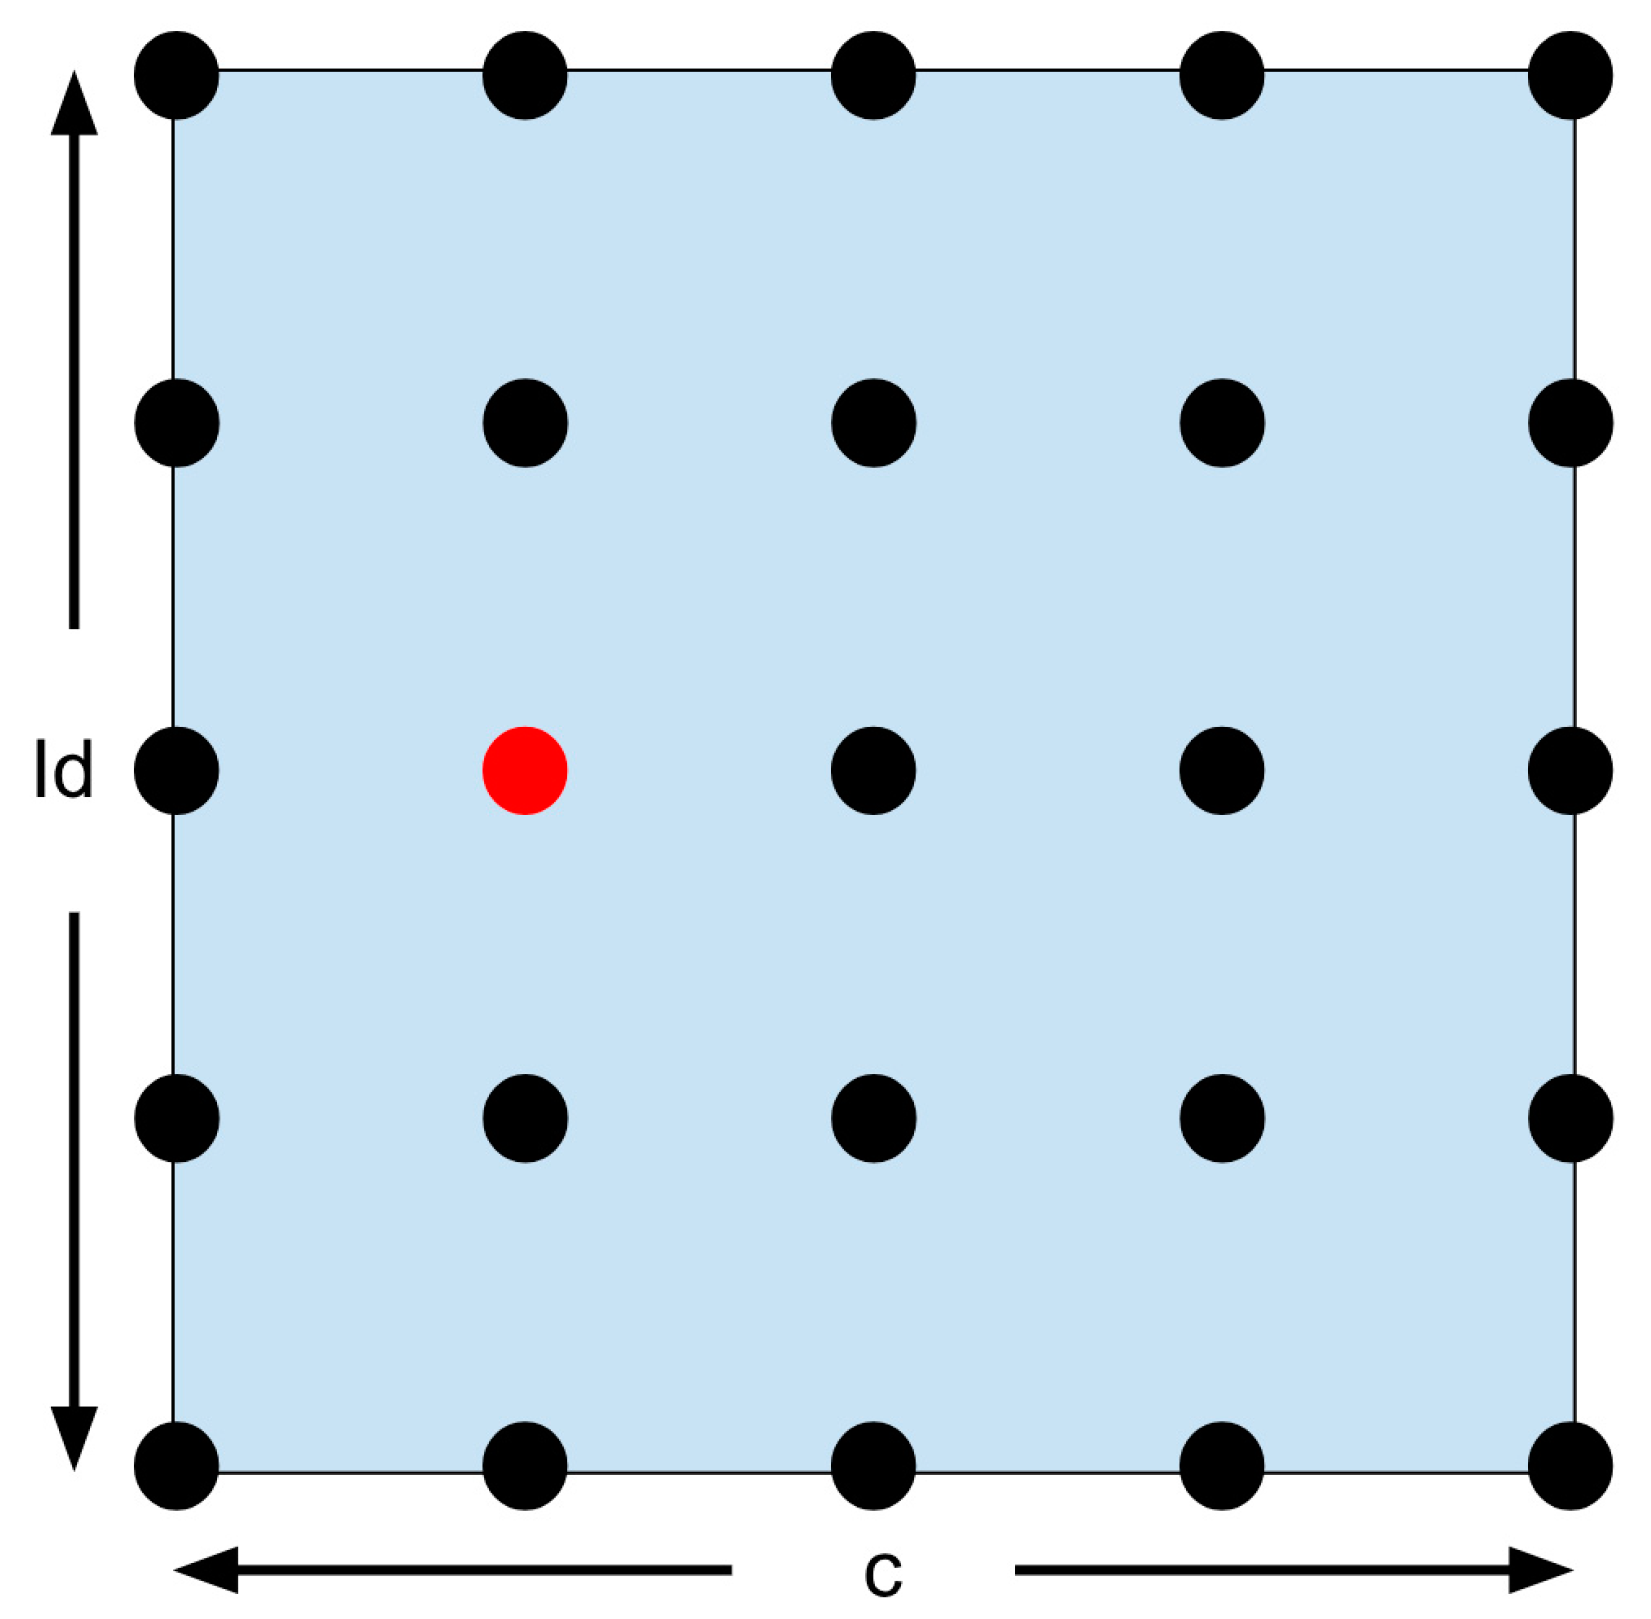
Confining search algorithm. The red dot symbolizes optimal result, within resolution of the search algorithm.
Figure 39.
Confining search algorithm. The red dot symbolizes optimal result, within resolution of the search algorithm.
Figure 40.
Zoomed-in search region. The red square symbolizes the region in which the optimal solution lies.
Figure 40.
Zoomed-in search region. The red square symbolizes the region in which the optimal solution lies.
Figure 41.
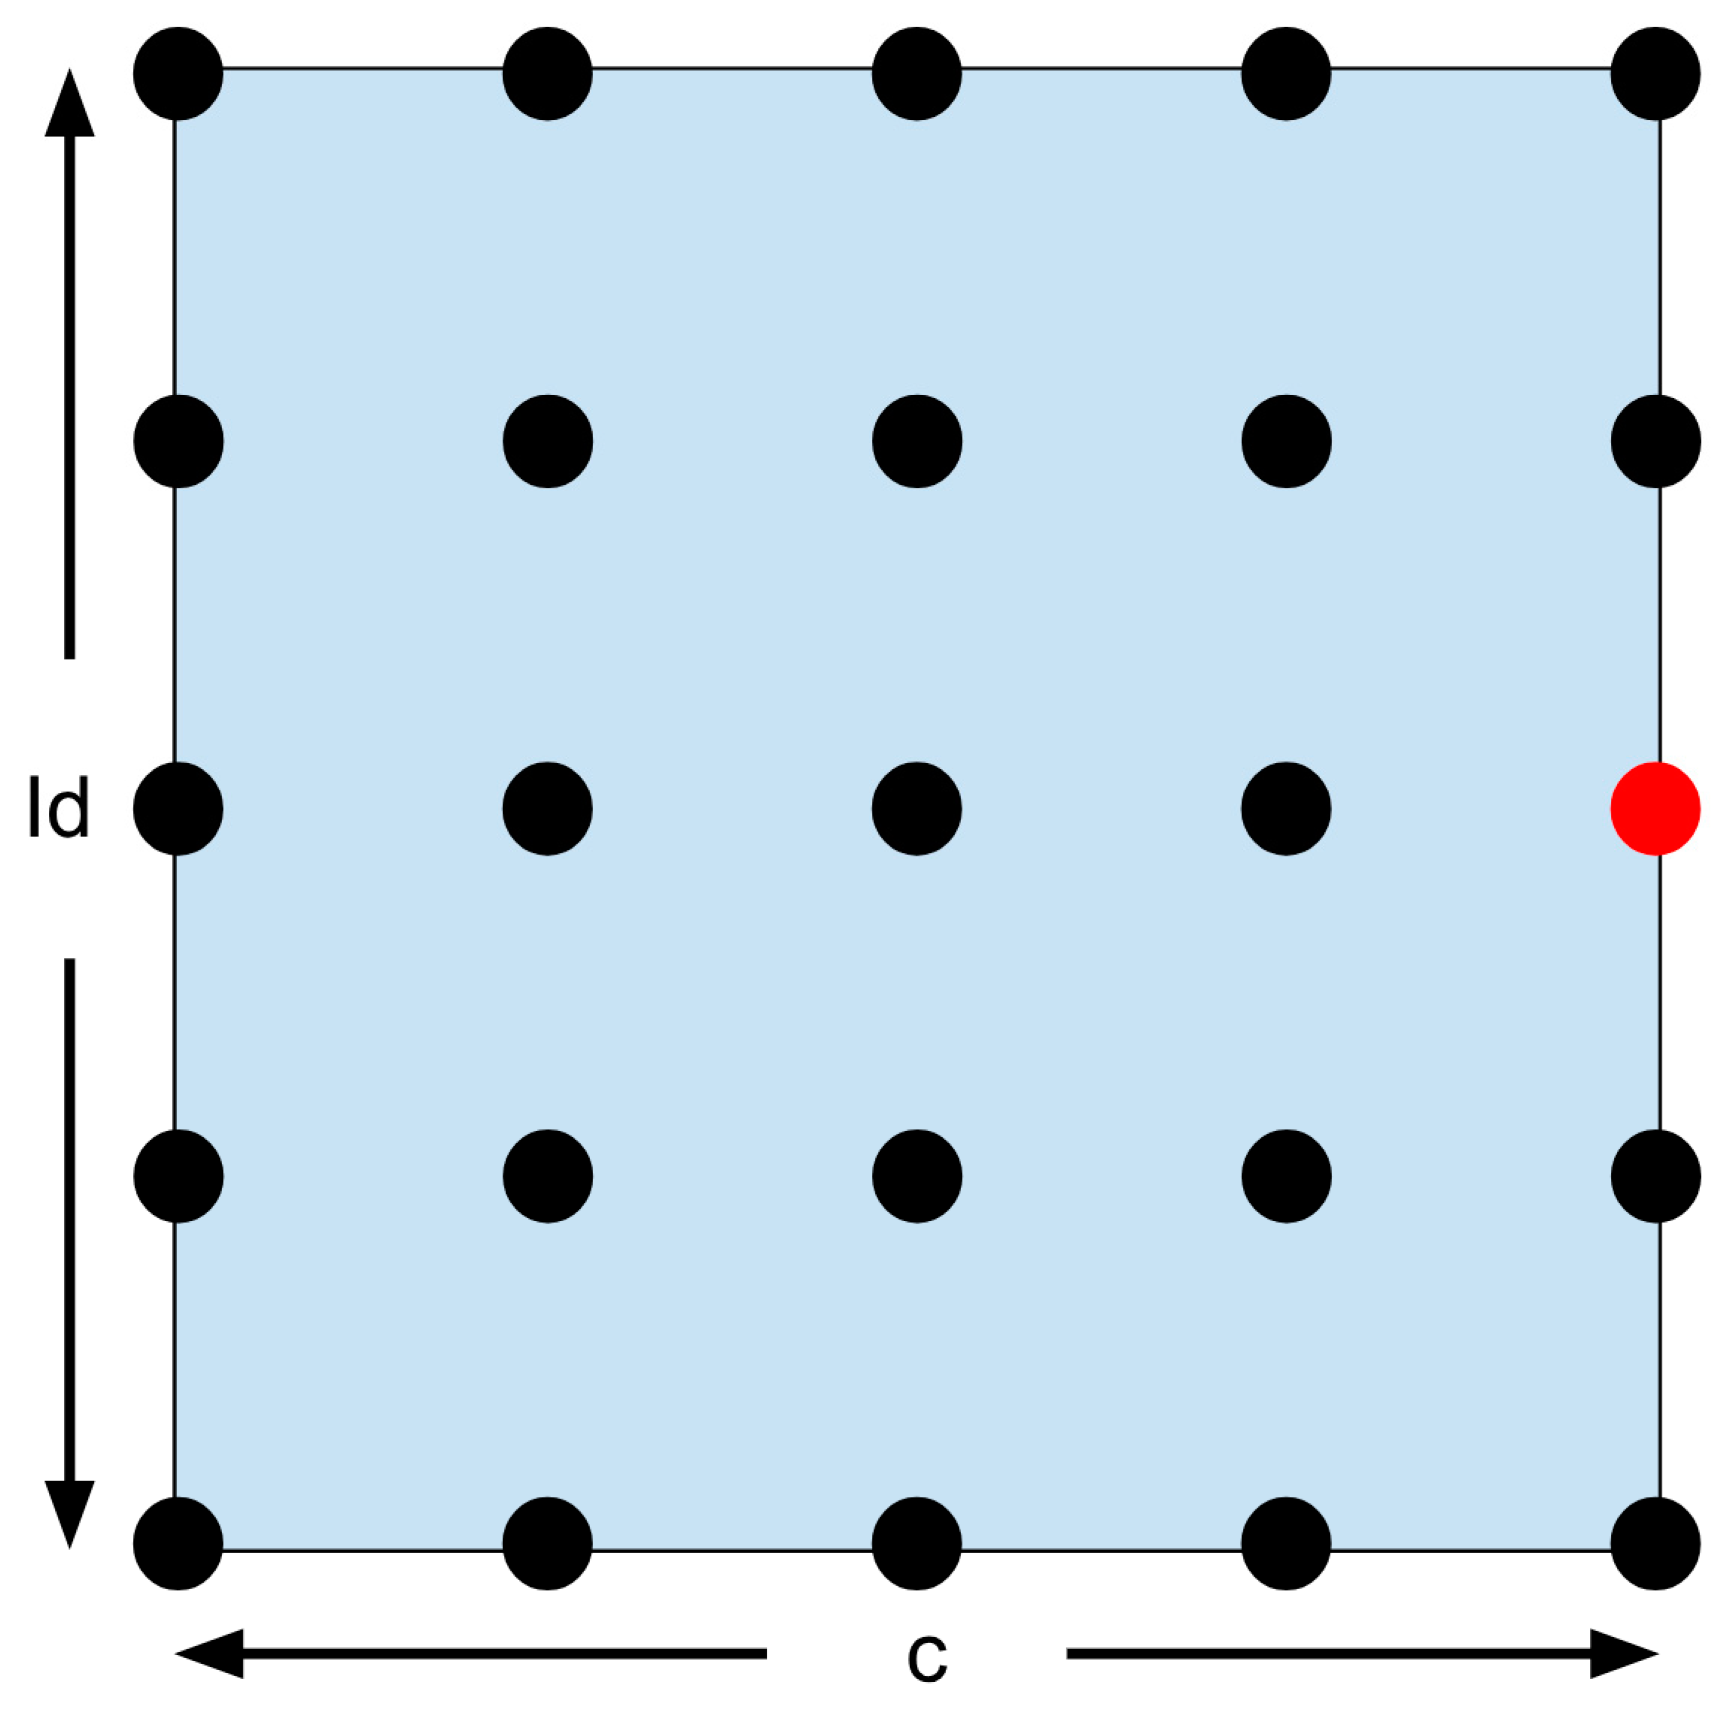
Optimal solution found on the border. This is shown by the red dot.
Figure 41.
Optimal solution found on the border. This is shown by the red dot.
Figure 42.
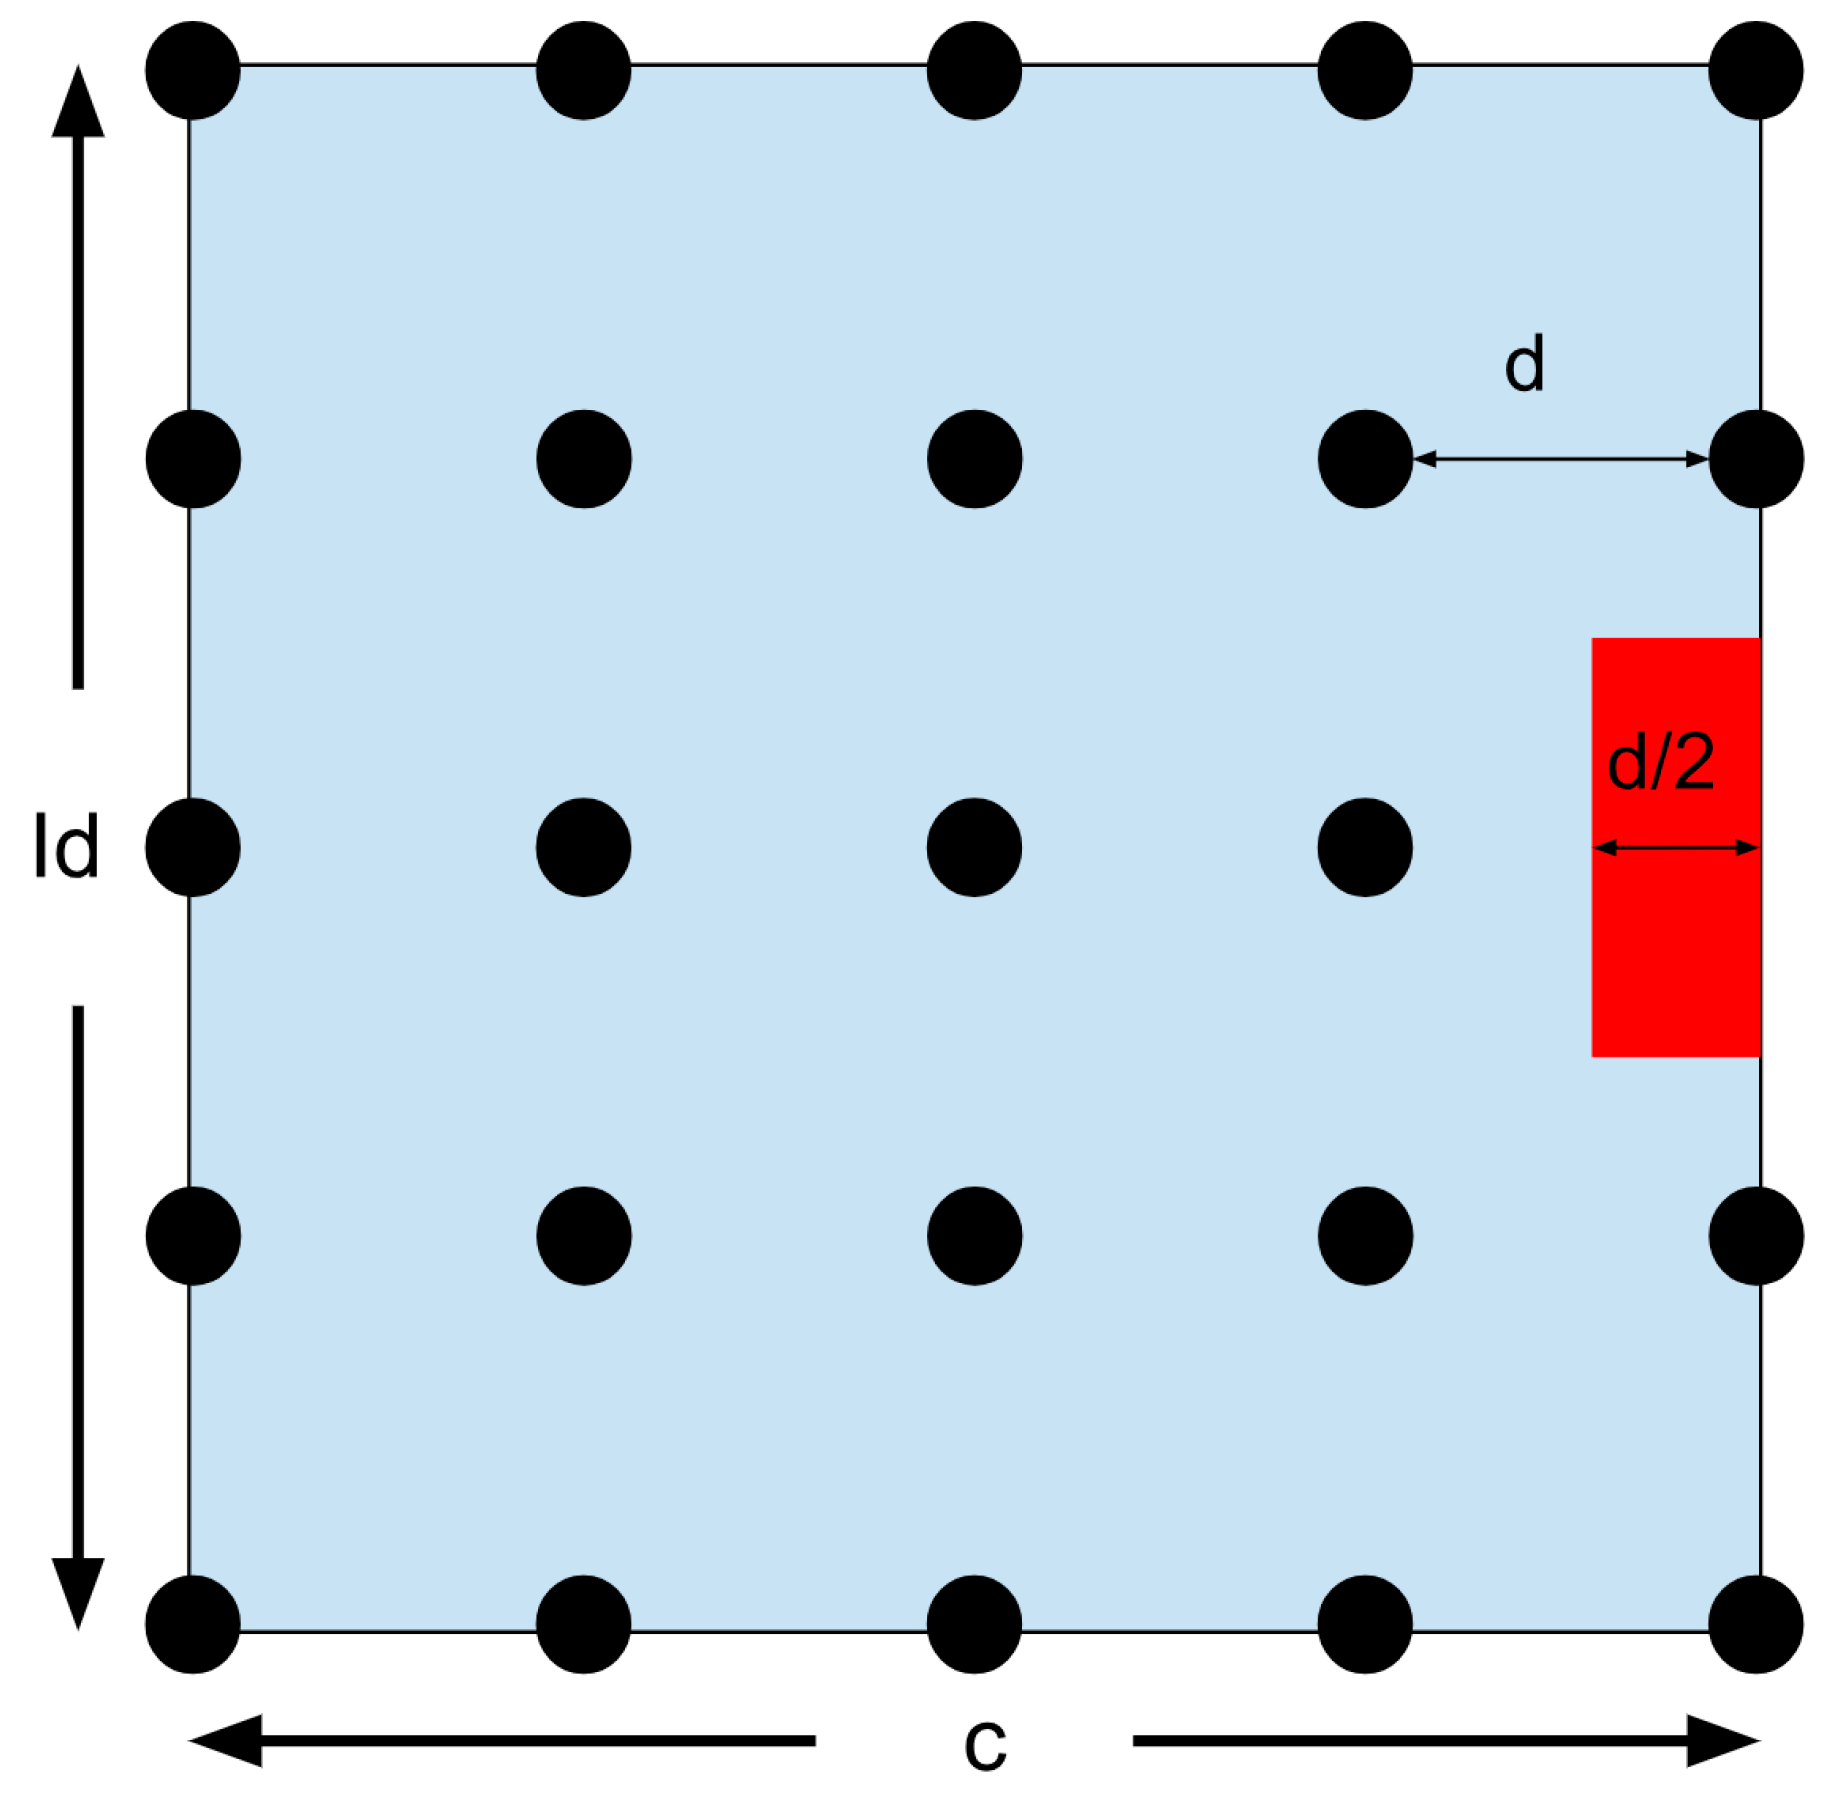
Borderline search region with autonomous search region expansion. The red square symbolizes a growth in the search region in order to search beyond the boarder.
Figure 42.
Borderline search region with autonomous search region expansion. The red square symbolizes a growth in the search region in order to search beyond the boarder.
Figure 43.
Borderline search region without expansion. The red square symbolizes a decision not to expand the search region, but to confirm a boarder result by searching within the convergence field.
Figure 43.
Borderline search region without expansion. The red square symbolizes a decision not to expand the search region, but to confirm a boarder result by searching within the convergence field.
Figure 44.
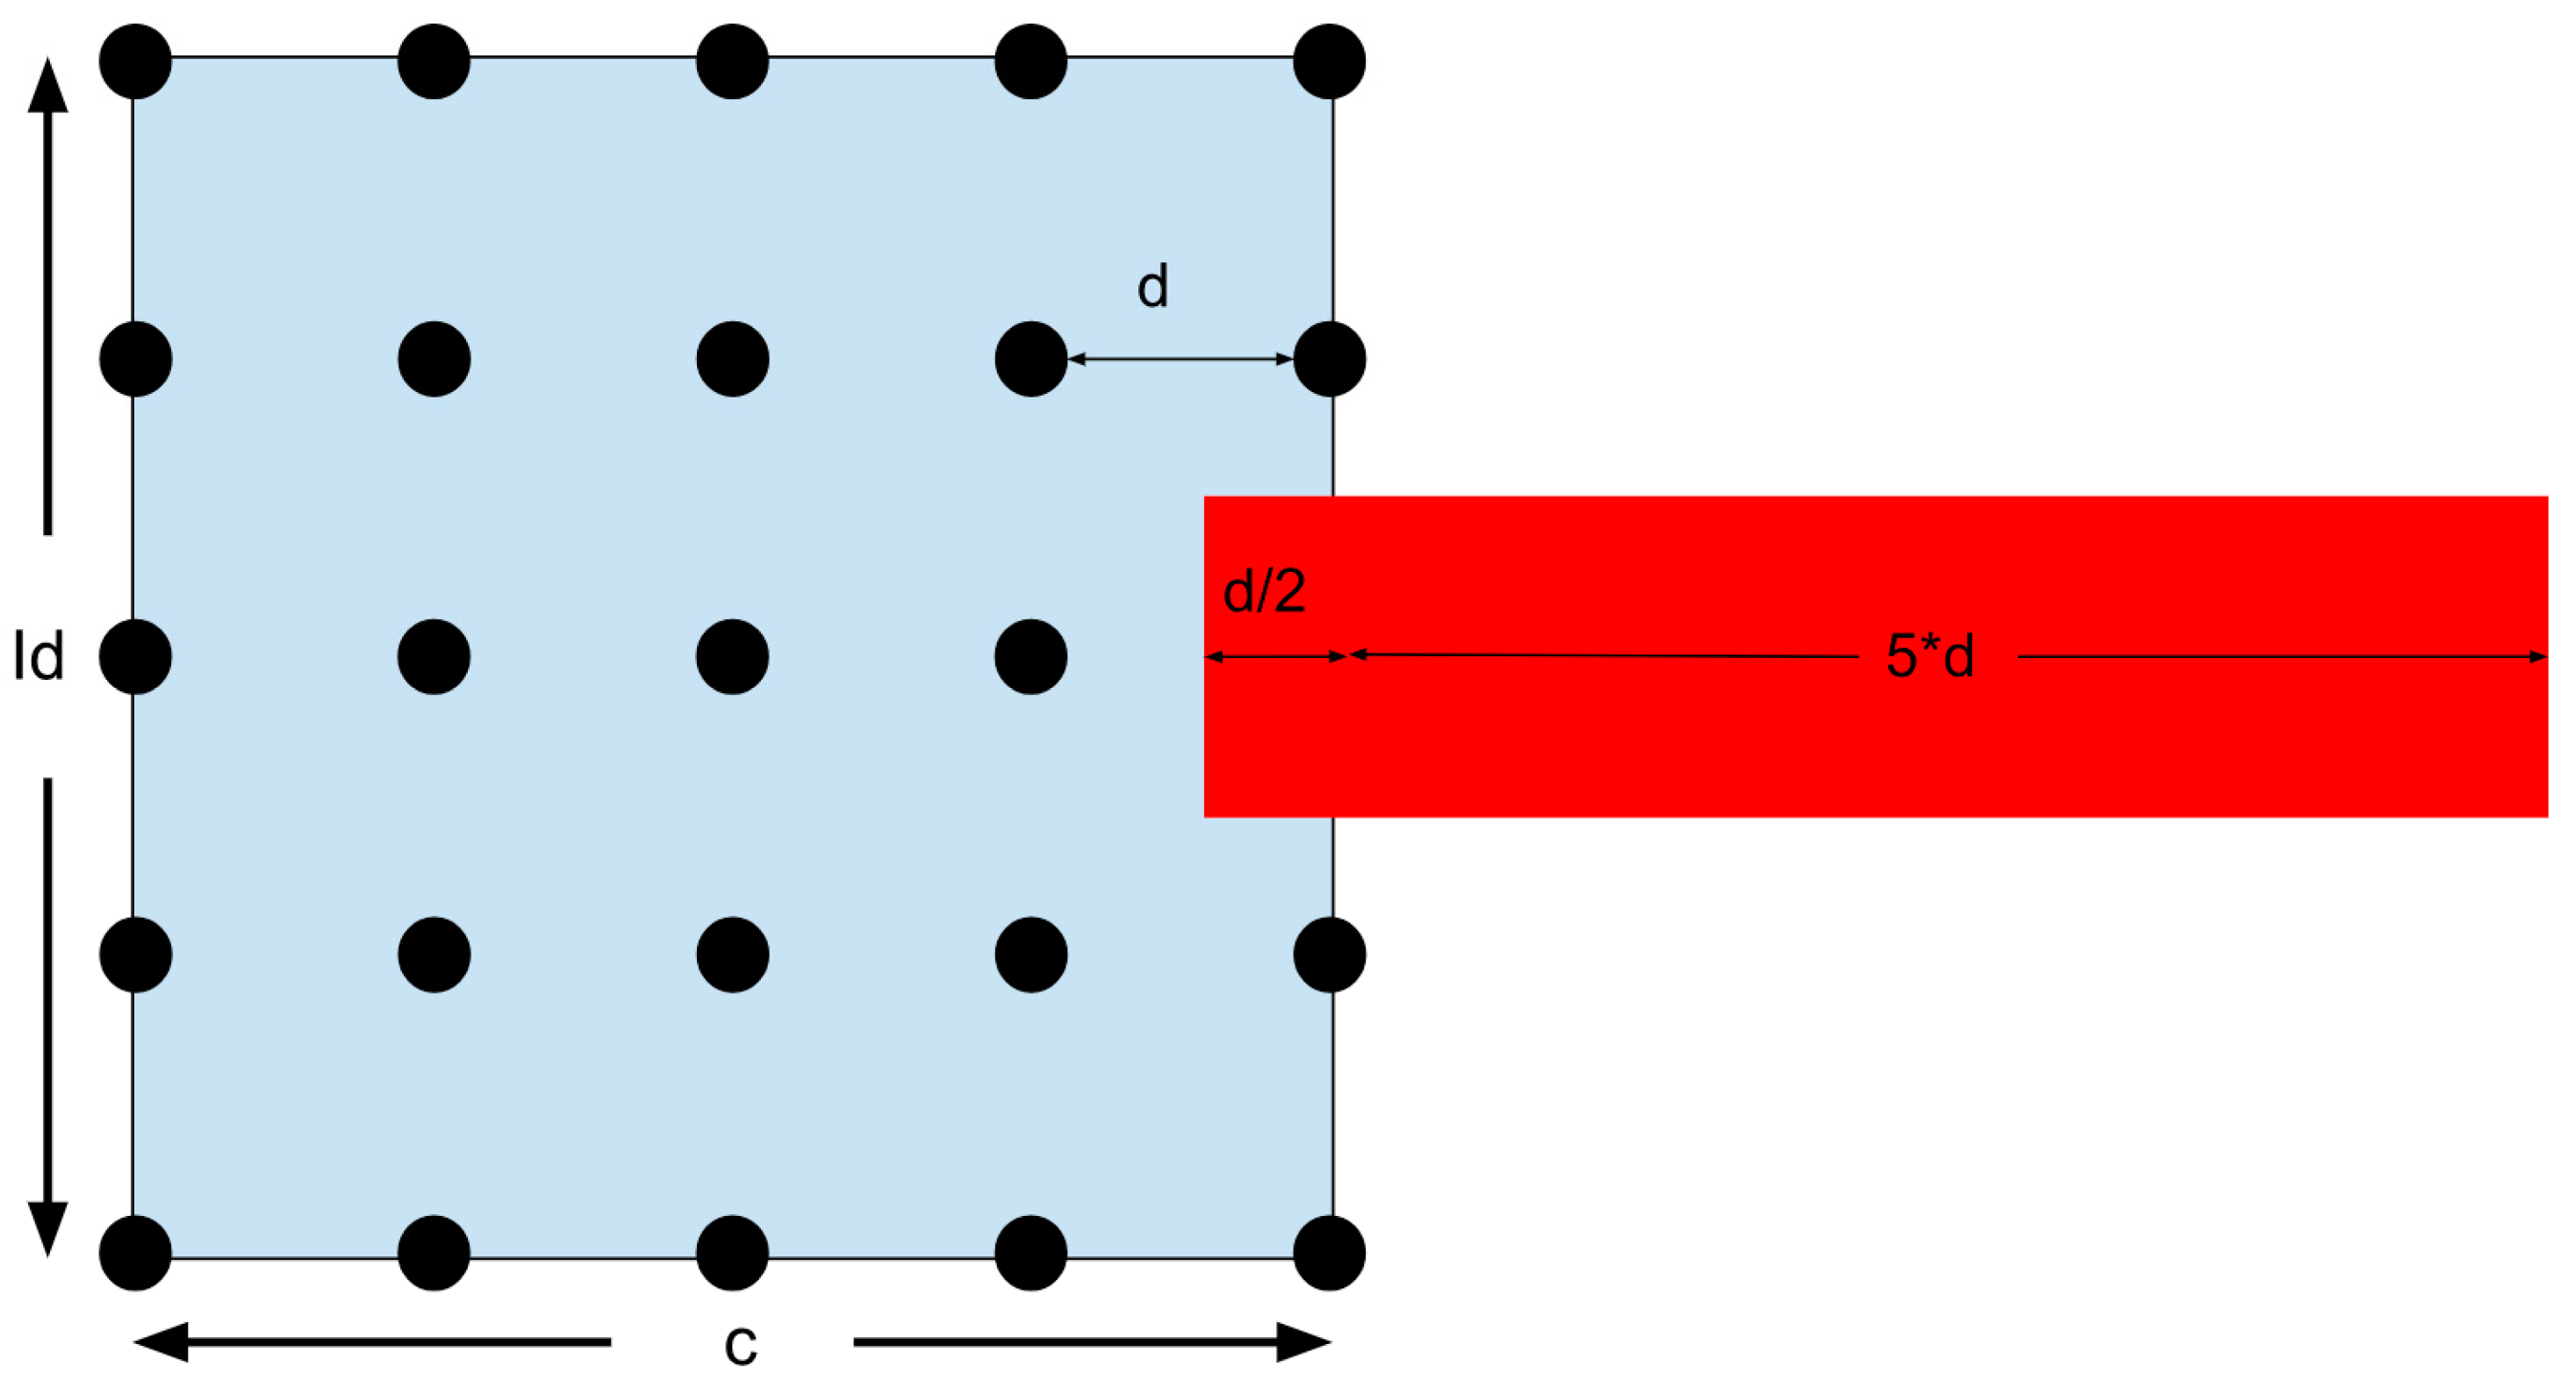
Pseudocode to find optimal Id and c.
Figure 44.
Pseudocode to find optimal Id and c.
Figure 45.
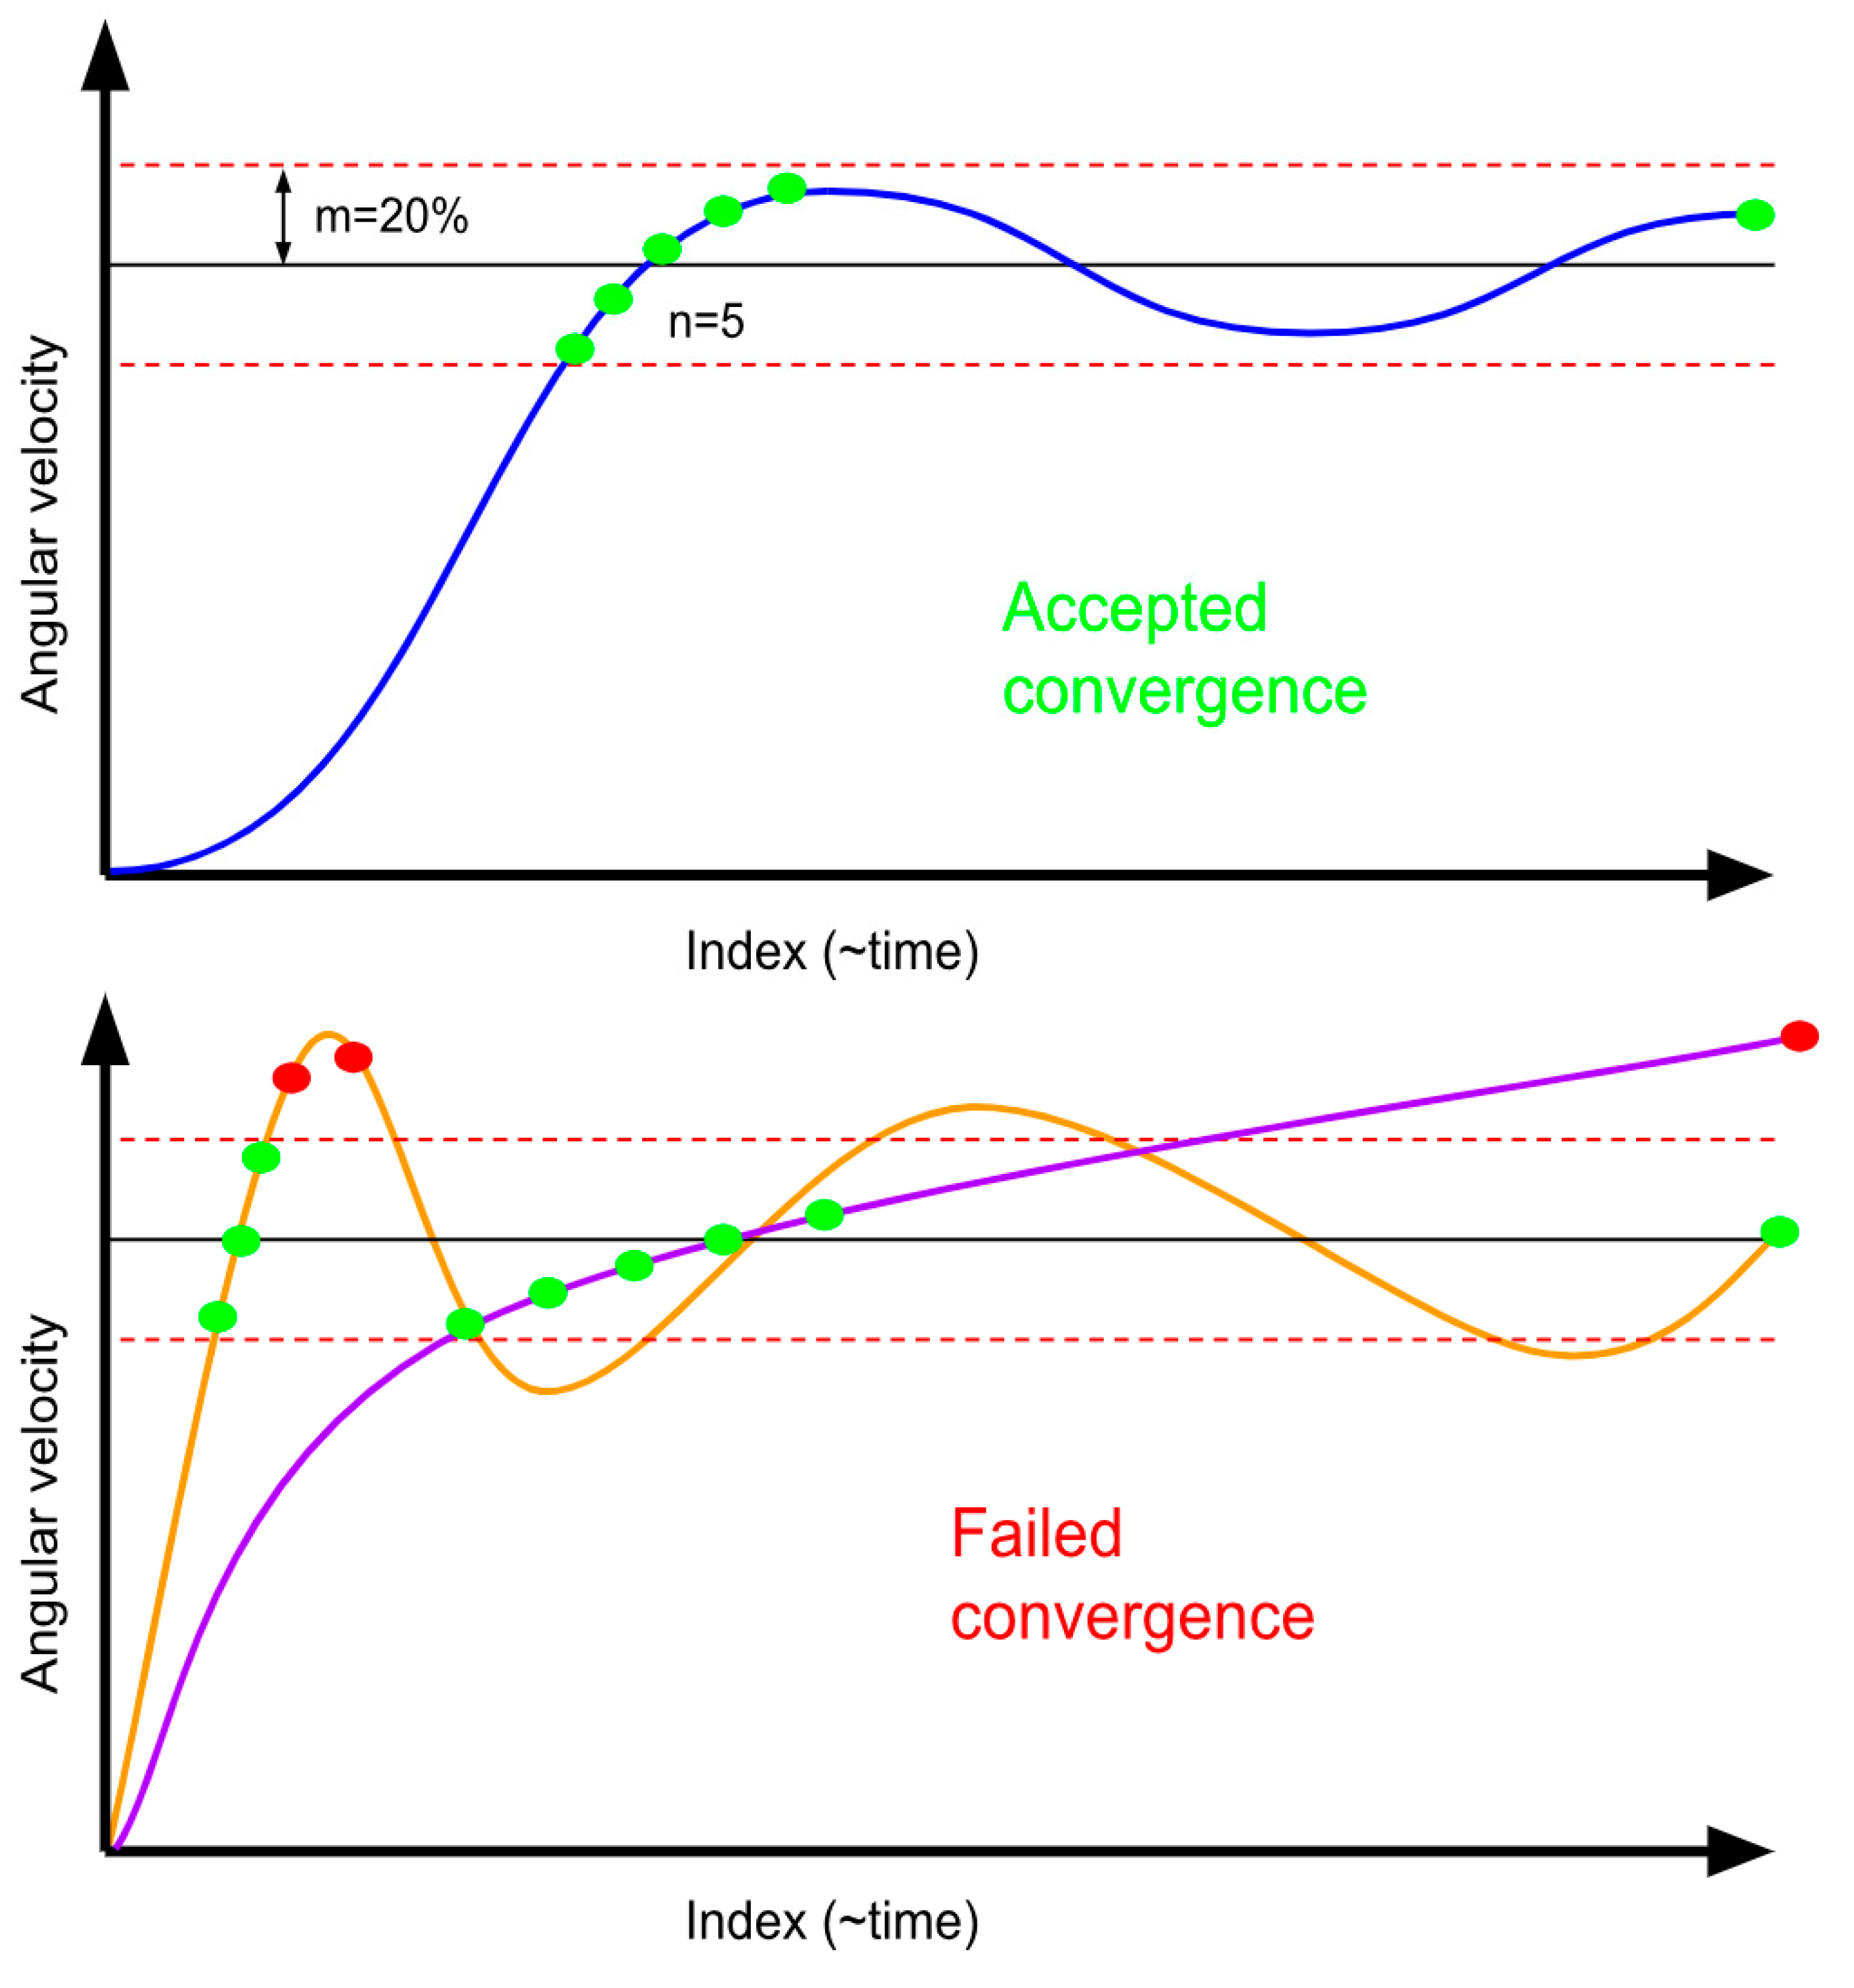
Convergence criteria. n number of points within an m% region of convergence, and the endpoint must lie in the region of convergence. (n = 5 and m = 10).
Figure 45.
Convergence criteria. n number of points within an m% region of convergence, and the endpoint must lie in the region of convergence. (n = 5 and m = 10).
Figure 46.
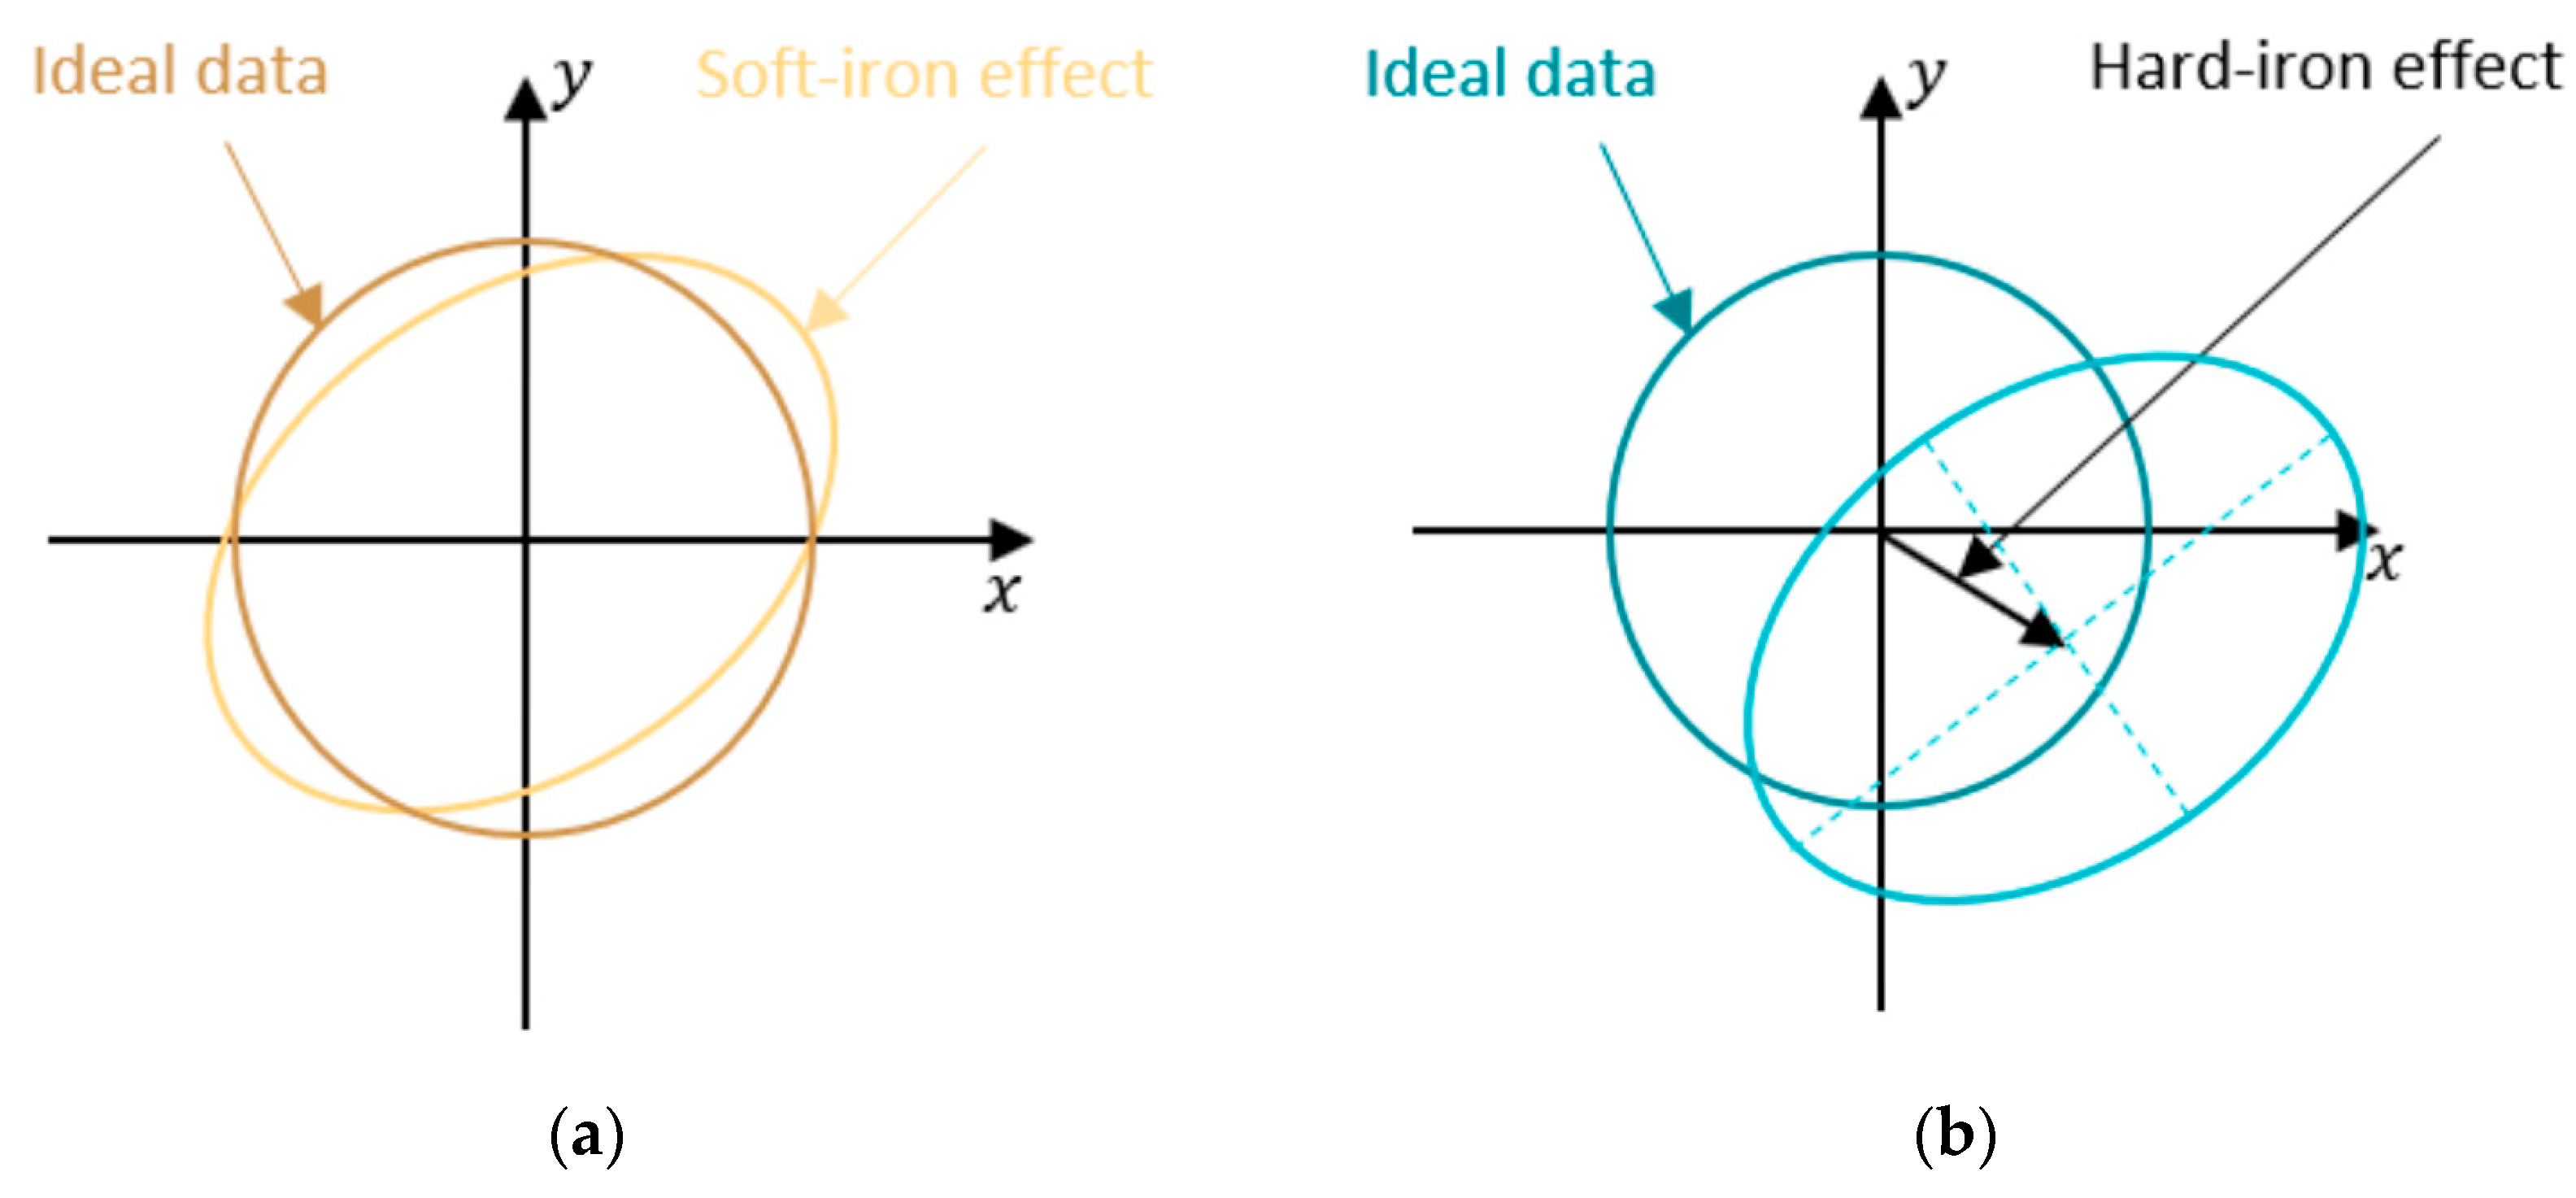
Effects of hard iron and soft iron offsets. (a) Skew matrix, and (b) displacement vector.
Figure 46.
Effects of hard iron and soft iron offsets. (a) Skew matrix, and (b) displacement vector.
Figure 47.
X Coil 3-degree polyfit IMU offsets.
Figure 47.
X Coil 3-degree polyfit IMU offsets.
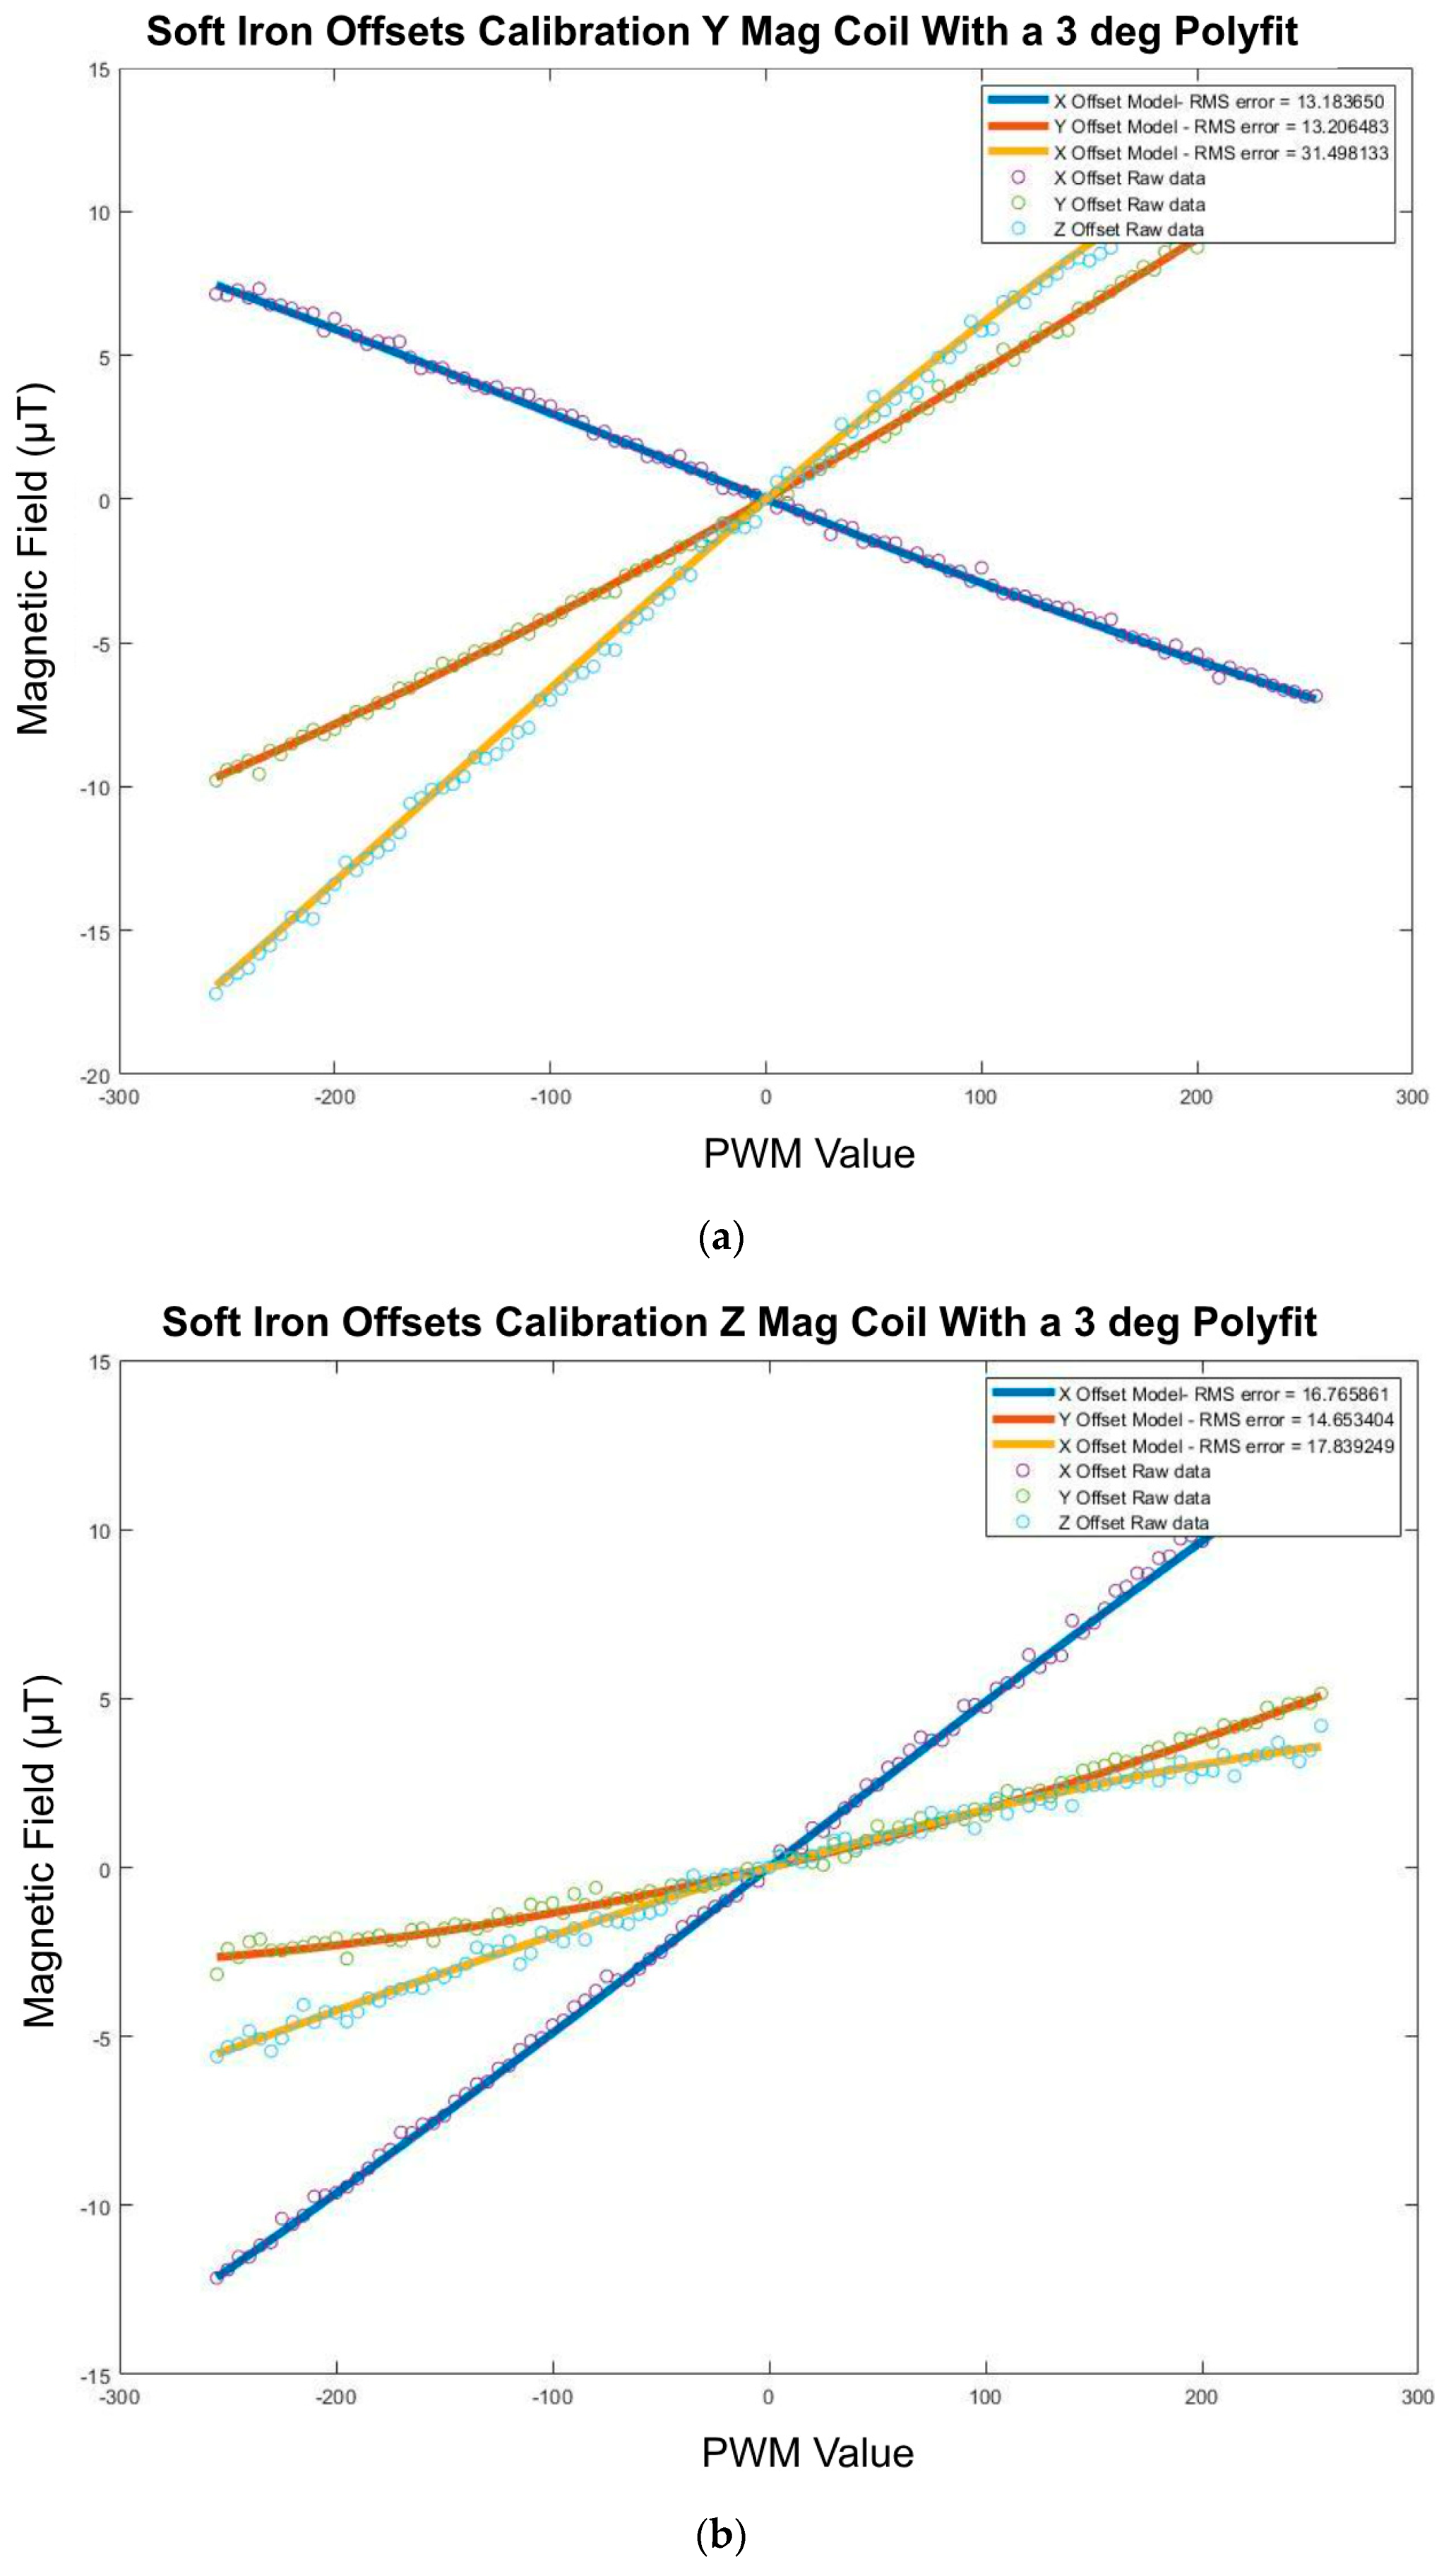
Figure 48.
(a) Y coil 3-degree polyfit IMU offsets. (b) Z coil 3-degree polyfit IMU offsets.
Figure 48.
(a) Y coil 3-degree polyfit IMU offsets. (b) Z coil 3-degree polyfit IMU offsets.
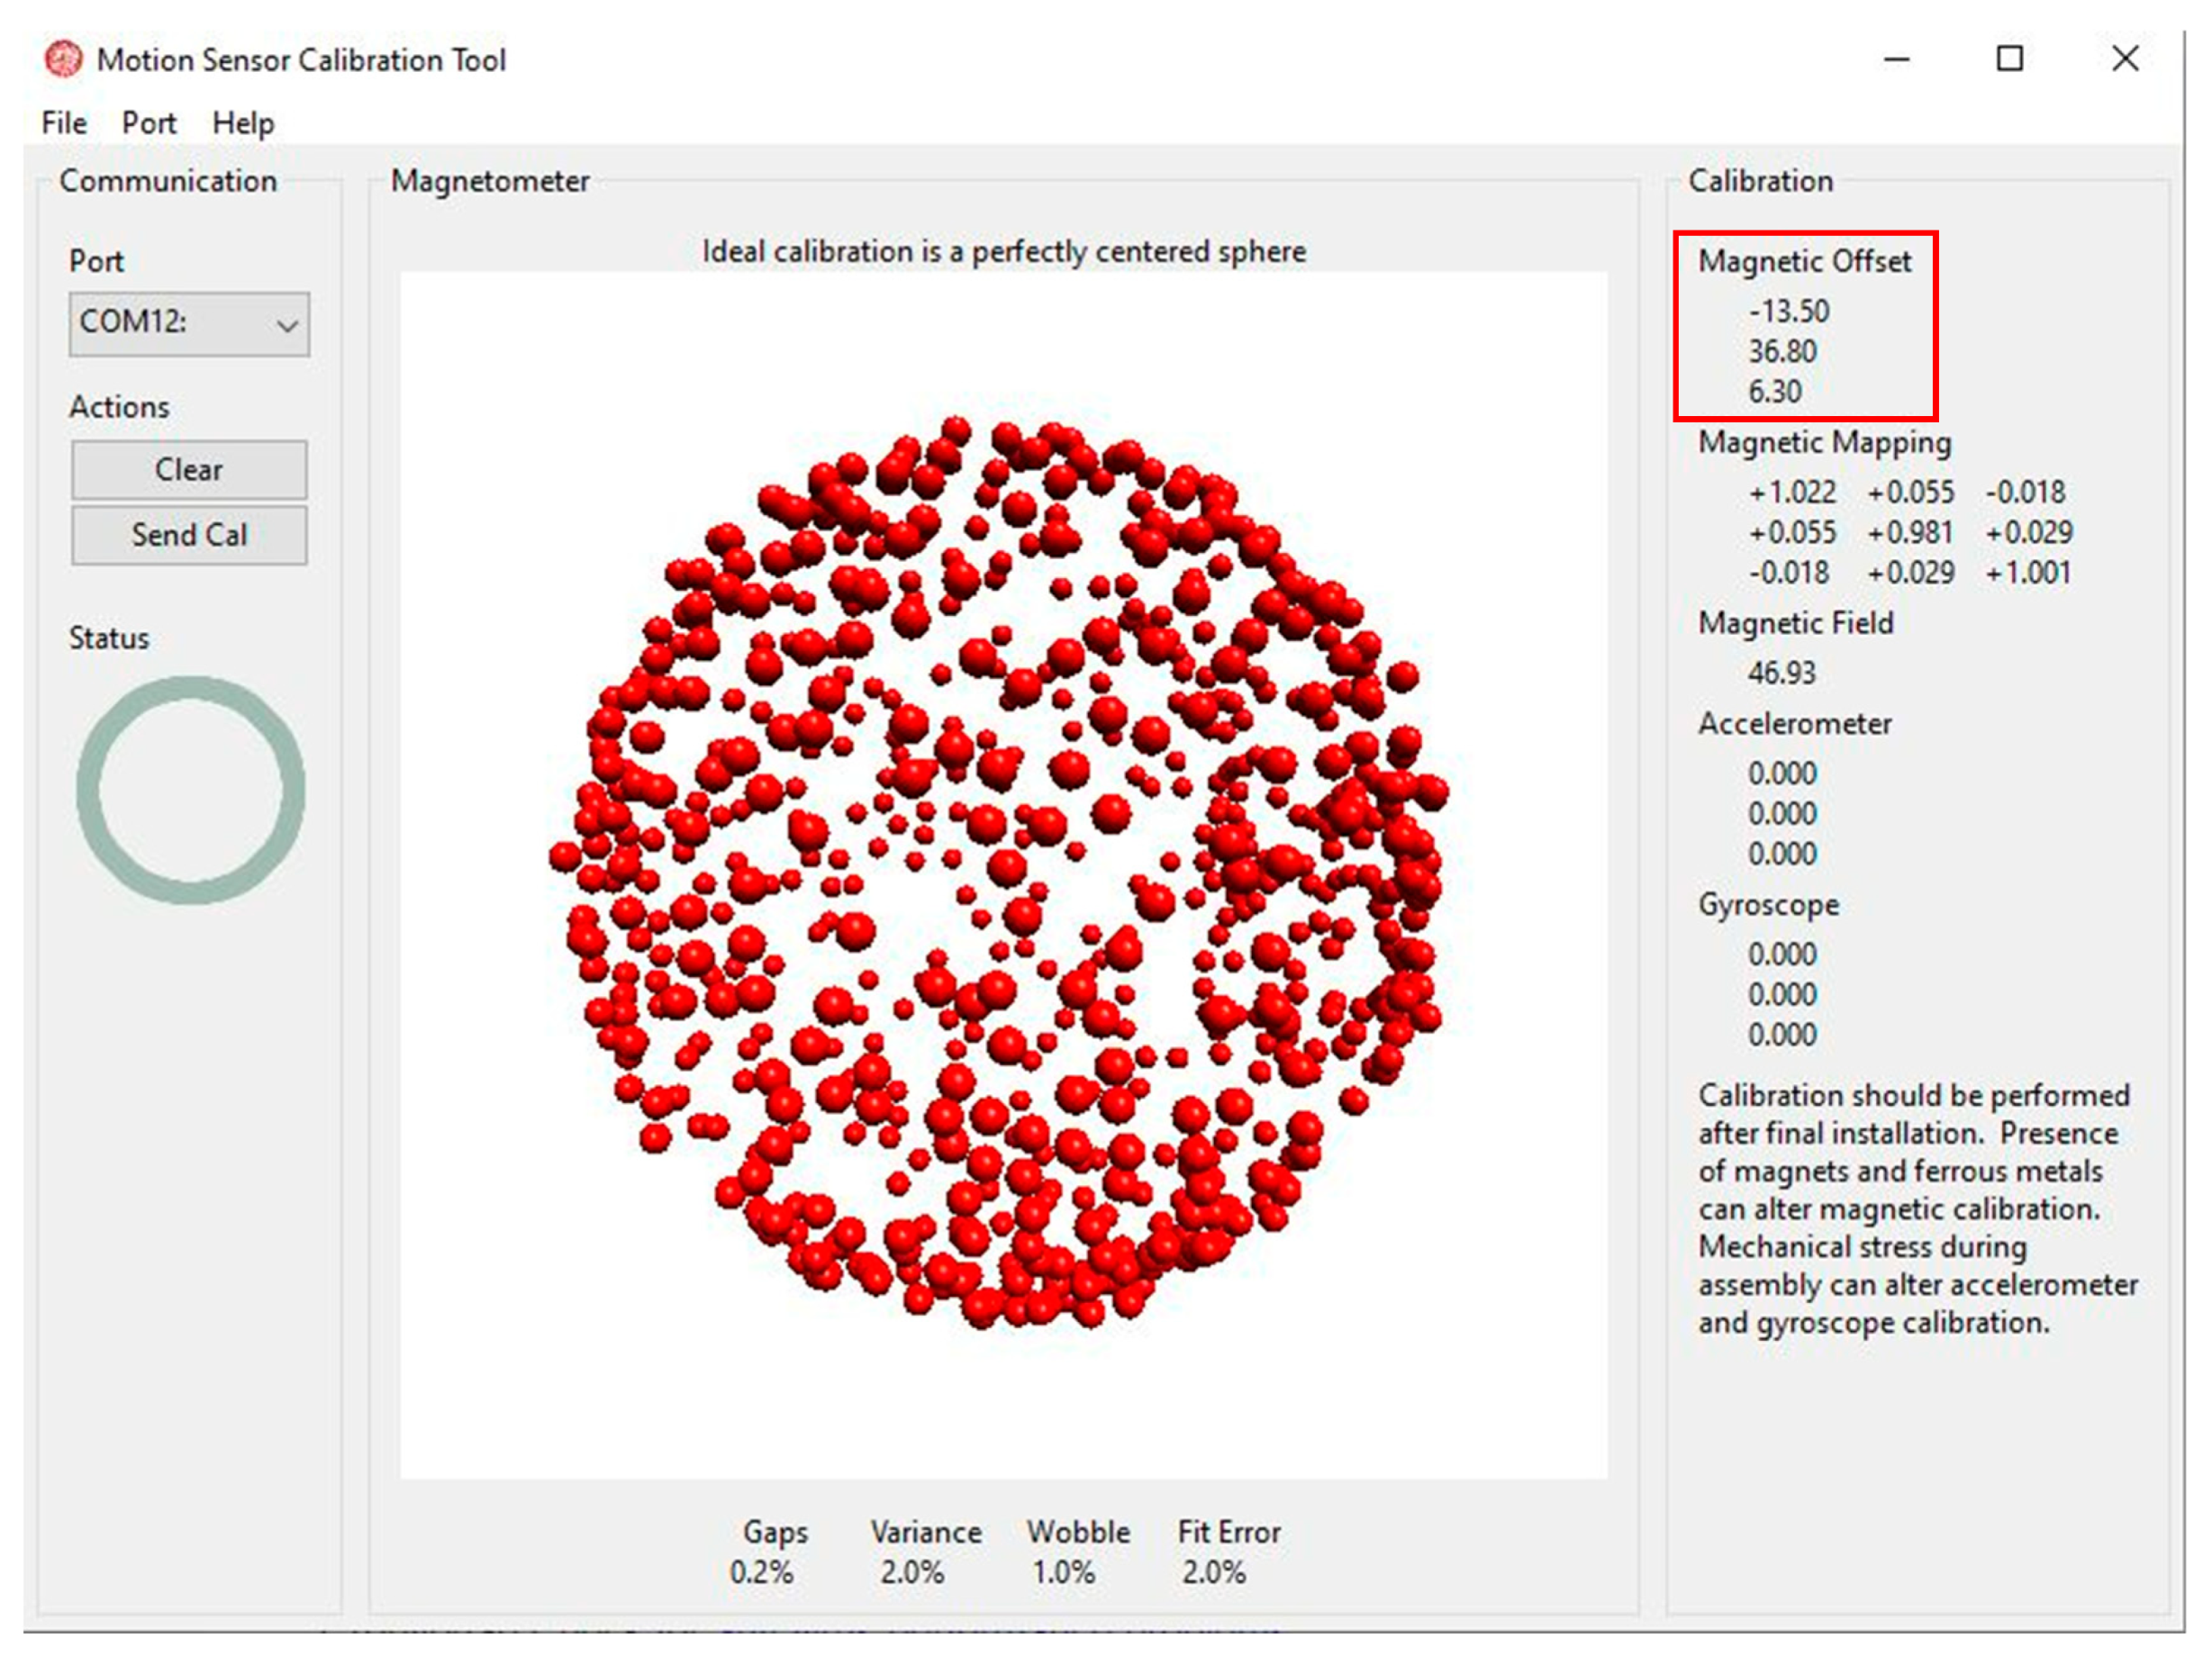
Figure 49.
Motion sensor calibration tool shows hard iron offsets.
Figure 49.
Motion sensor calibration tool shows hard iron offsets.
Figure 50.
Negligible hysteresis error in temperature offset. (a) x axis magnetic field offsets as a function of temperature increasing (blue) and decreasing (red); (b) y axis magnetic field offsets; (c) z axis magnetic field offsets.
Figure 50.
Negligible hysteresis error in temperature offset. (a) x axis magnetic field offsets as a function of temperature increasing (blue) and decreasing (red); (b) y axis magnetic field offsets; (c) z axis magnetic field offsets.
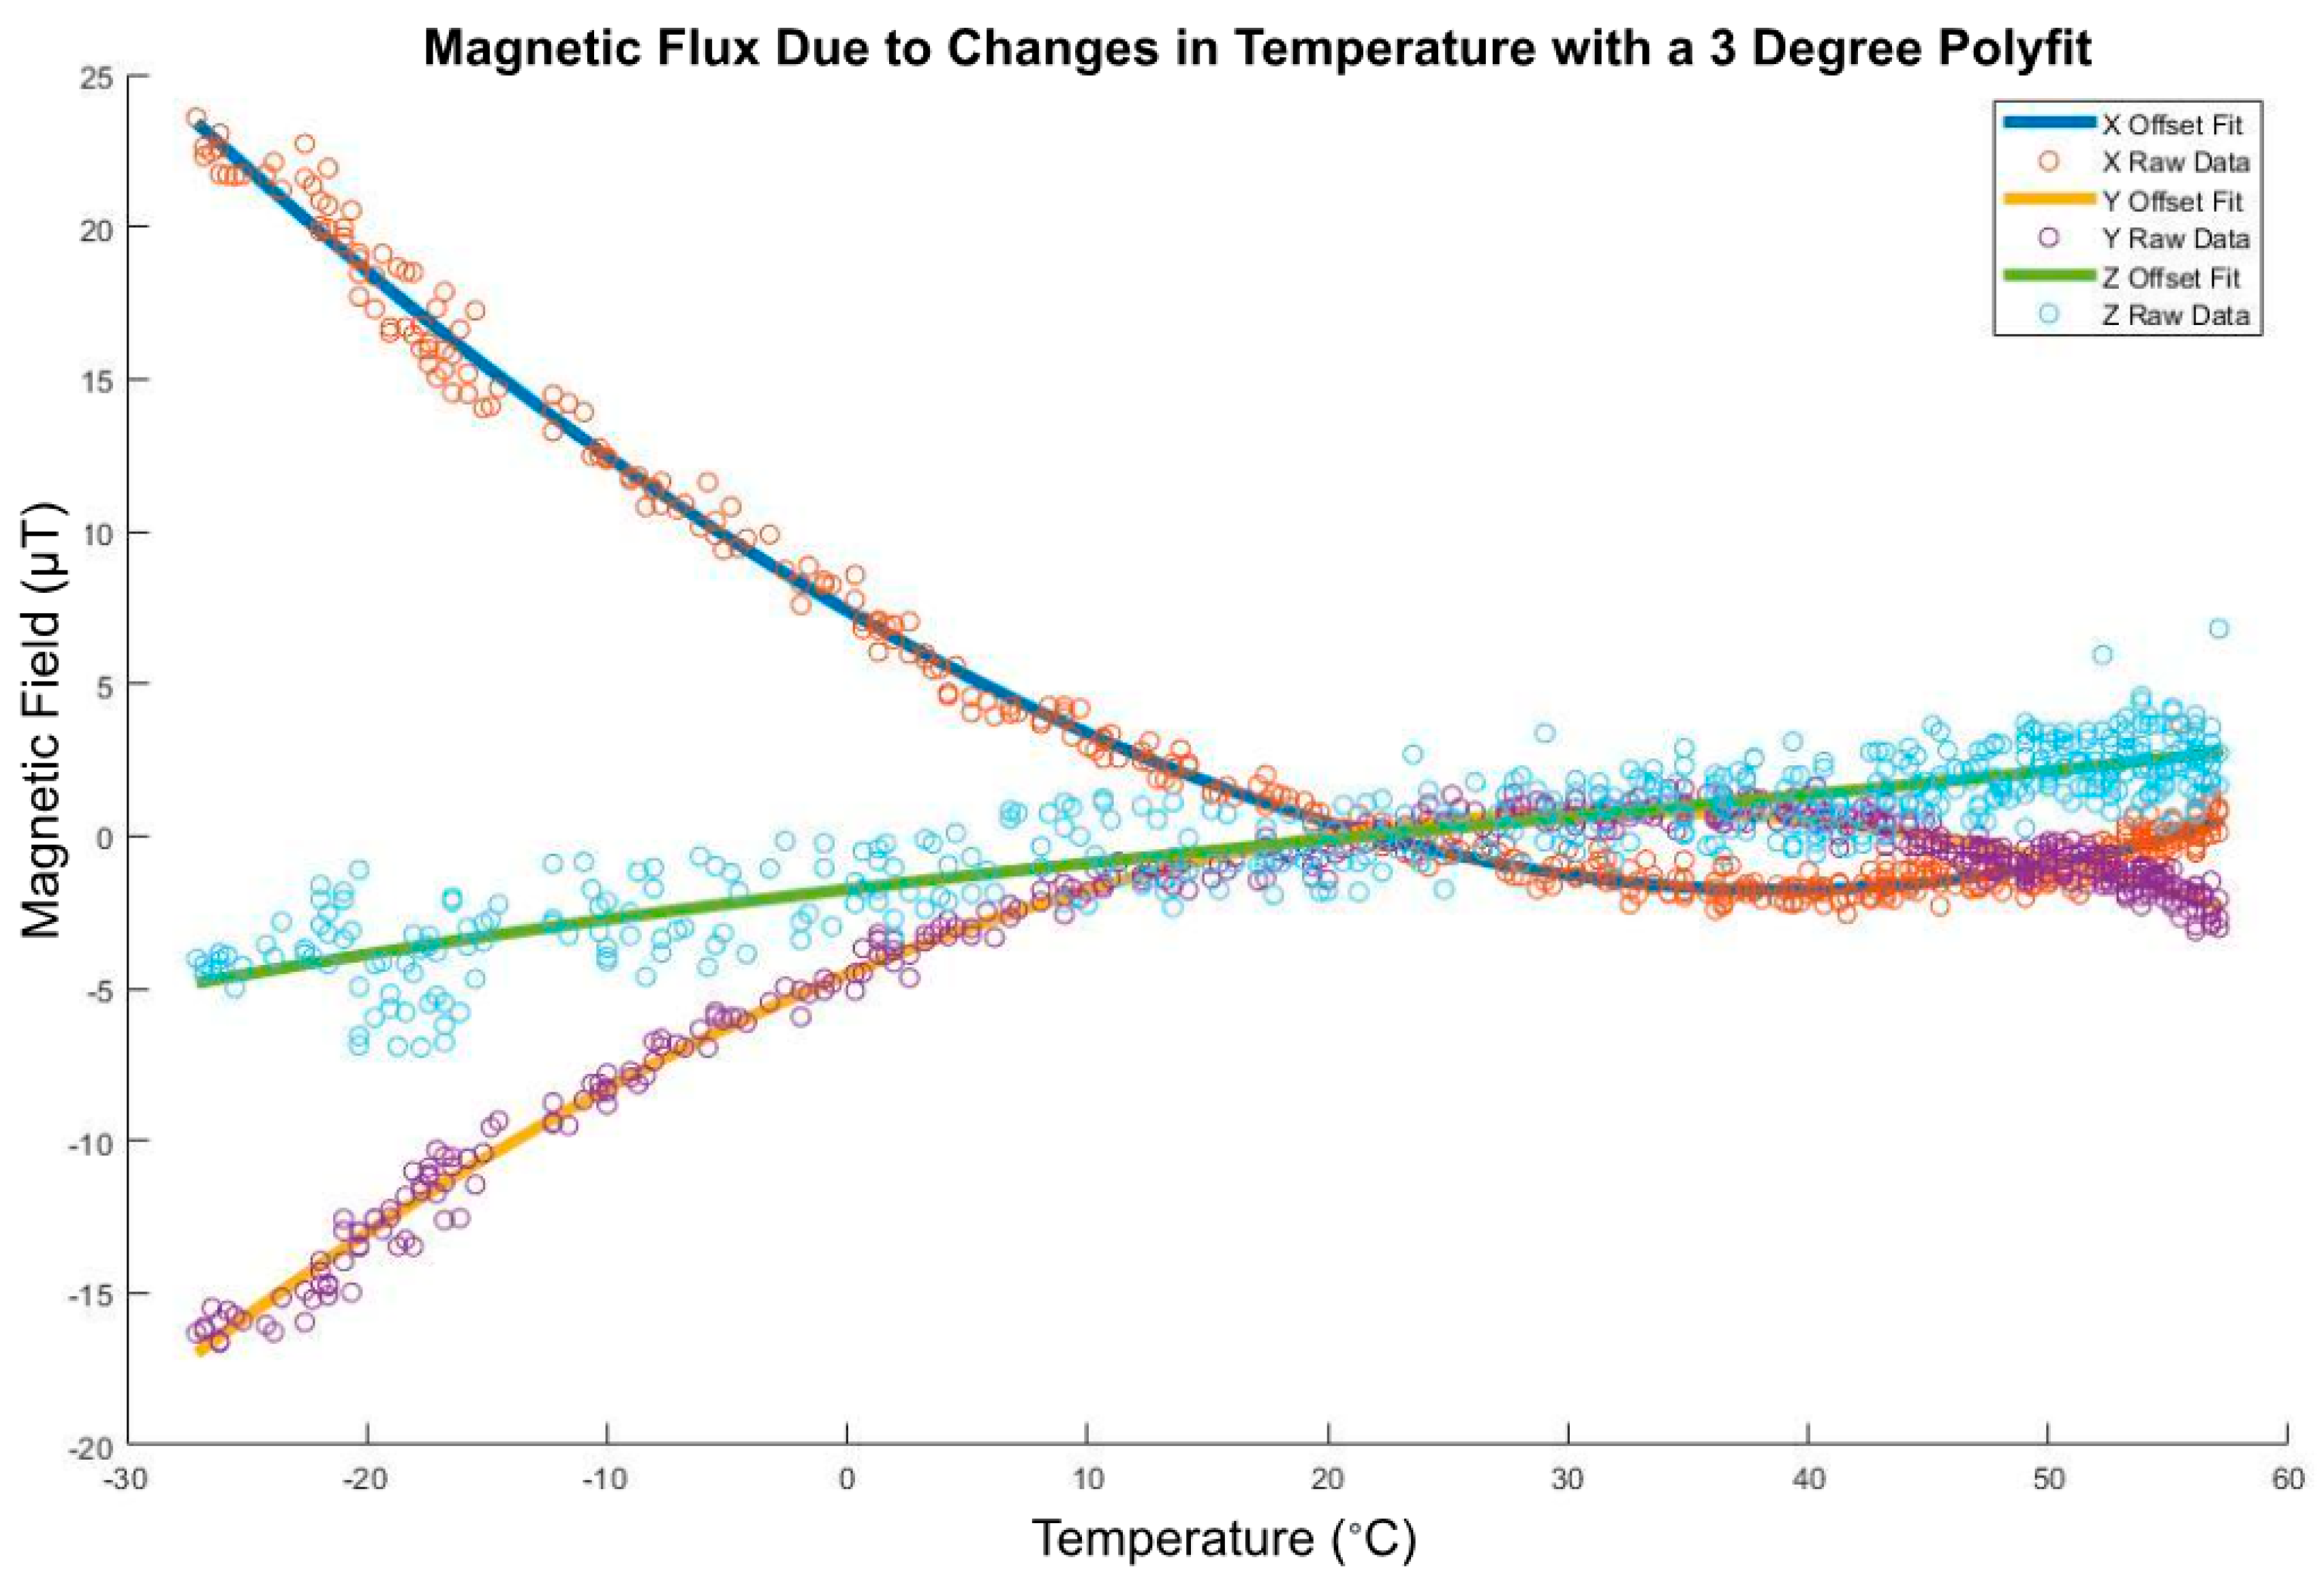
Figure 51.
Magnetic flux due to changes in temperature with a three-degree polyfit.
Figure 51.
Magnetic flux due to changes in temperature with a three-degree polyfit.
Table 1.
System top-level black box interfaces.
Table 1.
System top-level black box interfaces.
| Variable/Acronym | Definition | Variable/Acronym | Definition |
|---|
| F1 | Solar panel | F3 | Thermistor |
| F2 | Ambient light sensor | F5 | Gyroscope |
| F6 | Malfunctions/damage | F8 | RF transceiver |
| F7 | Torque coils | F9 | Dissipated light |
| F10 | Dissipated heat | | |
Table 2.
Immediate subsystem.
Table 2.
Immediate subsystem.
| Variable/Acronym | Definition |
|---|
| F4 | IMU |
Table 3.
Full system breakdown.
Table 3.
Full system breakdown.
| Variable/Acronym | Definition | Variable/Acronym | Definition |
|---|
| F11–F14 | Analog to digital converter | F15 | PWM Modulator |
| F16 | Data Packager | | |
Table 4.
Requirement table for the ChipSat RF subsystem.
Table 4.
Requirement table for the ChipSat RF subsystem.
| ID | Requirement | ID | Requirement |
|---|
| 1.0 | The systems SHALL communicate over RF | 5.0 | The system SHALL add a preamble |
| 2.0 | The system SHALL capture IMU data in a packet | 5.1 | The preamble SHALL consist of 4 8-bit barker codes |
| 2.1 | The system SHALL have 16-bit data | 6.0 | The system SHALL apply matched filtering |
| 2.2 | The system SHALL collect magnetometer, accelerometer, and gyroscope data in 3D space | 7.0 | The signal SHALL be received by a ground station |
| 3.0 | The system SHALL be frequency modulated | 7.1 | The signal SHALL be demodulated |
| 4.0 | The system SHALL forward error correct (FEC) the data | | |
Table 5.
Requirement table for the CubeSat ACS subsystem.
Table 5.
Requirement table for the CubeSat ACS subsystem.
| ID | Requirement | ID | Requirement |
|---|
| 1.0 | The system SHALL detumble to 10% of the initial angular velocity in the x and y direction | 5.0 | The Teensy flight computer SHALL be able to handle the ACS computations |
| 2.0 | The z angular velocity SHALL spin stabilize within 10% of omega_final = [0 0 1] rad/s | 6.0 | The system SHALL calibrate the IMU against hard iron offsets caused by internal electronics |
| 2.1 | The system SHALL spin stabilize within 8 hours | 6.1 | The system SHALL calibrate the IMU against soft iron offsets caused by actuators |
| 3.0 | The system SHALL point its z axis tangent to the Earth’s surface a majority of the time | 6.2 | The system SHALL calibrate the IMU against temperature offset effects |
| 4.0 | The controller SHALL not use more than 0.9 watts (0.2 amps at 4.2–3.7 volts) | | |
Table 6.
Characteristics of optimized industry standard controllers.
Table 6.
Characteristics of optimized industry standard controllers.
| | Quadratic Cost | End Point Error | Standard Deviation | Rise Time |
|---|
| PD controller | 1.309573 | 9.28393 × 10⁻² | 4.857353 × 10⁻² | 8.57 × 10⁻¹ |
| P + V Controller | 55.709082 | 8.239661 × 10⁻³ | 1.061509 × 10⁻² | 3.90 × 10⁻¹ |
| P + V Double Integrator | 2.544054 | 1.216665 × 10⁻¹ | 1.044603 × 10⁻² | N/A * |
| Double Integrator gain tuning | 6.579885 | 1.087292 × 10⁻¹ | 1.085613 × 10⁻² | 7.80 × 10⁻¹ |
| 2 DOF feed forward | 6.147382 | 2.911532 × 10⁻² | 1.115621 × 10⁻² | 8.00 × 10⁻¹ |
| P + V Control Law Inversion | 6.127791 | 2.929454 × 10⁻² | 1.106685 × 10⁻² | 8.00 × 10⁻¹ |
| Open loop guidance (DQC) | 6.181200 | 5.775071 × 10⁻³ | 5.761962 × 10⁻² | 8.00 × 10⁻¹ |
| Real-Time Optimal Controller | 6.169038 | 1.865604 × 10⁻⁵ | 2.710996 × 10⁻³ | 8.10 × 10⁻¹ |
Table 7.
Robustness of the controller to varying sample rates.
Table 7.
Robustness of the controller to varying sample rates.
| Sample Rates (Seconds) | Rise Time (Seconds) |
|---|
| 0.1 | 8.67 × 10⁻¹ |
| 0.01 | 8.29 × 10⁻¹ |
| 0.001 | 8.20 × 10⁻¹ |
Table 8.
Final Id and c calculated to optimize the CubeSat Kane damper.
Table 8.
Final Id and c calculated to optimize the CubeSat Kane damper.
Table 9.
Hard iron offsets recorded to calibrate the IMU of static EM radiation from onboard electronics.
Table 9.
Hard iron offsets recorded to calibrate the IMU of static EM radiation from onboard electronics.
| Trial | X Offset | Y Offset | Z Offset |
|---|
| 1 | −14.80 | 35.81 | 7.13 |
| 2 | −13.10 | 36.68 | 7.04 |
| 3 | −13.50 | 36.80 | 6.30 |
| 4 | −13.70 | 34.78 | 7.46 |
| 5 | −13.15 | 36.22 | 6.71 |
| avg | −13.65 | 36.058 | 6.928 |
