
Design and Manufacture of 30-Degree Projection Lens for Augmented Reality Waveguide


 , , ,
, , ,
Abstract
1. Introduction
2. Design Methods
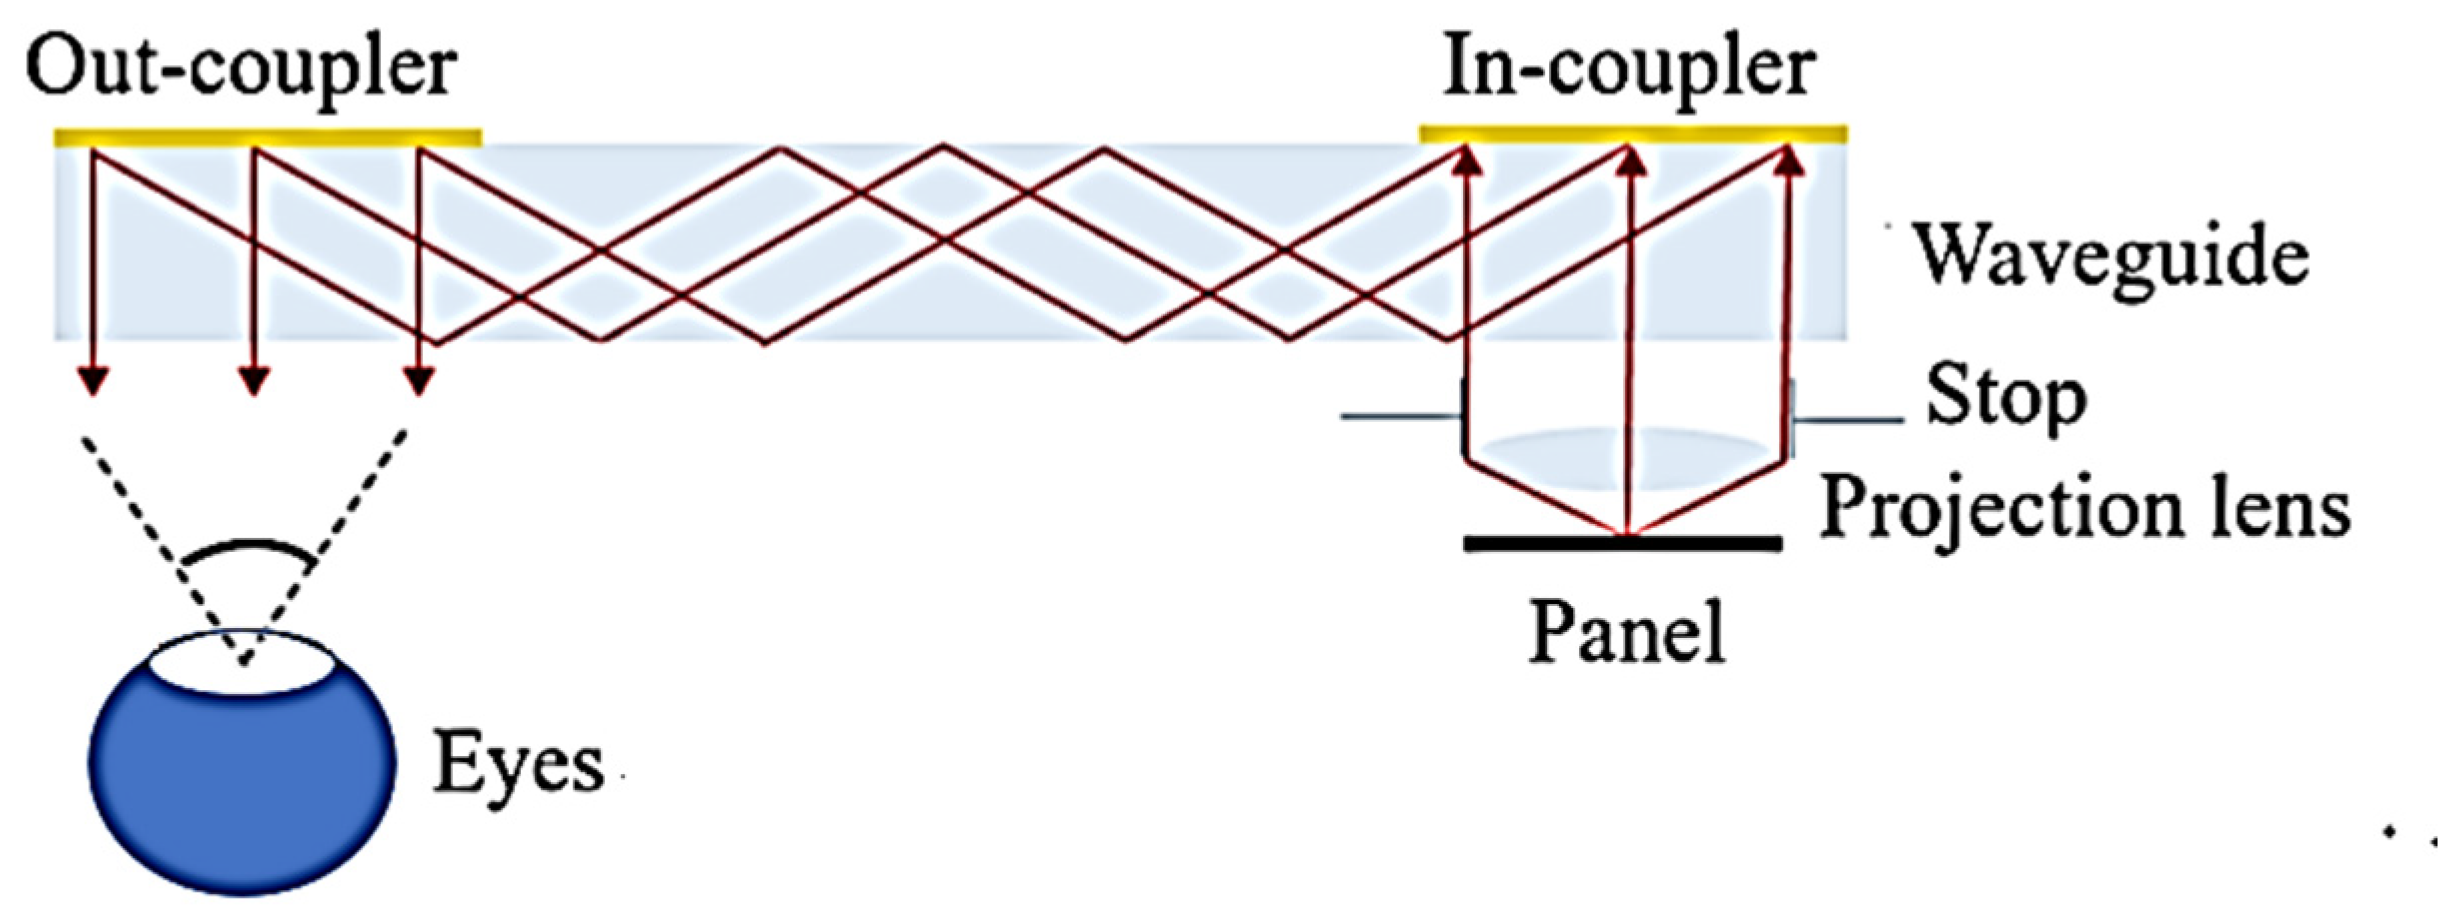
2.1. Projection Lens Structure Design for AR Glasses
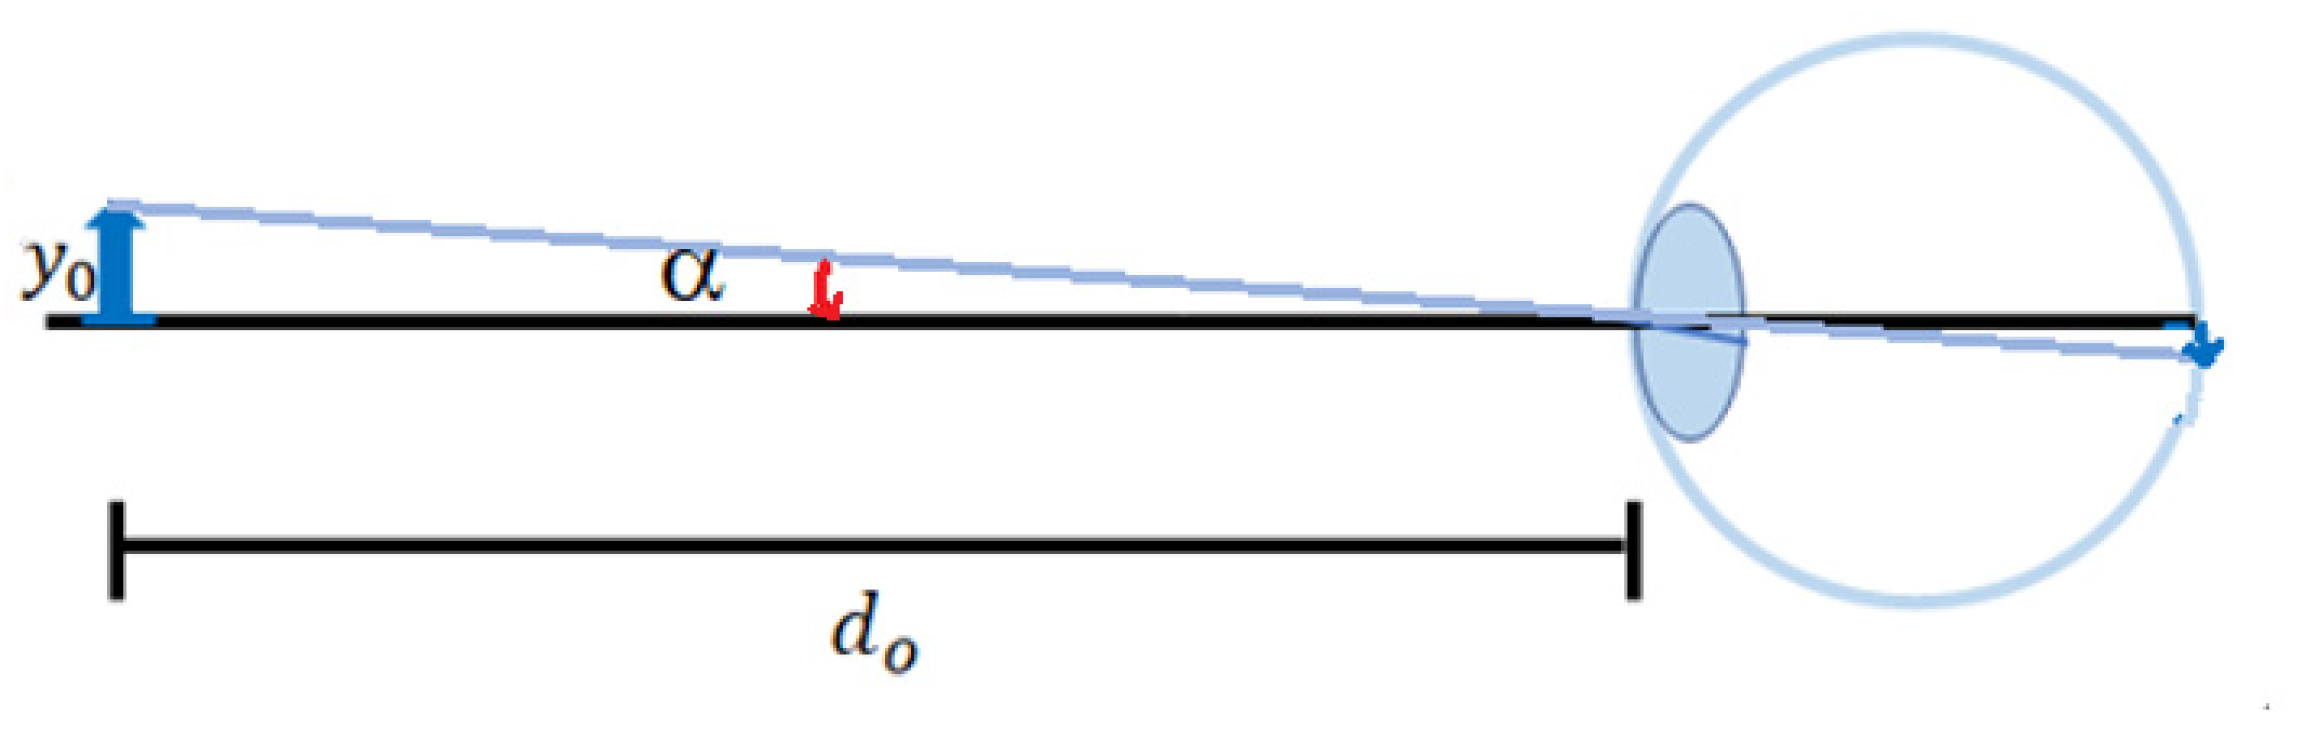
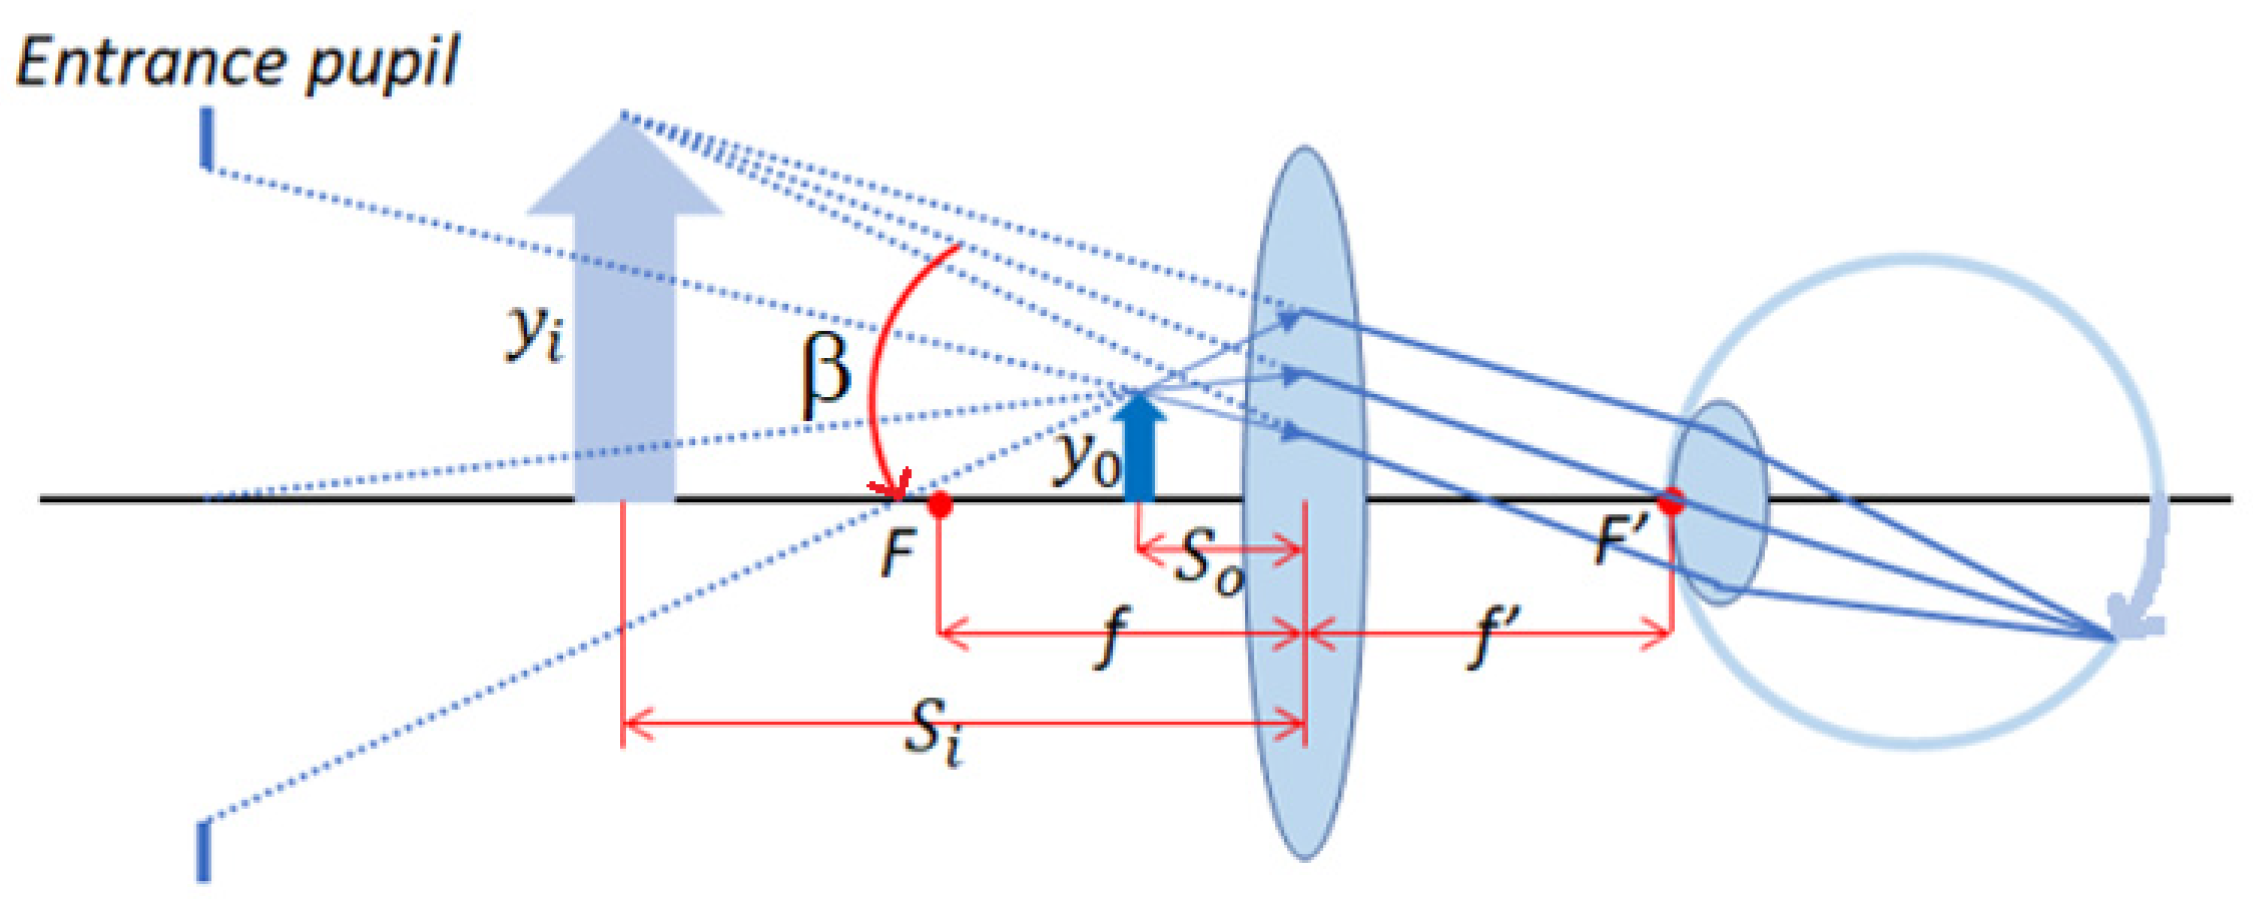
2.2. Principle of Magnifying Glass
2.3. Sensor and Lens Specifications
2.4. Tolerance Analysis
3. Projection Lens for Design, Manufacture and Testing
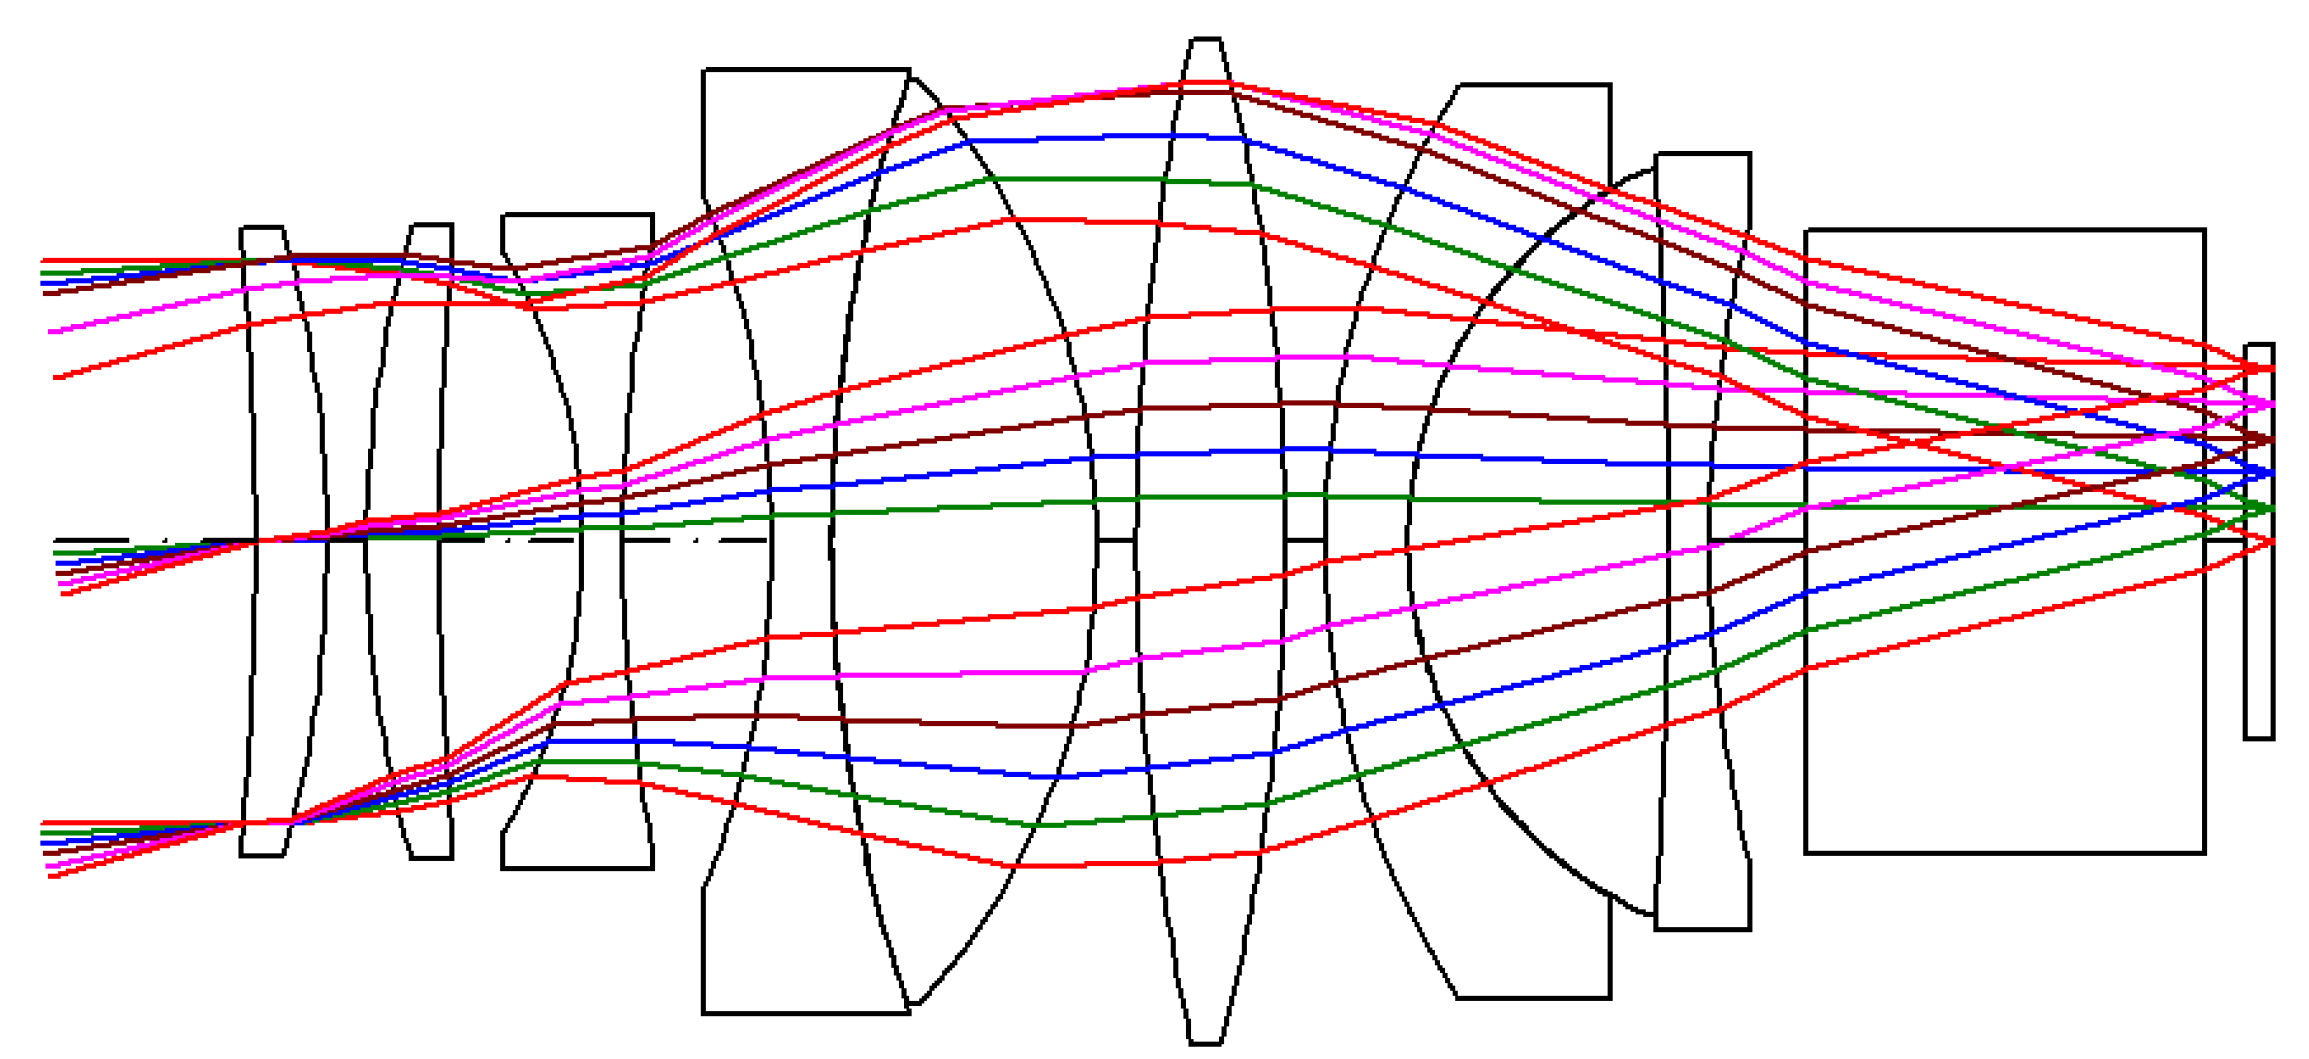
3.1. Optical Design Data of Projection Lens
3.2. Lens Manufacturing and Tolerance Analysis
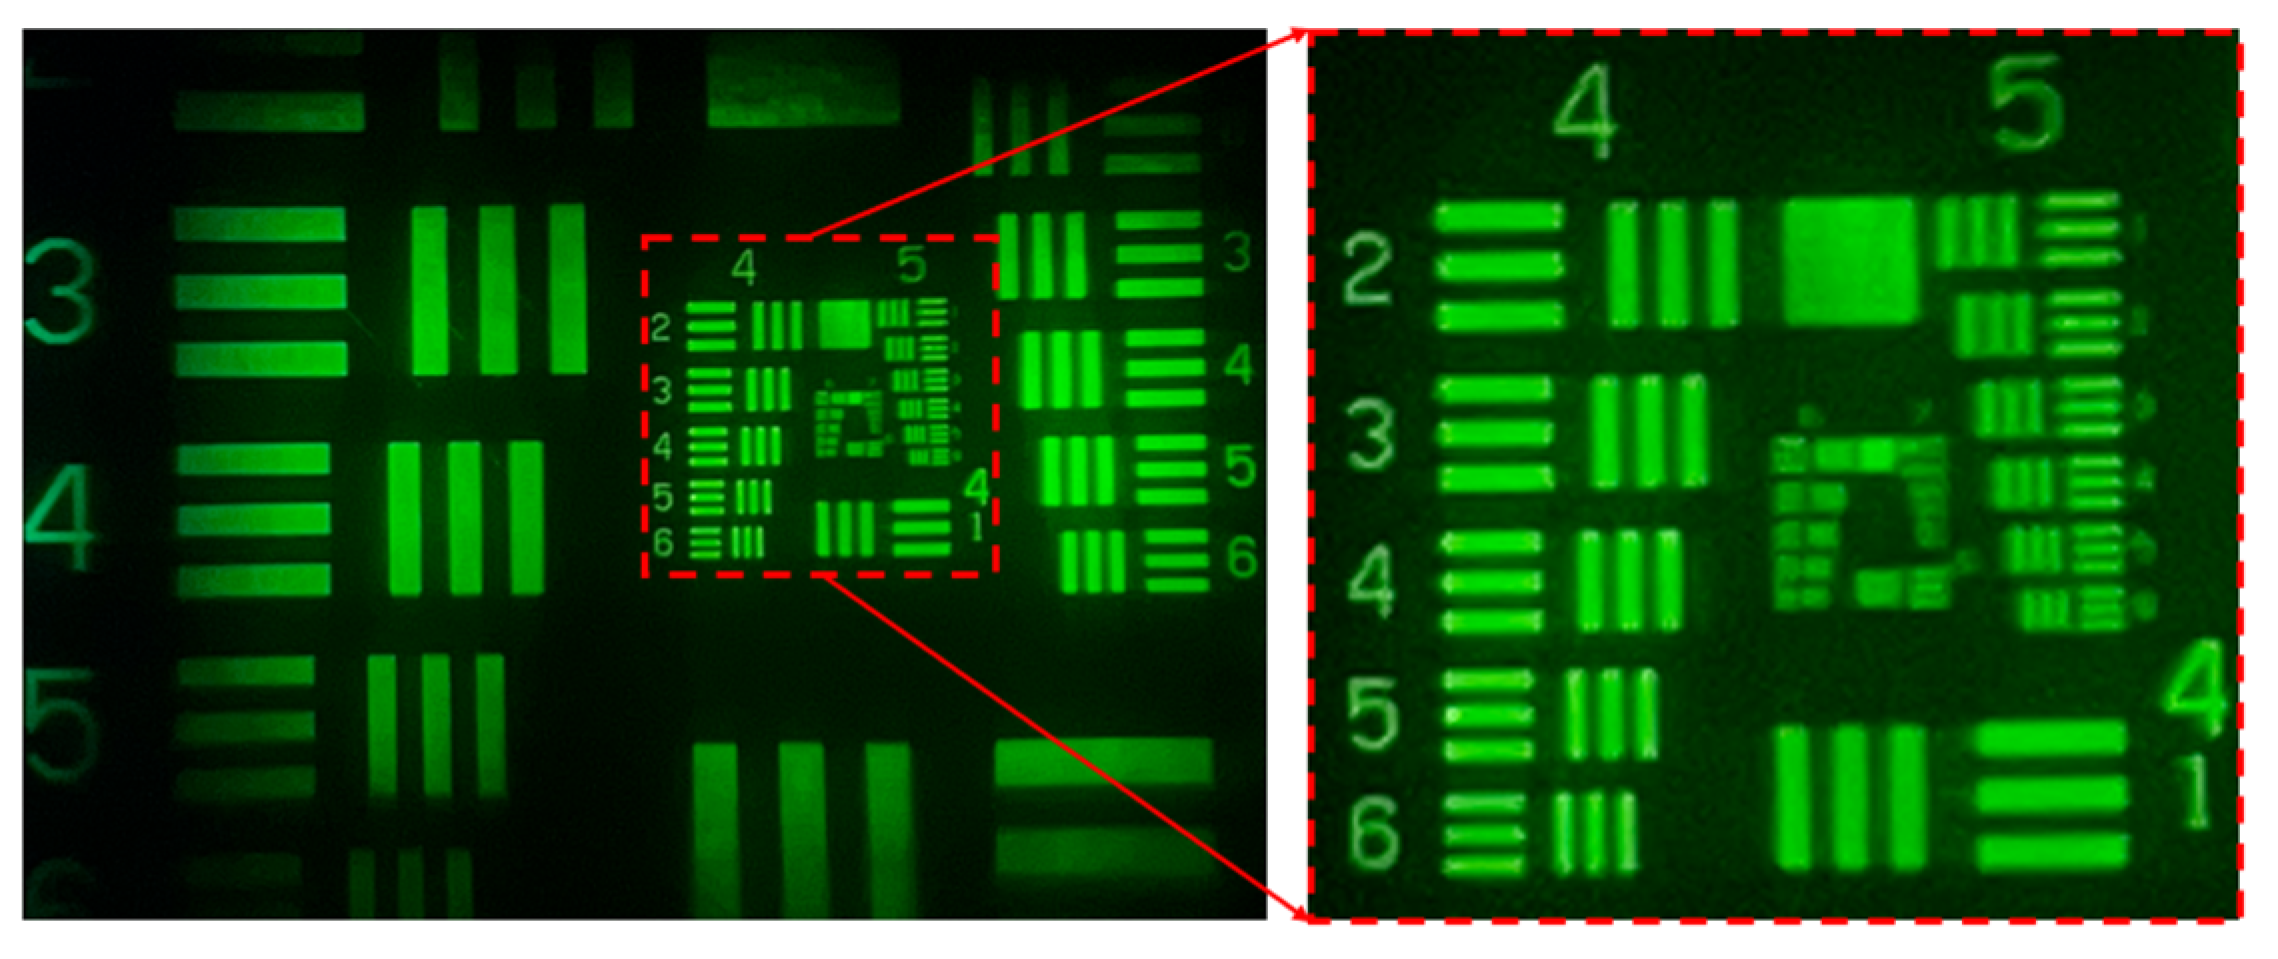
3.3. Projection Lens Testing
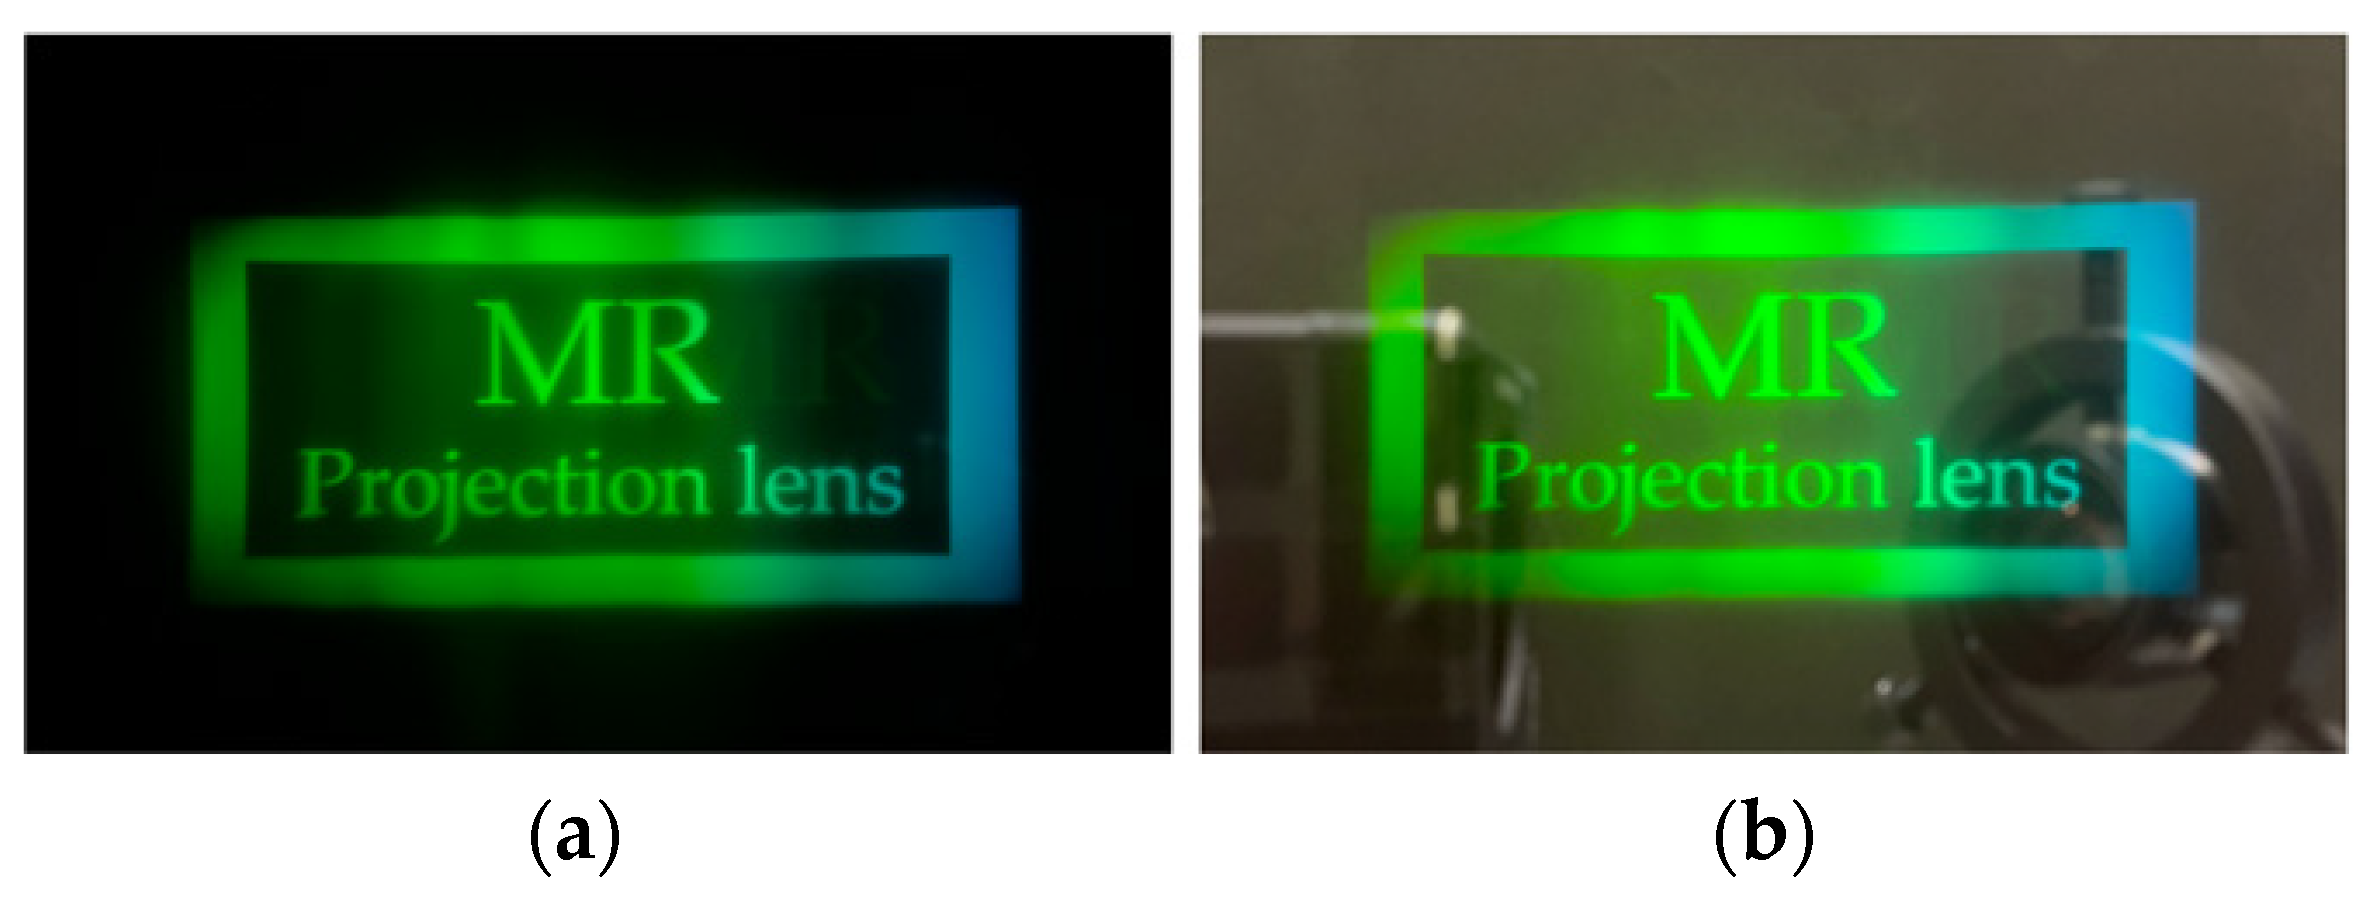
3.4. Performance Testing Based on a Diffraction-Type Waveguide
4. Conclusions
Author Contributions
Funding
Data Availability Statement
Conflicts of Interest
References
- Sutherland, I.E. A Head-mounted three dimensional display. In Proceedings of the Joint Computer Conference, Part I, ACM, San Francisco, CA, USA, 9–11 December 1986; Volume 757. Available online: https://dl.acm.org/doi/pdf/10.1145/1476589.1476686 (accessed on 1 June 2024).
- Rolland, J.P.; Thompson, K. See-Through Head Worn Displays for Mobile Augmented Reality. In Proceedings of the China National Computer Conference, Shenzhen, China, 24–26 November 2011. [Google Scholar]
- Epson, Geometrical Waveguide Type Glasses. Available online: https://phys.org/news/2016-02-world-lightest-oled-binocular-see-through.html (accessed on 1 June 2024).
- Microsoft, SRG. Available online: https://www.microsoft.com/zh-tw/hololens (accessed on 1 June 2024).
- Magic Leap, SRG. Available online: https://www.magicleap.com/magic-leap-2 (accessed on 1 June 2024).
- Wilson, J.; Steingart, D.; Romero, R.; Reynolds, J.; Mellers, E.; Redfern, A.; Lim, L.; Watts, W.; Patton, C.; Baker, J. Design of Monocular Head-Mounted Displays for Increased Indoor Firefighting Safety and Efficiency in Defense and Security. Int. Soc. Opt. Photonics 2005, 5800, 103–114. Available online: https://www.spiedigitallibrary.org/conference-proceedings-of-spie/5800/0000/Design-of-monocular-head-mounted-displays-for-increased-indoor-firefighting/10.1117/12.603590.short (accessed on 1 June 2024).
- Rolland, J.P.; Fuchs, H. Optical versus video see-through head-mounted displays in medical visualization. Presence Teleoperators Virtual Environ. 2000, 9, 287–309. [Google Scholar] [CrossRef]
- Park, S.; Bokijonov, S.; Choi, Y. Review of Microsoft HoloLens Applications over the Past Five Years. Appl. Sci. 2021, 11, 7259. [Google Scholar] [CrossRef]
- Klein, G.; Murray, D. Parallel tracking and mapping on a camera phone. In Proceedings of the ISMAR, Orlando, FL, USA, 19–22 October 2009; pp. 83–86. [Google Scholar]
- Wischgoll, T. Display Systems for Visualization and Simulation in Virtual Environments. Electron. Imaging 2017, 78–88. [Google Scholar] [CrossRef]
- Sun, W.S.; Tien, C.L.; Chiang, Y.C.; Pan, J.W. Simulation design of a wearable see-through retinal projector. Appl. Opt. 2015, 54, 4485–4494. [Google Scholar] [CrossRef] [PubMed]
- Kijima, R.; Hirose, M. A Compound Virtual Environment Using the Projective Head Mounted Display. In Proceedings of the ACM International Conference on Artificial Reality and Tele-Existence/ACM Conference on Virtual Reality Software and Technology (ICAT/VRST), Makuhari, Chiba, Japan, 20–22 November 1995; Volume 111. [Google Scholar]
- Geist, R.E. Head-Mounted Virtual Display Apparatus with a Near-Eye Light Deflecting Element in the Peripheral Field of Field. U.S. Patent 6,771,423, 3 August 2004. [Google Scholar]
- Togino, T. Prism Optical System. U.S. Patent 5,991,103, 23 November 1999. [Google Scholar]
- Robinson, J.D.; Schor, C.M.; Muller, P.H.; Yankee, W.A.; Young, R.F.; Fantone, S.D. Video Headset. U.S. Patent 5,696,521, 9 December 1997. [Google Scholar]
- Iba, Y. Image Observation Device. U.S. Patent 5,384654, 24 January 1995. [Google Scholar]
- Ferrin, F.J.; Droessler, J.G. Head Gear Display System Using Off-Axis Image Sources. U.S. Patent 5,576,887, 19 November 1996. [Google Scholar]
- Hoshi, H.; Taniguchi, N.; Morishima, H.; Akiyama, T.; Yamazaki, S.; Okuyama, A. Off-axis HMD optical system consisting of aspherical surfaces without rotational symmetry. Proc. SPIE 1998, 2653, 234–242. [Google Scholar]
- Zhao, K.W.; Pan, J.W. Optical design for a see-through head-mounted display with high visibility. Opt. Express 2016, 24, 4749–4760. [Google Scholar] [CrossRef] [PubMed]
- Ivaniuk, A.; Kalinina, A. Augmented reality (AR) display design based on freeform optics. In Proceedings of the OSA Optical Design and Fabrication 2021 (Flat Optics, Freeform, IODC, OFT), Washington, DC, USA, 27 June–1 July 2021. [Google Scholar]
- Levola, T. Diffractive optics for virtual reality displays. J. Soc. Inf. Disp. 2006, 14, 467–475. [Google Scholar] [CrossRef]
- Kress, B.C.; Cummings, W.J. Towards the ultimate mixed reality experience: HoloLens display architecture choices. SID Symp. Dig. Tech. Pap. 2017, 48, 127–131. [Google Scholar] [CrossRef]
- Chen, C.P.; Ma, X.; Zou, S.P.; Liu, T.; Chu, Q.; Hu, H.; Cui, Y. Quad-channel waveguide-based near-eye display for metaverse. Displays 2023, 81, 102582. [Google Scholar] [CrossRef]
- Piao, J.A.; Li, G.; Piao, M.L.; Kim, N. Full color holographic optical element fabrication for waveguide type head mounted display using photopolymer. Opt. Soc. Korea 2013, 17, 242–248. [Google Scholar] [CrossRef]
- Piao, M.L.; Kim, N. Achieving high levels of color uniformity and optical efficiency for a wedge-shaped waveguide head-mounted display using a photopolymer. Appl. Opt. 2014, 53, 2180–2186. [Google Scholar] [CrossRef] [PubMed]
- Takeyama, T. Observation Optical System. U.S. Patent 6,710,902, 23 March 2004. [Google Scholar]
- Wu, Y.; Chen, C.P.; Zhou, L.; Li, Y.; Yu, B.; Jin, H. Design of see-through near-eye display for presbyopia. Opt. Express 2017, 25, 8937–8949. [Google Scholar] [CrossRef] [PubMed]
- Pan, J.W.; Hung, H.C. Optical design of a compact see-through head mounted display with light guide plate. J. Disp. Technol. 2015, 11, 223. [Google Scholar] [CrossRef]
- Hua, H.; Ha, Y.; Rolland, J.P. Design of an ultralight and compact projection lens. Appl. Opt. 2003, 42, 97–107. [Google Scholar] [CrossRef] [PubMed]
- Hua, H.; Gao, C. Design of a bright polarized head-mounted projection display. Appl. Opt. 2007, 46, 2600–2610. [Google Scholar] [CrossRef] [PubMed]
- Zhang, R.; Hua, H. Design of a polarized head-mounted projection display using ferroelectric liquid-crystal-on-silicon microdisplays. Appl. Opt. 2008, 47, 2888–2896. [Google Scholar] [CrossRef] [PubMed]
- Hecht, E. OPTICS, 4th ed.; Addison-Wesley: Boston, MA, USA, 2001; Chapter 6. [Google Scholar]
- Himax LCOS Panel. Available online: https://www.himax.com.tw/products/microdisplay-products/front-lit-lcos/hx7028fl/ (accessed on 1 June 2024).
- Synopsys Inc. Tolerancing, Code V Reference Manuals, Version 2024.03; Synopsys Inc.: Sunnyvale, CA, USA, 2024. [Google Scholar]
- Sun, W.S.; Huang, C.M.; Lin, J.S. Discussion of temperature, TV distortion, and lateral color of a 4-megapixel DLP projector lens. OSA Contin. 2019, 2, 3188–3203. [Google Scholar] [CrossRef]
- Available online: https://en.wikipedia.org/wiki/1951_USAF_resolution_test_chart (accessed on 1 June 2024).


| Parameters | Specification |
|---|---|
| Manufacturer | Himax |
| Model No. | 7028FL |
| Display type | LCoS |
| Active area diagonal | 0.35 inch |
| Resolution | 1280 × 720 pixels |
| Pixel pitch | 6 μm × 6 μm |
| Active area dimensions | 7.68 mm × 4.32 mm |
| Parameters | Specification |
|---|---|
| Entrance pupil diameter | 14 mm |
| Diagonal FOV | 30° |
| Horizontal FOV | 26.29° |
| Vertical FOV | 14.97° |
| Lens Diameter | ≤30 mm |
| Focal Length | 16.443 mm |
| F-number | 1.174 |
| Image height | 4.406 mm |
| MTF (35 cycles/mm) | ≥0.44 |
| LCoS protective glass material | BK7 |
| LCoS protective glass thickness | 0.7 mm |
| PBS material | NSF11_Schott |
| PBS thickness | 10 mm |
| Tolerance Caption | Definition |
|---|---|
| DLF | Test plate fit (power) in the fringes at 546.1 nm over the clear aperture |
| CYD | Cylinder (at 45° orientation) irregularity in the fringes at 546.1 nm over the clear aperture |
| CYN | Cylinder (at 0° orientation) irregularity in the fringes at 546.1 nm over the clear aperture |
| DLT | Change in the thickness (mm) |
| DLN | Change in the index of refraction |
| DLV | Change in V number if you were using d, F, and C wavelengths. |
| TRX | Total indicator run-out (mm) in X (resulting in a surface tilt) at the clear aperture |
| TRY | Total indicator run-out (mm) in Y (resulting in a surface tilt) at the clear aperture |
| BTX | Tilt (rad) in X of the group of surfaces about the pole of the first surface |
| BTY | Tilt (rad) in Y of the group of surfaces about the pole of the first surface |
| DSX | Lateral displacement (mm) of the group of surfaces in the X direction |
| DSY | Lateral displacement (mm) of the group of surfaces in the Y direction |
| RLX | Roll tolerances are a roll of a surface about the seat of another surface in the X direction |
| RLY | Roll tolerances are a roll of a surface about the seat of another surface in the Y direction |
| DLZ | Axial displacement (mm) of the surface |
| Tolerance Type | Minimum | Maximum |
|---|---|---|
| DLF (fringe) | 3 | 5 |
| DLT (mm) | 0.02 | 0.1 |
| DLN | 0.0002 | 0.0005 |
| DLV | 0.002 | 0.008 |
| TRX (arcmin) | 0.5 | 3 |
| TRY (arcmin) | 0.5 | 3 |
| BTX (arcmin) | 0.5 | 3 |
| BTY (arcmin) | 0.5 | 3 |
| DSX (mm) | 0.02 | 0.1 |
| DSY (mm) | 0.02 | 0.1 |
| RLX (mm) | 0.01 | 0.02 |
| RLY (mm) | 0.01 |
| Surface Type | Radius (mm) | Thickness (mm) | Glass | Full Aperture (mm) | |
|---|---|---|---|---|---|
| Object | Sphere | Infinity | Infinity | ||
| Stop | Sphere | −74.591 | 1.782 | NSF57_SCHOTT | 14 |
| 2 | Sphere | −28.414 | 1 | 14.263 | |
| 3 | Sphere | 28.595 | 1.815 | NLASF46B_SCHOTT | 14.376 |
| 4 | Sphere | 82.325 | 3.582 | 14.108 | |
| 5 | Sphere | −14.077 | 1 | NSF11_SCHOTT | 13.701 |
| 6 | Sphere | 40.051 | 3.733 | 14.864 | |
| 7 | Sphere | −22.672 | 1.5 | NSF8_SCHOTT | 16.434 |
| 8 | Sphere | 36.282 | 6.627 | NLASF40_SCHOTT | 20.838 |
| 9 | Sphere | −17.178 | 1 | 21.793 | |
| 10 | Sphere | 58.05 | 3.714 | NLASF43_SCHOTT | 23 |
| 11 | Sphere | −49.158 | 1 | 22.993 | |
| 12 | Sphere | 21.117 | 2.086 | NSF57_SCHOTT | 20.857 |
| 13 | Sphere | 10.252 | 6.52 | NLASF44_SCHOTT | 17.661 |
| 14 | Sphere | −128.697 | 1 | NSF57_SCHOTT | 16.838 |
| 15 | Sphere | 32.134 | 2.432 | 15.369 | |
| 16 | Sphere | Infinity | 10 | NSF11_SCHOTT | 14.14 |
| 17 | Sphere | Infinity | 1 | 9.793 | |
| 18 | Sphere | Infinity | 0.7 | BSC1_HOYA | 8.973 |
| 19 | Sphere | Infinity | 0 | 8.772 | |
| Image | Sphere | Infinity | 0 | 8.772 |
| Surface | DLF (fringe) | DLT (mm) | DLN | DLV (%) |
|---|---|---|---|---|
| 1 | 3 | 0.1 | 0.0005 | 0.8 |
| 2 | 3 | 0.05 | ||
| 3 | 3 | 0.05 | 0.0005 | 0.8 |
| 4 | 3 | 0.025 | ||
| 5 | 3 | 0.025 | 0.0005 | 0.5 |
| 6 | 3 | 0.02 | ||
| 7 | 3 | 0.02 | 0.0005 | 0.5 |
| 8 | 3 | 0.02 | 0.0005 | 0.6 |
| 9 | 3 | 0.075 | ||
| 10 | 3 | 0.1 | 0.0005 | 0.8 |
| 11 | 3 | 0.1 | ||
| 12 | 3 | 0.05 | 0.0005 | 0.5 |
| 13 | 3 | 0.1 | 0.0005 | 0.5 |
| 14 | 3 | 0.1 | 0.0005 | 0.8 |
| 15 | 3 | 0.1 | ||
| 16 | 3 | 0.1 | 0.0005 | 0.8 |
| 17 | 3 | 0.1 | ||
| 18 | 3 | 0.1 | 0.0005 | 0.8 |
| 19 | 3 |
| Element No. | TRX, TRY (arcmin) | BTX, BTY (arcmin) | DLX, DLY (mm) | RLX, RLY (mm) |
|---|---|---|---|---|
| 1 | 3 | 1 | 0.02 | |
| 2 | 3 | 1 | 0.02 | |
| 3 | 1.5 | 1 | 0.02 | |
| 4 | 3 | 0.0182 | ||
| 4~5 | 1 | 0.02 | ||
| 5 | 1.5 | |||
| 6 | 3 | 1 | 0.02 | |
| 7 | 3 | 0.0154 | ||
| 7~8 | 0.0147 | |||
| 7~9 | 1 | 0.02 | ||
| 8 | 2.7 | |||
| 9 | 3 | |||
| 10 | 3 | 1 | ||
| 11 | 3 | 1 |
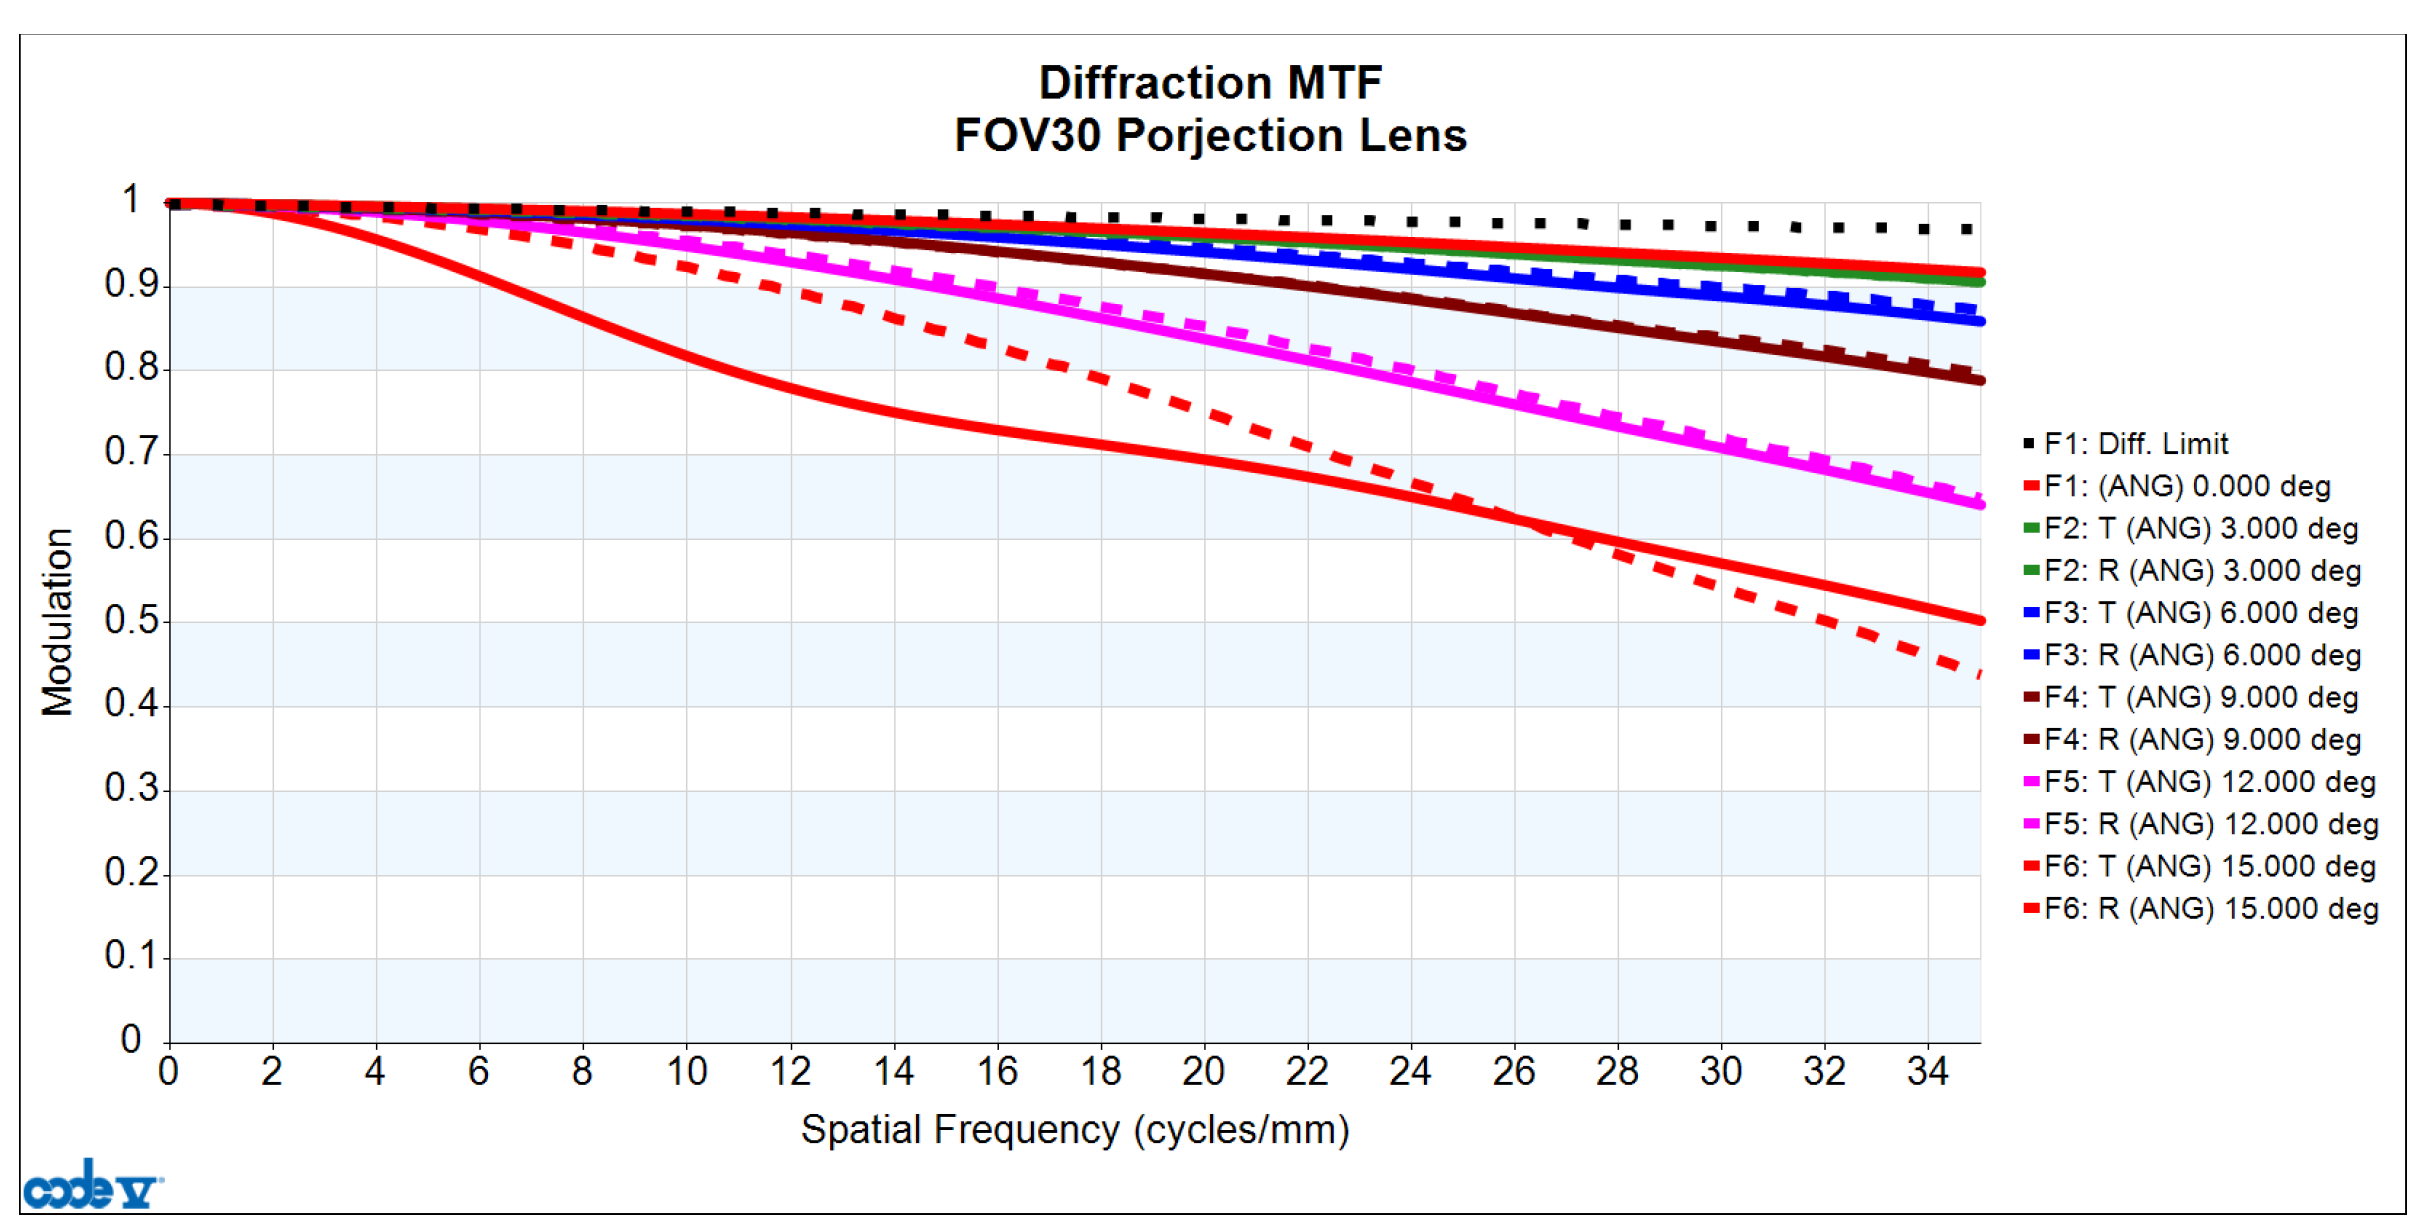
| Field | Spatial Frequency (cycles/mm) | Azimuth(°) | Design MTF | Design + Tolerance MTF |
|---|---|---|---|---|
| 0 | 35 | Tangential | 0.921 | 0.692 |
| 0.2 | 35 | Tangential | 0.908 | 0.652 |
| 0.39 | 35 | Tangential | 0.861 | 0.607 |
| 0.59 | 35 | Tangential | 0.786 | 0.534 |
| 0.79 | 35 | Tangential | 0.636 | 0.399 |
| 1 | 35 | Tangential | 0.506 | 0.344 |
| 0.2 | 35 | Radial | 0.911 | 0.685 |
| 0.39 | 35 | Radial | 0.874 | 0.643 |
| 0.59 | 35 | Radial | 0.794 | 0.572 |
| 0.79 | 35 | Radial | 0.648 | 0.456 |
| 1 | 35 | Radial | 0.439 | 0.296 |
| Group Number | ||||||||||||
|---|---|---|---|---|---|---|---|---|---|---|---|---|
| Element | −2 | −1 | 0 | 1 | 2 | 3 | 4 | 5 | 6 | 7 | 8 | 9 |
| 1 | 0.250 | 0.500 | 1 | 2 | 4 | 8 | 16 | 32 | 64 | 128 | 256 | 512 |
| 2 | 0.280 | 0.561 | 1.12 | 2.24 | 4.49 | 8.98 | 17.96 | 35.9 | 71.8 | 143.7 | 287.4 | 574.7 |
| 3 | 0.315 | 0.630 | 1.26 | 2.52 | 5.04 | 10.08 | 20.16 | 40.3 | 80.6 | 161.3 | 322.5 | 645.1 |
| 4 | 0.353 | 0.707 | 1.41 | 2.83 | 5.66 | 11.31 | 22.63 | 45.3 | 90.5 | 181 | 362 | 724.1 |
| 5 | 0.397 | 0.793 | 1.59 | 3.17 | 6.35 | 12.7 | 25.4 | 50.8 | 101.6 | 203.2 | 406.4 | 812.7 |
| 6 | 0.445 | 0.891 | 1.78 | 3.56 | 7.13 | 14.25 | 28.51 | 57 | 114 | 228.1 | 456.1 | 912.3 |
| Field | Spatial Frequency (cycles/mm) | Pixel Per Degree (PPD) | Azimuth (Direction) | Design MTF | Design + Tolerance MTF |
|---|---|---|---|---|---|
| 0 | 57 | 33 | Tangential | 0.817 | 0.363 |
| 0.7 | 40.3 | 23 | Tangential | 0.434 | 0.258 |
| 0.7 | 40.3 | 23 | Radial | 0.330 | 0.179 |
Disclaimer/Publisher’s Note: The statements, opinions and data contained in all publications are solely those of the individual author(s) and contributor(s) and not of MDPI and/or the editor(s). MDPI and/or the editor(s) disclaim responsibility for any injury to people or property resulting from any ideas, methods, instructions or products referred to in the content. |
© 2024 by the authors. Licensee MDPI, Basel, Switzerland. This article is an open access article distributed under the terms and conditions of the Creative Commons Attribution (CC BY) license (https://creativecommons.org/licenses/by/4.0/).
Share and Cite
Sun, W.-S.; Hsu, Y.-S.; Tien, C.-L.; Lin, W.-K.; Su, Y.-L.; Yu, J.-Y.; Zhou, S.-K.; Liang, Y.-Y.; Tsai, W.-P.; Sun, C.; et al. Design and Manufacture of 30-Degree Projection Lens for Augmented Reality Waveguide. Micromachines 2024, 15, 1198. https://doi.org/10.3390/mi15101198
Sun W-S, Hsu Y-S, Tien C-L, Lin W-K, Su Y-L, Yu J-Y, Zhou S-K, Liang Y-Y, Tsai W-P, Sun C, et al. Design and Manufacture of 30-Degree Projection Lens for Augmented Reality Waveguide. Micromachines. 2024; 15(10):1198. https://doi.org/10.3390/mi15101198
Chicago/Turabian StyleSun, Wen-Shing, Ying-Shun Hsu, Chuen-Lin Tien, Wen-Kai Lin, Yi-Lun Su, Jun-Yi Yu, Shao-Kui Zhou, Yuan-Yan Liang, Wan-Pin Tsai, Chi Sun, and et al. 2024. "Design and Manufacture of 30-Degree Projection Lens for Augmented Reality Waveguide" Micromachines 15, no. 10: 1198. https://doi.org/10.3390/mi15101198
APA StyleSun, W.-S., Hsu, Y.-S., Tien, C.-L., Lin, W.-K., Su, Y.-L., Yu, J.-Y., Zhou, S.-K., Liang, Y.-Y., Tsai, W.-P., Sun, C., Lee, T.-X., Su, W.-C., Lin, S.-H., & Sun, C.-C. (2024). Design and Manufacture of 30-Degree Projection Lens for Augmented Reality Waveguide. Micromachines, 15(10), 1198. https://doi.org/10.3390/mi15101198