
Multi-Material Radial Phononic Crystals to Improve the Quality Factor of Piezoelectric MEMS Resonators


Abstract
:1. Introduction
2. Materials and Methods
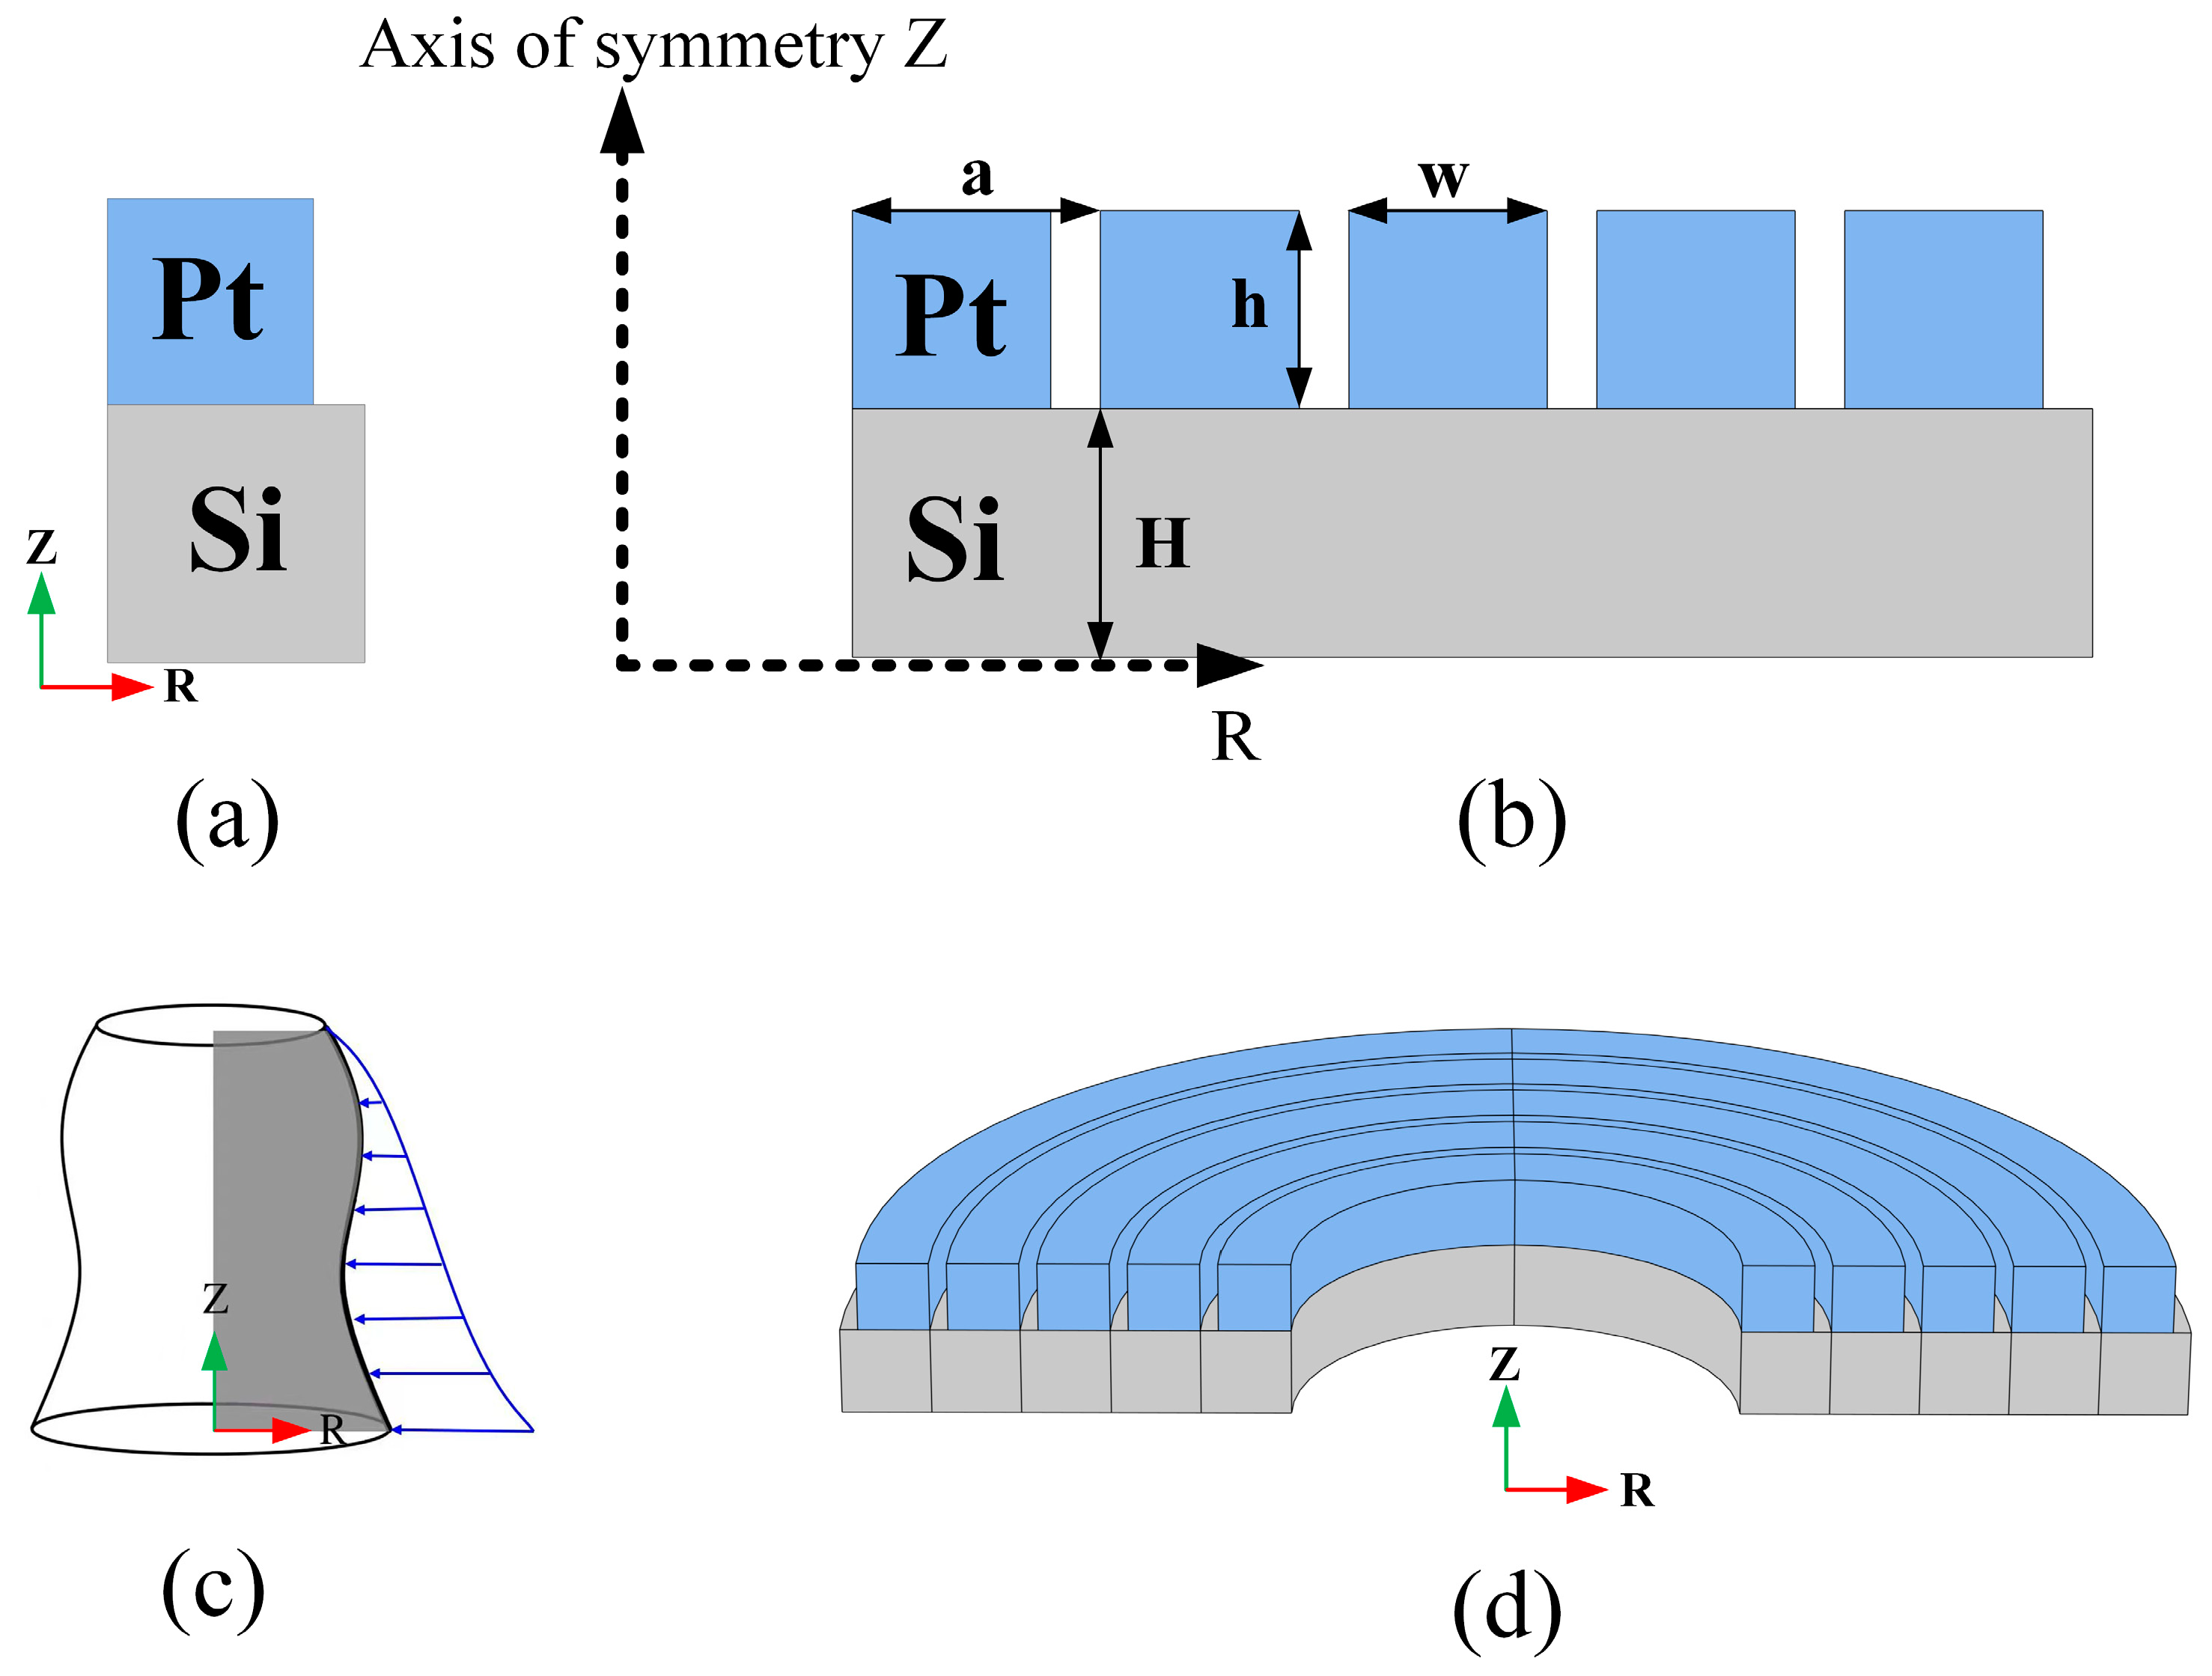
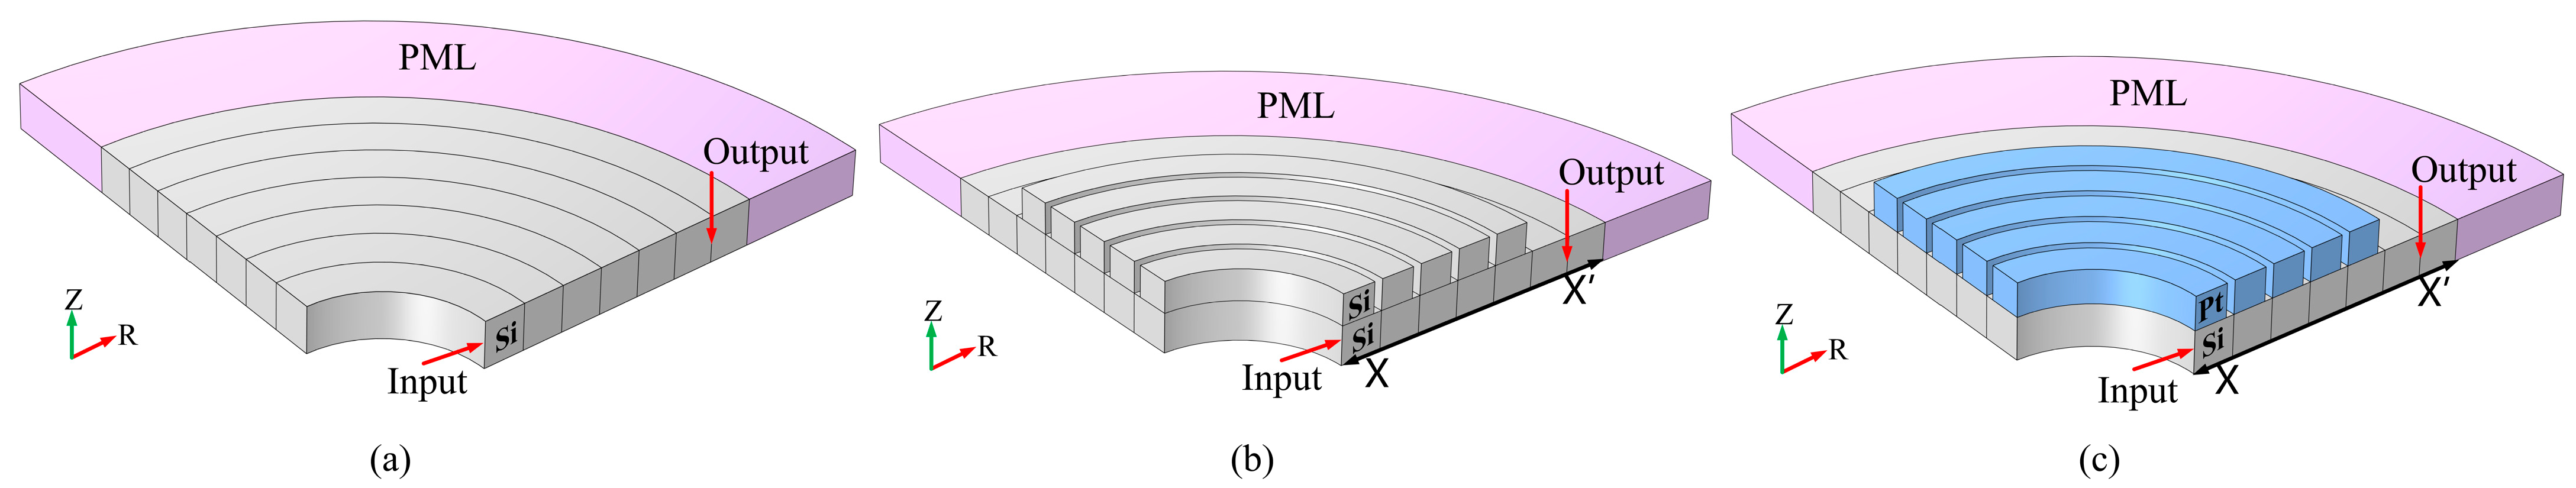
2.1. Radial Phononic Crystal Model
2.2. Theoretical Method
3. Band-Gap Characteristics of the RPCs
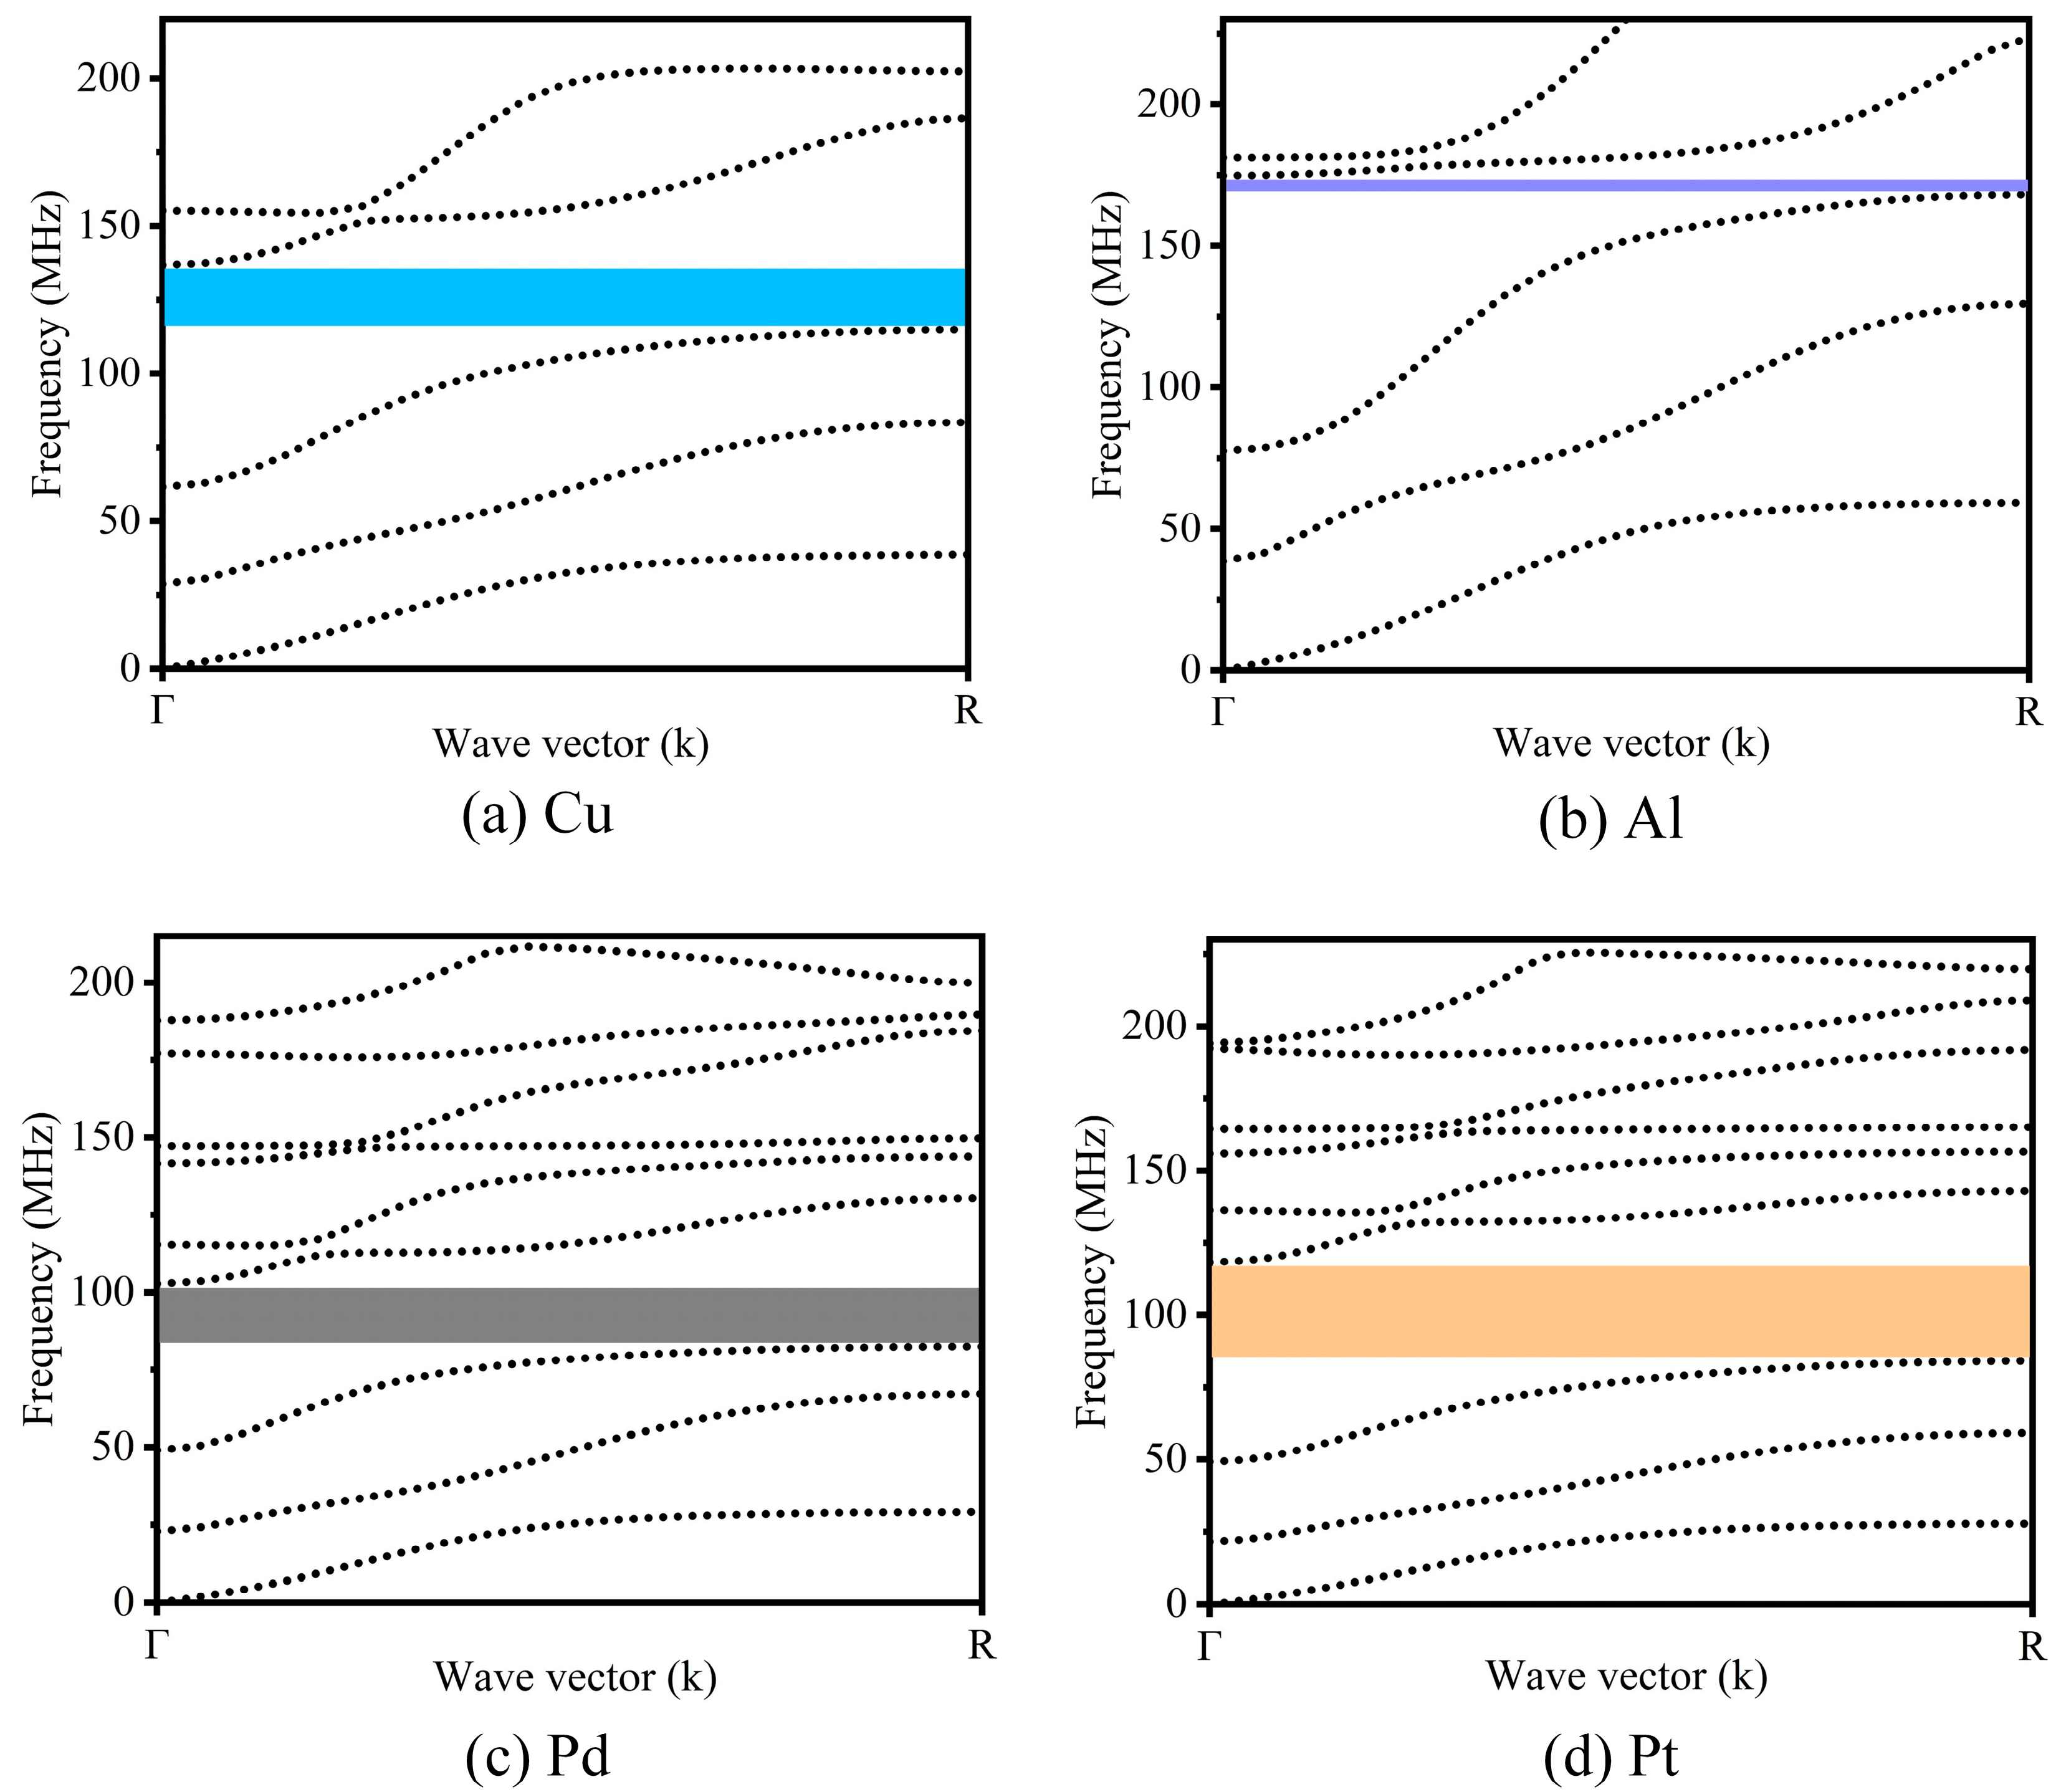
3.1. Phononic Crystal Band Gap
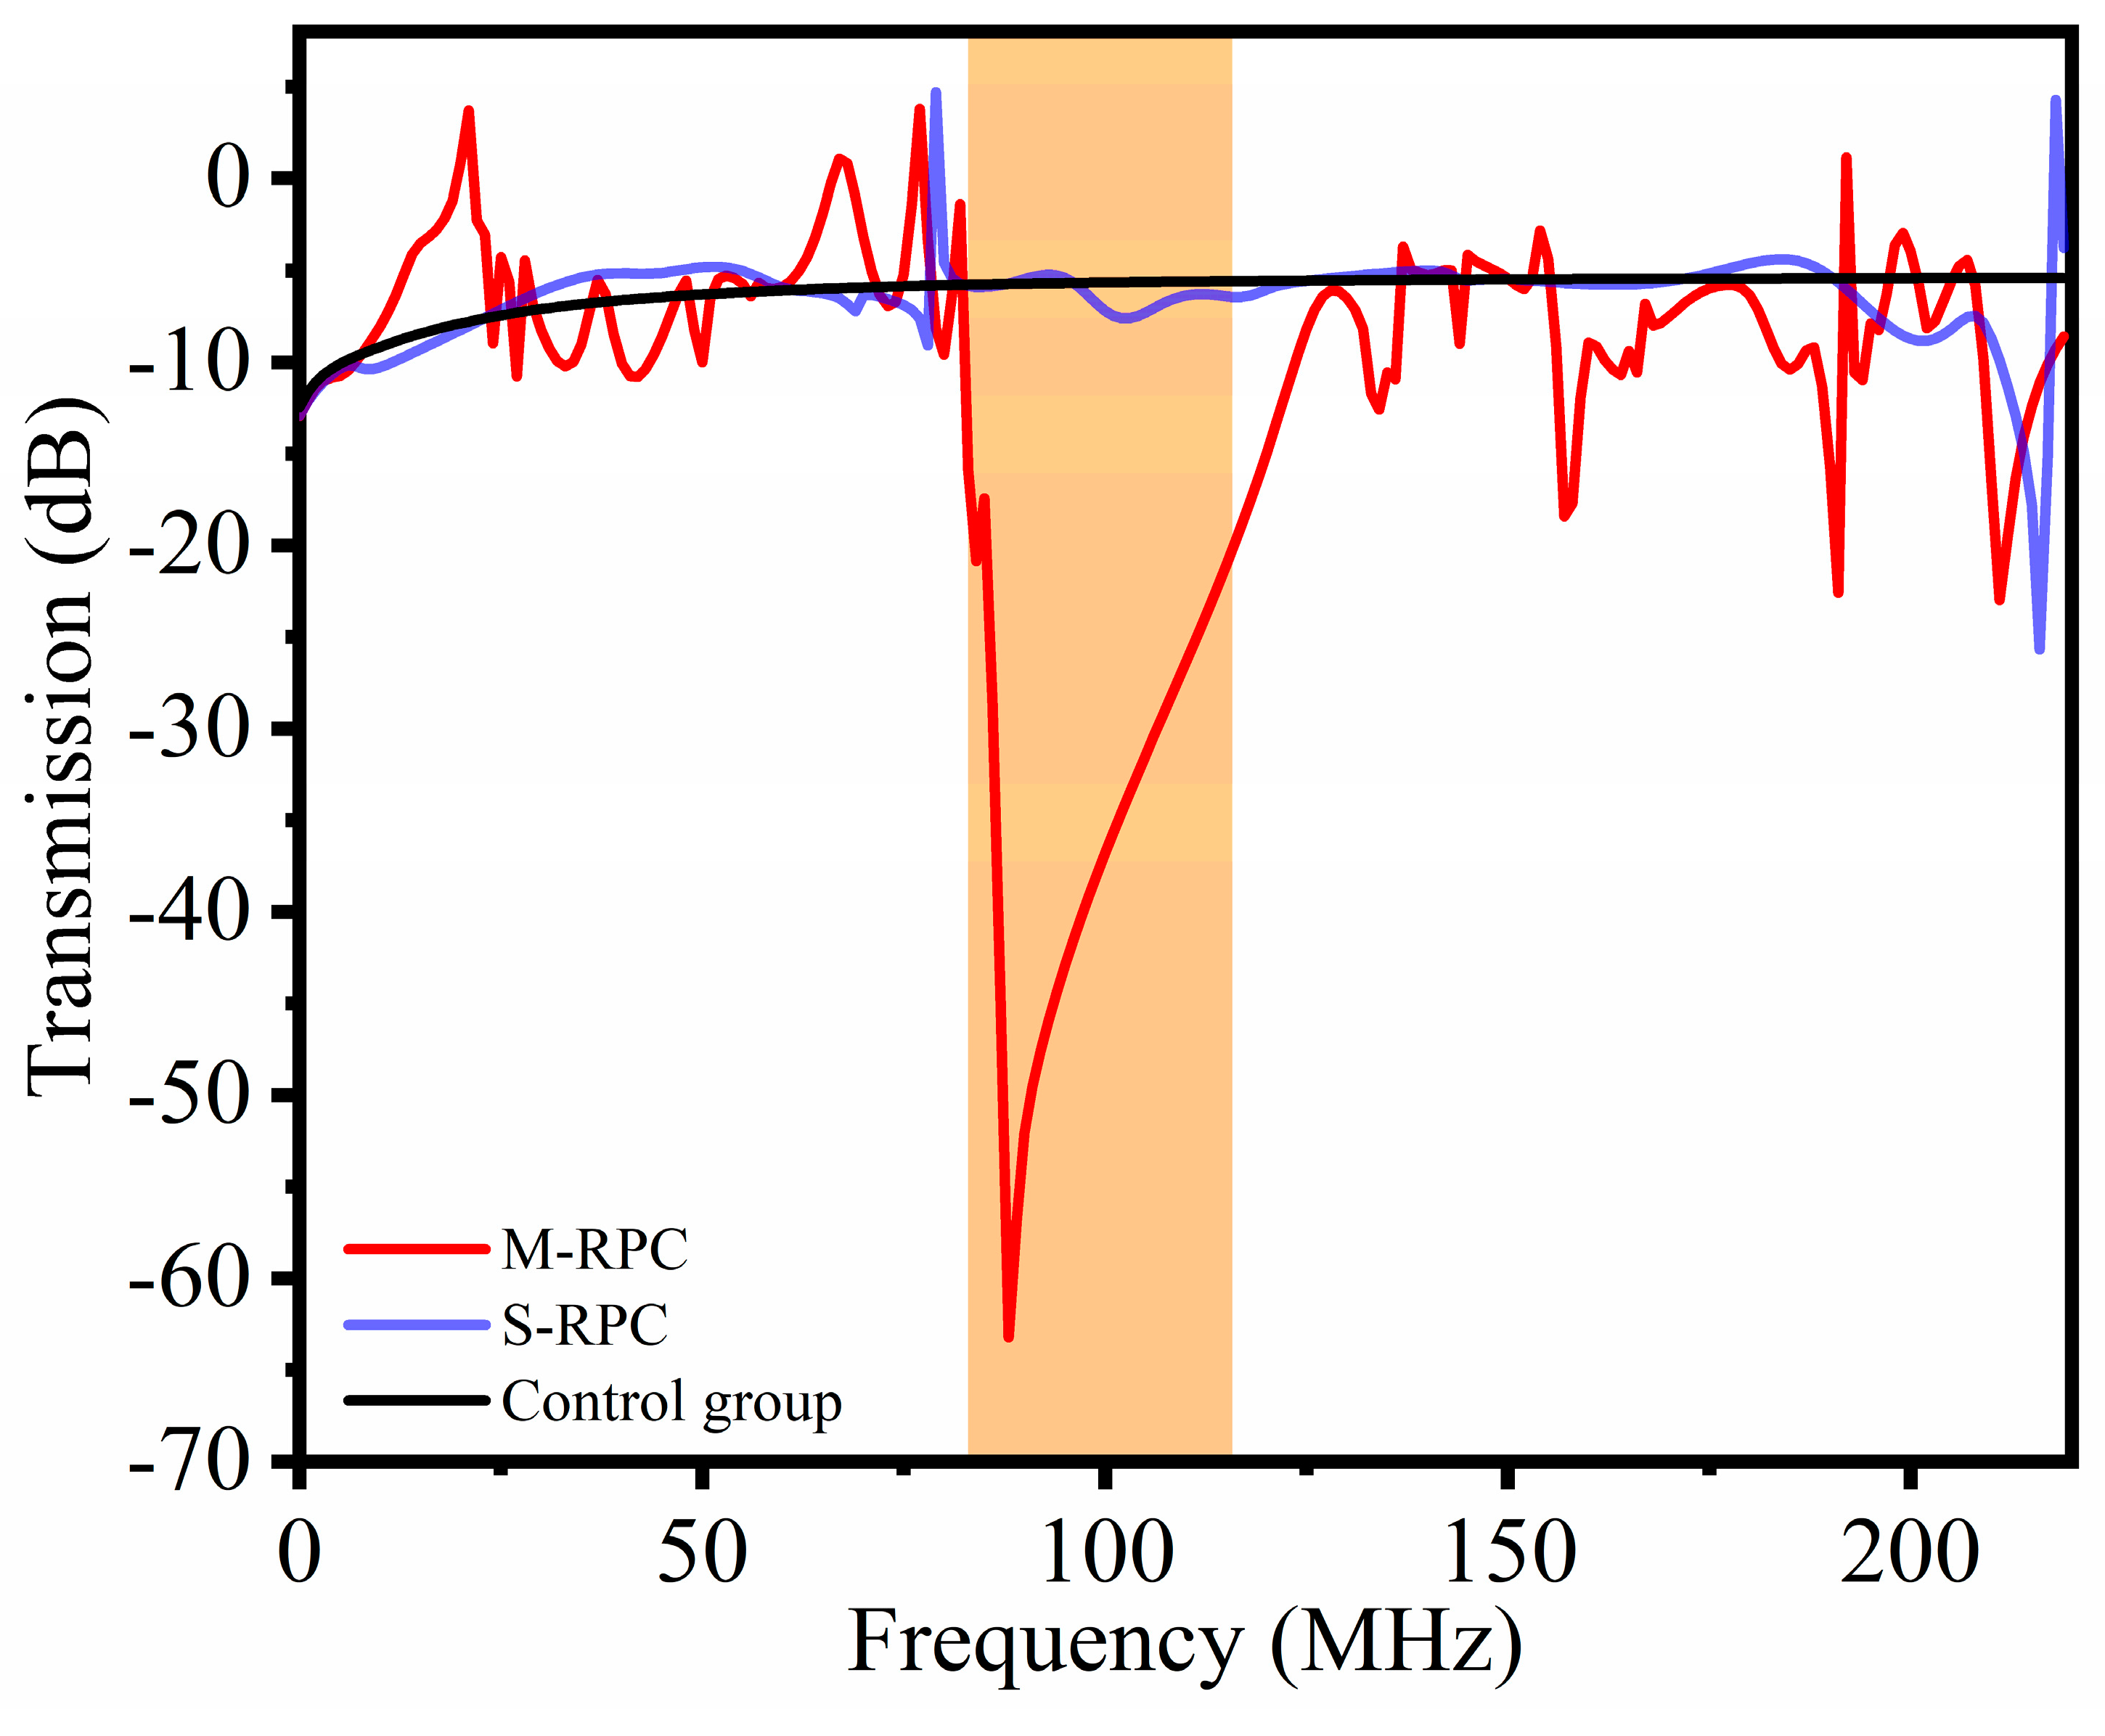
3.2. Frequency Response
3.3. The Influence of the Materials on the Band-Gap Structures
3.4. The Effect of Metal Height and Width on the Band-Gap Structure
4. Resonator Design and Analysis Results
4.1. Resonator Design
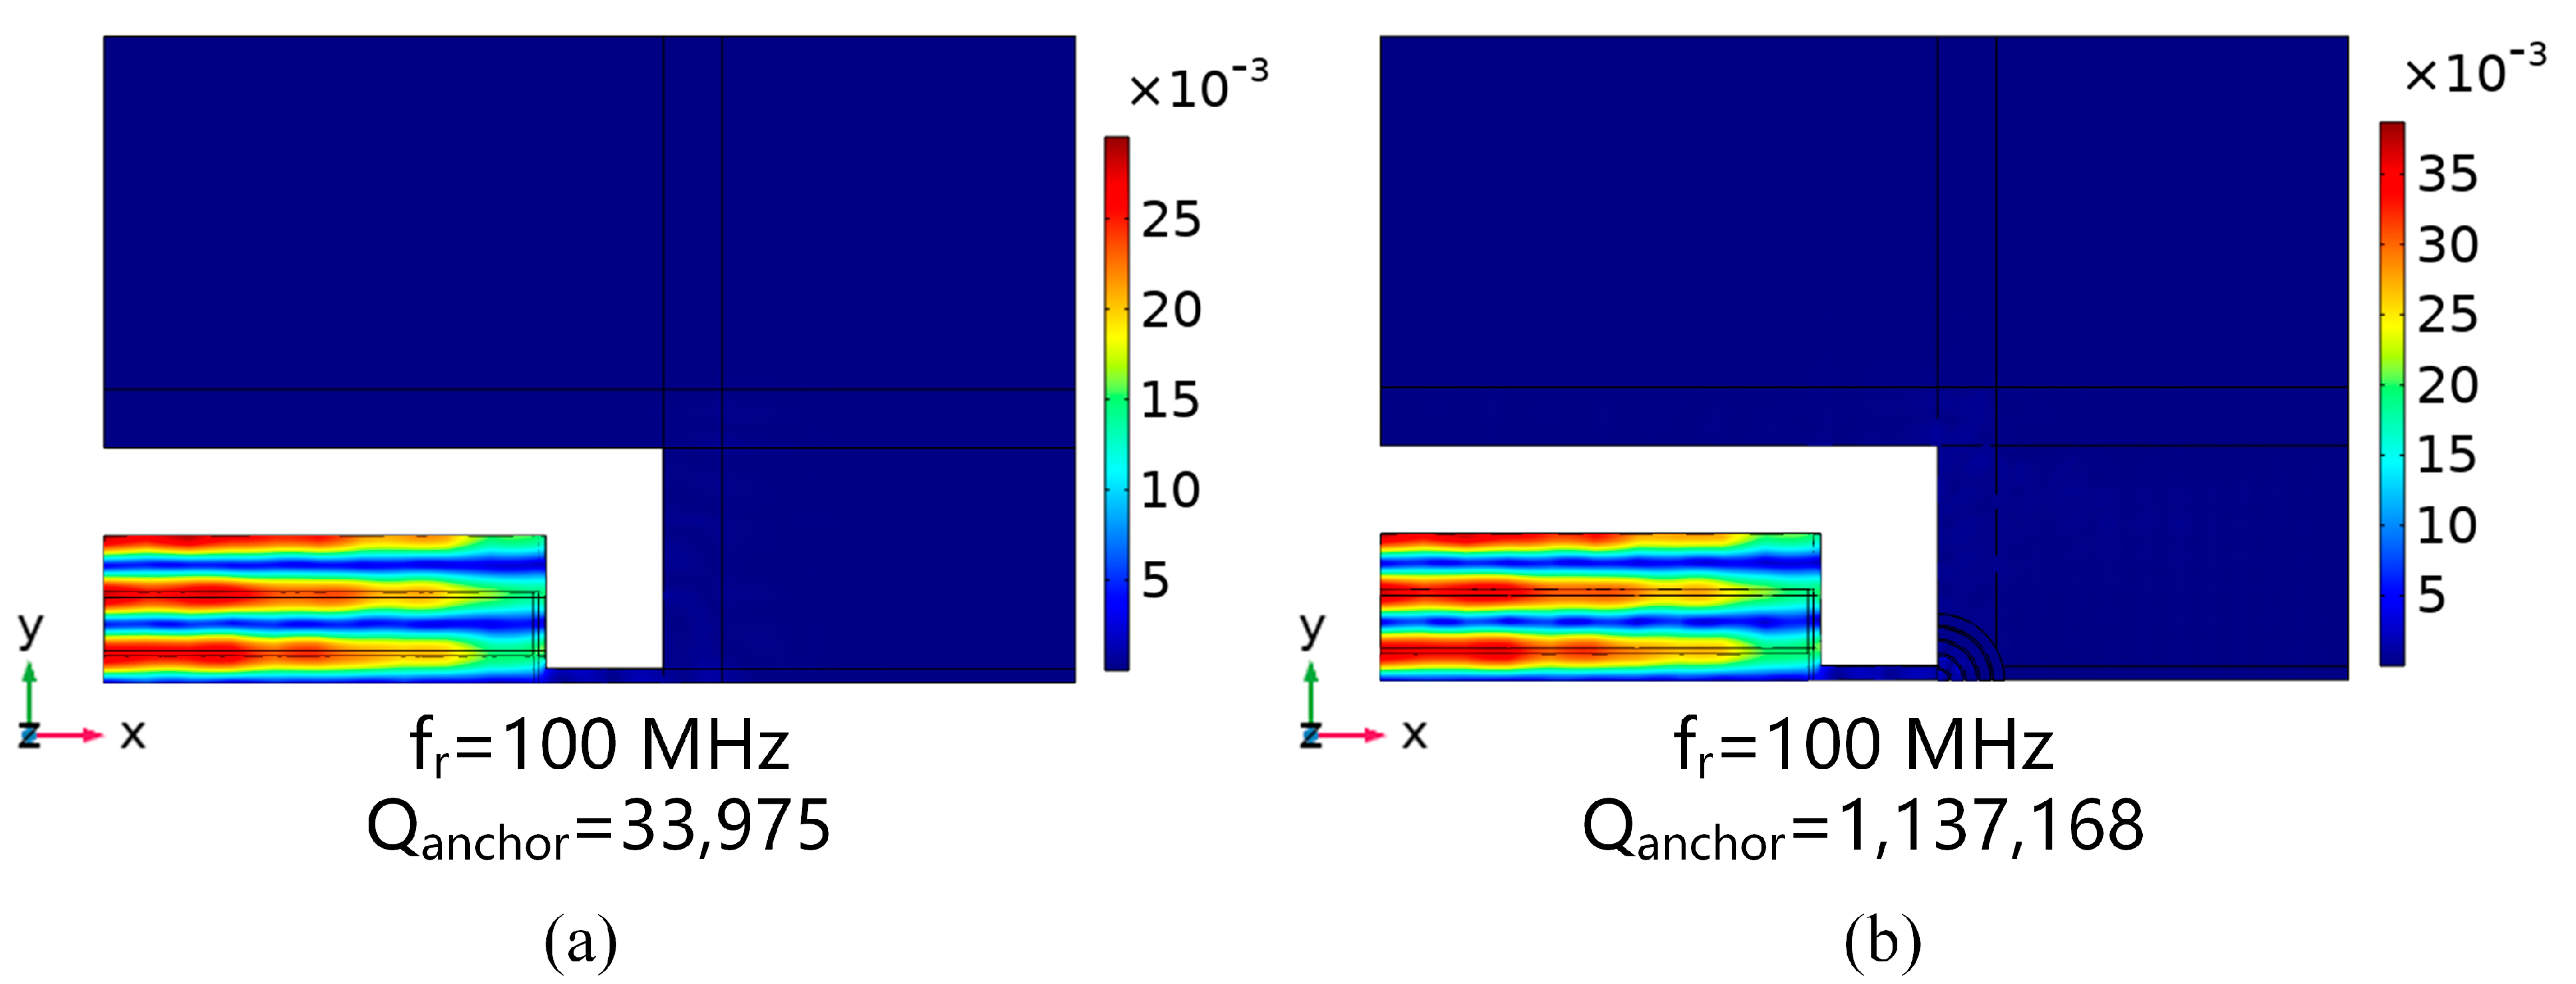
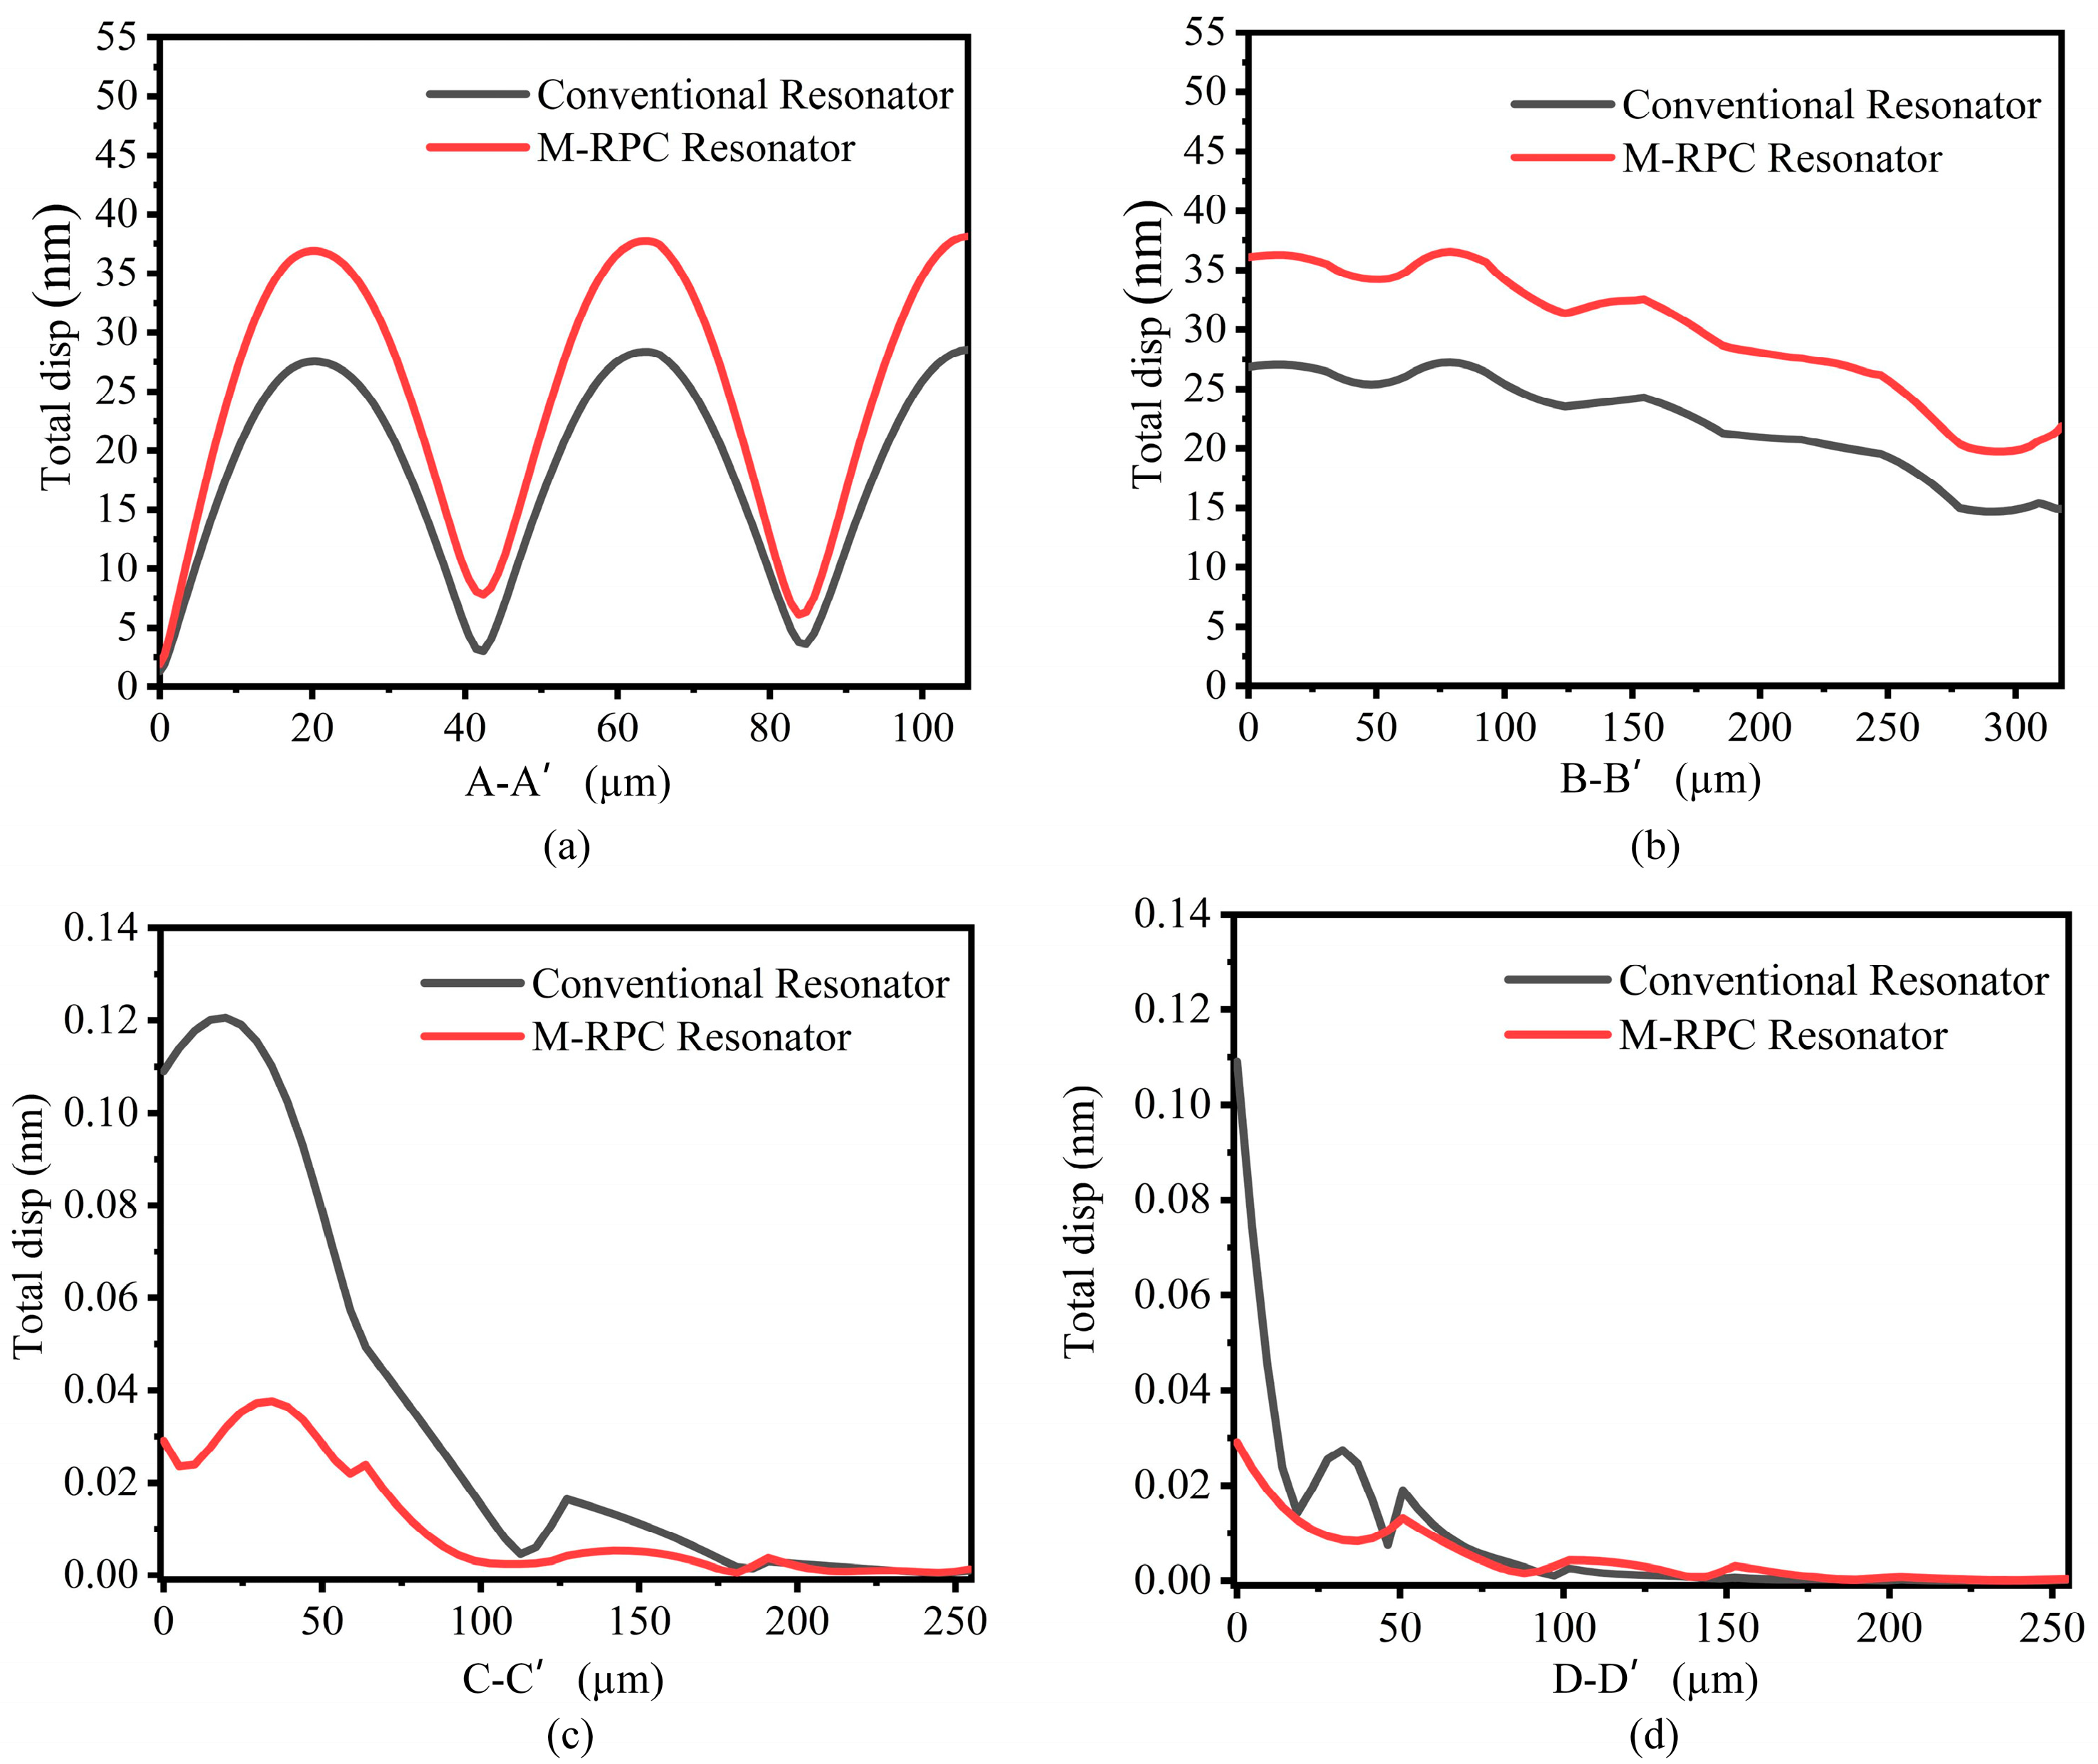
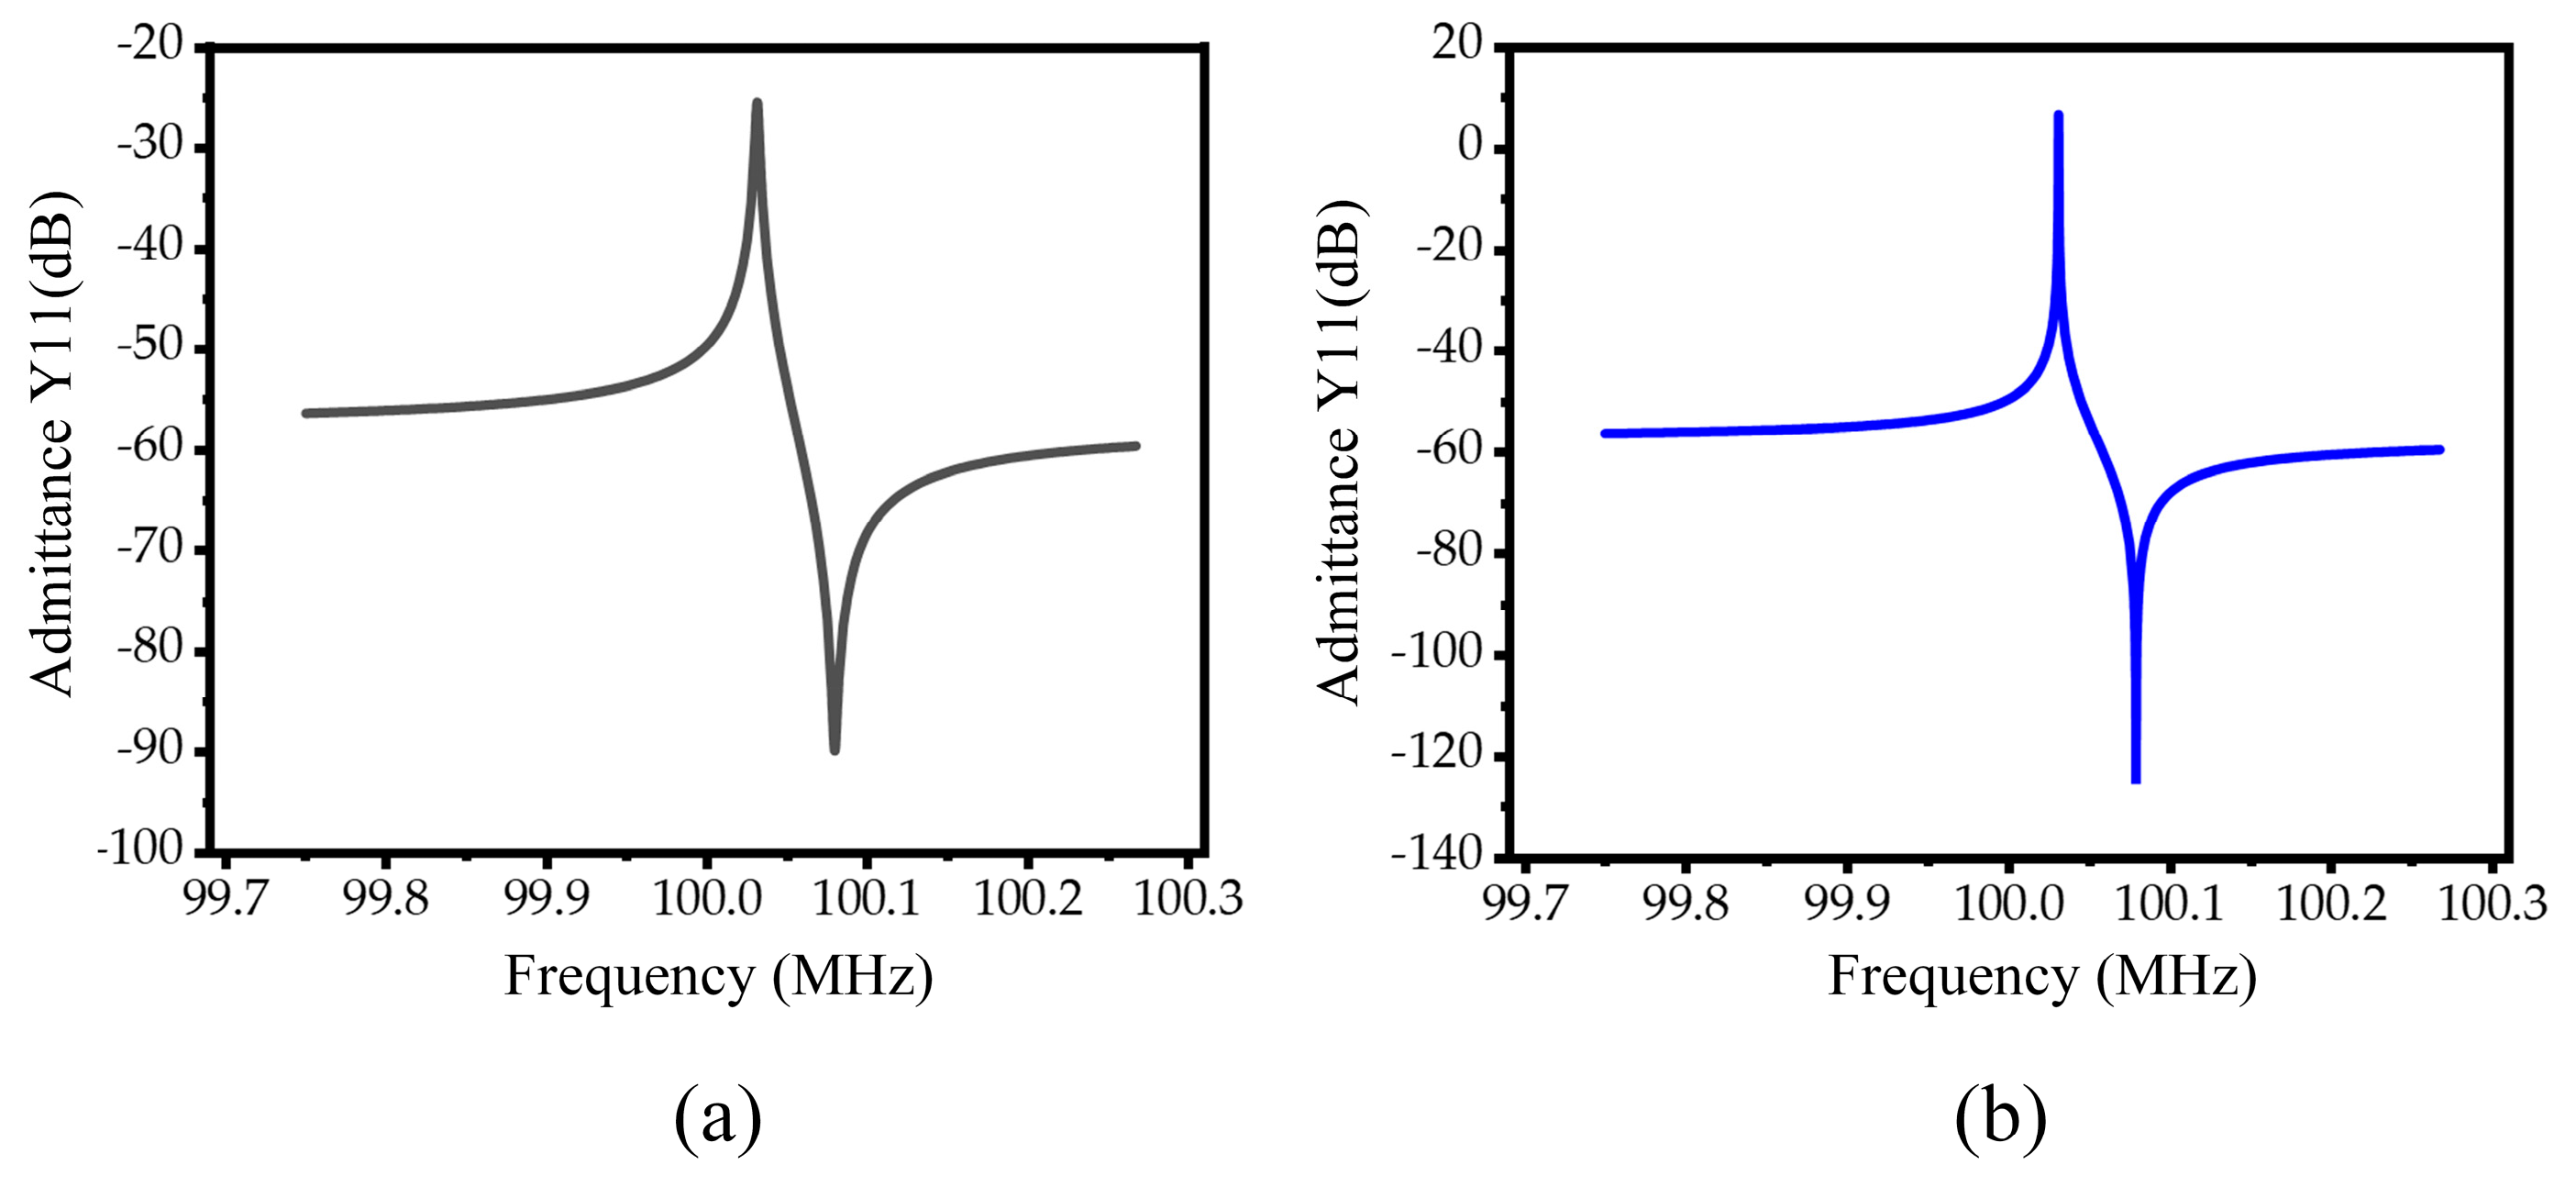
4.2. Analysis Results
5. Conclusions
Author Contributions
Funding
Data Availability Statement
Conflicts of Interest
References
- Qian, J.; Begum, H.; Lee, J.E.Y. Acoustofluidic localization of sparse particles on a piezoelectric resonant sensor for nanogram-scale mass measurements. Microsyst. Nanoeng. 2021, 7, 61. [Google Scholar] [CrossRef]
- Middlemiss, R.P.; Samarelli, A.; Paul, D.J.; Hough, J.; Rowan, S.; Hammond, G.D. Measurement of the Earth tides with a MEMS gravimeter. Nature 2016, 531, 614–617. [Google Scholar] [CrossRef]
- Ruby, R. A snapshot in time: The future in filters for cell phones. IEEE Microw. Mag. 2015, 16, 46–59. [Google Scholar] [CrossRef]
- Tu, C.; Lee, J.E.Y.; Zhang, X.S. Dissipation analysis methods and Q-enhancement strategies in piezoelectric MEMS laterally vibrating resonators: A review. Sensors 2020, 20, 4978. [Google Scholar] [CrossRef]
- Nguyen, C.T.C. MEMS technology for timing and frequency control. IEEE Trans. Ultrason. Ferroelectr. Freq. Control 2007, 54, 251–270. [Google Scholar] [CrossRef]
- Fedder, G.K.; Hierold, C.; Korvink, J.G.; Tabata, O. Resonant MEMS: Fundamentals, Implementation, and Application; John Wiley & Sons: Hoboken, NJ, USA, 2015. [Google Scholar]
- Lin, C.M.; Hsu, J.C.; Senesky, D.G.; Pisano, A.P. Anchor loss reduction in AlN Lamb wave resonators using phononic crystal strip tethers. In Proceedings of the 2014 IEEE International Frequency Control Symposium (FCS), Taipei, Taiwan, 19–22 May 2014; IEEE: Piscataway, NJ, USA, 2014; pp. 1–5. [Google Scholar]
- Frangi, A.; Cremonesi, M.; Jaakkola, A.; Pensala, T. Analysis of anchor and interface losses in piezoelectric MEMS resonators. Sens. Actuators A Phys. 2013, 190, 127–135. [Google Scholar] [CrossRef]
- Abdolvand, R.; Bahreyni, B.; Lee, J.E.Y.; Nabki, F. Micromachined resonators: A review. Micromachines 2016, 7, 160. [Google Scholar] [CrossRef]
- Deymier, P.A. (Ed.) Acoustic Metamaterials and Phononic Crystals; Springer Science & Business Media: Berlin/Heidelberg, Germany, 2013. [Google Scholar]
- Ardito, R.; Cremonesi, M.; D’Alessandro, L.; Frangi, A. Application of optimally-shaped phononic crystals to reduce anchor losses of MEMS resonators. In Proceedings of the 2016 IEEE International Ultrasonics Symposium (IUS), Tours, France, 18–21 September 2016; IEEE: Piscataway, NJ, USA, 2016; pp. 1–3. [Google Scholar]
- Bao, F.H.; Wu, X.Q.; Zhou, X.; Wu, Q.D.; Zhang, X.S.; Bao, J.F. Spider web-like phononic crystals for piezoelectric MEMS resonators to reduce acoustic energy dissipation. Micromachines 2019, 10, 626. [Google Scholar] [CrossRef]
- Workie, T.B.; Wu, T.; Bao, J.F.; Hashimoto, K.Y. Design for high-quality factor of piezoelectric-on-silicon MEMS resonators using resonant plate shape and phononic crystals. Jpn. J. Appl. Phys. 2021, 60, SDDA03. [Google Scholar] [CrossRef]
- Li, L.; He, W.; Tong, Z.; Liu, H.; Xie, M. Q-Factor Enhancement of Coupling Bragg and Local Resonance Band Gaps in Single-Phase Phononic Crystals for TPOS MEMS Resonator. Micromachines 2022, 13, 1217. [Google Scholar] [CrossRef]
- Awad, M.; Workie, T.B.; Bao, J.-F.; Hashimoto, K.-y. Reem-Shape Phononic Crystal for Q anchor enhancement of TPoS MEMS Resonator. Micromachines 2023, 14, 1540. [Google Scholar] [CrossRef]
- Li, L.; Zhu, C.; Liu, H.; Li, Y.; Wang, Q.; Su, K. Quality Factor Enhancement of Piezoelectric MEMS Resonator Using a Small Cross-Section Connection Phononic Crystal. Sensors 2022, 22, 7751. [Google Scholar] [CrossRef]
- Siddiqi, M.W.U.; Lee, J.E.Y. Wide acoustic bandgap solid disk-shaped phononic crystal anchoring boundaries for enhancing quality factor in AlN-on-Si MEMS resonators. Micromachines 2018, 9, 413. [Google Scholar] [CrossRef]
- Ghasemi Baboly, M.; Reinke, C.M.; Griffin, B.A.; El-Kady, I.; Leseman, Z.C. Acoustic waveguiding in a silicon carbide phononic crystals at microwave frequencies. Appl. Phys. Lett. 2018, 112, 103504. [Google Scholar] [CrossRef]
- Lu, R.; Manzaneque, T.; Yang, Y.; Gong, S. Lithium niobate phononic crystals for tailoring performance of RF laterally vibrating devices. IEEE Trans. Ultrason. Ferroelectr. Freq. Control 2018, 65, 934–944. [Google Scholar] [CrossRef]
- Torrent, D.; Sánchez-Dehesa, J. Radial wave crystals: Radially periodic structures from anisotropic metamaterials for engineering acoustic or electromagnetic waves. Phys. Rev. Lett. 2009, 103, 64301. [Google Scholar] [CrossRef]
- Torrent, D.; Sánchez-Dehesa, J. Acoustic resonances in two-dimensional radial sonic crystal shells. New J. Phys. 2010, 12, 073034. [Google Scholar] [CrossRef]
- Spiousas, I.; Torrent, D.; Sánchez-Dehesa, J. Experimental realization of broadband tunable resonators based on anisotropic metafluids. Appl. Phys. Lett. 2011, 98, 244102. [Google Scholar] [CrossRef]
- Ma, T.; Chen, T.; Wang, X.; Li, Y.; Wang, P. Band structures of bilayer radial phononic crystal plate with crystal gliding. J. Appl. Phys. 2014, 116, 104505. [Google Scholar] [CrossRef]
- Shu, H.; Liu, W.; Li, S.; Dong, L.; Wang, W.; Liu, S.; Zhao, D. Research on flexural wave band gap of a thin circular plate of piezoelectric radial phononic crystals. J. Vib. Control 2016, 22, 1777–1789. [Google Scholar] [CrossRef]
- Shu, H.S.; Wang, X.G.; Liu, R.; Li, X.G.; Shi, X.N.; Liang, S.J.; Xu, L.H.; Dong, F.Z. Bandgap analysis of cylindrical shells of generalized phononic crystals by transfer matrix method. Int. J. Mod. Phys. B 2015, 29, 1550176. [Google Scholar] [CrossRef]
- Li, Y.; Zhou, Q.; Zhu, L.; Guo, K. Hybrid radial plate-type elastic metamaterials for lowering and widening acoustic bandgaps. Int. J. Mod. Phys. B 2018, 32, 1850286. [Google Scholar] [CrossRef]
- An, S.; Shu, H.; Liang, S.; Shi, X.; Zhao, L. Band gap characteristics of radial wave in a two-dimensional cylindrical shell with radial and circumferential periodicities. AIP Adv. 2018, 8, 35110. [Google Scholar] [CrossRef]
- He, W.; Li, L.; Tong, Z.; Liu, H.; Yang, Q.; Gao, T. H-Shaped Radial Phononic Crystal for High-Quality Factor on Lamb Wave Resonators. Sensors 2023, 23, 2357. [Google Scholar] [CrossRef] [PubMed]
- Gao, N.; Wang, B.; Lu, K.; Hou, H. Complex band structure and evanescent Bloch wave propagation of periodic nested acoustic black hole phononic structure. Appl. Acoust. 2021, 177, 107906. [Google Scholar] [CrossRef]
- Ho, G.K.; Abdolvand, R.; Sivapurapu, A.; Humad, S.; Ayazi, F. Piezoelectric-on-silicon lateral bulk acoustic wave micromechanical resonators. J. Microelectromech. Syst. 2008, 17, 512–520. [Google Scholar] [CrossRef]
- Tu, C.; Lee, J.E.Y. VHF-band biconvex AlN-on-silicon micromechanical resonators with enhanced quality factor and suppressed spurious modes. J. Micromech. Microeng. 2016, 26, 065012. [Google Scholar] [CrossRef]
- Rawat, U.; Nair, D.R.; DasGupta, A. Piezoelectric-on-Silicon array resonators with asymmetric phononic crystal tethering. J. Microelectromech. Syst. 2017, 26, 773–781. [Google Scholar] [CrossRef]
- Bindel, D.S.; Govindjee, S. Elastic PMLs for resonator anchor loss simulation. Int. J. Numer. Methods Eng. 2005, 64, 789–818. [Google Scholar] [CrossRef]
- Chen, Q.; Wang, Q.M. The effective electromechanical coupling coefficient of piezoelectric thin-film resonators. Appl. Phys. Lett. 2005, 86, 22904. [Google Scholar] [CrossRef]


| Materials | Young’s Modulus (GPa) | Density (kg/m3) |
|---|---|---|
| Copper (Cu) | 120 | 8960 |
| Aluminum (Al) | 70 | 2700 |
| Lead (Pd) | 73 | 12,020 |
| Platinum (Pt) | 168 | 21,450 |
| Parameters | Values (Unit) |
|---|---|
| Resonator resonant frequency () | 100 (MHz) |
| Wavelength () | 84.8 (µm) |
| Inter-digitated transducer (IDT) finger () | 5 |
| Tether width (Wt) | 20 (µm) |
| Tether length (Lt) | 84.8 (µm) |
| Electrode gap (Ge) | 4 (µm) |
| Resonant width (Wr) | 212 (µm) |
| Resonant length (Lr) | 636 (µm) |
| Thickness of the Al (TAl) | 1 (µm) |
| Thickness of the AlN (TAlN) | 0.5 (µm) |
| Thickness of the substrate Si (TSi) | 10 (µm) |
| Materials | Parameters | Values |
|---|---|---|
| Aluminum nitride (AIN) | Mass density () | 3300 kg/m3 |
| Young’s modulus (E) | 320 GPa | |
| Poisson’s ratio (ν) | 0.24 | |
| Relative permittivity (ε) | 9 | |
| Aluminum (Al) | Mass density () | 2700 kg/m3 |
| Young’s modulus (E) | 70 GPa | |
| Poisson’s ratio (ν) | 0.35 | |
| Electrical conductivity (σ) | 35.5 × 10⁶ S/m | |
| Coefficient of thermal expansion (α) | 23.1 × 10⁻⁶ 1/K | |
| Heat capacity (Cp) | 904 J/(Kg K) | |
| Thermal conductivity (κ) | 237 W/(mK) | |
| Silicon (Si) | Mass density () | 2330 kg/m3 |
| Young’s modulus (E) | Ex = 169 GPa | |
| Ey = 169 GPa | ||
| Ez = 130 GPa | ||
| Shearing’s modulus (G) | Gxy = 50.9 GPa | |
| Gyz = 79.6 Gpa | ||
| Gzx = 79.6 Gpa | ||
| Poisson’s ratio (ν) | σxy = 0.064 | |
| σyz = 0.36 | ||
| σzx = 0.28 |
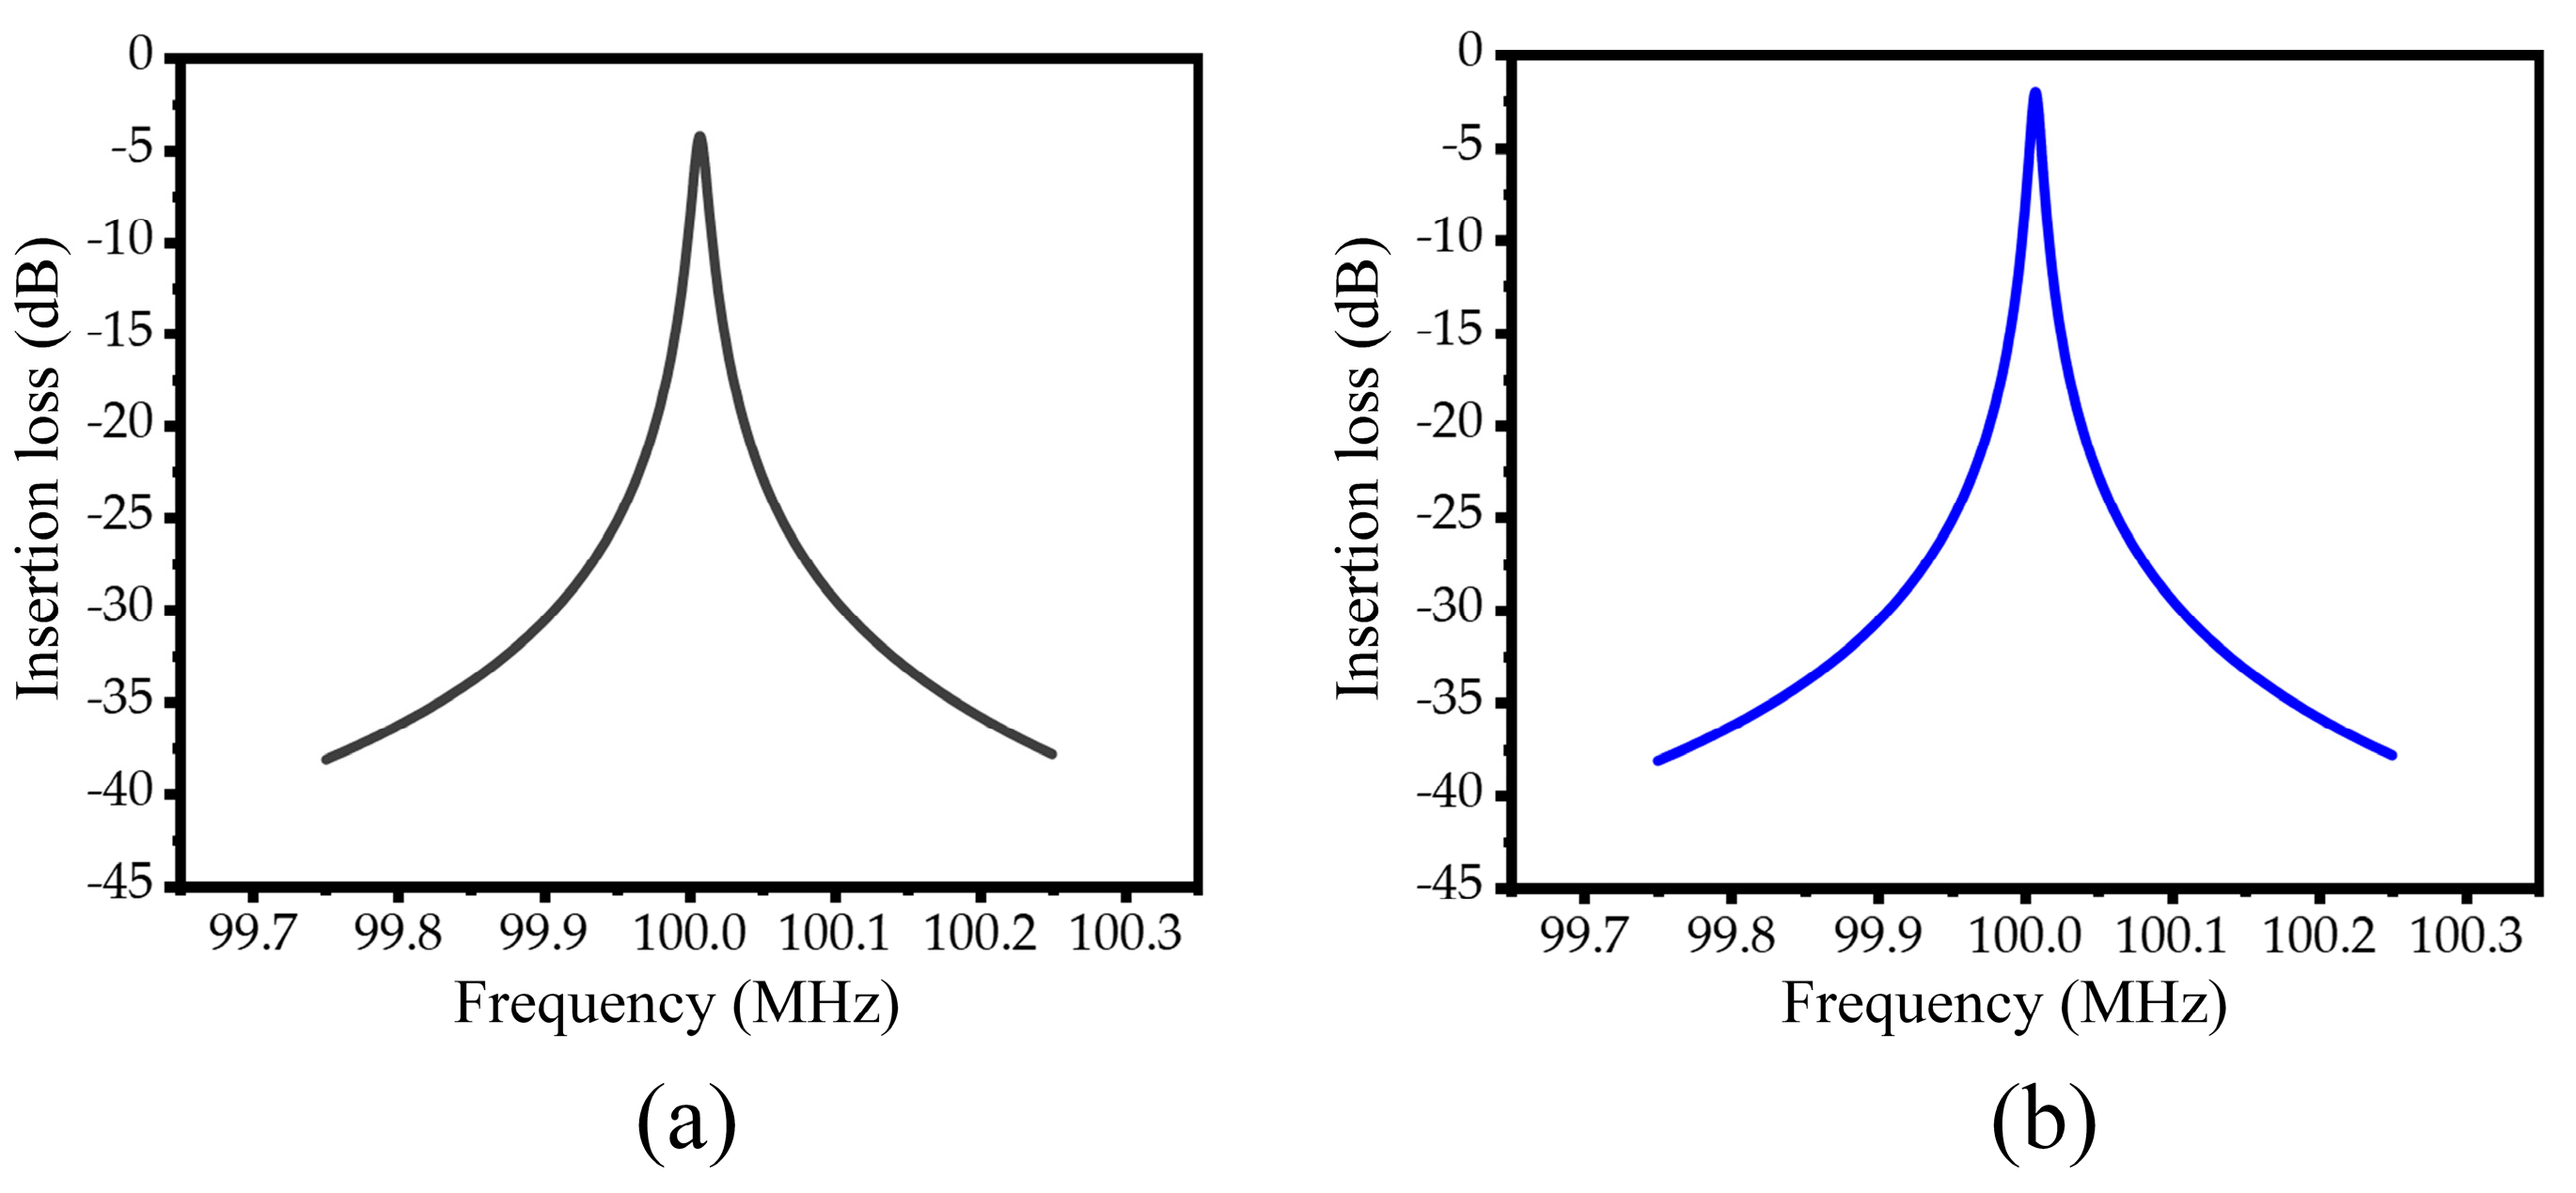
| Parameters | Conventional Resonator | M-RPC Resonator |
|---|---|---|
| ), MHz | 100 | 100 |
| ), dB | 4.2 | 1.95 |
| ), % | 0.12 | 0.12 |
| 33,975 | 1,137,168 | |
| ) | 9902 | 17,395 |
| ) | 25,826 | 86,505 |
Disclaimer/Publisher’s Note: The statements, opinions and data contained in all publications are solely those of the individual author(s) and contributor(s) and not of MDPI and/or the editor(s). MDPI and/or the editor(s) disclaim responsibility for any injury to people or property resulting from any ideas, methods, instructions or products referred to in the content. |
© 2023 by the authors. Licensee MDPI, Basel, Switzerland. This article is an open access article distributed under the terms and conditions of the Creative Commons Attribution (CC BY) license (https://creativecommons.org/licenses/by/4.0/).
Share and Cite
Yang, Q.; Gao, T.; Zhu, C.; Li, L. Multi-Material Radial Phononic Crystals to Improve the Quality Factor of Piezoelectric MEMS Resonators. Micromachines 2024, 15, 20. https://doi.org/10.3390/mi15010020
Yang Q, Gao T, Zhu C, Li L. Multi-Material Radial Phononic Crystals to Improve the Quality Factor of Piezoelectric MEMS Resonators. Micromachines. 2024; 15(1):20. https://doi.org/10.3390/mi15010020
Chicago/Turabian StyleYang, Qian, Tianhang Gao, Chuang Zhu, and Lixia Li. 2024. "Multi-Material Radial Phononic Crystals to Improve the Quality Factor of Piezoelectric MEMS Resonators" Micromachines 15, no. 1: 20. https://doi.org/10.3390/mi15010020
APA StyleYang, Q., Gao, T., Zhu, C., & Li, L. (2024). Multi-Material Radial Phononic Crystals to Improve the Quality Factor of Piezoelectric MEMS Resonators. Micromachines, 15(1), 20. https://doi.org/10.3390/mi15010020