Article

Self-Assembled Nanotubes Based on Chiral H8-BINOL Modified with 1,2,3-Triazole to Recognize Bi3+ Efficiently by ICT Mechanism

1
Jiangxi Key Laboratory of Organic Chemistry, Jiangxi Science and Technology Normal University, Nanchang 330013, China
2
State Key Laboratory of Molecular Engineering of Polymers, Shanghai Key Laboratory of Molecular Catalysis and Innovative Materials iChEM, Department of Chemistry, Fudan University, Shanghai 200433, China
3
College of Chemistry, Nanchang University, Nanchang 330031, China
*
Authors to whom correspondence should be addressed.
Micromachines 2024, 15(1), 163; https://doi.org/10.3390/mi15010163
Submission received: 30 November 2023 / Revised: 18 January 2024 / Accepted: 20 January 2024 / Published: 22 January 2024
(This article belongs to the Special Issue Miniaturized Chemical Sensors)

Abstract

:
A novel fluorescent “off” probe R-β-D-1 containing a 1,2,3-triazole moiety was obtained by the Click reaction with azidoglucose using H8-BINOL as a substrate, and the structure was characterized by 1H NMR and 13C NMR and ESI-MS analysis. The fluorescence properties of R-β-D-1 in methanol were investigated, and it was found that R-β-D-1 could be selectively fluorescently quenched by Bi3+ in the recognition of 19 metal ions and basic cations. The recognition process of Bi3+ by R-β-D-1 was also investigated by fluorescence spectroscopy, SEM, AFM, etc. The complex pattern of R-β-D-1 with Bi3+ was determined by Job’s curve as 1 + 1, and the binding constant Ka of R-β-D-1 and Bi3+ was valued by the Benesi–Hildebrand equation as 1.01 × 10⁴ M−1, indicating that the binding force of R-β-D-1 and Bi3+ was medium. The lowest detection limit (LOD) of the self-assembled H8-BINOL derivative for Bi3+ was up to 0.065 µM. The mechanism for the recognition of Bi3+ by the sensor R-β-D-1 may be the intramolecular charge transfer effect (ICT), which was attributed to the fact that the N-3 of the triazole readily serves as an electron acceptor while the incorporation of Bi3+ serves as an electron donor, and the two readily undergo coordination leading to the quenching of fluorescence. The recognition mechanism and recognition site could be verified by DFT calculation and CDD (Charge Density Difference).

1. Introduction

Supramolecular self-assembly is the formation of thermodynamically stable aggregates by molecular recognition or noncovalent bonding forces between basic structural units without human intervention. In these aggregates, the components also maintain their own intrinsic properties but exhibit certain overall characteristics due to their interactions and perturbations. These noncovalent interactions include hydrogen bonding, electrostatic interactions, π-π interaction, van der Waals forces and hydrophilic and hydrophobic forces [1]. It is well known that nature can assemble relatively simple molecular precursors into extremely complex biomolecules that are very important in living organisms, such as protein folding, nucleic acid assembly, phospholipid membranes and ribosomes. These self-assembly modalities have given researchers a lot of inspiration to obtain similar structures through these kinds of weak forces [2]. The properties of self-assembled materials change significantly compared to molecular materials [3]. As a cross-discipline between supramolecular chemistry and materials chemistry, the structural study of supramolecular self-assembly can help to enhance the understanding of the microstructure of molecular materials [4,5,6]. In the process of chemical development, molecular self-assembly nanomaterials have attracted more and more attention due to their wide applications in sensing, separation [7,8], catalysis [9,10], biomedicine [11,12,13], pharmacology [14,15,16] and other fields.
Bi3+ has a wide range of applications in various industries and fields. The presence of Bi3+ in a variety of materials and products is widely recognized, such as in the preparation and recovery of uranium, where it is used to absorb neutrons and stabilize the crystal lattice in nuclear fuel. This is critical in the field of nuclear energy to ensure the efficient and safe operation of nuclear power plants [17,18]. Studies have also shown that Bi3+ plays a crucial role in the production of semiconductor materials and alloys, particularly in the production of various photovoltaic cells [19,20,21], which are essential for the utilization of renewable energy sources. Bi3+ is also highly sought after in the cosmetic and pharmaceutical industries, where it is commonly incorporated into eye shadows, lipsticks and hair dyes to provide the desired aesthetic properties [22]. In the pharmaceutical industry, Bi3+ is used as an active pharmaceutical ingredient, particularly for the treatment of syphilis, peptic ulcers and hypertension [23,24]. It has been found that Bi3+ significantly improves the efficacy of various drugs, such as antibiotics and anti-inflammatory drugs. However, the benefits of Bi3+ are often outweighed by its potential risks if it is mishandled or used inappropriately. Identifying Bi3+ is therefore critical, especially when used in cosmetics and pharmaceuticals, where the presence of Bi3+ can have potentially harmful consequences, including causing diseases such as osteoarthritis and hepatitis, if not handled or used correctly. Therefore, the rapid and accurate identification of Bi3+ is necessary to prevent potential hazards and ensure consumer safety, and the development of sensitive and accurate Bi3+ detection methods is essential. Among the various assays that have been explored, fluorescent methods have been shown to be the most sensitive, accurate and efficient Bi3+ detection technique [25]. For example, when Wu et al. [26] studied the AIE effect based on glutathione-protected nonmetallic copper nanoparticles, the presence of Bi3+ effectively quenched the fluorescence of the sensor, thus achieving a faster and more sensitive fluorescence recognition of Bi3+. ShaJi et al. [27] studied the condensation reaction of toluenesulfonyl hydrazine and julolidine formaldehyde to obtain a novel dual-fluorescence colorimetric probe; in the presence of Bi3+, it achieved a visual color change and turn on fluorescence response to Bi3+ in human skeletal tumor cells through cellular imaging.
Since BINOL (binaphthol) is a unique organic compound with a C2 axisymmetric aromatic backbone, its conformation is exceptionally stable. This special structure gives it a rigid structure as well as good optical activity. In addition, its unique properties make it easy to modify, with many positions that can be chemically reacted to produce different derivatives. For example, the 3, 3′, 4, 4′ and 6, 6′ positions in the molecule can be modified by introducing different groups to realize various transformations. In addition, the two hydroxyl groups at its 2 position can be easily linked to other groups to synthesize a wide range of different compounds, thus expanding its potential for use and application. The simplicity and affordability of BINOL make it an ideal material for a wide range of applications, appealing to a wide variety of industries and scientific research. One of the most notable applications of BINOL is its use as a fluorescent probe for the rapid, sensitive recognition of metal ions and chiral amino acids [28,29]. This unique property stems from BINOL’s chiral photoactivity, which means that it fluoresces when irradiated with light at specific wavelengths. This makes it highly sensitive and capable of rapidly detecting trace amounts of metal ions or amino acids, making it an excellent tool for a variety of analytical applications [30]. Yu et al. [31] synthesized a small molecule gel based on BINOL phosphoric acid, which improved the gelation ability by complexing with Cu2+; L-histidine was highly sensitive to the formed organometallic gel and caused it to undergo gel collapse, while D-histidine did not affect it, enabling the enantiomeric recognition of histidine. Pu et al. [32] utilized the dynamic public chemistry of imines and found that the bis-aldehyde structure with BINOL as the substrate could undergo regioselective and enantioselective macrocyclization reactions with chiral diamines, whereas better enantioselectivity with Zn2+ coordination allowed high chemoselectivity and enantioselectivity for lysine.
In recent years, the synthesis, structural analysis and application of 1,2,3-triazole-modified sugar derivatives and sugar-based fluorescent chemosensors have received increasing attention because of their potential to greatly expand the fields of glycoscience and biotechnology. We investigated BINOL-glucose derivative fluorescent sensors, which exhibit high enantioselectivity and sensitivity to silver ions and are not interfered with by Hg2+ [33]. In addition, according to studies, triazoles can be used as corrosion inhibitors for organocopper [34]; especially, 1,2,4-triazole group derivatives are the most effective, whereas 1,2,3-triazole has a better affinity for metal ions, with an easier complexation with metal ions compared to 1,2,4-triazole [35,36]. On the other hand, 1,2,3-triazoles have a higher affinity for and are more readily coordinated to metal ions (especially Fe3+ and Cu2+), as confirmed by several studies [37,38]. However, few studies have investigated the complexation of 1,2,3-triazole structures with the metal Bi3+. Therefore, we introduced a glucose-modified triazole at position 3 of H8-BINOL and used the 1,2,3-triazole moiety and H8-BINOL as the recognition site and fluorophore, respectively. The aim of this study was to investigate monosubstituted glucose-modified triazole sensors that self-assembled into nanotubes in ethanol and into small spherical shapes in methanol. In addition, the study explored the application of this derivative in the molecular recognition of metal ions and found that it exhibited a unique fluorescence response to Bi3+, and DFT (density functional theory calculations) and CDD (Charge Density Difference) calculations were utilized to confirm the mechanism of the sensor’s recognition of Bi3+.

2. Materials and Methods

To ensure a high purity and reproducibility of our experiments, all solvents were meticulously prepared and, if necessary, redistilled several times to remove any unwanted organic or inorganic impurities. We selected only analytical grade chemicals, which were either obtained directly from trusted pharmaceutical companies or synthesized through well-established controlled laboratory protocols. This approach ensured that the purity of our reagents was superior to most off-the-shelf products. To prepare the 0.1 M metal ion methanol solutions, we used the corresponding metal nitrates or chlorides. Unless otherwise stated in the experimental protocol, BiCl3 was the primary source of Bi3+, TMS was used as an internal standard and chloroform-D or dimethylsulfoxide-D6 was used as the solvent. We used a Germany Bruker AM-400WB spectrometer to measure the 1H NMR and 13C NMR spectra of the compounds and a Hitachi F-7100 fluorescence spectrometer from Hitachi High-Tech in Japan, to measure the fluorescence properties of the sensors, while high-resolution mass spectra were obtained by Germany Bruker Amazon SL ion trap MS tests.
In a 100 mL aubergine flask, G1 (1-bromo-2,3,4,6-tetra-O-acetyl-α-D-glucose, 2.00 g, 4.86 mmol) was accurately weighed, the reaction system was sealed and TMSN3 (azidotrimethylsilane, 2.12 g, 18.48 mmol) and TBAF (tetrabutylammonium fluoride, 5.07 mL, 18.48 mmol) in 15 mL THF were added under the protection of argon gas. The reaction was carried out at room temperature for 24 h. The complete reaction of the raw materials was shown by TLC (V(ethyl acetate):V(petroleum ether) = 1:4), and the solvent was evaporated by rotary evaporator and then separated by column chromatography to obtain 1.31 g of white solid G2 (1-azido-2,3,4,6-tetra-O-acetyl-β-D-glucose), which was obtained as a 72.1% yield. 1H NMR (400 MHz, DMSO-d6) δ 5.30 (t, J = 9.6 Hz, 1H), 5.11 (d, J = 8.9 Hz, 1H), 4.96 (t, J = 9.5 Hz, 1H), 4.80 (t, J = 9.3 Hz, 1H), 4.17–4.02 (m, 3H), 2.01 (d, J = 4.7 Hz, 12H).13C NMR (100 MHz, DMSO-d6) δ 170.10, 169.33, 169.20, 139.25, 86.39, 73.66, 72.93, 71.98, 70.41, 67.96, 67.16, 61.81, 60.60, 20.59.
R-P (R-2′-(prop-2-yn-1-yloxy)-5,5′,6,6′,7,7′,8,8′-octahydro-[1,1′-binaphthalen]-2-ol, 0.20 g, 0.60 mmol) and G2 (1-azido-2,3,4,6-tetra-O-acetyl-β-D-glucose, 0.38 g, 1.02 mmol). Under argon protection, 5 mL of tetrahydrofuran was added to the system. It was stirred in an ice bath for a few minutes to dissolve completely, then sodium ascorbate (0.25 g, 0.66 mmol) and anhydrous copper sulfate (0.17 g, 0.66 mmol) were accurately weighed, dissolved in 4 mL of deionized water and shaken well. When the mixed solution turned earthy yellow, it was added to the reaction system. The system was reacted for 10 h at room temperature for TLC (V(petroleum ether):V(ethyl acetate) = 4:1). The reaction was quenched by adding 5 mL of ice water to the reaction system and then extracted three times with 15 mL of dichloromethane. The extracted organic phases were then combined, washed with saturated NaCl solution and dried with MgSO4 anhydrous for 30 min. After filtration and rotary evaporation of the solvent, the separation was carried out by column chromatography (V(ethyl acetate):V(petroleum ether) = 1:1). About 0.32 g of white solid R-β-D-1 was obtained as a 77.8% yield. MS-ESI m/z calcd for (C37H43N3O11+H+) = 706.2970, found 706.2980; 1H NMR (400 MHz, DMSO-d6) δ 8.55 (s, 1H), 7.98 (s, 1H), 6.88 (q, J = 8.4 Hz, 2H), 6.74 (d, J = 8.1 Hz, 1H), 6.58 (d, J = 8.2 Hz, 1H), 6.26 (d, J = 8.6 Hz, 1H), 5.57–5.40 (m, 2H), 5.09 (t, J = 9.6 Hz, 1H), 4.92 (q, J = 12.9 Hz, 2H), 4.40–4.22 (m, 1H), 4.15–3.93 (m, 2H), 2.73–2.52 (m, 4H), 2.33–1.85 (m, 12H), 1.84–1.32 (m, 12H). 13C NMR (100 MHz, DMSO-d6) δ 169.91, 169.45, 169.28, 169.03, 168.24, 153.09, 151.78, 144.42, 139.06, 136.17, 135.68, 129.65, 128.13, 126.81, 123.32, 122.76, 112.74, 111.58, 83.68, 73.47, 73.23, 72.05, 70.22, 67.53, 66.96, 65.27, 62.00, 61.78, 60.40, 28.76, 26.72, 26.59, 22.72, 22.63, 20.42, 20.31, 20.18, 19.74.

3. Results

According to Scheme 1, the relatively easily synthesized R-P compound was synthesized from R-0 (R-H8-BINOL) and 3-bromo-1-propyne, producing the compound as a yield of 69.6%. In contrast, azido glucose was obtained by introducing G1 (1-bromo-2,3,4,6-tetra-O-acetyl-α-D-glucose) into the azide group with the azide reagent TMSN3 under TBAF catalysis to obtain G2 (1-azido-2,3,4,6-tetra-O-acetyl-β-D-glucose). Then, the Click reaction between R-P and G2 was catalyzed by Cu+ (formed by the reduction of copper sulfate with sodium ascorbate) to obtain the desired target sensor. The yield of this process was found to be 77.8%. The structure of the resulting R-β-D-1 compound was characterized using 1H NMR, 13C NMR and ESI-MS.

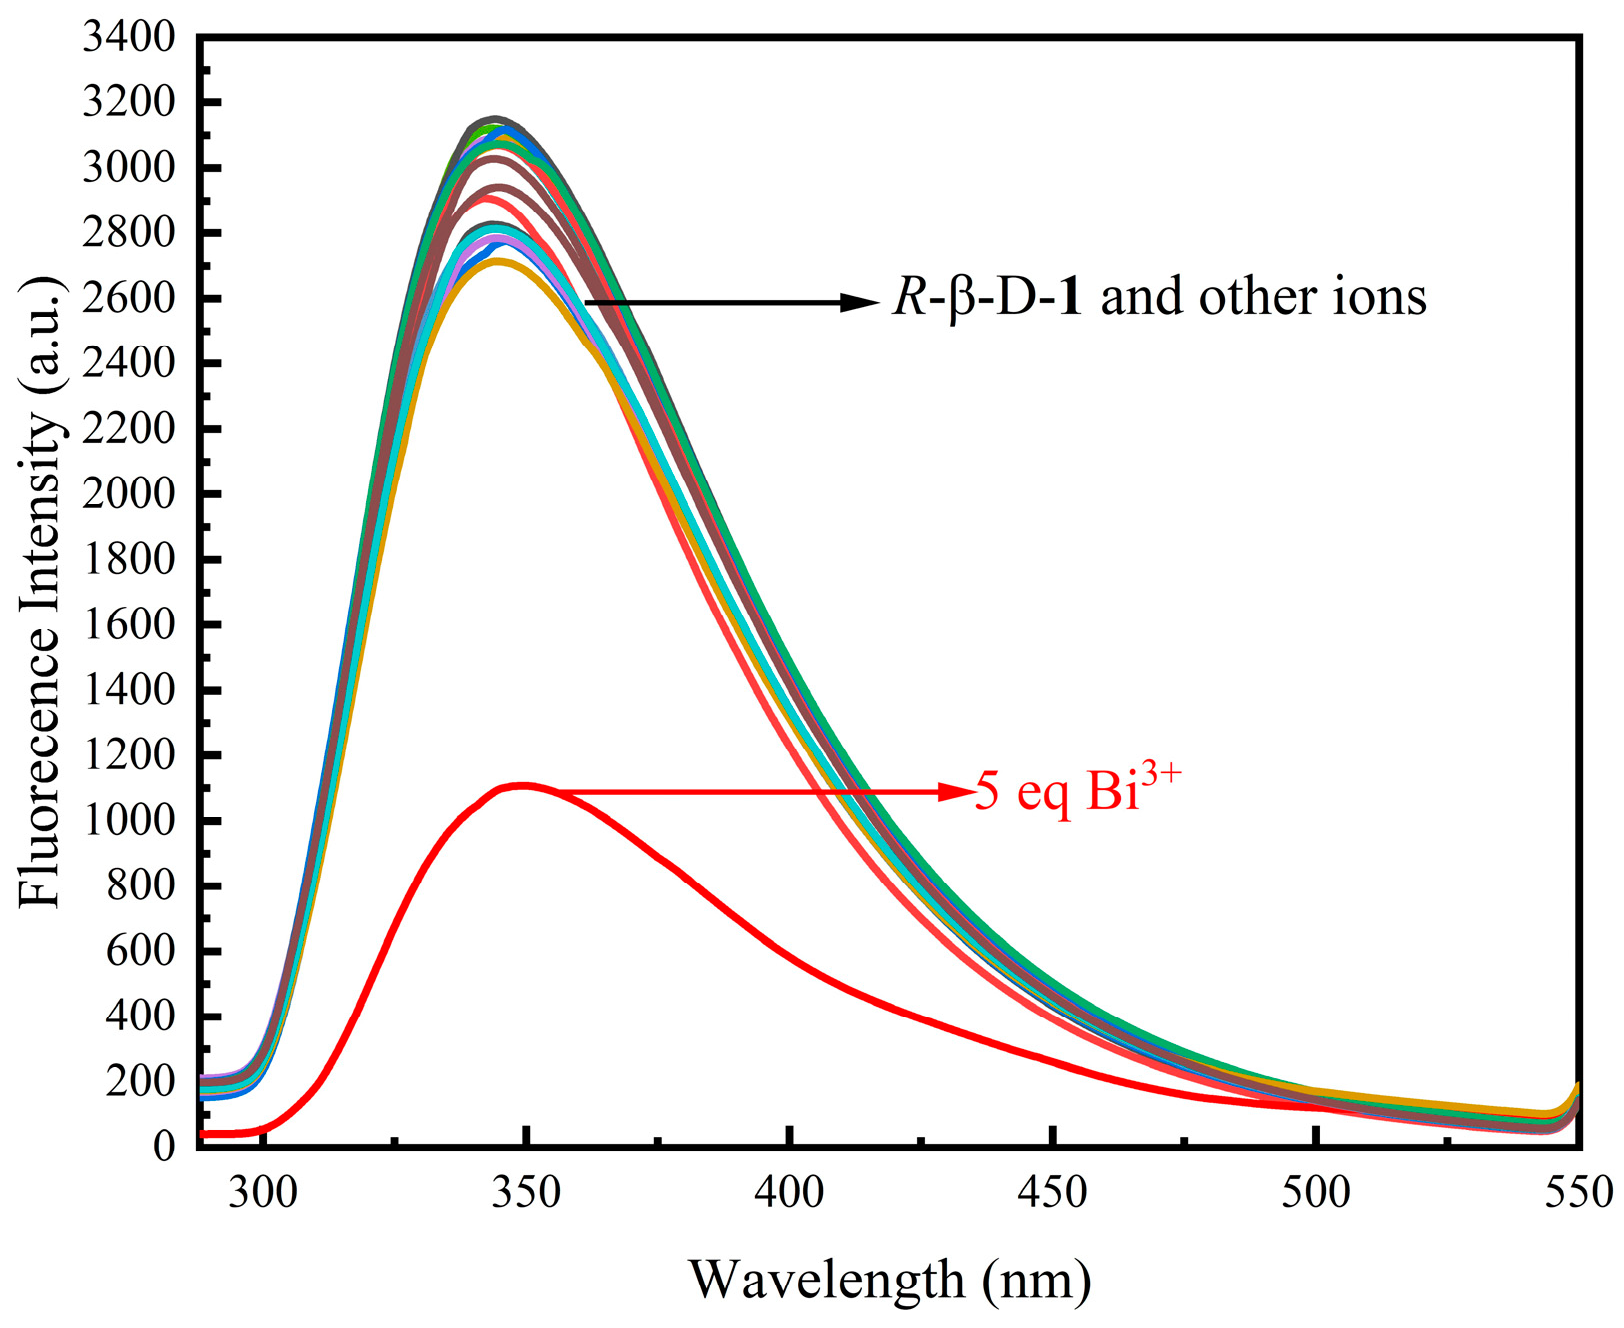
3.1. Fluorescence Experiments of R-β-D-1

The fluorescent properties of R-β-D-1 were next explored. It is shown in Figure 1 that R-β-D-1 emits mid-intensity fluorescence at 335 nm (λex = 278 nm, EX slit = 2.5 nm, EM slit = 2.5 nm). The effects of different cations (Ba2+, Mn2+, Cu+, Ca2+, K+, Co3+, Cr3+, Zn2+, Al3+, Mg2+, Pb2+, Ag+, Cd2+, Gd3+, Li+, Na+, NH4+, Ni2+ and Bi3+) on R-β-D-1 in methanol solution were investigated by fluorescence spectrophotometry. The fluorescence of the sensor R-β-D-1 showed significant fluorescence quenching in response to Bi3+, whereas it did not show significant fluorescence quenching for other ions under the same conditions. This demonstrates that R-β-D-1 is capable of the specific fluorescence recognition of Bi3+.

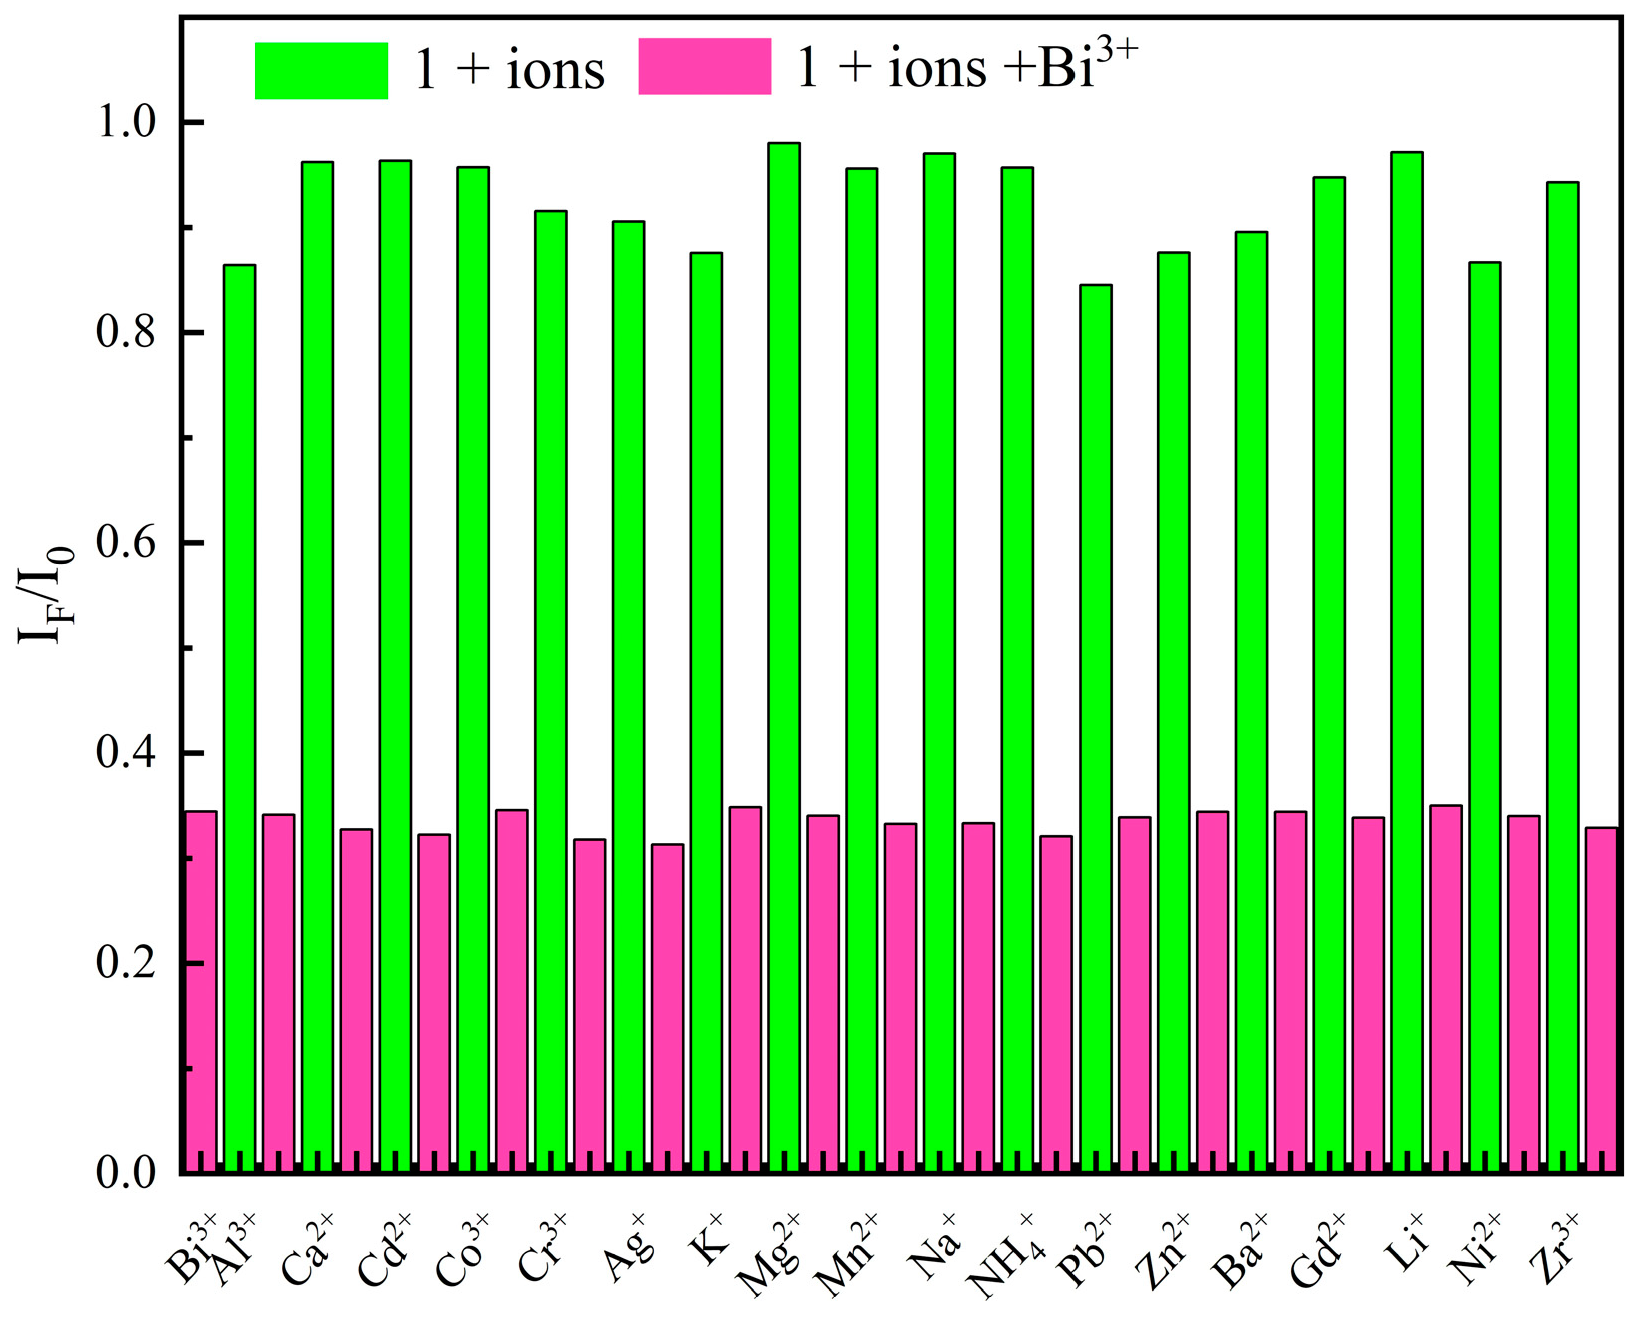
3.2. Ion Competition Studies

To further investigate the selectivity and specificity of the fluorescence detection of Bi3+ by R-β-D-1, we performed an ion competition experiment for R-β-D-1 using fluorescence emission spectroscopy, as shown in Figure 2. Other 5.0 equivalents of cations and the same equivalents of Bi3+ were added to the R-β-D-1 detection solution, and the fluorescence intensity was measured at λex = 278 nm. The results showed that other metal ions had little effect on R-β-D-1-Bi3+. Meanwhile, we excluded the effect of the presence of anions in the solvent when we added to the R-β-D-1 assay solution after adding 5.0 eq of Bi3+, to which we added equal amounts of different anions (NO3, Cl, CN, SO42−, SO32−, CO32−, HCO3, SiO32−, HSO4, HSO3, H2PO4, ClO2, S2O32−, HPO42−, C2O42− and CH3COO cations were K+ or Na+). Fluorescence detection at λex = 278 nm yielded a fluorescence detection histogram (Figure S8 in the Supplementary Materials), and it could be found that these anions had little effect on the process of R-β-D-1 recognition with Bi3+.This demonstrated that R-β-D-1 could produce a selective fluorescence response to Bi3+ in the presence of background competing ions, and thus, R-β-D-1 could be used for specific fluorescent sensors.
The results of the concentration-dependent fluorescence experiments of the sensor R-β-D-1 on Bi3+ are shown in Figure 3. According to the results of the titration experiment, the fluorescence intensity of R-β-D-1 at 343 nm was gradually diminished and red-shifted to 354 nm when the concentration of Bi3+ was increased from 0-fold equivalent to 26-fold equivalent, as shown in Figure 3a. The fluorescence intensity of R-β-D-1 decreased to the minimum with the increase of the concentration of Bi3+, and the maximal fluorescence intensity showed a good linear relationship with the concentration of Bi3+, as shown in Figure 3b.
In order to determine the complexation of R-β-D-1 with Bi3+, we investigated the detection limits and complexation constants of R-β-D-1 with Bi3+ and then plotted Job’s plots using the reported method. Based on the concentration-dependent fluorescence titration experiment (Figure 4a), the minimum limit of detection (LOD) of the novel sensor R-β-D-1 for Bi3+, 0.065 µM, was calculated based on “LOD = /S” (σ is the signal standard deviation of the fluorescence intensity of nine blank samples of the sensor, while S is the slope of the concentration-dependent experiment). The Ka of the novel sensor R-β-D-1 for Bi3+ was calculated based on the values of the I0/(I0-I) and 1/[Bi3+] plots, and the complexation constant of R-β-D-1 with Bi3+ was calculated using the Benesi–Hildebrand equation to be 1.01 × 10⁴ M−1, as shown in Figure 4b. The total concentration of the mixed solution of R-β-D-1 and Bi3+ was kept at 2.0 × 10⁻⁵ M(R = 0.990) during the test. The results in Figure 4c indicate that, when [Bi3+]/([R-β-D-1]+[Bi3+]) was about 0.5, the molar fraction of [Bi3+] reached a maximum value, indicating that the sensor R-β-D-1 formed a 1 + 1 complex with Bi3+.

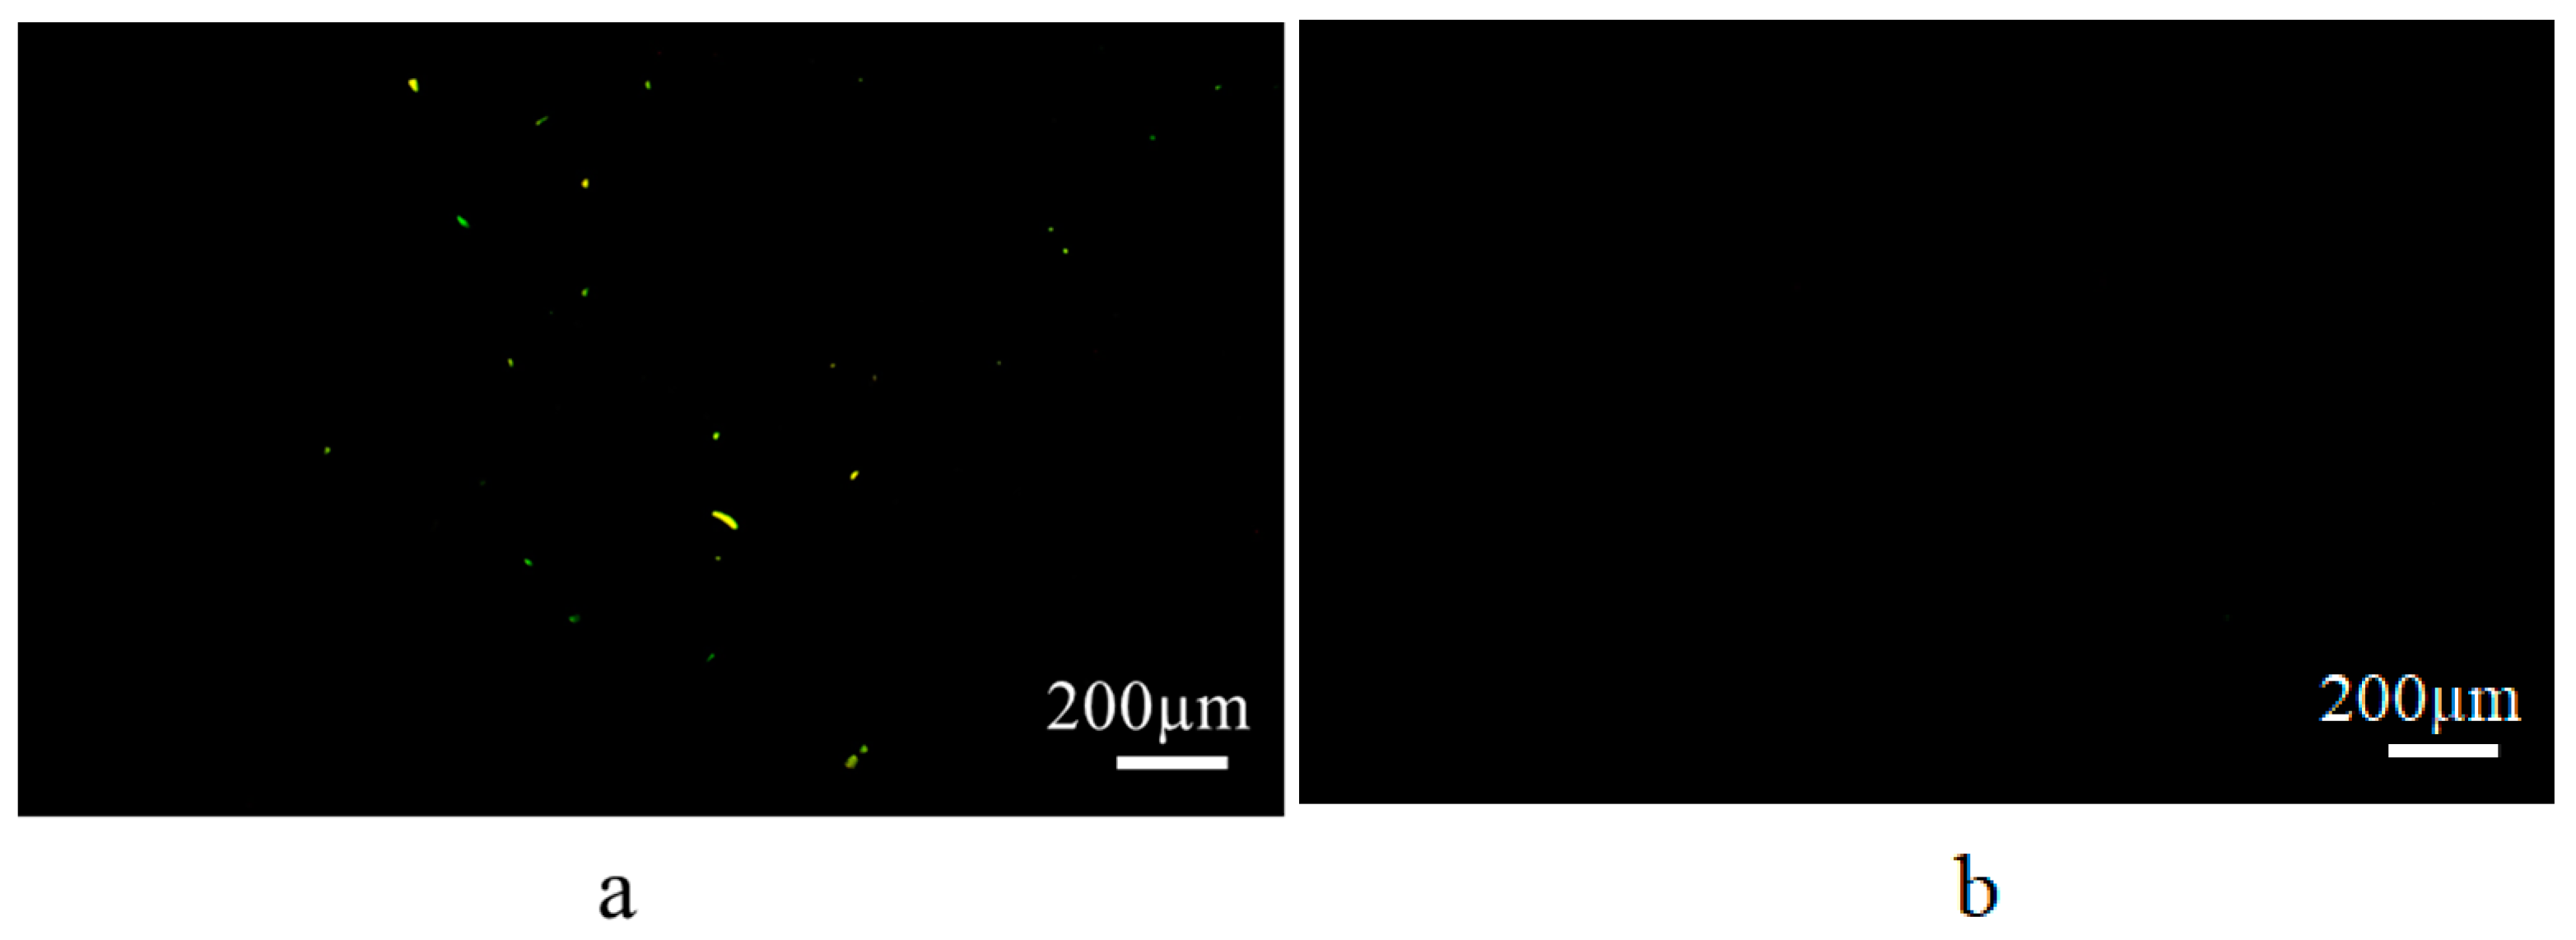
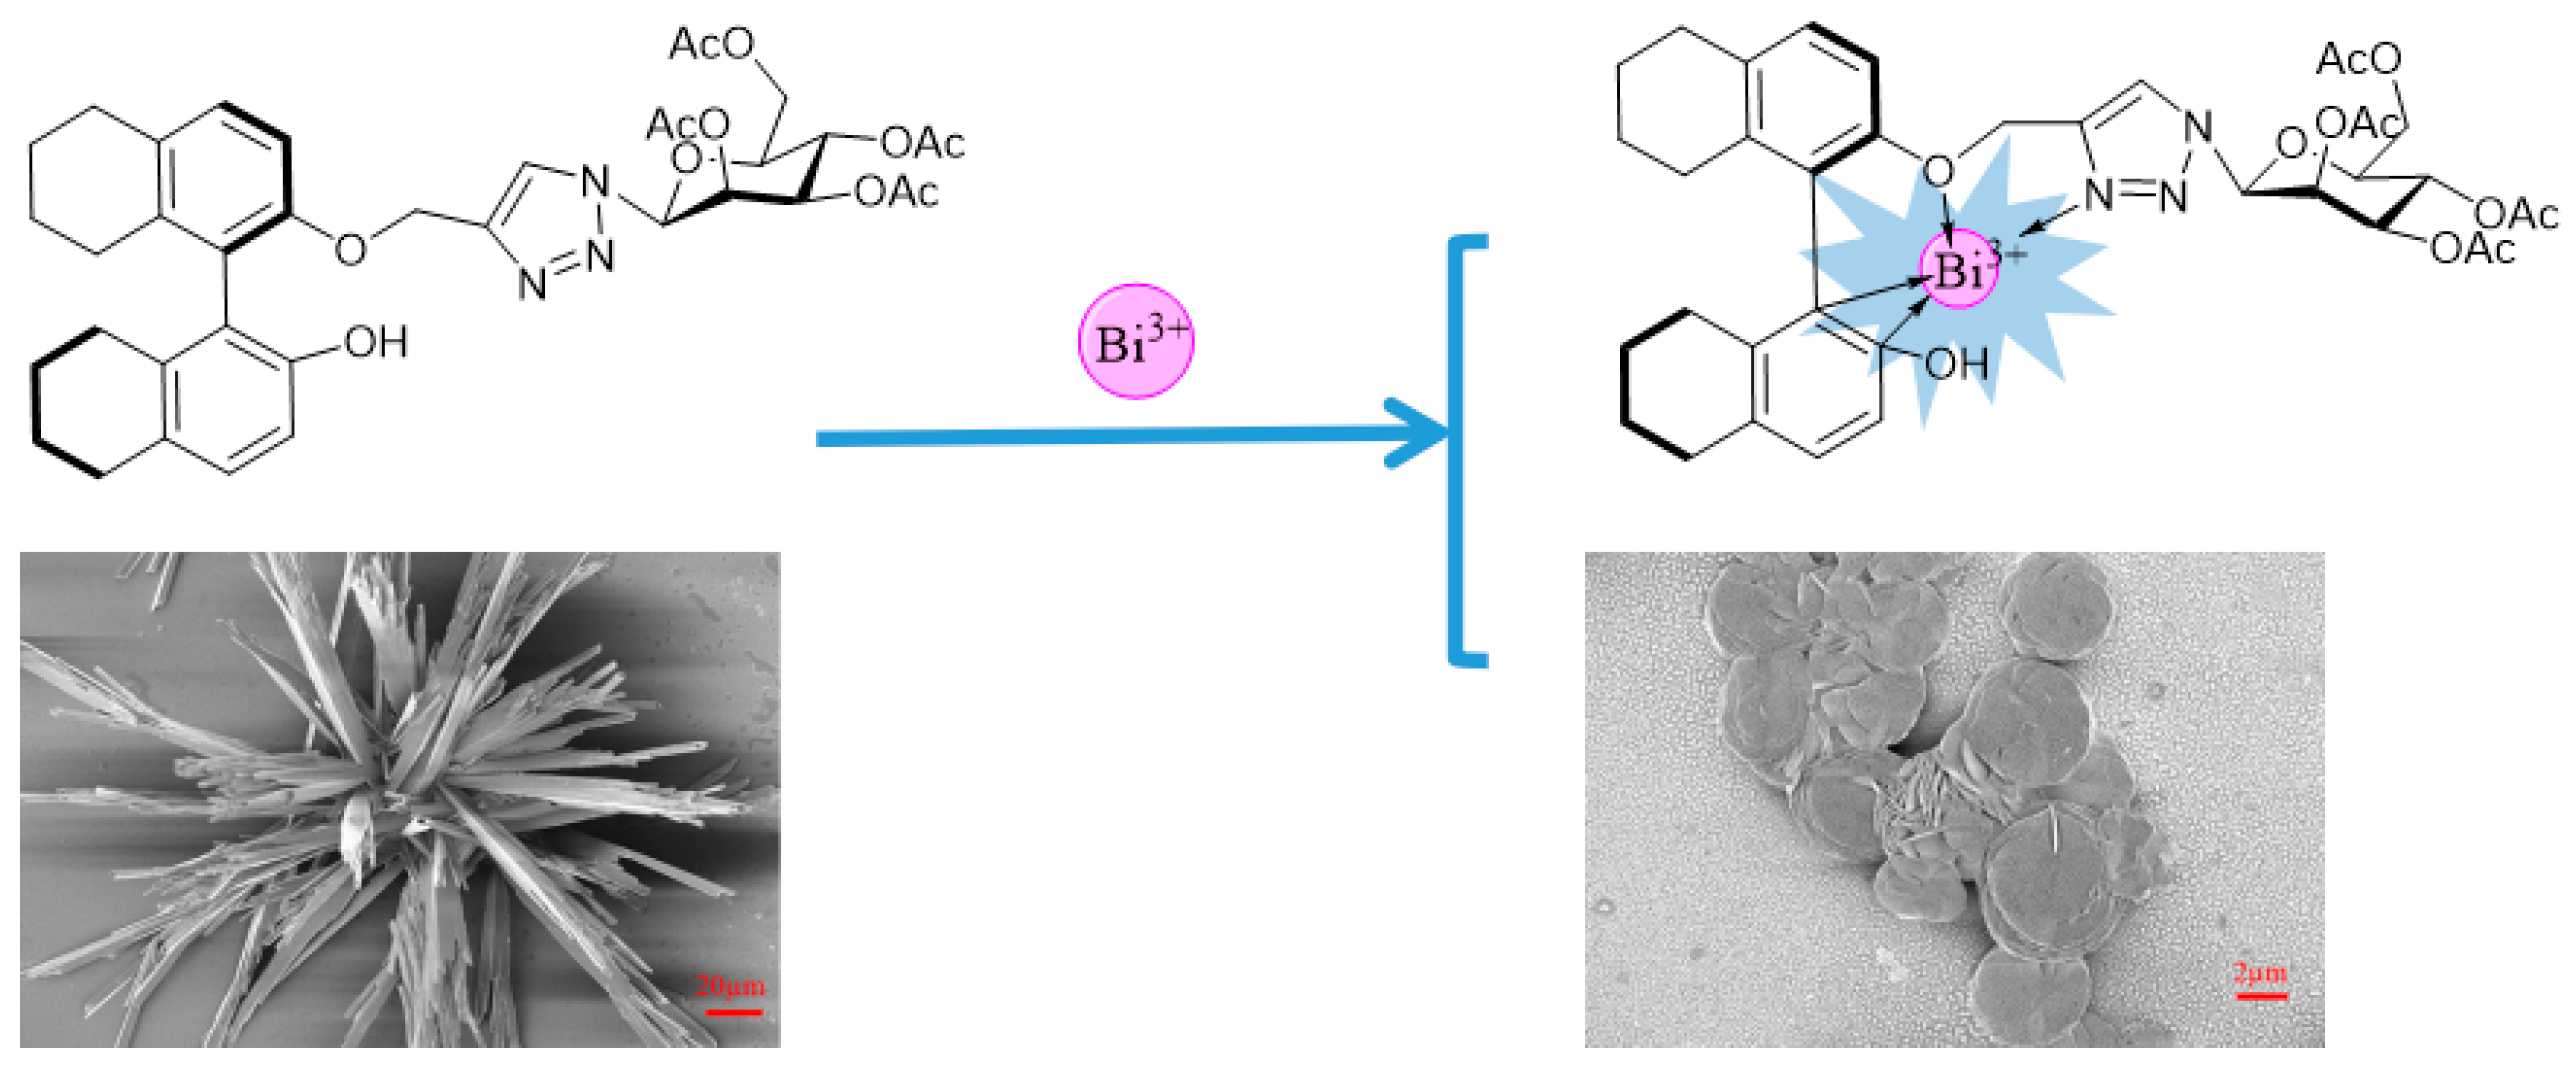
3.3. SEM Microscopy Study

In order to investigate the recognition process of R-β-D-1 and Bi3+, the sensor was dissolved in ethanol and dispersed by ultrasonic dispersion and used for SEM inspection to obtain Figure 5. As shown in Figure 5a, it can be seen that R-β-D-1 self-assembled together to form a micrometer-sized particle with a hollow structure in the middle of the particle; after the addition of Bi3+, the structure on the surface of the particle formed a flower-like structure (Figure 5b) induced by Bi3+, and the particle had a certain height, as shown in Figure 5c, and it was formed by many lamellar structures stacked together. Since our fluorescence test was performed in methanol solvent, in order to exclude the effect of solvent polarity, we wanted to know whether the self-assembly effect of the sensor in methanol solvent and the morphology after recognition with Bi3+ was related to the effect by the polarity of an ethanol solvent. Therefore, we observed the self-assembly of the fluorescent sensor R-β-D-1 in methanol solution. R-β-D-1 was dissolved in methanol and dispersed by ultrasonication followed by SEM inspection, and the morphology was obtained as shown in Figure S9a in the Supplementary Materials, which was found to be different from that in ethanol, self-assembling into a small ball-mounted structure, suggesting that the polarity of the solvent had a large effect on the self-assembly of the sensor R-β-D-1. However, after the addition of Bi3+, it could be found through Figure S9b that, similar to the recognition effect in ethanol, they both formed flower-like morphology, indicating that the change in the polarity of the solvent (methanol or ethanol) does not affect the recognition effect of sensor R-β-D-1 with Bi3+.
The recognition process of the sensor R-β-D-1 with Bi3+ was observed by AFM (Figure 6). After dissolving R-β-D-1 in ethanol and observing it under the microscope, the presence of many fluorescent particles could be seen, but the fluorescence disappeared after the addition of Bi3+, which was the same phenomenon as the fluorescence test.

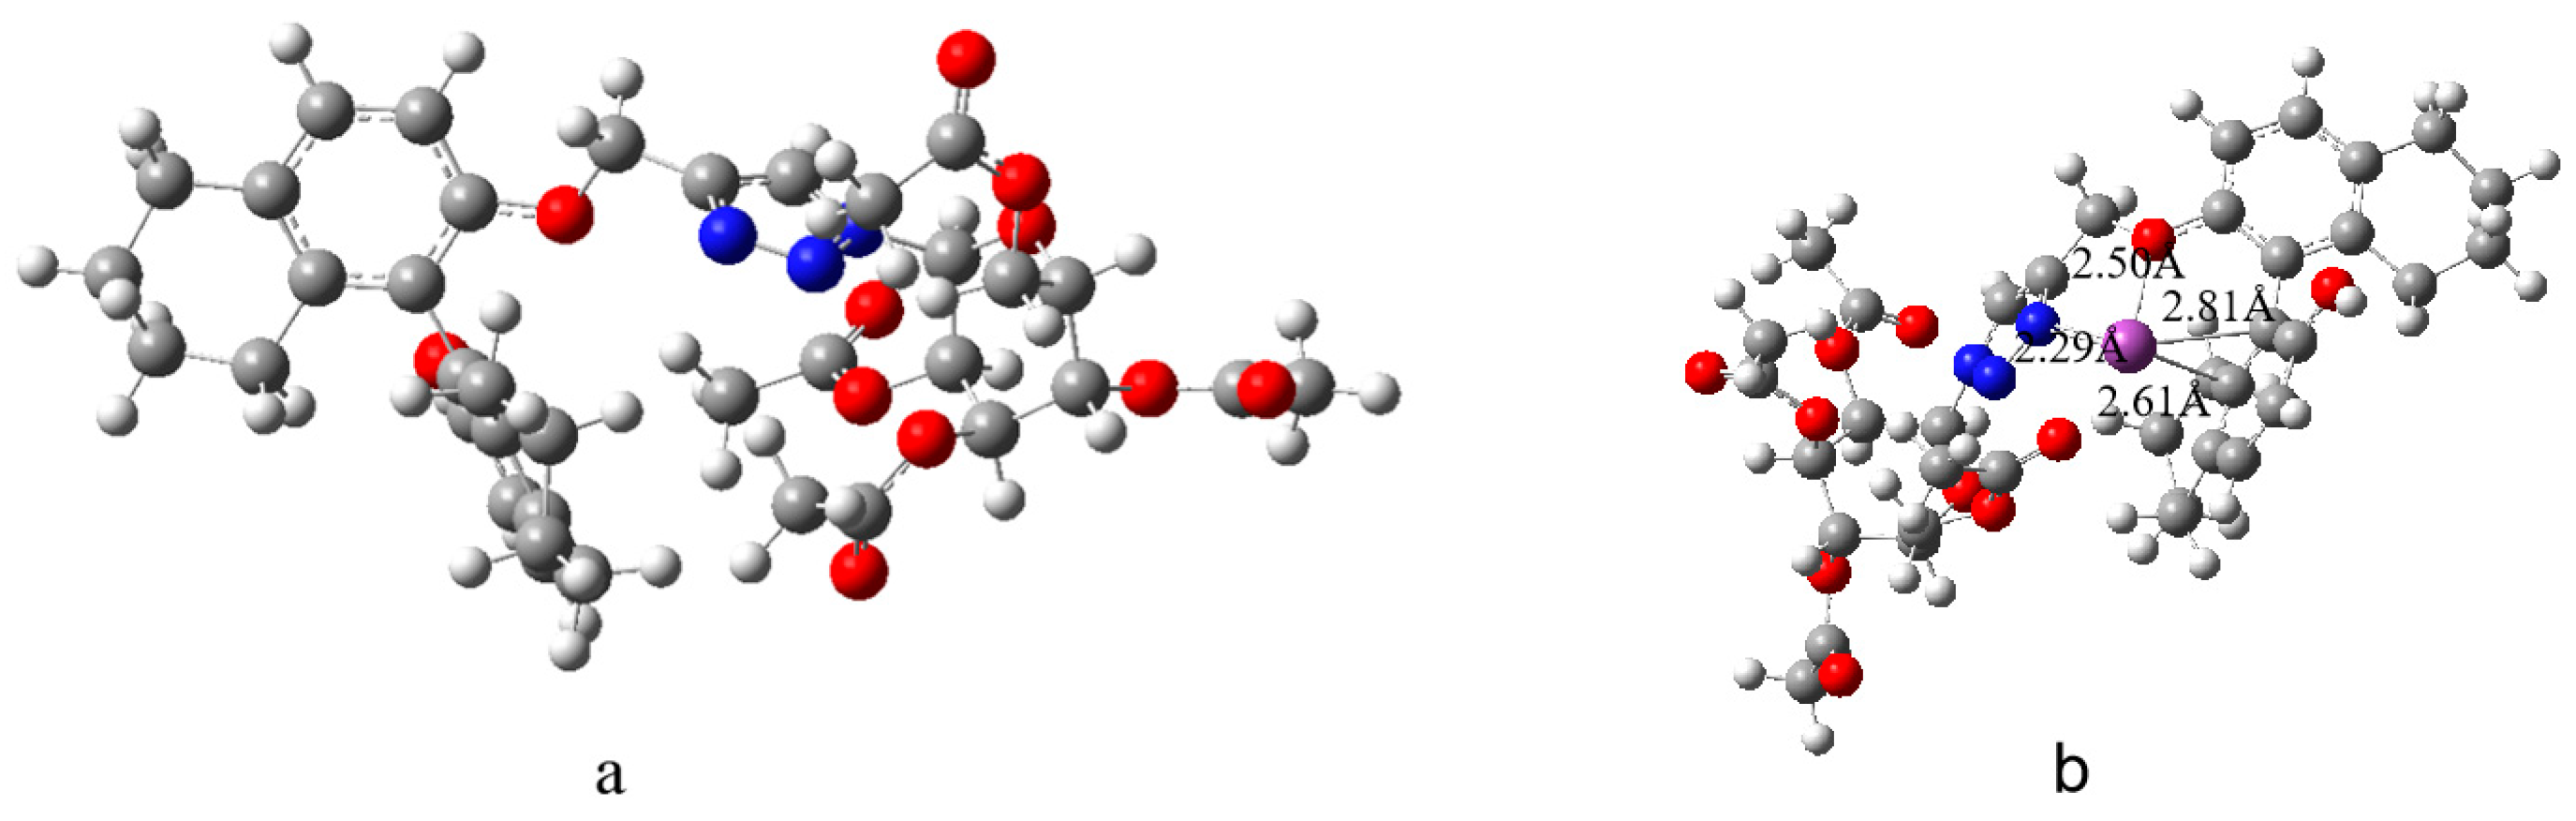
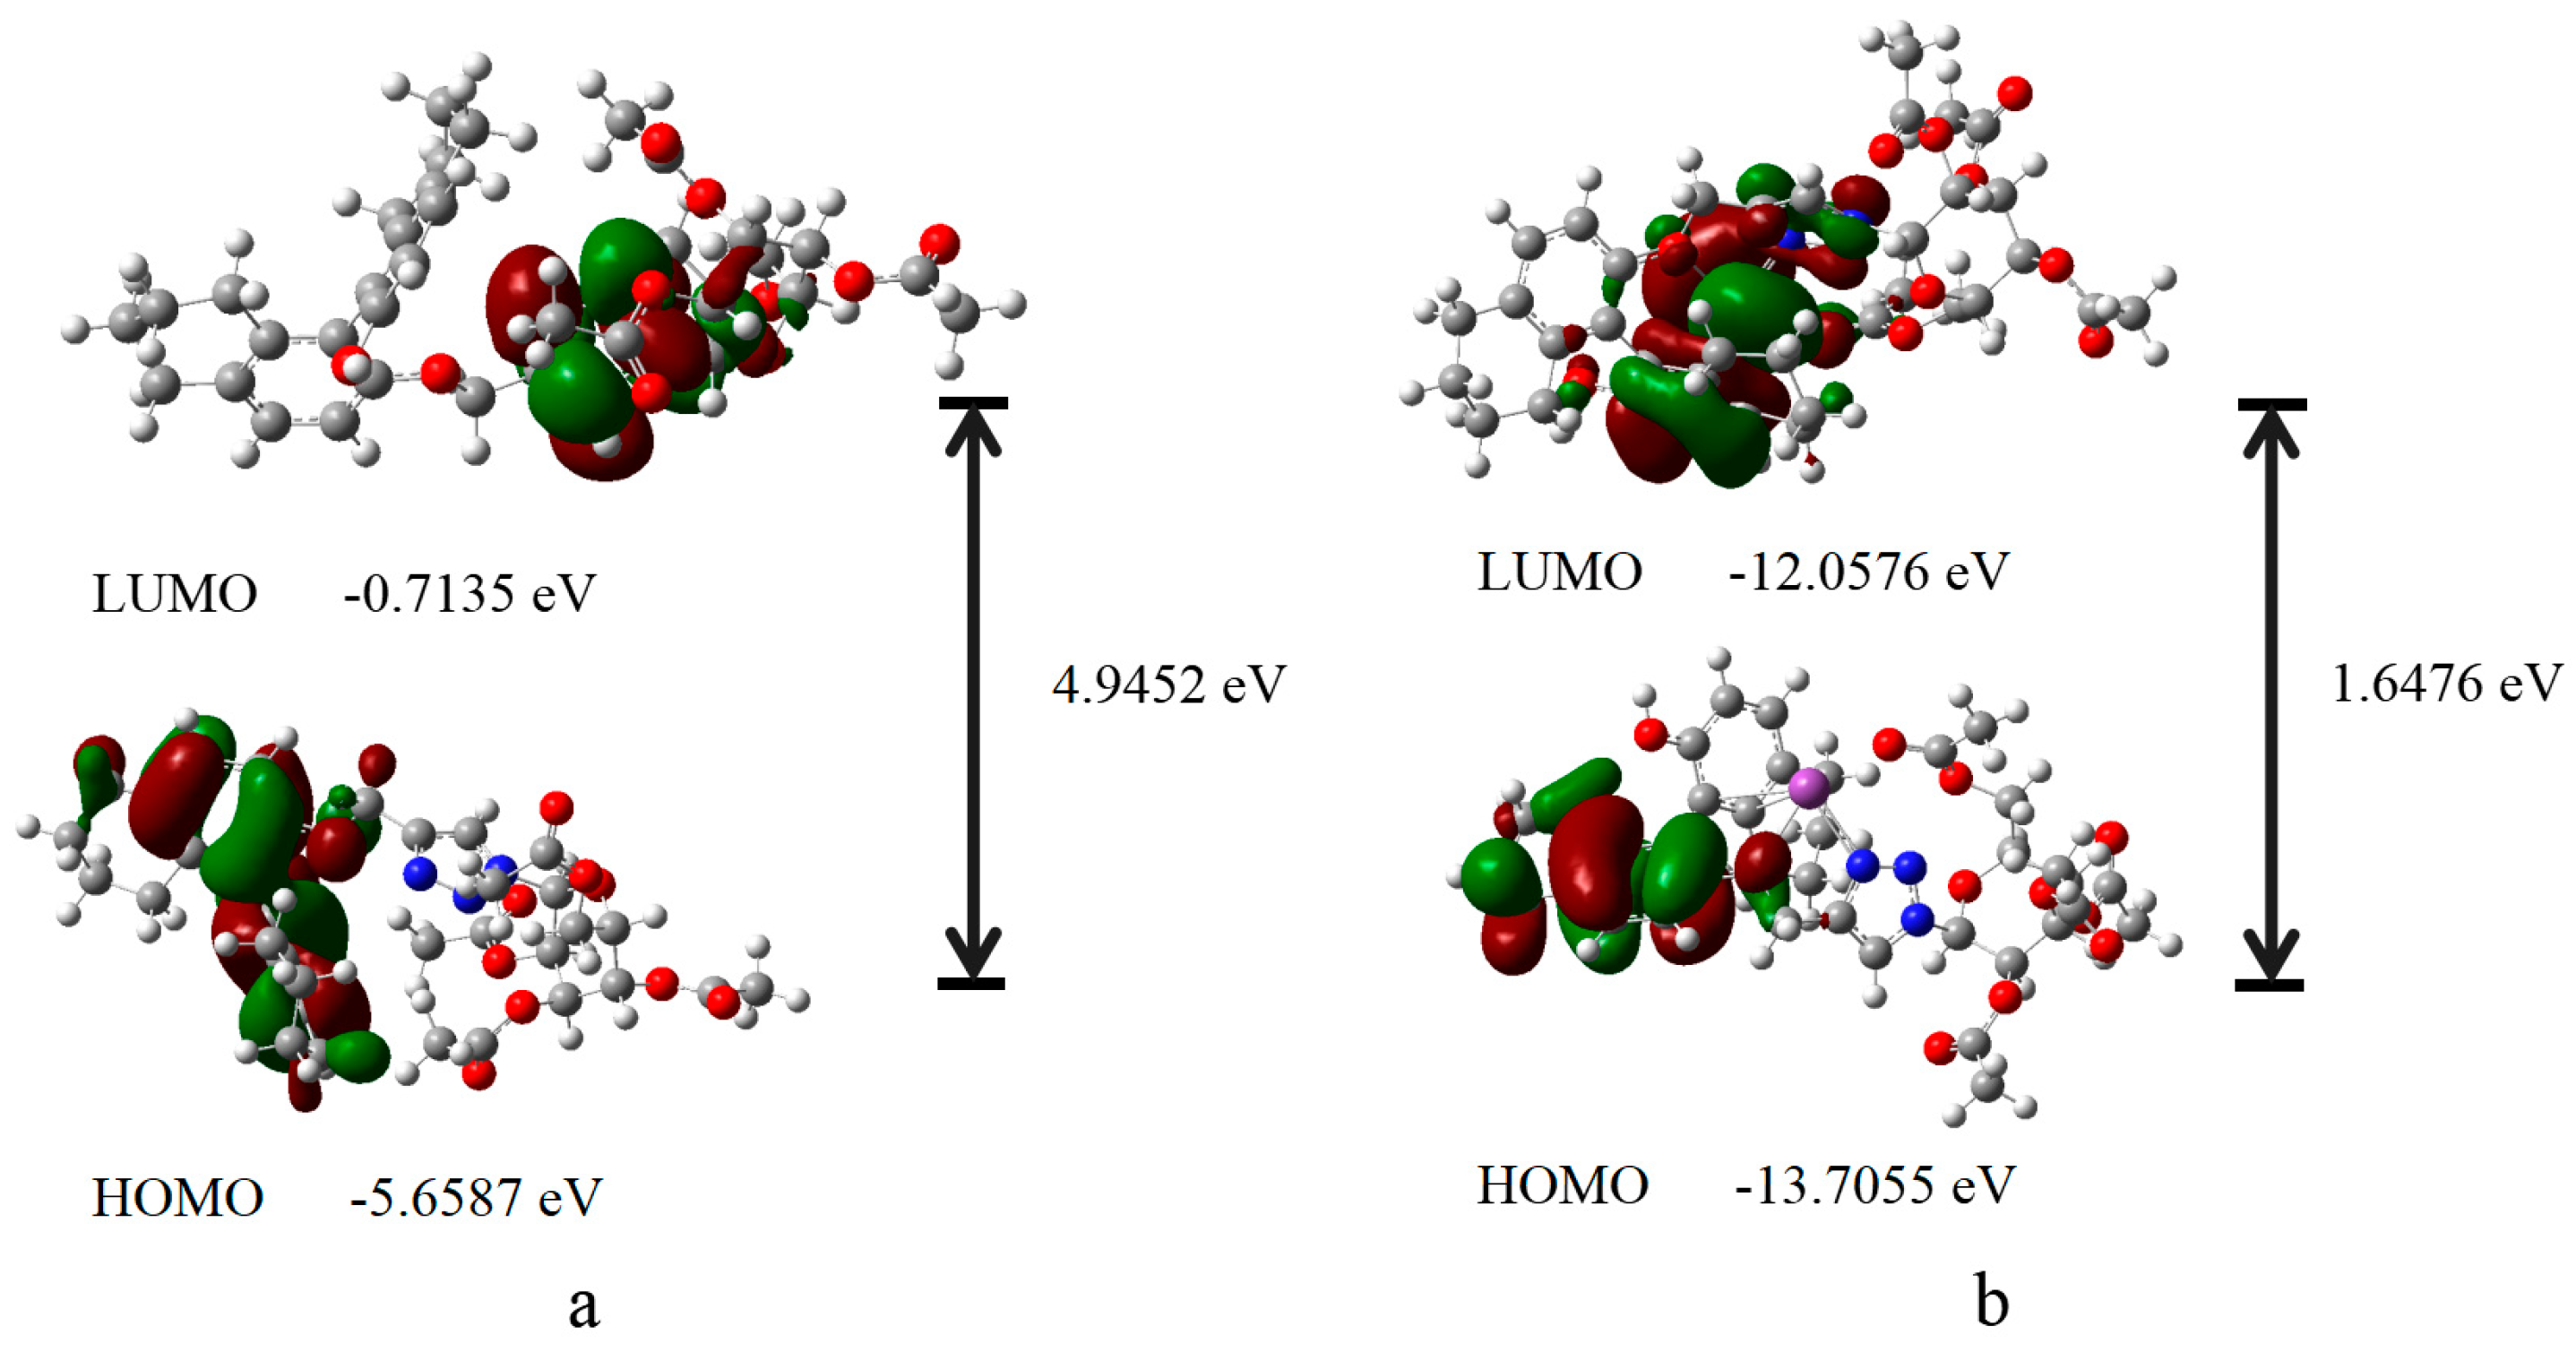
3.4. A Plausible Sensing Mechanism for R-β-D-1

Density functional theory calculations were performed to further understand the bonding nature of the sensor R-β-D-1 with Bi3+. The density functional of B3LYP/6-31G was carried out using the program Gaussian 09W, and the dispersion correction of GD3BJ was taken into account to calculate the structure and energy levels of the sensor R-β-D-1 before and after coordination with Bi3+ [39]. The structure of the sensor R-β-D-1 after optimization is shown in Figure 7a. In the optimized structure of the complex of sensor R-β-D-1-Bi3+ (Figure 7b), Bi3+ is coordinated to the 3N atom of the 1,4-disubstituted triazole group to form a Bi3+-N double bond with a distance of 2.29 Å, as well as to the O atom attached to the benzene ring to form a Bi3+-O distance of 2.5 Å. In addition to this, Bi3+ formed Bi3+-C bonds with C atoms at 1′ and 2′ on the other benzene ring with bond lengths of 2.61 Å and 2.81 Å. The prerequisite for the formation of coordination bonds by the sensor R-β-D-1-Bi3+ was satisfied.
In addition, further observation of the electron cloud distribution of R-β-D-1 (Figure 8) revealed that, in the absence of complexation with metal ions, the electron cloud was mainly located in the LUMO orbitals of the 1,2,3-triazole moiety and the HOMO orbitals of the benzene ring of H8-BINOL (Figure 8a) and that, once combined with Bi3+ (Figure 8b), the electron cloud was mainly concentrated in the bulky ring in which -OH was located in the LUMO orbitals in the benzene ring where -OH was located and in the HOMO orbitals in the benzene ring where methoxy was located, and all the band gaps (HOMO-LUMO Orbital Energy Difference) between the ground state energy and the excited state energy were reduced after Bi3+ complexation from the original 4.9452 eV to 1.6476 eV, suggesting that the existence of the interactions between the Bi3+ and R-β-D-1 interaction induced fluorescence quenching [40,41,42].
In addition, we also performed a differential charge density analysis using VASP to obtain Figure 9, where yellow and blue colors represent the electron accumulation and depletion regions, and it can be found that the charge of the 3-N of the 1,2,3-triazole moiety is shifted toward Bi3+ while the charge on Bi3+ is shifted toward the surrounding C atoms, which proves the existence of the ICT effect between R-β-D-1 and Bi3+.
In summary, the plausible mechanism for the recognition of Bi3+ by the sensor R-β-D-1 is the intramolecular charge transfer effect (ICT) [43,44], as shown in Figure 10, which is attributed to the fact that the N-3 of the 1,4-disubstituted triazole readily serves as an electron acceptor [45,46,47], whereas the incorporation of Bi3+ serves as an electron donor, and the two readily undergo coordination leading to the quenching of fluorescence.

4. Conclusions

A monosubstituted H8-BINOL glucose derivative was synthesized from azido glucose and R-H8-BINOL and characterized by 1H NMR, 13C NMR and MS. Its fluorescence properties in the presence of metal ions were investigated by fluorescence spectroscopy. The high selectivity and sensitivity of the R-β-D-1 sensor in Bi3+ sensing were confirmed by fluorescence response experiments, competition experiments and fluorescence titration experiments on 19 different metal ions. The morphological changes of the sensor R-β-D-1 before and after the addition of Bi3+ in different solvents were also investigated by scanning electron microscopy (SEM), and the stoichiometry and coordination of the complexes were determined by fluorescence emission spectroscopy, which confirmed the 1 + 1 binding mode between the sensor R-β-D-1 and Bi3+, and the limit of detection (LOD) of the sensor R-β-D-1 for Bi3+ was calculated to be 0.065 µM. In addition, the bonding situation of the sensor R-β-D-1 was investigated using DFT and CDD to explore the recognition mechanism of the sensor R-β-D-1 with Bi3+. In this paper, an “off” fluorescent probe was proposed for recognizing the transition metal Bi3+ with high selectivity and sensitivity.

Supplementary Materials

The following supporting information can be downloaded at: https://www.mdpi.com/article/10.3390/mi15010163/s1, Figure S1. 1H NMR of 1-azido-2,3,4,6-tetra-O-acetyl-β-D-glucose (DMSO-d6). Figure S2. 13C NMR of 1-azido-2,3,4,6-tetraFi-O-acetyl-β-D-glucose (DMSO-d6). Figure S3. 1H NMR of R-P (DMSO-d6). Figure S4. 13C NMR of R-P (DMSO-d6). Figure S5. 1H NMR of R-β-D-1 (DMSO-d6). Figure S6. 13C NMR of R-β-D-1 (DMSO-d6). Figure S7. mass spectrometry of R-β-D-1. Figure S8. Fluorescence histogram of R-β-D-1 versus Bi3+ in the presence of different anions. Figure S9. (a) SEM image of R-β-D-1 in methanol solvent, (b) is the SEM morphology change of R-β-D-1 with the addition of Bi3+. Refs. [48,49,50,51,52,53,54,55,56,57,58,59] are cited in the Supplementary Materials.

Author Contributions

J.T. carried out the experiments, analyzed and interpreted the data and wrote the manuscript; F.G. and Y.S. performed the experiments and analyzed the data. X.S. and Y.H. took leadership responsibility for the research activity planning. All authors have read and agreed to the published version of the manuscript.

Funding

The authors are grateful for the financial support of the National Natural Science Foundation of China (No. 21462018 and 21861025), the Science Fund of the Technology Office of Jiangxi, China (20192BAB203003) and the National Training Programs of Innovation and Entrepreneurship for Undergraduates (202211318012).

Data Availability Statement

Data are contained within the article and Supplementary Materials.

Conflicts of Interest

The authors declare no conflicts of interest.

References

  1. Upendar Reddy, G.; Agarwalla, H.; Taye, N.; Ghorai, S.; Chattopadhyay, S.; Das, A. A Novel Fluorescence Probe for Estimation of Cysteine/Histidine in Human Blood Plasma and Recognition of Endogenous Cysteine in Live Hct116 Cells. Chem. Commun. 2014, 50, 9899–9902. [Google Scholar]
  2. You, Q.-H.; Lee, A.W.-M.; Chan, W.-H.; Zhu, X.-M.; Leung, K.C.-F. A Coumarin-Based Fluorescent Probe for Recognition of Cu2+ and Fast Detection of Histidine in Hard-to-Transfect Cells by a Sensing Ensemble Approach. Chem. Commun. 2014, 50, 6207–6210. [Google Scholar] [CrossRef]
  3. Qian, T.; Dang, B.; Chen, Y.; Sun, Q.; Jin, C. Significantly Improved Mechanical Properties of the Self-Assembled Layered Lignocelluloses Material via Grinding and Hot Pressing. Mater. Chem. Phys. 2018, 213, 502–507. [Google Scholar] [CrossRef]
  4. Jiang, Q.; Jiang, G.; Wang, C.; Yang, L.; Ren, Y.; Liu, P.; Shi, Y. The Influence of Fiber on the Rheological Properties, Microstructure and Suspension Behavior of the Supramolecular Viscoelastic Fracturing Fluid. J. Nat. Gas Sci. Eng. 2016, 35, 1207–1215. [Google Scholar] [CrossRef]
  5. Li, H.; Telychko, M.; Zhou, L.; Chen, Z.; Peng, X.; Ji, W.; Lu, J.; Loh, K.P. Sub-Angstrom Imaging of Nondegenerate Kekulé Structures in a Two-Dimensional Halogen-Bonded Supramolecular Network. J. Phys. Chem. C 2022, 126, 4241–4247. [Google Scholar] [CrossRef]
  6. Kianimehr, A.; Akhbari, K.; White, J.; Phuruangrat, A. Sonochemical Synthesis, Crystal Structure and Thermal Behavior of a New Thallium(I) Supramolecular Polymer with Hydrogen and Bromine-Oxygen Halogen Bonds. Inorg. Chem. Commun. 2020, 115, 107864. [Google Scholar] [CrossRef]
  7. Huang, Y.; Wang, N.; Wang, J.; Ji, X.; Yang, J.; Huang, X.; Zhou, L.; Wang, T.; Hao, H. Regulating of Liquid–Liquid Phase Separation and Molecular Self-Assembly through Selective Solvation. Ind. Eng. Chem. Res. 2023, 62, 20459–20469. [Google Scholar] [CrossRef]
  8. Meena, S.K.; Goldmann, C.; Nassoko, D.; Seydou, M.; Marchandier, T.; Moldovan, S.; Ersen, O.; Ribot, F.; Chanéac, C.; Sanchez, C.; et al. Nanophase Segregation of Self-Assembled Monolayers on Gold Nanoparticles. ACS Nano 2017, 11, 7371–7381. [Google Scholar] [CrossRef]
  9. Qin, Q.; Li, J.; Dellemme, D.; Fossépré, M.; Barozzino-Consiglio, G.; Nekkaa, I.; Boborodea, A.; Fernandes, A.E.; Glinel, K.; Surin, M.; et al. Dynamic Self-Assembly of Supramolecular Catalysts from Precision Macromolecules. Chem. Sci. 2023, 14, 9283–9292. [Google Scholar] [CrossRef]
  10. Bhattacharyya, A.; De Sarkar, S.; Das, A. Supramolecular Engineering and Self-Assembly Strategies in Photoredox Catalysis. ACS Catal. 2021, 11, 710–733. [Google Scholar] [CrossRef]
  11. Datta, S.; Xu, J. Recent Advances in Organic Molecular-to-Supramolecular Self-Assembled Room-Temperature Phosphorescent Materials for Biomedical Applications. ACS Appl. Bio Mater. 2023, 6, 4572–4585. [Google Scholar] [CrossRef] [PubMed]
  12. Long, K.; Liu, Y.; Li, Y.; Wang, W. Self-Assembly of Trigonal Building Blocks into Nanostructures: Molecular Design and Biomedical Applications. J. Mater. Chem. B 2020, 8, 6739–6752. [Google Scholar] [CrossRef] [PubMed]
  13. Liao, L.; Jia, X.; Lou, H.; Zhong, J.; Liu, H.; Ding, S.; Chen, C.; Hong, S.; Luo, X. Supramolecular Gel Formation Regulated by Water Content in Organic Solvents: Self-Assembly Mechanism and Biomedical Applications. RSC Adv. 2021, 11, 11519–11528. [Google Scholar] [CrossRef] [PubMed]
  14. Reker, D.; Rybakova, Y.; Kirtane, A.R.; Cao, R.; Yang, J.W.; Navamajiti, N.; Gardner, A.; Zhang, R.M.; Esfandiary, T.; L’Heureux, J.; et al. Computationally Guided High-Throughput Design of Self-Assembling Drug Nanoparticles. Nat. Nanotechnol. 2021, 16, 725–733. [Google Scholar] [CrossRef] [PubMed]
  15. Skilling, K.J.; Stocks, M.J.; Kellam, B.; Ashford, M.; Bradshaw, T.D.; Burroughs, L.; Marlow, M. Nucleoside-Based Self-Assembling Drugs for Localized Drug Delivery. ChemMedChem 2018, 13, 1098–1101. [Google Scholar] [CrossRef] [PubMed]
  16. Kolesnichenko, I.V.; Anslyn, E.V. Practical Applications of Supramolecular Chemistry. Chem. Soc. Rev. 2017, 46, 2385–2390. [Google Scholar] [CrossRef]
  17. Shan, W.; Yuan, B.; Zhang, Y. Efficient Capture of Uranium by Polydopamine Functionalized MgO@Bi2O3 Composite from Aqueous Solution. Radiat. Phys. Chem. 2024, 215, 111385. [Google Scholar] [CrossRef]
  18. Lambert, H.; Kerry, T.; Sharrad, C.A. Preparation of Uranium(III) in a Molten Chloride Salt: A Redox Mechanistic Study. J. Radioanal. Nucl. Chem. 2018, 317, 925–932. [Google Scholar] [CrossRef]
  19. Wang, Z.; Cheng, X.; Guo, K.; Tang, E.; Li, L.; Peng, H.; Han, Y.; Chen, C.; Chang, M.; He, L. Thermoelectric Response Characteristics of Bi2Te3 Based Semiconductor Materials. J. Non-Equilib. Thermodyn. 2022, 47, 355–373. [Google Scholar] [CrossRef]
  20. Li, Z.; Zhang, Z.; Wang, L.; Meng, X. Bismuth Chromate (Bi2CrO6): A Promising Semiconductor in Photocatalysis. J. Catal. 2020, 382, 40–48. [Google Scholar] [CrossRef]
  21. Zeng, X.; Zhang, X.; Meng, X.; Zhang, W.; Zhang, X.; Yan, Q. Impact of Bi Content on the Accuracy of Oxygen Concentration Measurements in Liquid Pb–Bi Alloys. Heliyon 2022, 8, e12606. [Google Scholar] [CrossRef] [PubMed]
  22. Ribeiro, L.A.R.; Pradela-Filho, L.A.; Fonseca, W.T.; Araújo, D.A.G.; Assunção, R.M.N.; Takeuchi, R.M.; Santos, A.L. Square Wave Voltammetry Enables Fast Quantification and Evaluation of Bi3+ Extraction from Eyeshadow Samples. Anal. Methods 2017, 9, 3831–3838. [Google Scholar] [CrossRef]
  23. Huang, J.; Yin, H.; Yin, P.; Jian, X.; Song, S.; Luan, J.; Zhang, L. SR-BI Interactome Analysis Reveals a Proviral Role for UGGT1 in Hepatitis C Virus Entry. Front. Microbiol. 2019, 10, 2043. [Google Scholar] [CrossRef] [PubMed]
  24. Newsome, P.N.; Sanyal, A.J.; Neff, G.; Schattenberg, J.M.; Ratziu, V.; Ertle, J.; Link, J.; Mackie, A.; Schoelch, C.; Lawitz, E.; et al. A Randomised Phase IIa Trial of Amine Oxidase Copper-Containing 3 (AOC3) Inhibitor BI 1467335 in Adults with Non-Alcoholic Steatohepatitis. Nat. Commun. 2023, 14, 7151. [Google Scholar] [CrossRef] [PubMed]
  25. El-Sewify, I.M.; Shenashen, M.A.; Shahat, A.; Yamaguchi, H.; Selim, M.M.; Khalil, M.M.H.; El-Safty, S.A. Dual Colorimetric and Fluorometric Monitoring of Bi3+ Ions in Water Using Supermicroporous Zr-MOFs Chemosensors. J. Lumin. 2018, 198, 438–448. [Google Scholar] [CrossRef]
  26. Wu, R.; Ai, J.; Ga, L. Synthesis of Fluorescent Copper Nanomaterials and Detection of Bi3+. Front. Chem. 2022, 10, 899672. [Google Scholar] [CrossRef]
  27. Shaji, L.K.; Jose, J.; Bhaskar, R.; Selva Kumar, R.; Vetriarasu, V.; Bhat, S.G.; Ashok Kumar, S.K. Smartphone Assisted Fluorescent-Colorimetric Probe for Bismuth (III) Ion and Potential Applications. Inorg. Chem. Commun. 2023, 147, 110252. [Google Scholar] [CrossRef]
  28. Sun, M.-X.; Ni, C.-Z.; Zhang, F.-Q.; Zhu, Y.-Y.; Zeng, J.; Gu, S.-X. Chiral Amino Acid Recognition in Water: A BINOL-Based Fluorescent Probe. Chin. Chem. Lett. 2023, 34, 108345. [Google Scholar] [CrossRef]
  29. Wu, X.; Wang, Q.; Dickie, D.; Pu, L. Mechanistic Study on a BINOL–Coumarin-Based Probe for Enantioselective Fluorescent Recognition of Amino Acids. J. Org. Chem. 2020, 85, 6352–6358. [Google Scholar] [CrossRef]
  30. Huo, B.; Lu, K.; Tian, J.; Zhao, F.; Wang, Y.; Yu, S.; Yu, X.; Pu, L. From MonoBINOL to BisBINOL: Expanded Enantioselective Fluorescent Recognition of Amino Acids. J. Org. Chem. 2021, 86, 6780–6786. [Google Scholar] [CrossRef]
  31. Jiang, Y.; Huang, Z.; Tian, J.; Dong, X.; Yu, X.-Q.; Yu, S. A Chiral BINOL-Based Supramolecular Gel Enabling Sensitive Enantioselective and Chemoselective Collapse toward Histidine. Soft Matter 2023, 19, 430–435. [Google Scholar] [CrossRef] [PubMed]
  32. Mao, Y.; Davis, S.; Pu, L. Regio- and Enantioselective Macrocyclization from Dynamic Imine Formation: Chemo- and Enantioselective Fluorescent Recognition of Lysine. Org. Lett. 2023, 25, 7639–7644. [Google Scholar] [CrossRef] [PubMed]
  33. Hu, Y.; Shen, H.; Zhang, X.; Liu, Y.; Sun, X. Synthesis and Spectroscopic Investigation of a Novel Sensitive and Selective Fluorescent Chemosensor for Ag+ Based on a BINOL–Glucose Derivative. RSC Adv. 2018, 8, 23252–23256. [Google Scholar] [CrossRef] [PubMed]
  34. Zhang, B.; Guo, B.; Bai, Y.; Lu, H.; Dong, Y. Synthesis and Biological Evaluation of Azamacrolide Comprising the Triazole Moiety as Quorum Sensing Inhibitors. Molecules 2018, 23, 1086. [Google Scholar] [CrossRef]
  35. Domínguez-Crespo, M.A.; Zepeda-Vallejo, L.G.; Torres-Huerta, A.M.; Brachetti-Sibaja, S.B.; Palma-Ramírez, D.; Rodríguez-Salazar, A.E.; Ontiveros-de La Torre, D.E. New Triazole and Isoxazole Compounds as Corrosion Inhibitors for Cu-Ni (90/10) Alloy and Galvanized Steel Substrates. Met. Mater. Trans. A 2020, 51, 1822–1845. [Google Scholar] [CrossRef]
  36. Choubey, B.; Radhakrishna, L.; Mague, J.T.; Balakrishna, M.S. Two Triazole-Based Phosphine Ligands Prepared via Temperature-Mediated Li/H Exchange: CuI and AuI Complexes and Structural Studies. Inorg. Chem. 2016, 55, 8514–8526. [Google Scholar] [CrossRef]
  37. Boota, R.Z.; Hardman, S.J.O.; Ashton, G.P.; Rice, C.R.; Scattergood, P.A.; Elliott, P.I.P. Photochemistry of Heteroleptic 1,4,5,8-Tetraazaphenanthrene- and Bi-1,2,3-Triazolyl-Containing Ruthenium(II) Complexes. Inorg. Chem. 2021, 60, 15768–15781. [Google Scholar] [CrossRef]
  38. Kitteringham, E.; Zhou, Z.; Twamley, B.; Griffith, D.M. Au(III) and Pt(II) Complexes of a Novel and Versatile 1,4-Disubstituted 1,2,3-Triazole-Based Ligand Possessing Diverse Secondary and Tertiary Coordinating Groups. Inorg. Chem. 2018, 57, 12282–12290. [Google Scholar] [CrossRef]
  39. Xu, Y.; Yuan, S.; Zhang, Y.; Wang, H.; Yang, X.; Pei, M.; Zhang, G. A New Multifunctional Sensor for Sequential Recognizing of Zn2+ and PPi in Acetonitrile Solution and Detection of In3+ in DMF Solution. J. Photochem. Photobiol. A Chem. 2020, 392, 112348. [Google Scholar] [CrossRef]
  40. Baruah, S.; Aier, M.; Puzari, A. Fluorescent Probe Sensor Based on (R)-(−)-4-phenyl-2-oxazolidone for Effective Detection of Divalent Cations. Luminescence 2020, 35, 1206–1216. [Google Scholar] [CrossRef]
  41. Saravana Kumar, S.; Selva Kumar, R.; Ashok Kumar, S.K. Development of Highly Selective Dual Mode Chromogenic and Fluorogenic Chemosensor for Bi3+ Ions. J. Mol. Struct. 2020, 1212, 128143. [Google Scholar] [CrossRef]
  42. Varadaraju, C.; Paulraj, M.S.; Tamilselvan, G.; Muthu Vijayan Enoch, I.V.; Srinivasadesikan, V.; Shyi-Long, L. Evaluation of Metal Ion Sensing Behaviour of Fluorescent Probe along with Its Precursors: PET-CHEF Mechanism, Molecular Logic Gate Behaviour and DFT Studies. J. Incl. Phenom. Macrocycl. Chem. 2019, 95, 79–89. [Google Scholar] [CrossRef]
  43. Xiong, K.; Huo, F.; Chao, J.; Zhang, Y.; Yin, C. Colorimetric and NIR Fluorescence Probe with Multiple Binding Sites for Distinguishing Detection of Cys/Hcy and GSH in Vivo. Anal. Chem. 2019, 91, 1472–1478. [Google Scholar] [CrossRef] [PubMed]
  44. Karasulu, B.; Thiel, W. Photoinduced Intramolecular Charge Transfer in an Electronically Modified Flavin Derivative: Roseoflavin. J. Phys. Chem. B 2015, 119, 928–943. [Google Scholar] [CrossRef] [PubMed]
  45. Tiwari, V.K.; Mishra, B.B.; Mishra, K.B.; Mishra, N.; Singh, A.S.; Chen, X. Cu-Catalyzed Click Reaction in Carbohydrate Chemistry. Chem. Rev. 2016, 116, 3086–3240. [Google Scholar] [CrossRef] [PubMed]
  46. Pedersen, D.S.; Abell, A. 1,2,3-Triazoles in Peptidomimetic Chemistry. Eur. J. Org. Chem. 2011, 2011, 2399–2411. [Google Scholar] [CrossRef]
  47. Agrahari, A.K.; Bose, P.; Jaiswal, M.K.; Rajkhowa, S.; Singh, A.S.; Hotha, S.; Mishra, N.; Tiwari, V.K. Cu(I)-Catalyzed Click Chemistry in Glycoscience and Their Diverse Applications. Chem. Rev. 2021, 121, 7638–7956. [Google Scholar] [CrossRef] [PubMed]
  48. Kresse, G.; Furthmüller, J. Efficiency of ab-initio total energy calculations for metals and semiconductors using a plane-wave basis set. Comput. Mater. Sci. 1996, 6, 15–50. [Google Scholar] [CrossRef]
  49. Kresse, G.; Furthmüller, J. Efficient iterative schemes for ab initio total-energy calculations using a plane-wave basis set. Phys. Rev. B 1996, 54, 11169–11186. [Google Scholar] [CrossRef]
  50. Perdew, J.P.; Burke, K.; Ernzerhof, M. Generalized Gradient Approximation Made Simple. Phys. Rev. Lett. 1996, 77, 3865–3868. [Google Scholar] [CrossRef]
  51. Perdew, J.P.; Ernzerhof, M.; Burke, K. Rationale for mixing exact exchange with density functional approximations. J. Chem. Phys. 1996, 105, 9982–9985. [Google Scholar] [CrossRef]
  52. Grimme, S.; Antony, J.; Ehrlich, S.; Krieg, H. A consistent and accurate ab initio parametrization of density functional dispersion correction (DFT-D) for the 94 elements H-Pu. J. Chem. Phys. 2010, 132, 154104. [Google Scholar] [CrossRef] [PubMed]
  53. Grimme, S.; Ehrlich, S.; Goerigk, L. Effect of the damping function in dispersion corrected density functional theory. J. Comput. Chem. 2011, 32, 1456–1465. [Google Scholar] [CrossRef] [PubMed]
  54. Blöchl, P.E. Projector augmented-wave method. Phys. Rev. B 1994, 50, 17953–17979. [Google Scholar] [CrossRef] [PubMed]
  55. Heyden, A.; Bell, A.T.; Keil, F.J. Efficient methods for finding transition states in chemical reactions: Comparison of improved dimer method and partitioned rational function optimization method. J. Chem. Phys. 2005, 123, 224101. [Google Scholar] [CrossRef] [PubMed]
  56. Wang, V.; Xu, N.; Liu, J.-C.; Tang, G.; Geng, W.-T. VASPKIT: A user-friendly interface facilitating high-throughput computing and analysis using VASP code. Comput. Phys. Commun. 2021, 267, 108033. [Google Scholar] [CrossRef]
  57. Hjorth Larsen, A.; Jorgen Mortensen, J.; Blomqvist, J.; Castelli, I.E.; Christensen, R.; Dulak, M.; Friis, J.; Groves, M.N.; Hammer, B.; Hargus, C.; et al. The atomic simulation environment-a Python library for working with atoms. J. Phys. Condens. Matter. 2017, 29, 273002. [Google Scholar] [CrossRef]
  58. Momma, K.; Izumi, F. VESTA: A three-dimensional visualization system for electronic and structural analysis. J. Appl. Crystallogr. 2008, 41, 653–658. [Google Scholar] [CrossRef]
  59. Peterson, A.A.; Abild-Pedersen, F.; Studt, F.; Rossmeisl, J.; Nørskov, J.K. How copper catalyzes the electroreduction of carbon dioxide into hydrocarbon fuels. Energy Environ. Sci. 2010, 3, 1311–1315. [Google Scholar] [CrossRef]
Scheme 1. Synthesis route for the fluorescent probe R-β-D-1.
Micromachines 15 00163 sch001
Figure 1. Fluorescence spectra of R-β-D-1 (20 μM, MeOH solution) in the presence of different ions (Ba2+, Mn2+, Cu+, Ca2+, K+, Co3+, Cr3+, Zn2+, Al3+, Mg2+, Pb2+, Ag+, Cd2+, Gd3+, Li+, Na+, NH4+, Ni2+ and Bi3+) (R-β-D-1 + 5-fold equivalent ions).
Micromachines 15 00163 g001
Figure 2. Green bars in the graph indicate the addition of 5.0 eq of different cations to the R-β-D-1 (20 μM in CH3OH) solution; magenta bars in the graph indicate the addition of competing cations in the presence of Bi3+. IF/I0 indicates the degree of fluorescence quenching. Where I0 denotes the intensity of fluorescence of R-β-D-1 only, and IF denotes the intensity of fluorescence of a mixture of competing metal ions and Bi3+.
Micromachines 15 00163 g002
Figure 3. (a) Fluorescence titration plot of sensor R-β-D-1 (20 μM in CH3OH, λex = 278 nm) versus Bi3+ (0.01 M) equivalents (0–26.0 eq). (b). Plot of the change in fluorescence intensity of sensor R-β-D-1 at 343 nm as the concentration of Bi3+ increases.
Micromachines 15 00163 g003
Figure 4. (a) The lowest limit of detection (LOD) of sensor R-β-D-1 for Bi3+ was 6.58 × 10⁻⁸mol/L. (b) A 1:1 combination based on the graphs of stoichiometric I0/(I0-I) and 1/[Bi3+] Benesi–Hildebrand equations. (c) Working curve for the 1:1 compounds of R-β-D-1 with Bi3+, where x is the molarity of Bi3+.
Micromachines 15 00163 g004
Figure 5. (a) SEM image of R-β-D-1. (b,c) SEM images of different angles in the presence of Bi3+.
Micromachines 15 00163 g005
Figure 6. (a) AFM plot of sensor R-β-D-1, and (b) AFM plot after the addition of Bi3+ in R-β-D-1.
Micromachines 15 00163 g006
Figure 7. R-β-D-1 structure of the sensor that was computationally optimized by density functional theory at the B3LYP/6-31G level of theoretical sophistication. (a) is the R-β-D-1 structure of the sensor, (b) is the structure of the sensor after complexation of R-β-D-1 with Bi3+.
Micromachines 15 00163 g007
Figure 8. Molecular orbitals at the frontier of the sensor R-β-D-1 optimized at the B3LYP/6-31G level of theory and structure after complexation with Bi3+. (a) is the HOMO-LUMO gap of the sensor R-β-D-1, (b) is the HOMO-LUMO gap of the sensor’s R-β-D-1 complexed with Bi3+.
Micromachines 15 00163 g008
Figure 9. Differential charge density distributions of R-β-D-1-Bi3+. The yellow and blue colours represent electron accumulation and depletion regions, respectively, and the isosurface value is 0.001 e/Å3 (test methods are in the Supplementary Materials).
Micromachines 15 00163 g009
Figure 10. Mechanism of Bi3+ recognition by sensor R-β-D-1.
Micromachines 15 00163 g010
Disclaimer/Publisher’s Note: The statements, opinions and data contained in all publications are solely those of the individual author(s) and contributor(s) and not of MDPI and/or the editor(s). MDPI and/or the editor(s) disclaim responsibility for any injury to people or property resulting from any ideas, methods, instructions or products referred to in the content.

