
Prediction of Pad Wear Profile and Simulation of Its Influence on Wafer Polishing

Abstract
:1. Introduction
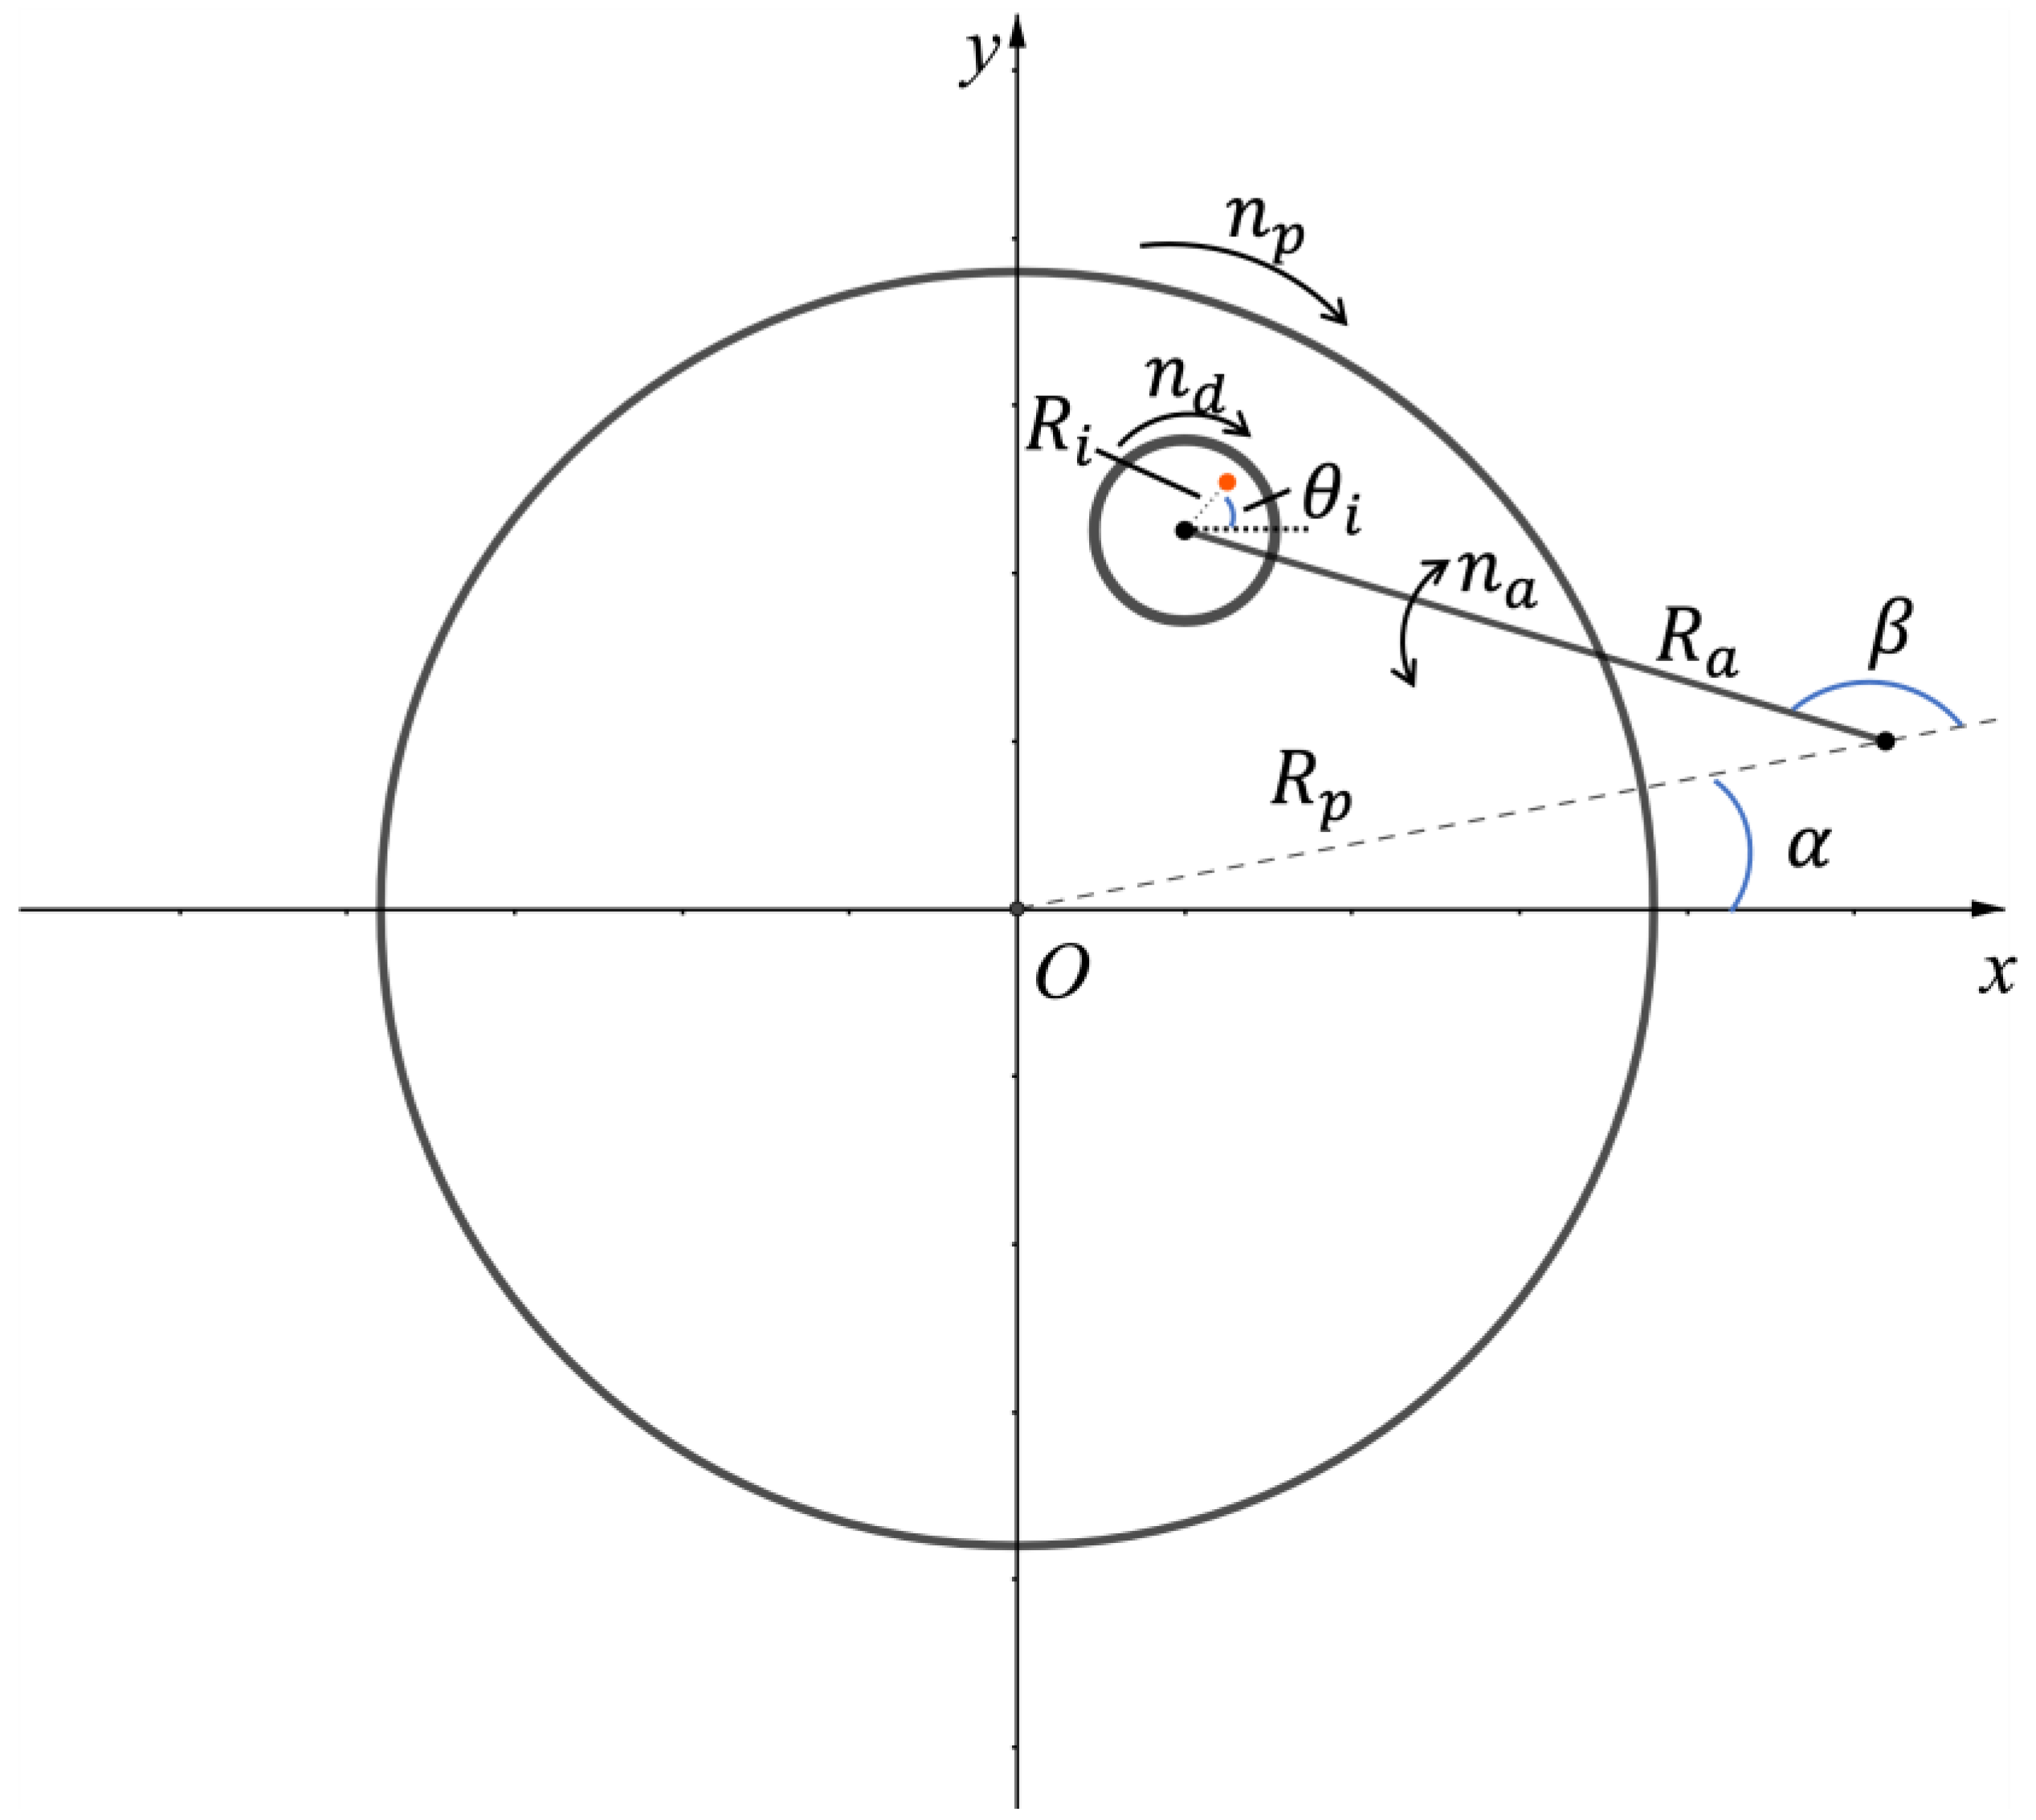
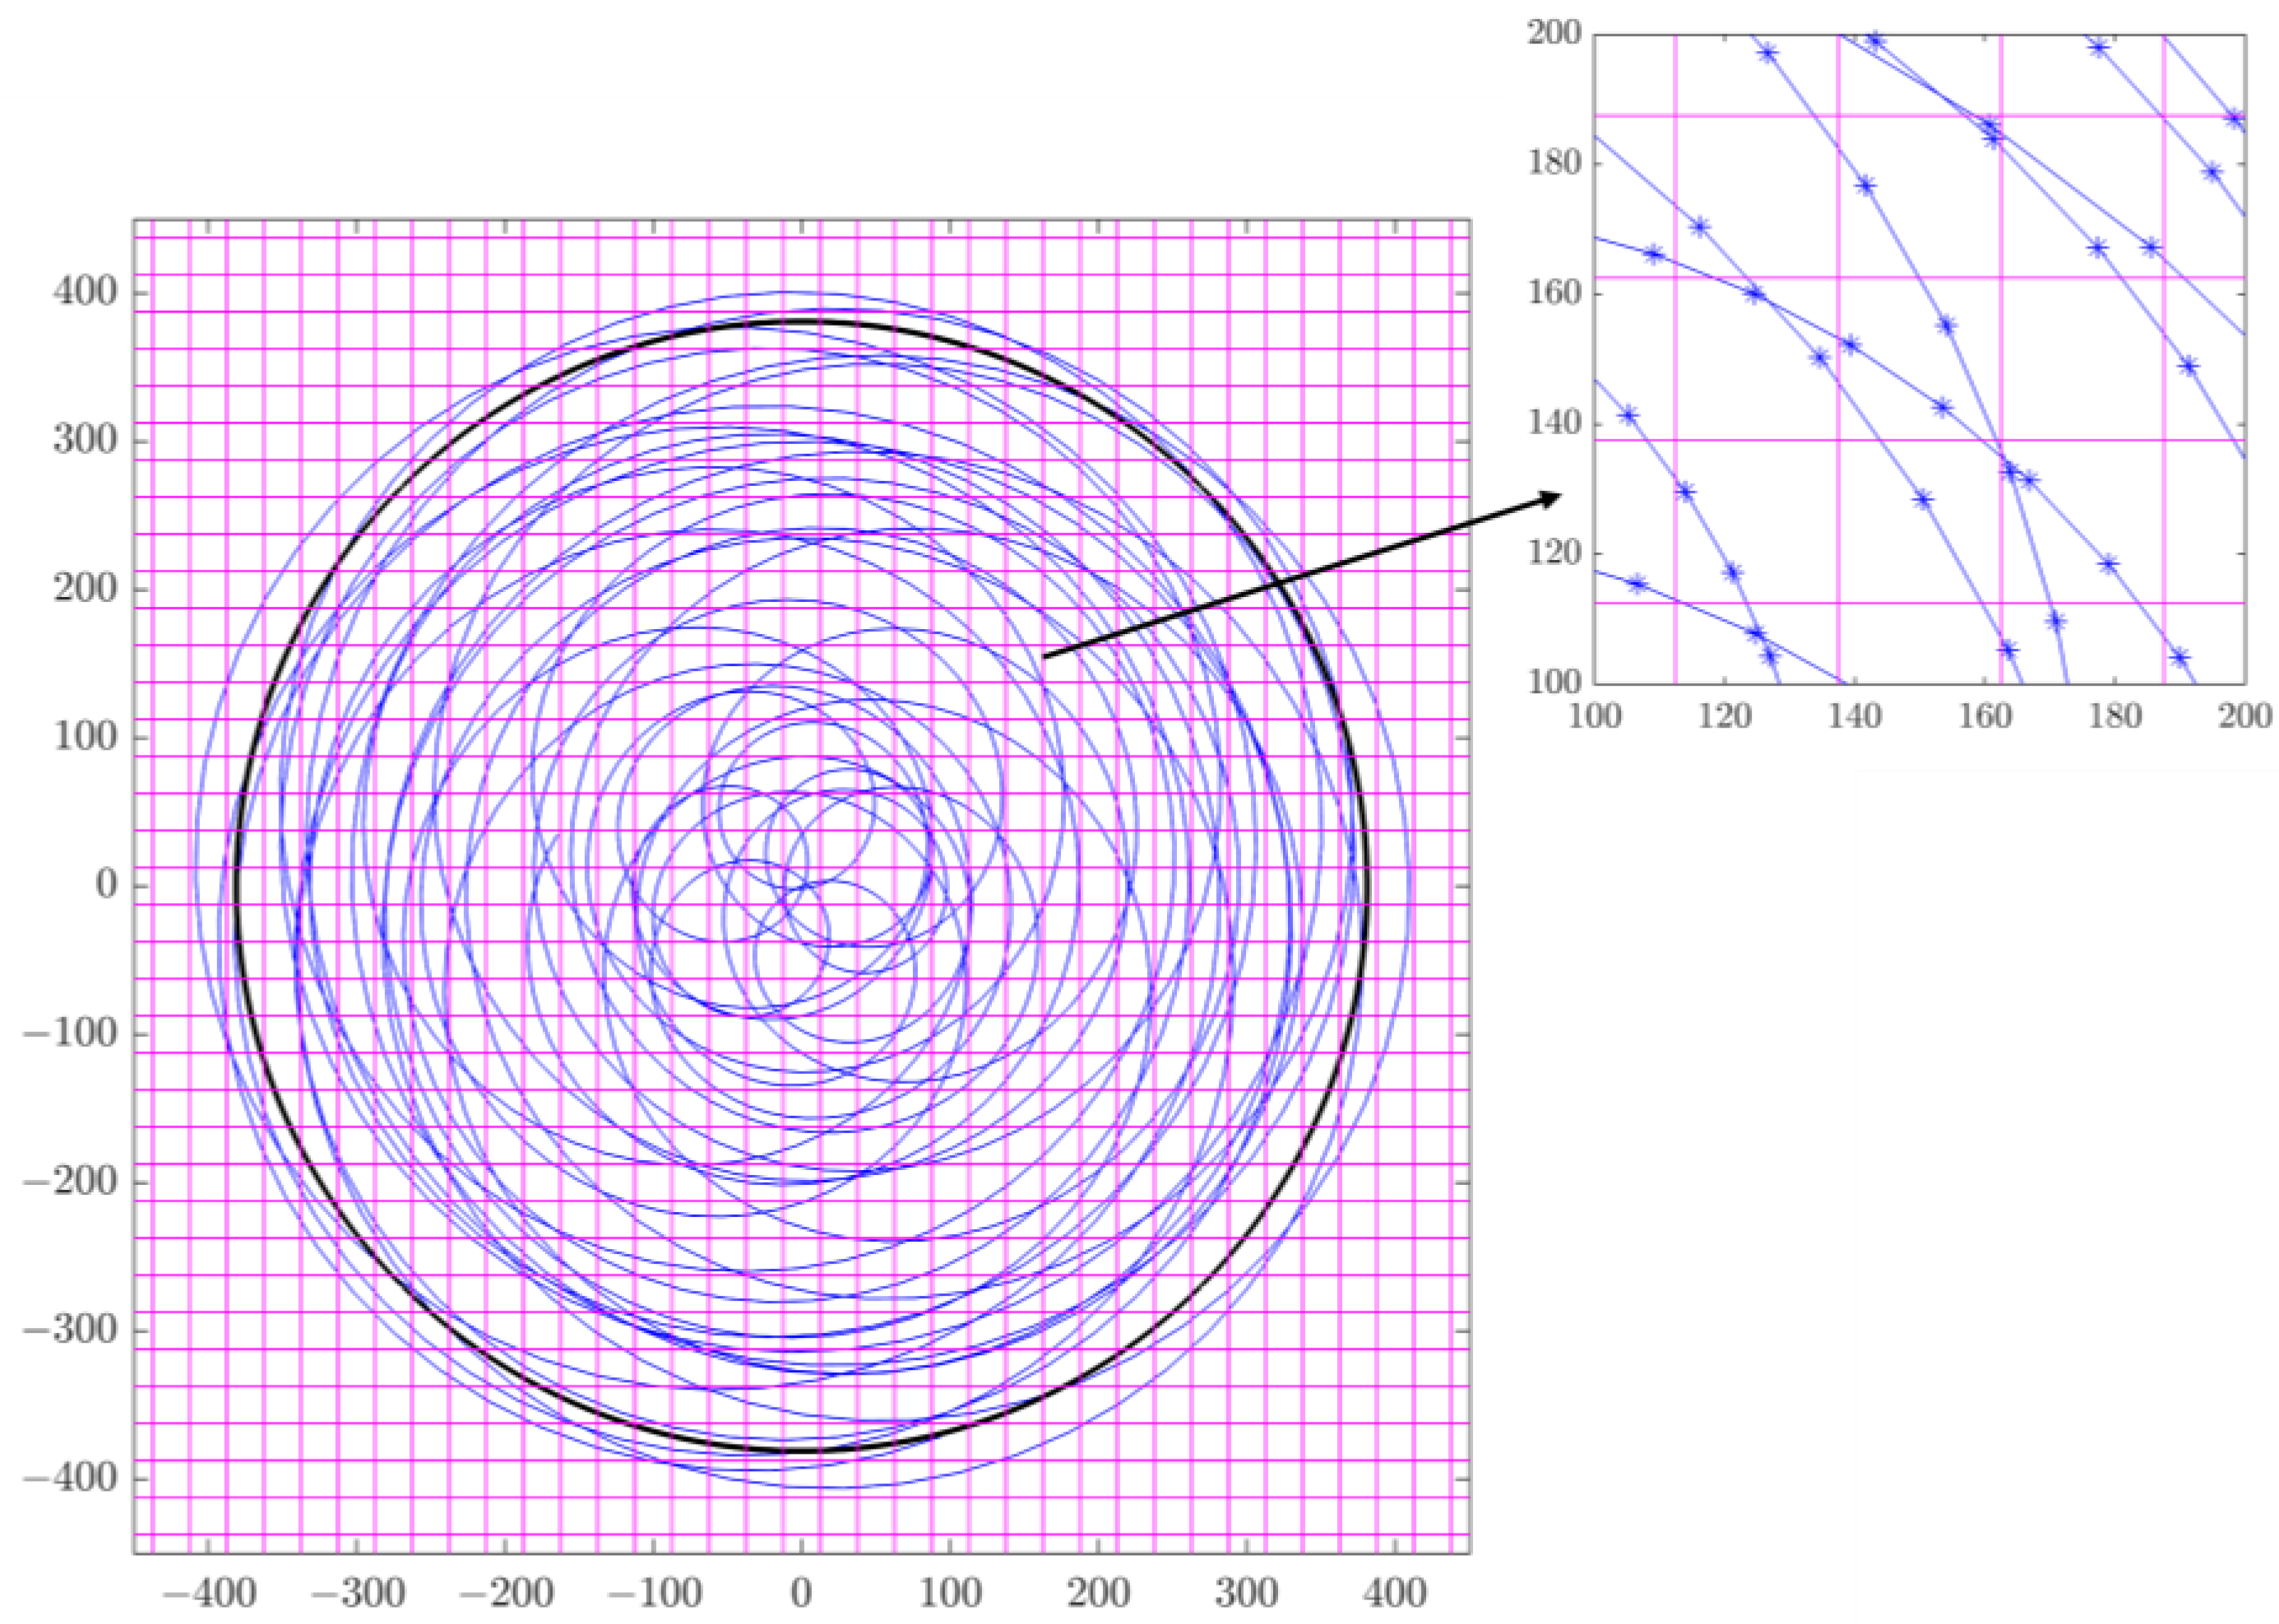
2. Kinematic Model
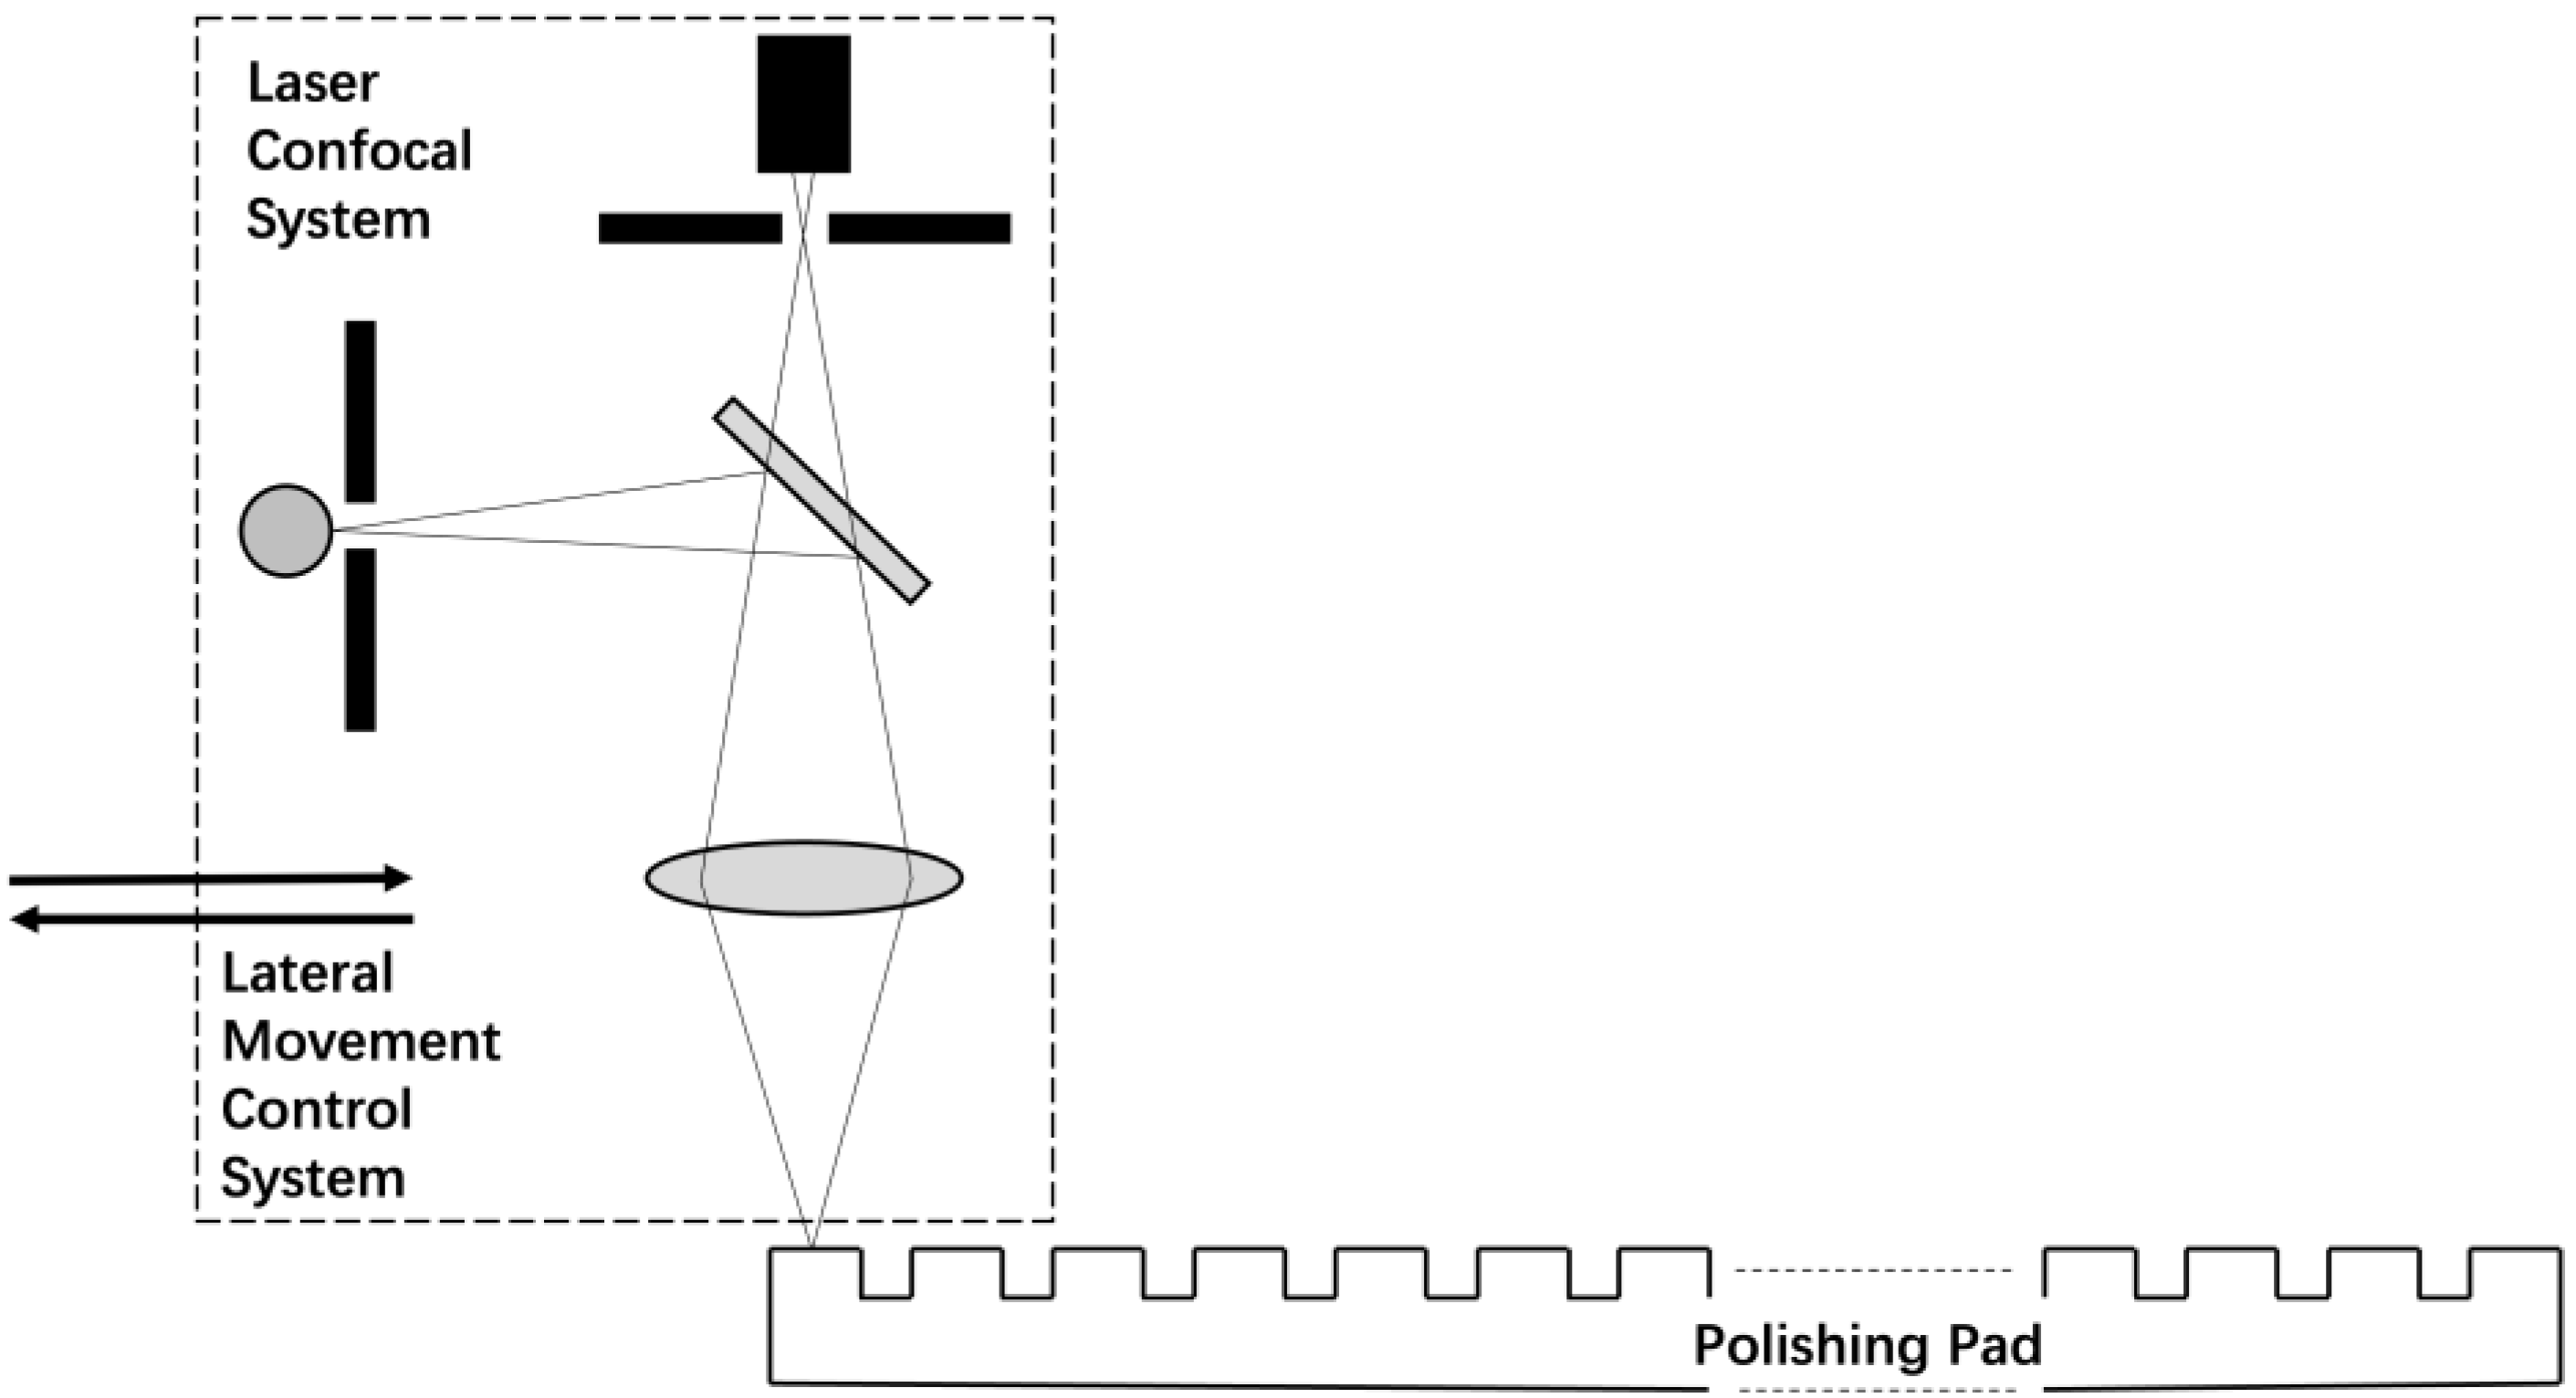
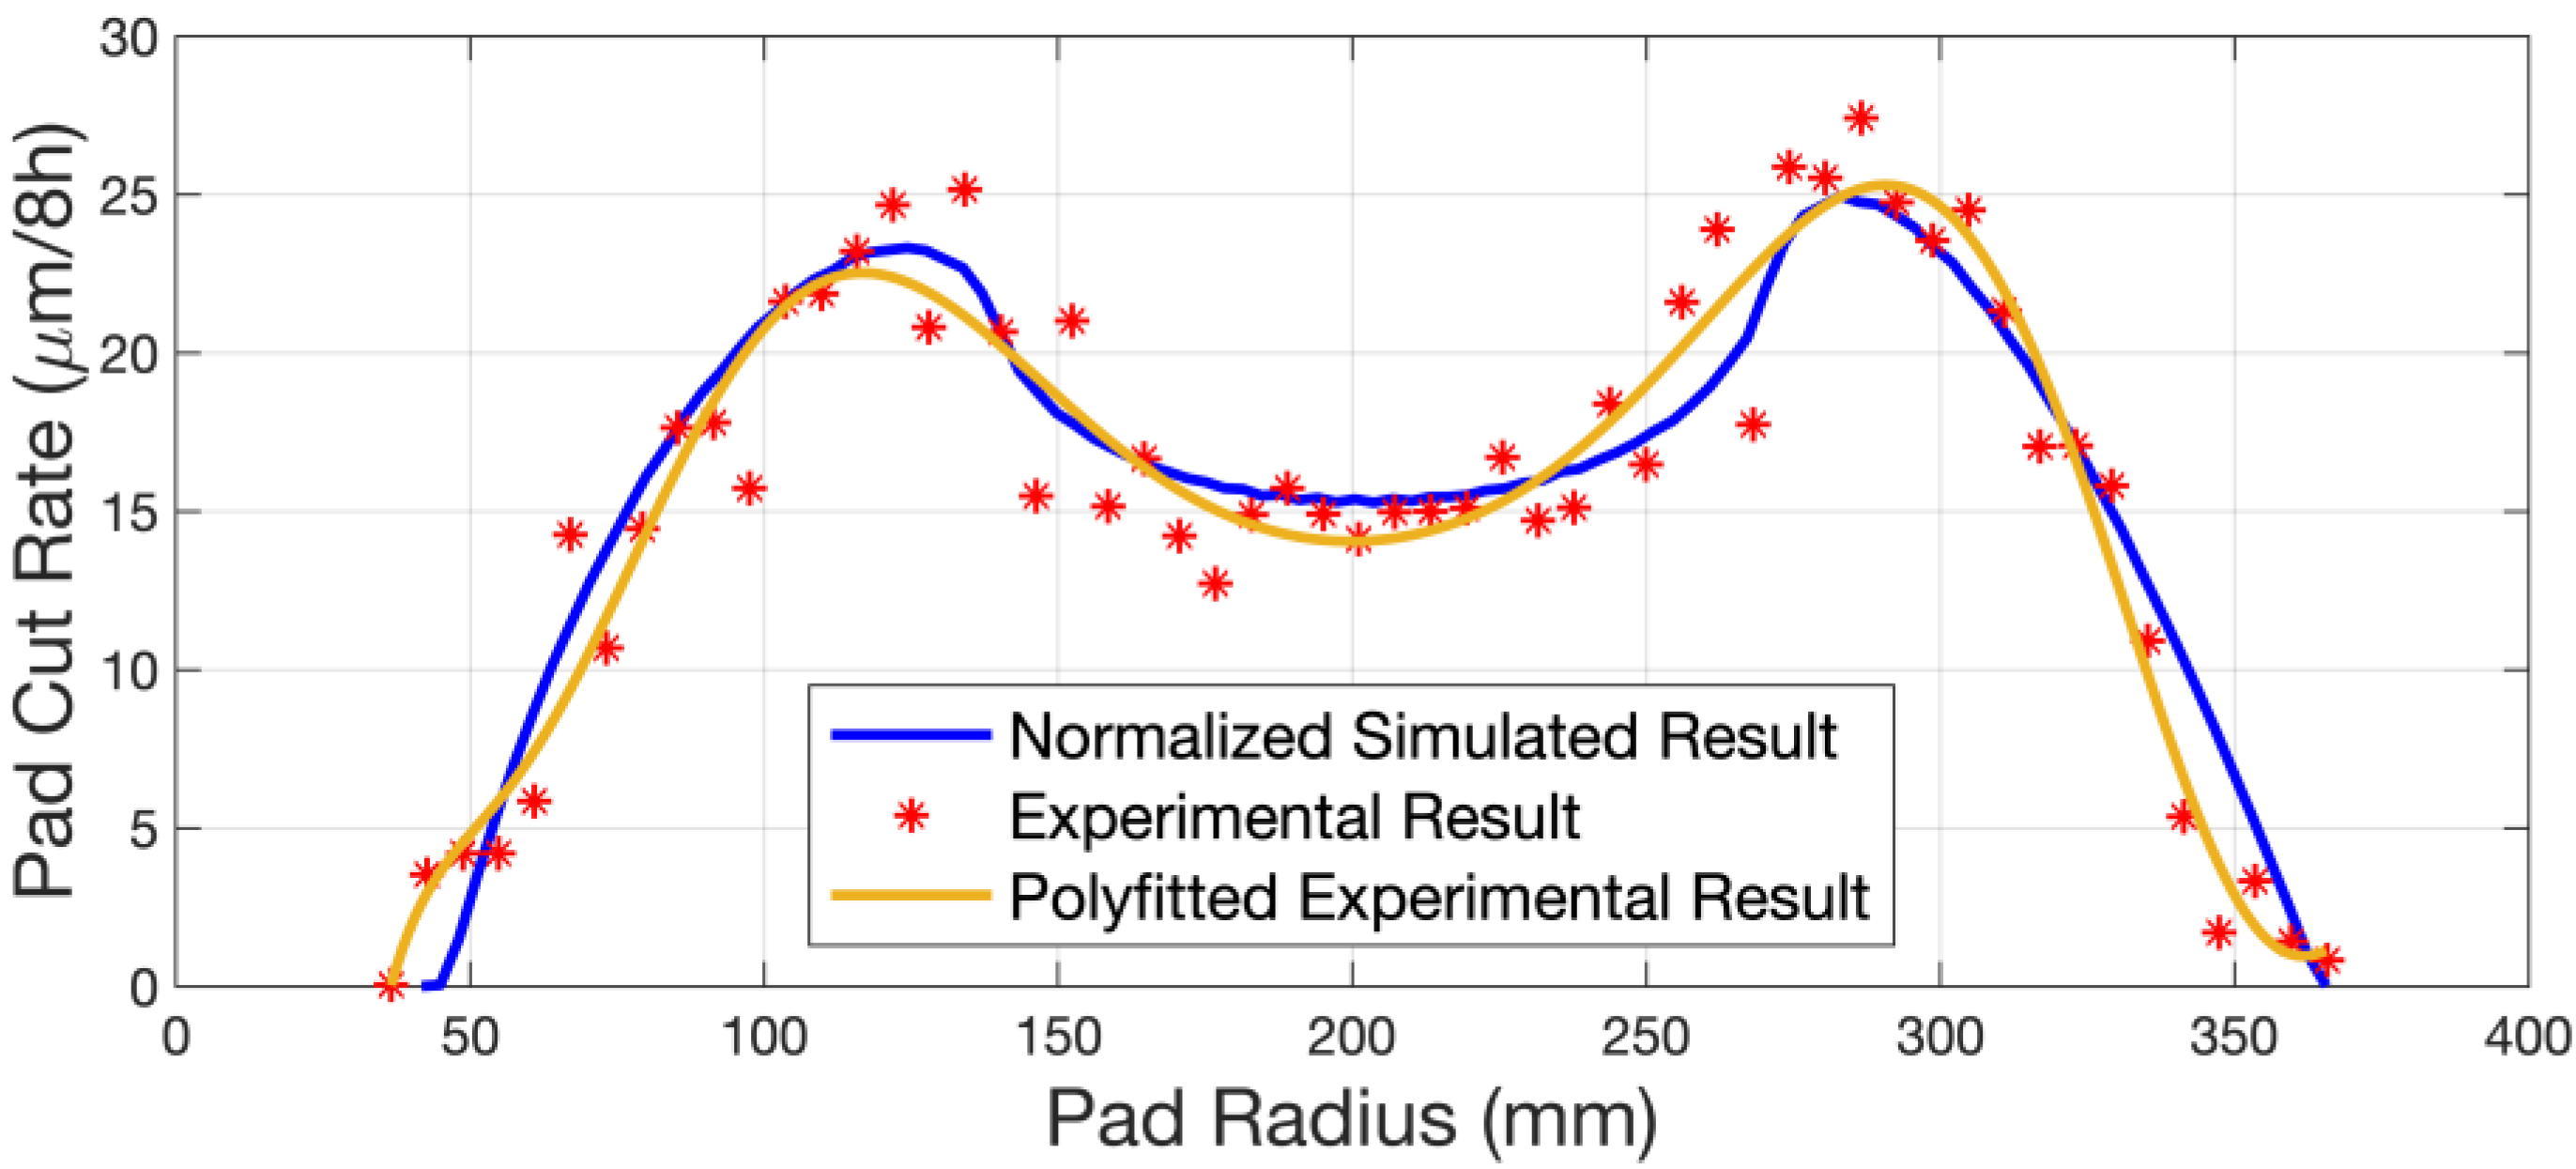
3. Experimental Verification
4. Results and Discussion
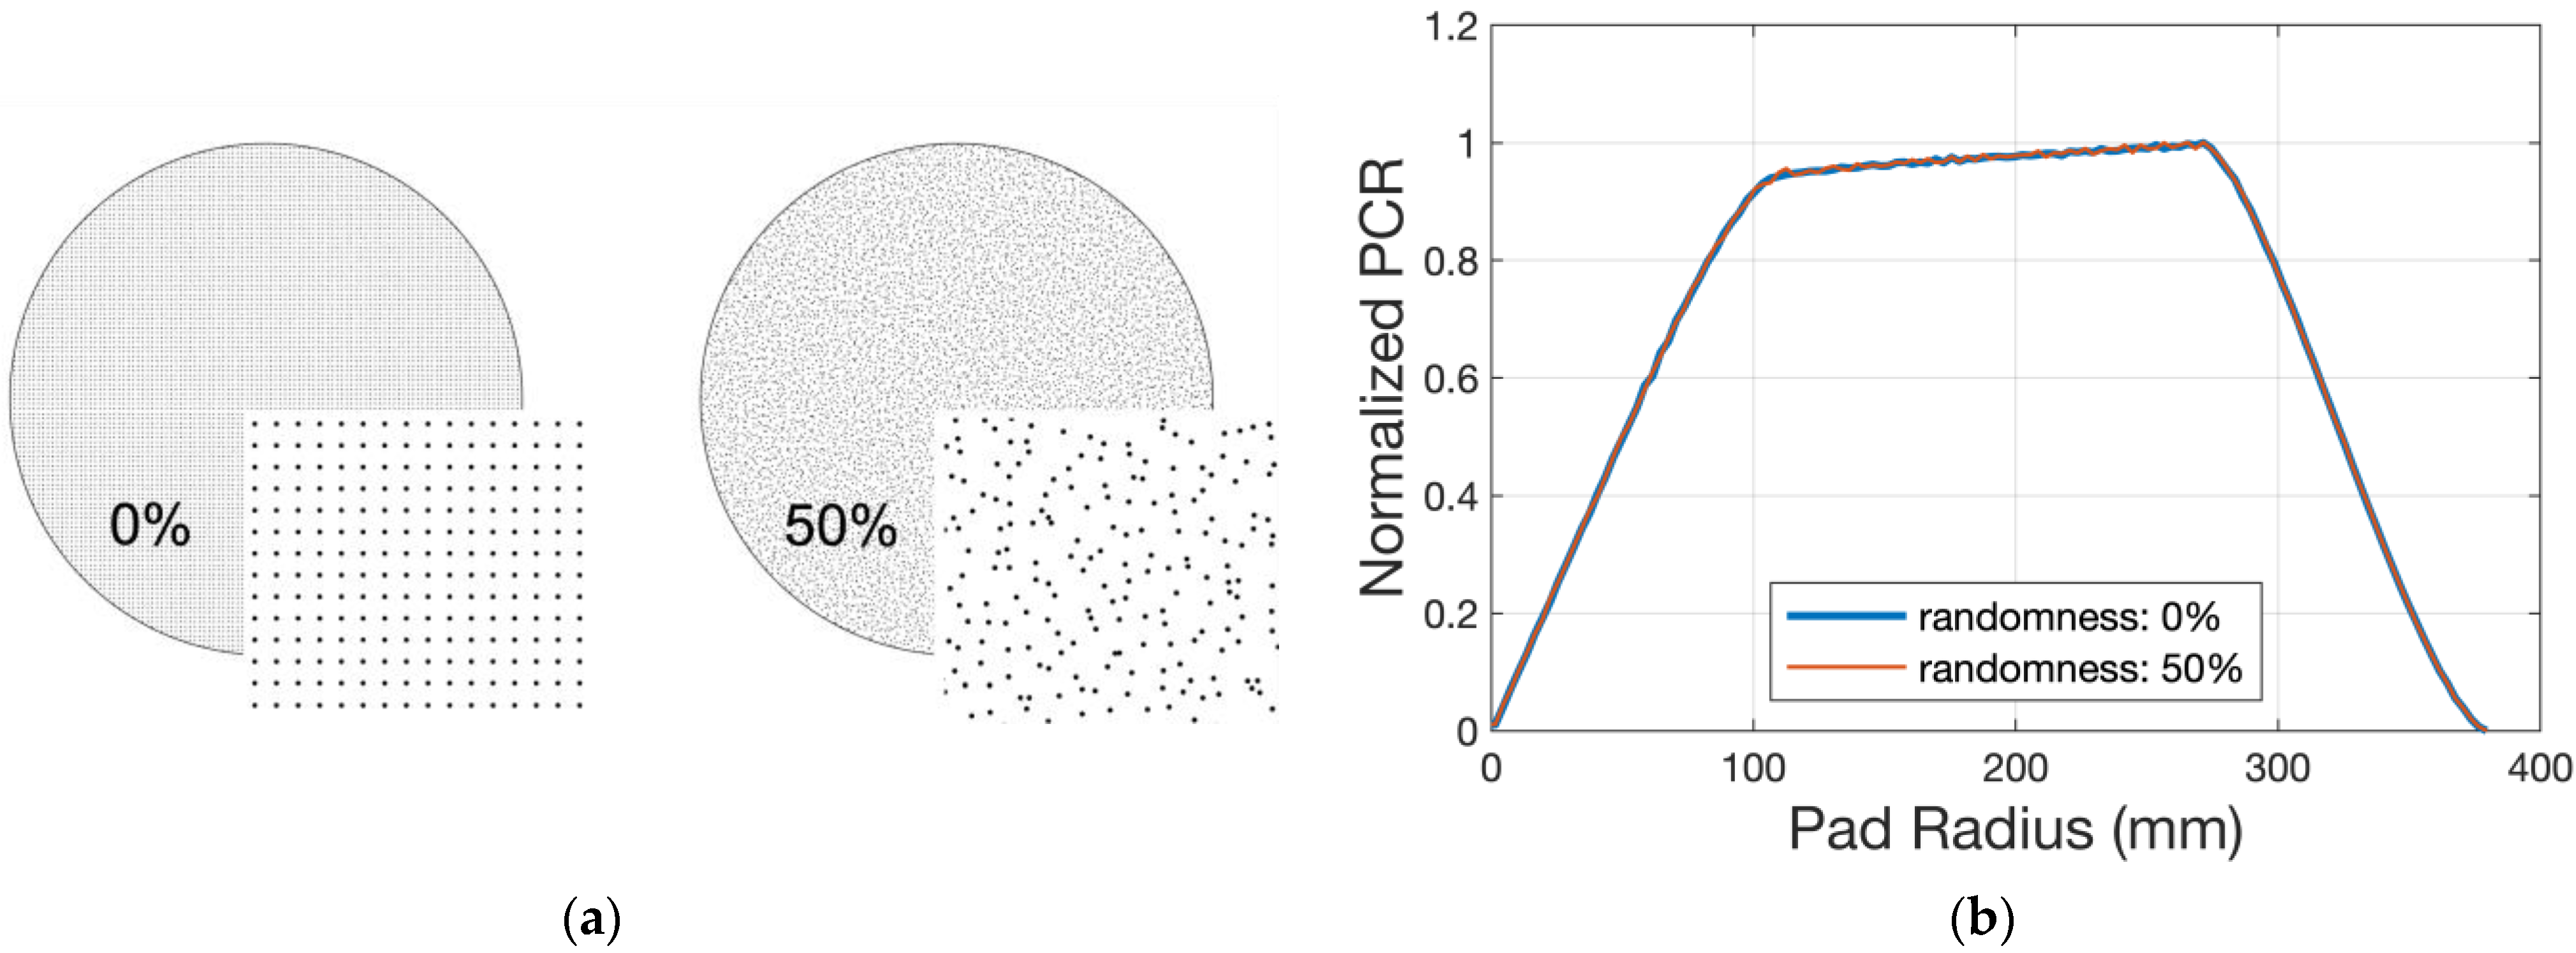
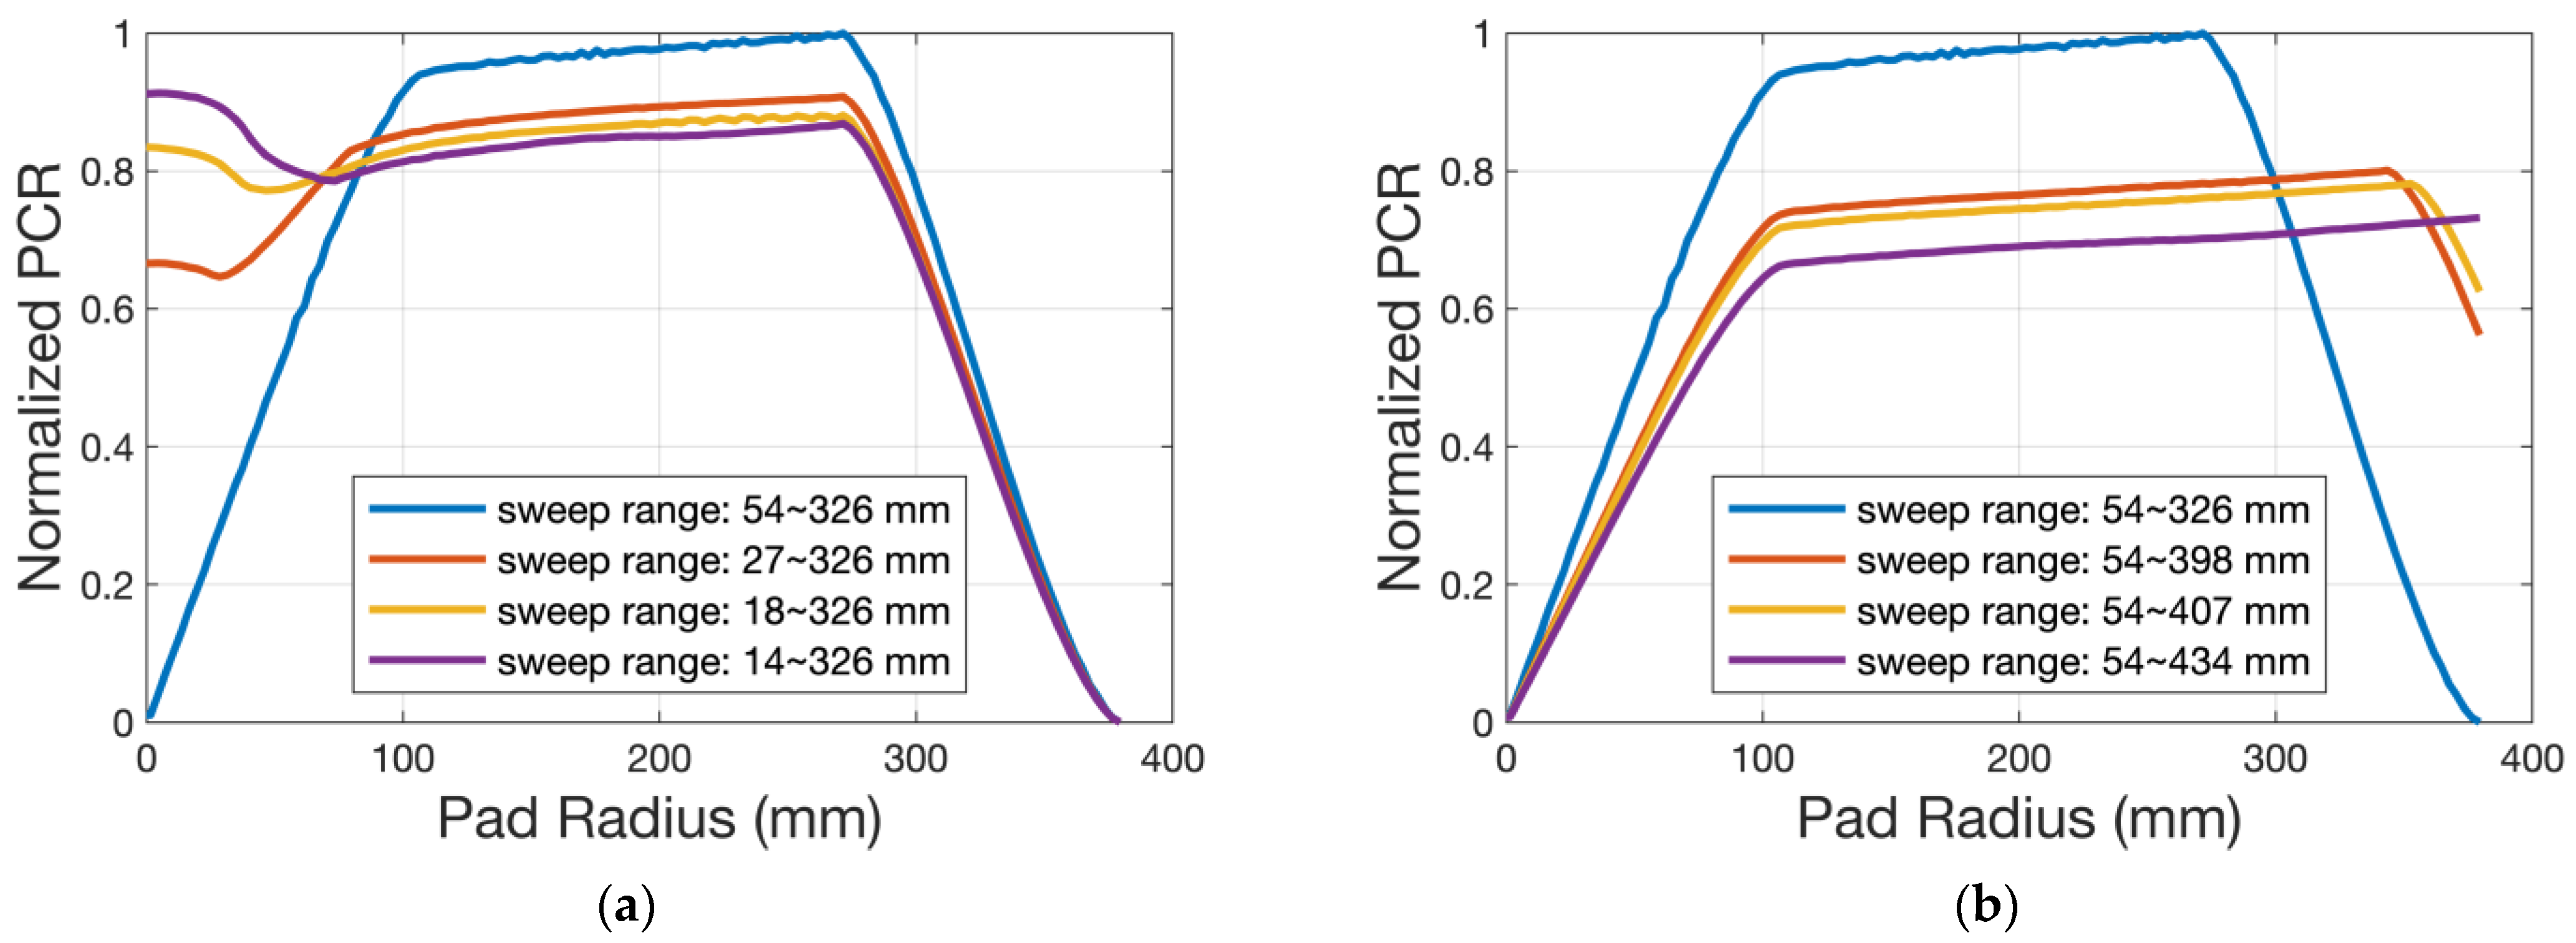
4.1. Influence of Different Kinematic Parameters on the PCR
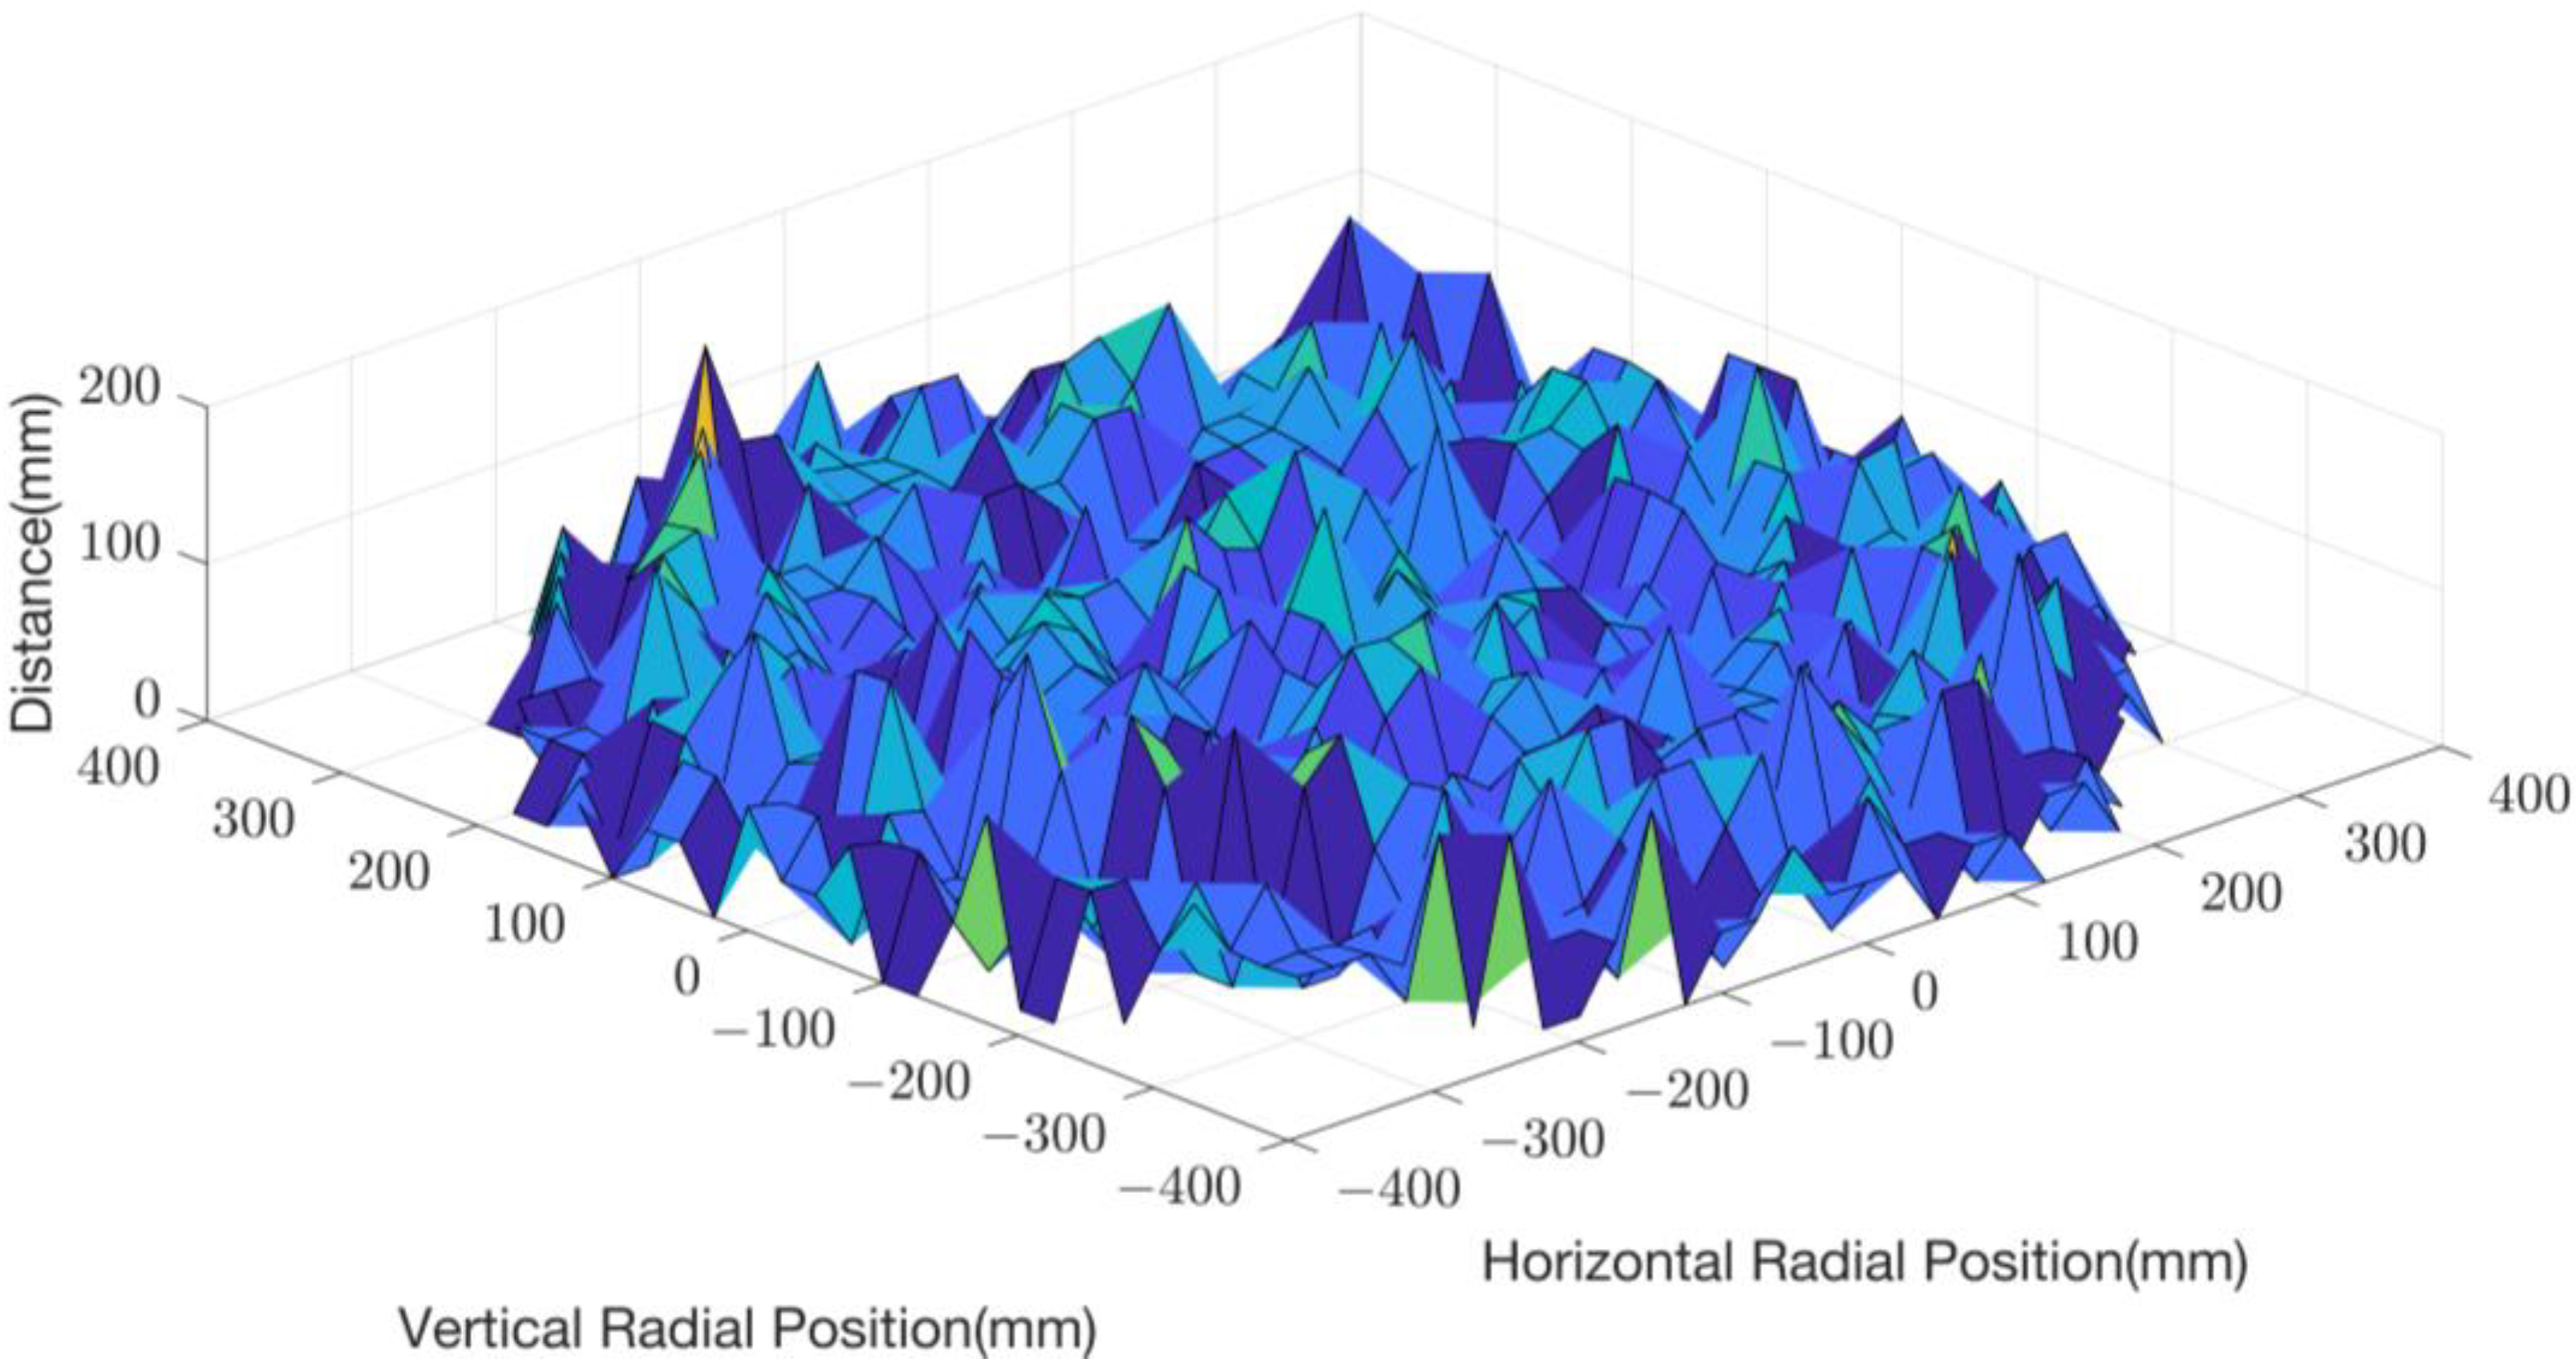
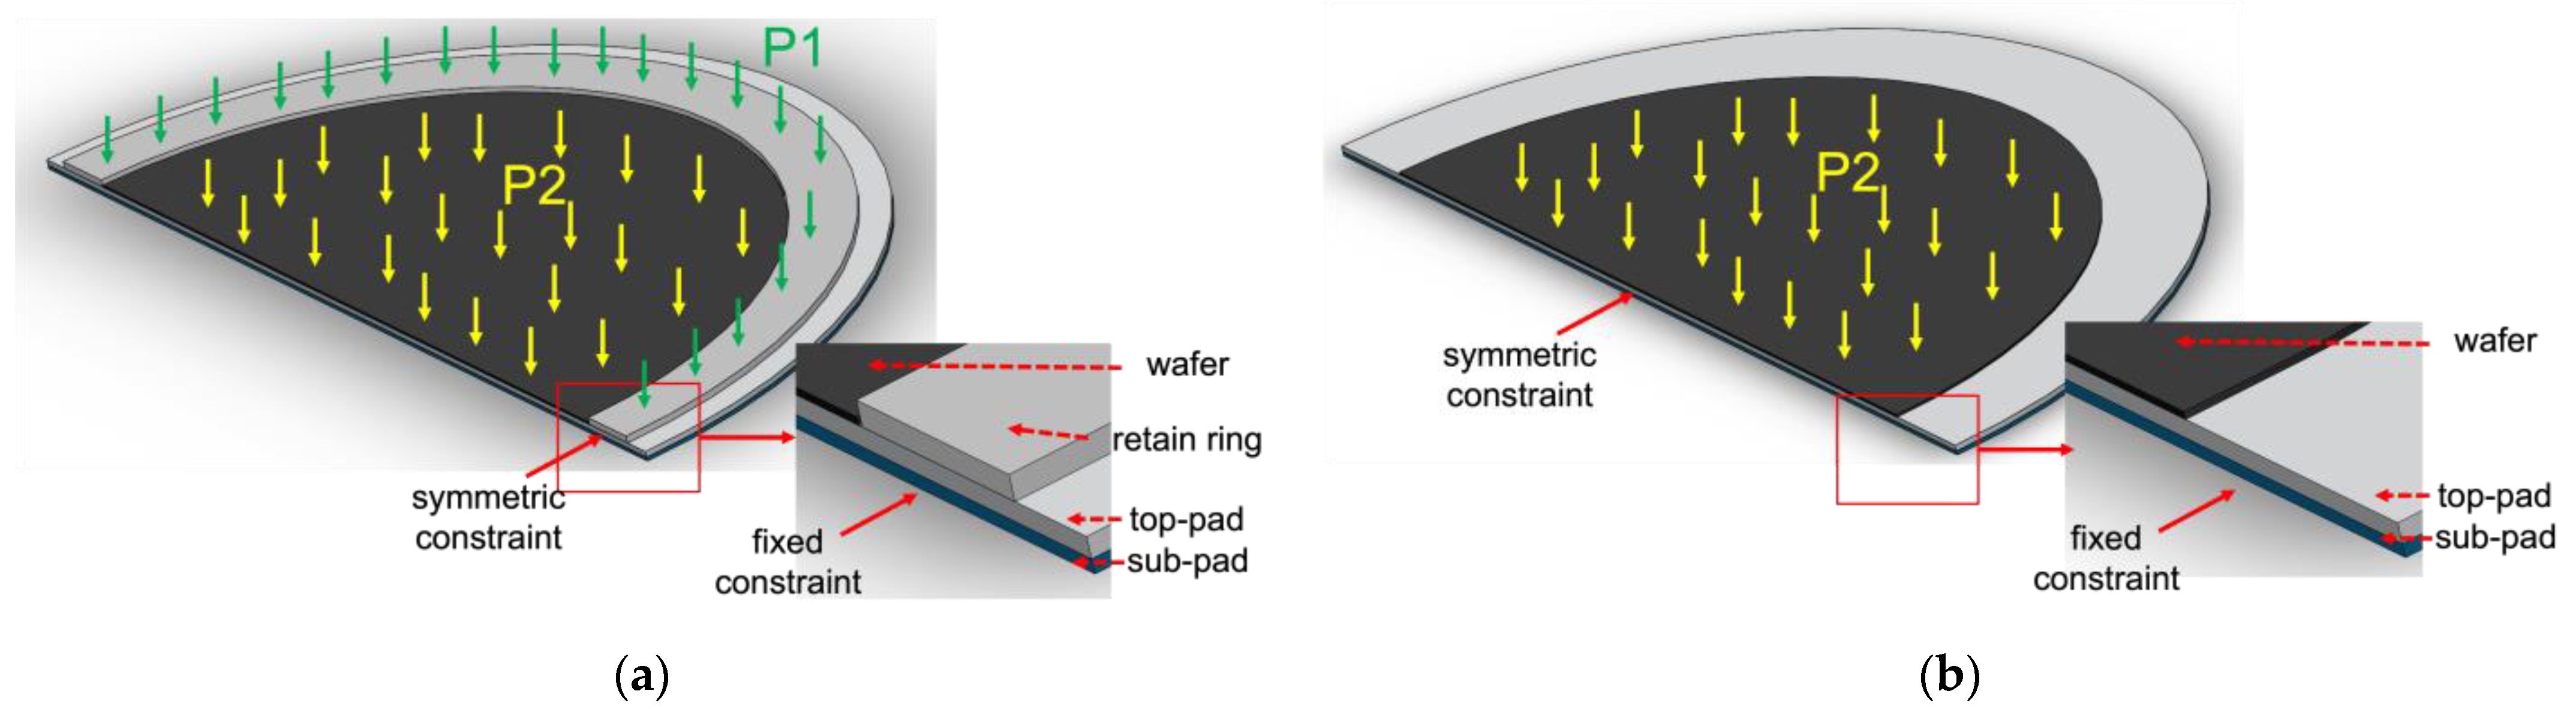
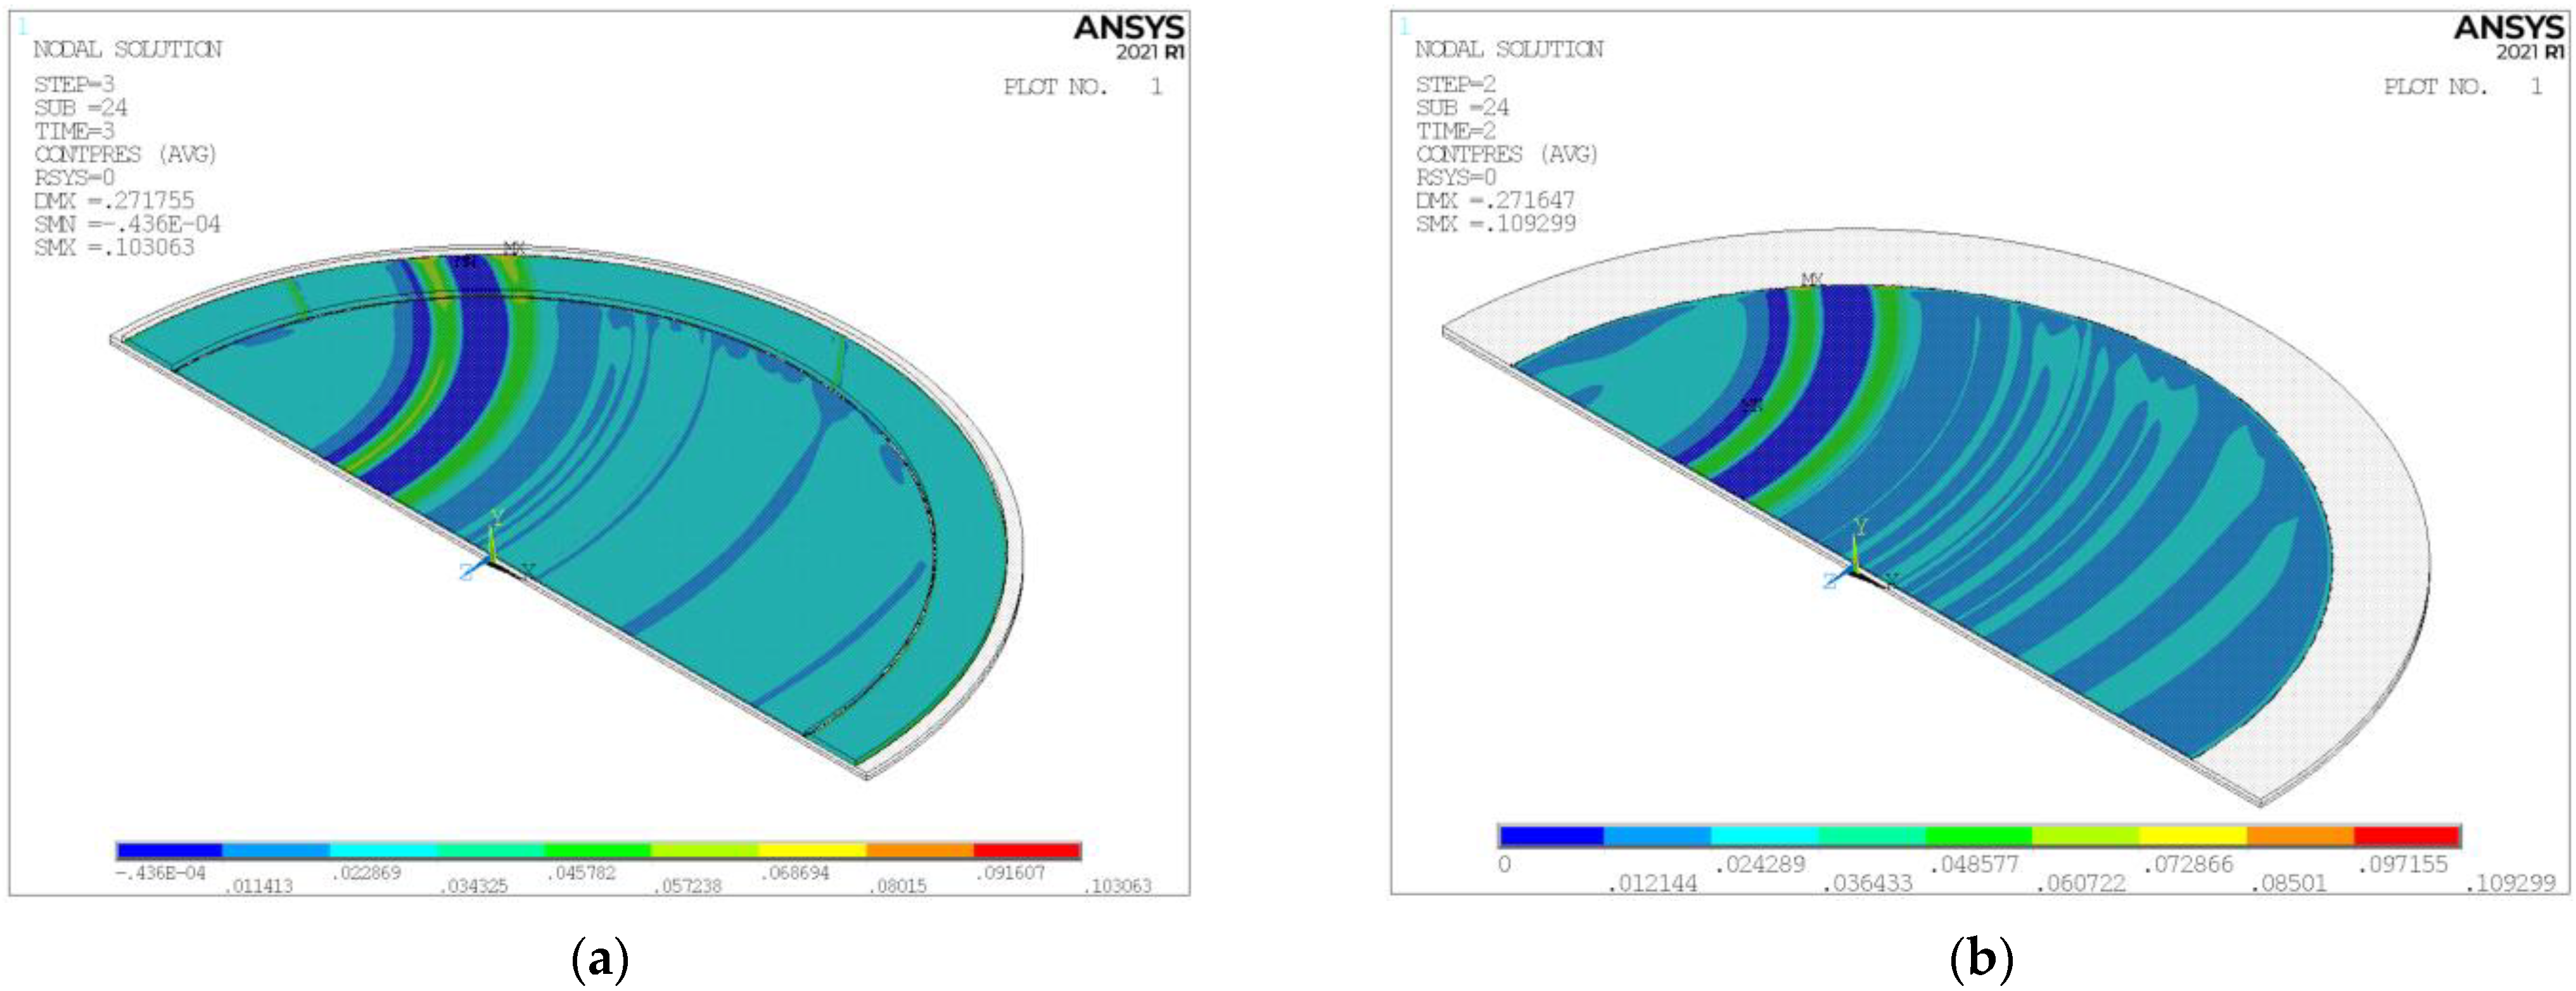
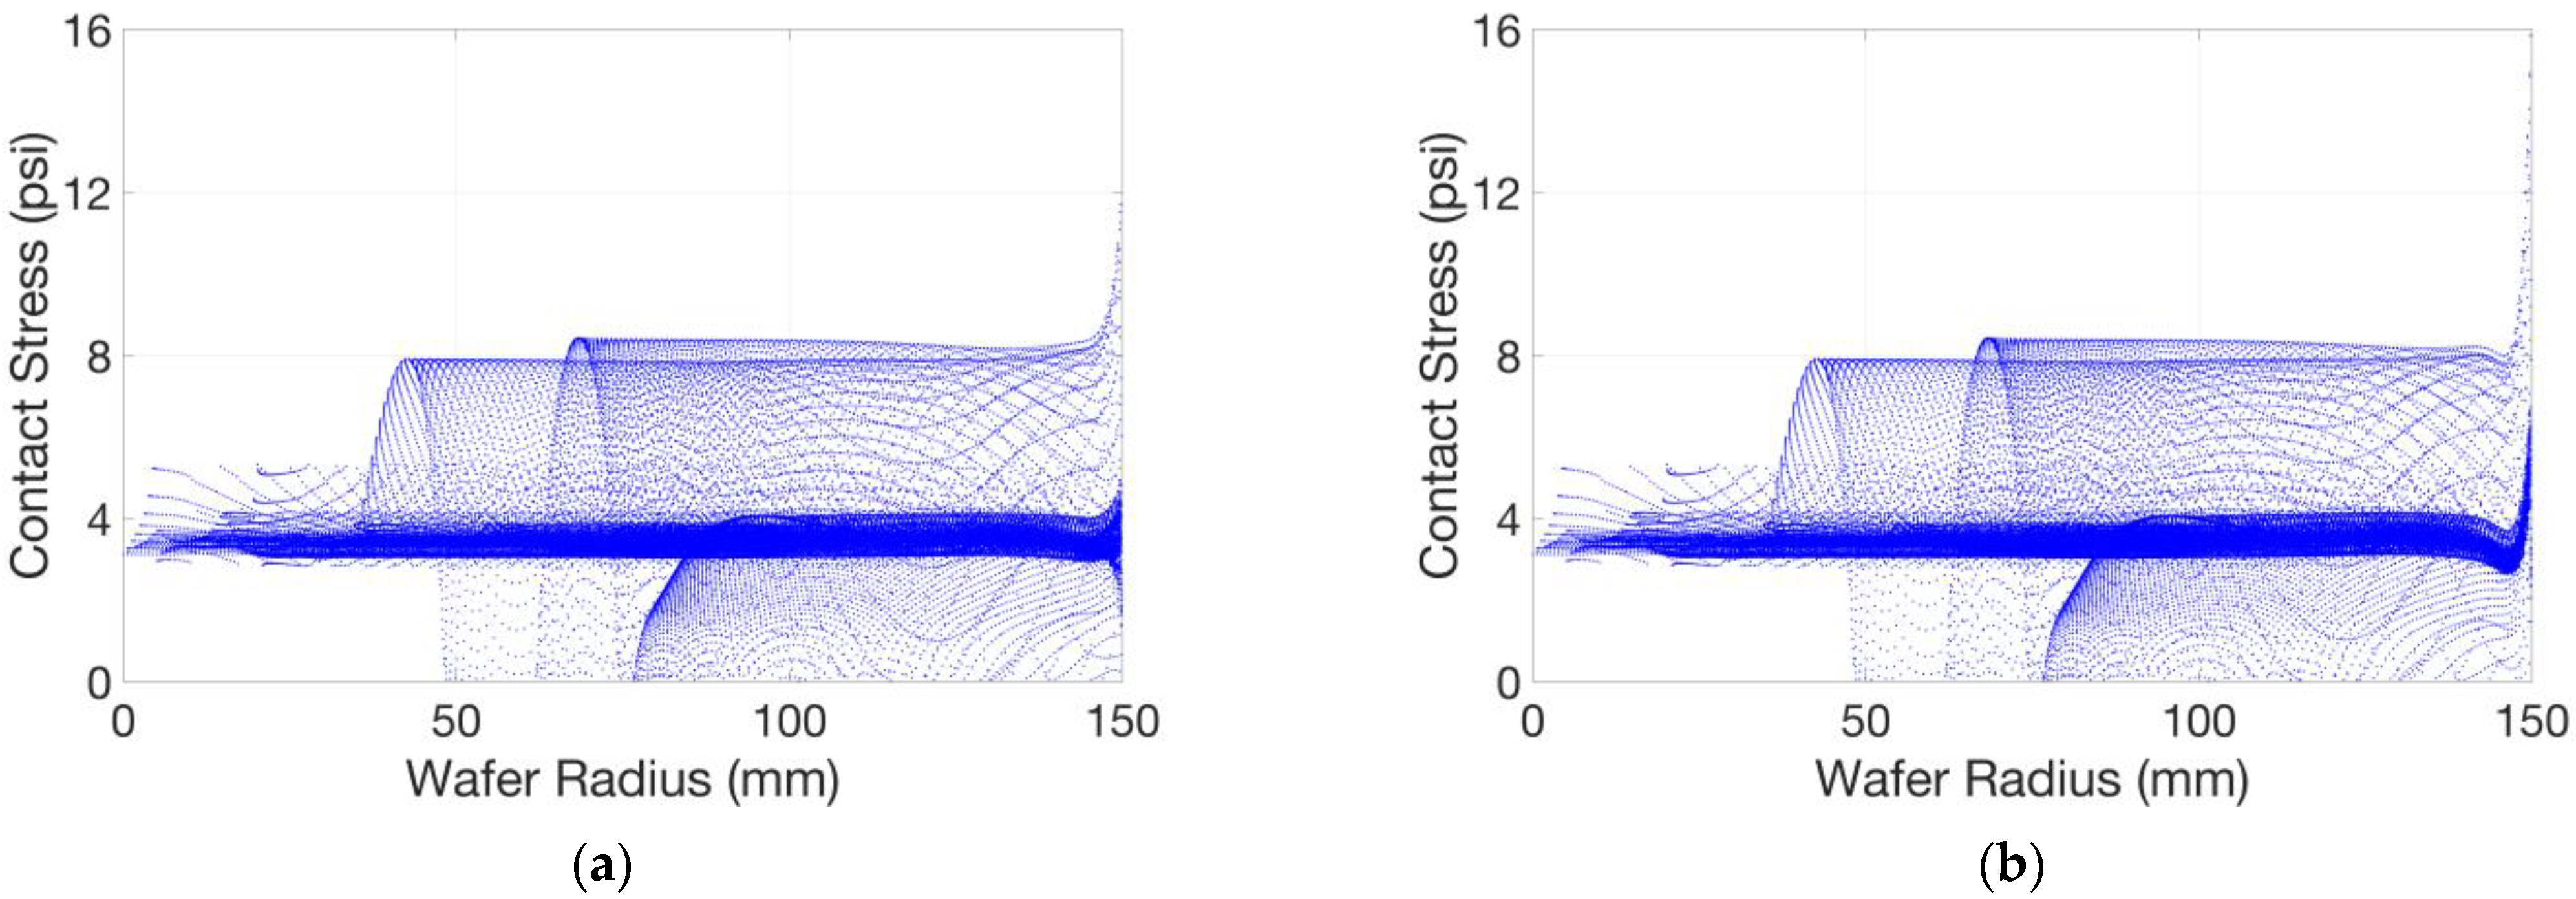
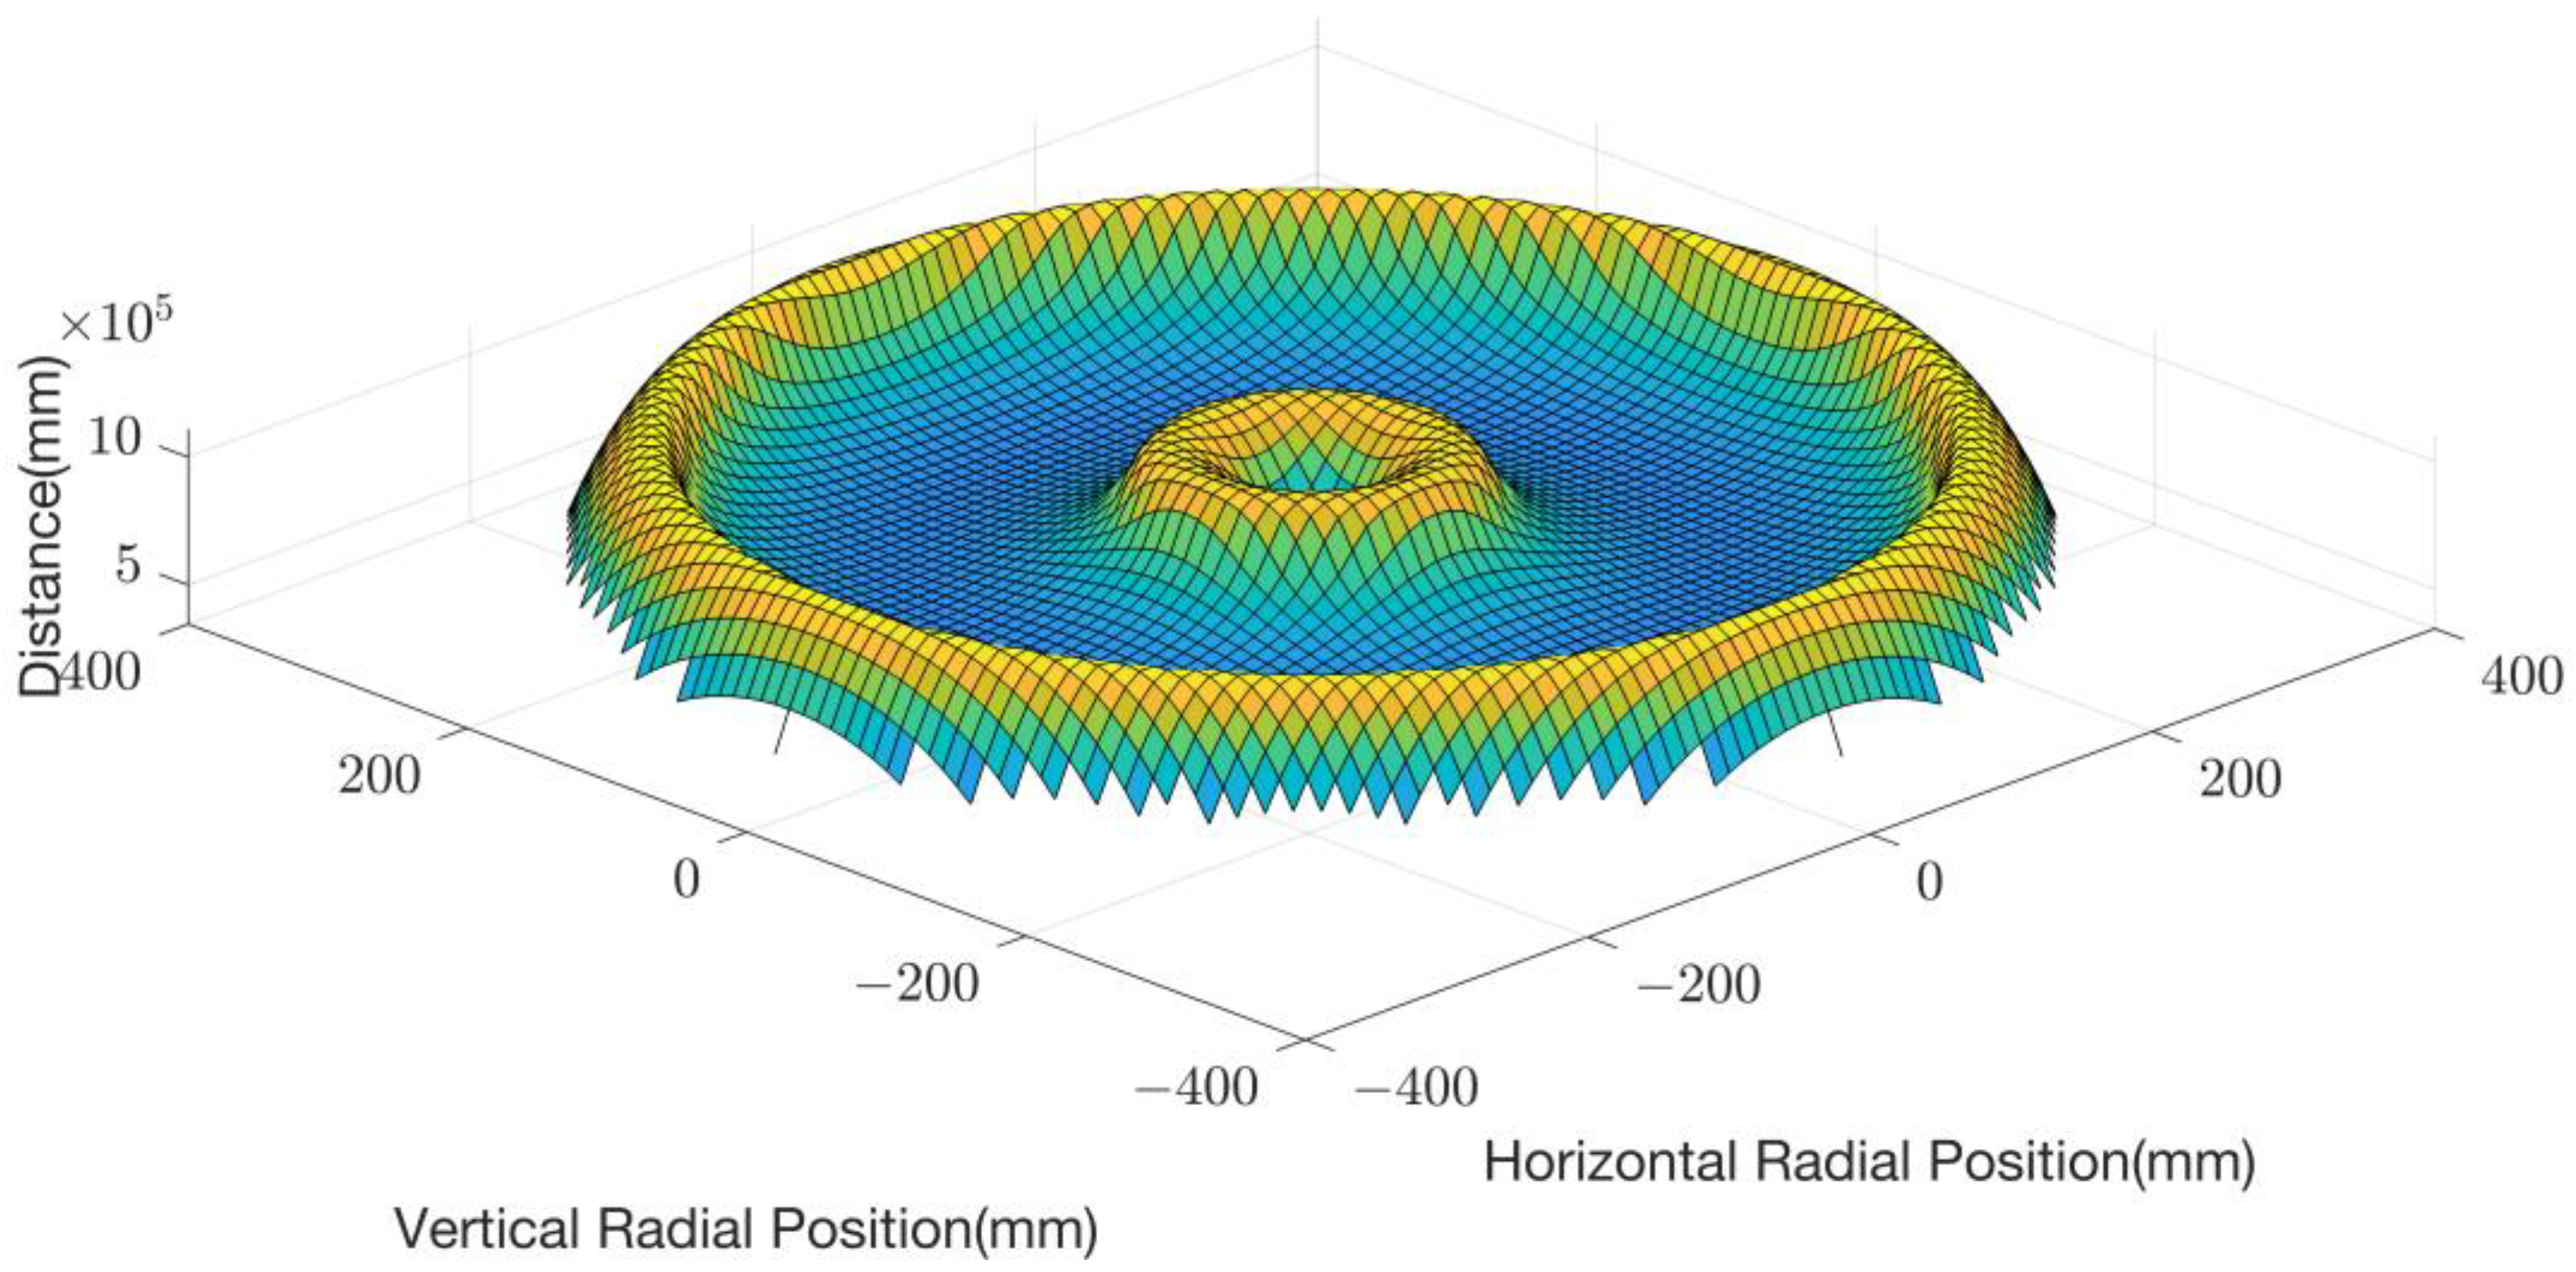
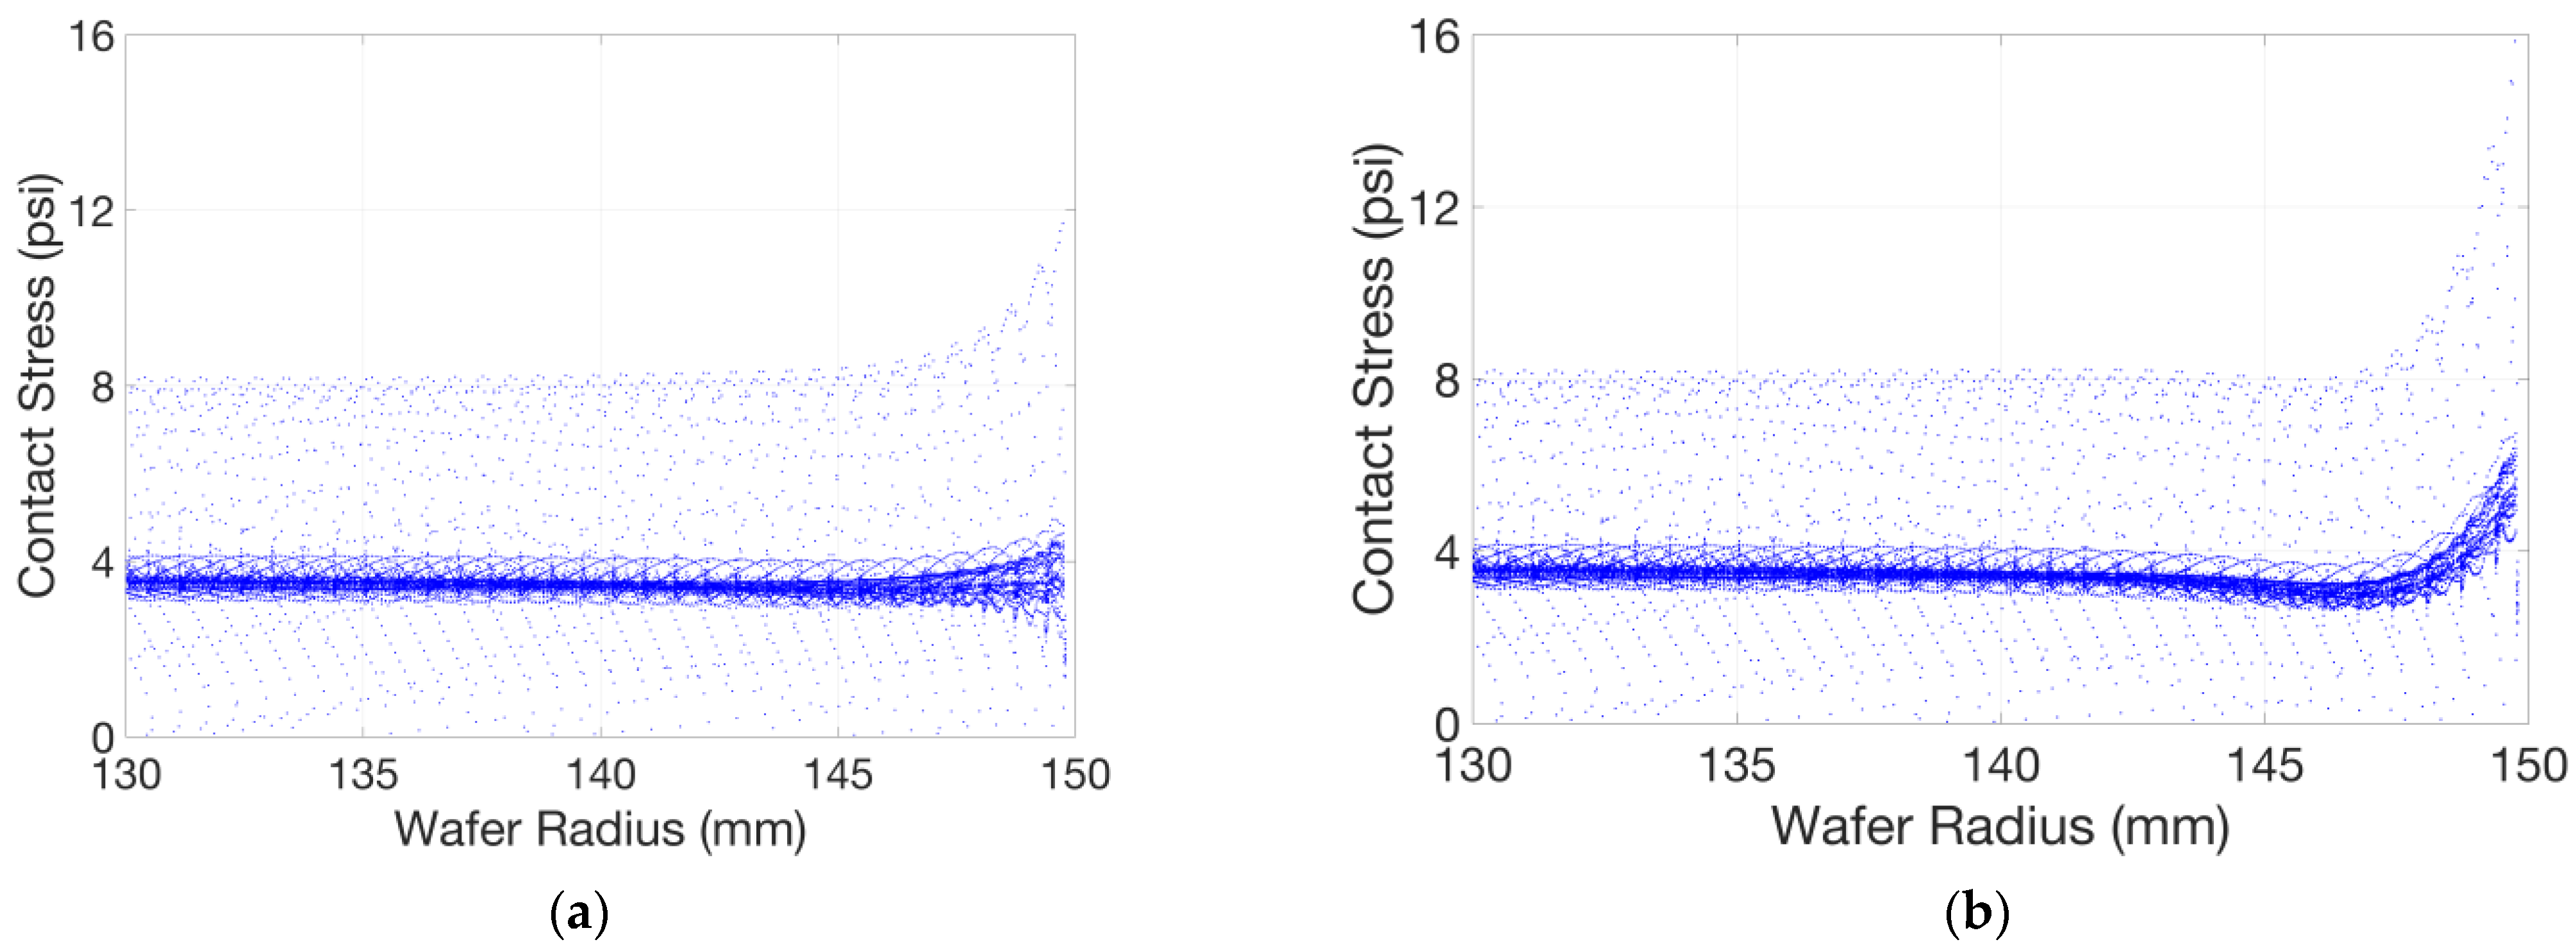
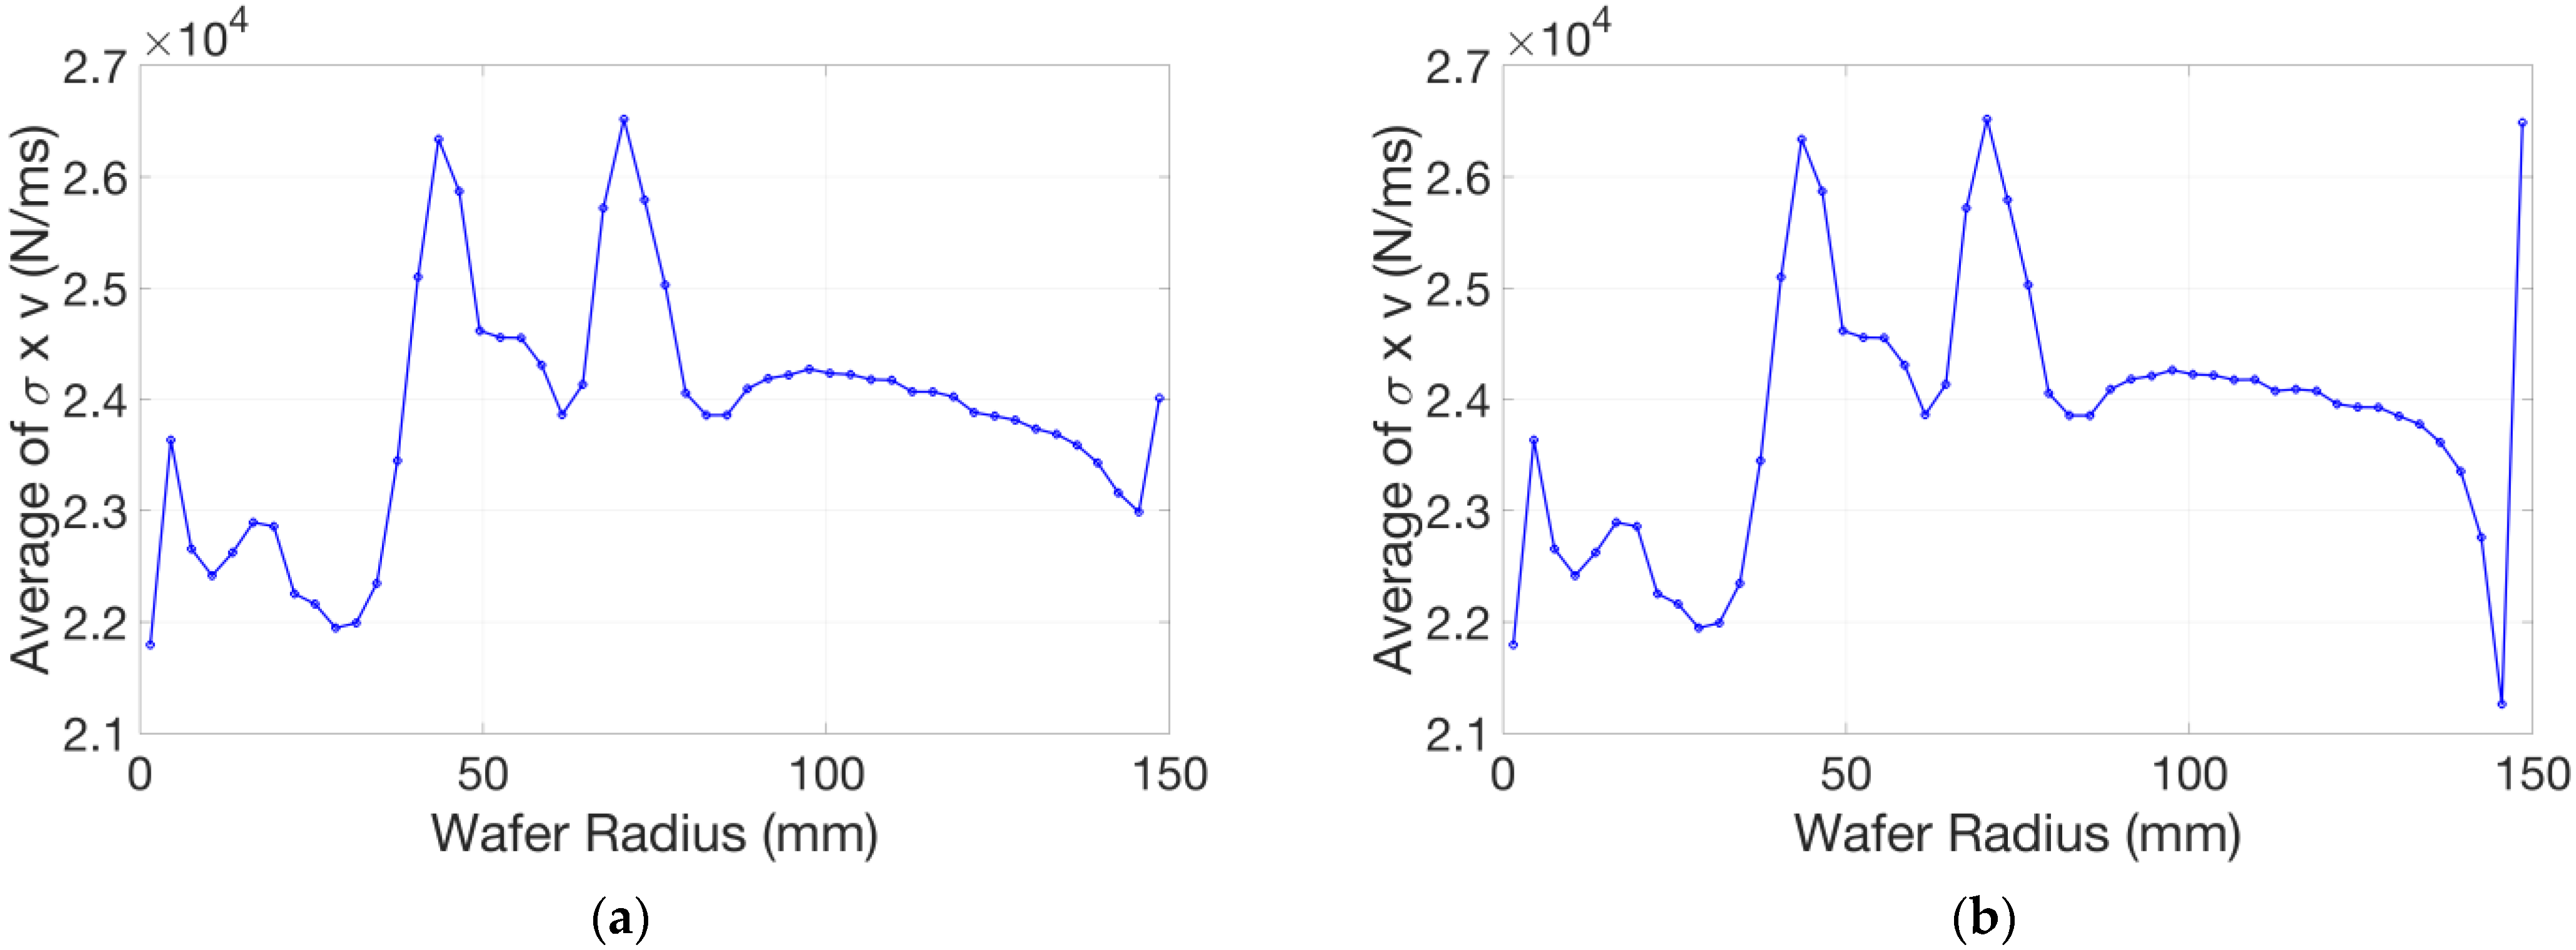
4.2. Influence of the Pad Surface Unevenness on the Polishing Effects
5. Conclusions
Author Contributions
Funding
Data Availability Statement
Conflicts of Interest
References
- Willardson, R.K.; Weber, E.R.; Li, S.M.H.; Miller, R.M. Chemical Mechanical Polishing In Silicon Processing; Academic Press: Cambridge, MA, USA, 1999. [Google Scholar]
- Baisie, E.A.; Li, Z.; Zhang, X. Pad Conditioning in Chemical Mechanical Polishing: A Conditioning Density Distribution Model to Predict Pad Surface Shape. Int. J. Manuf. Res. 2013, 8, 103–119. [Google Scholar] [CrossRef]
- Lee, S.; Jeong, S.; Park, K.; Kim, H.; Jeong, H. Kinematical Modeling of Pad Profile Variation during Conditioning in Chemical Mechanical Polishing. Jpn. J. Appl. Phys. 2009, 48, 126502. [Google Scholar] [CrossRef]
- Li, Z.C.; Baisie, E.A.; Zhang, X.H. Diamond Disc Pad Conditioning in Chemical Mechanical Planarization (CMP): A Surface Element Method to Predict Pad Surface Shape. Precis. Eng. 2012, 36, 356–363. [Google Scholar] [CrossRef]
- Chen, K.-R.; Young, H.-T. Characterization of Dressing Behaviors and Optimization Technique in Chemical Mechanical Polishing. ECS Trans. 2009, 19, 61. [Google Scholar] [CrossRef]
- Chen, K.R.; Young, H.T. Estimation of Dressing Effects in Chemical Mechanical Polishing with Sorts of Diamond Dressers. Adv. Mater. Res. 2009, 76–78, 175–180. [Google Scholar] [CrossRef]
- Kincal, S.; Basim, G.B. Impact of Pad Conditioning on Thickness Profile Control in Chemical Mechanical Planarization. J. Electron. Mater. 2013, 42, 83–96. [Google Scholar] [CrossRef]
- Preston, F.W. The Theory and Design of Plate Glass Polishing Machines. J. Soc. Glass Tech. 1927, 11, 214. [Google Scholar]
- Zhang, F.; Busnaina, A.A.; Ahmadi, G. Particle Adhesion and Removal in Chemical Mechanical Polishing and Post-CMP Cleaning. J. Electrochem. Soc. 1999, 146, 2665. [Google Scholar] [CrossRef]
- Shi, F.G.; Zhao, B. Modeling of Chemical-Mechanical Polishing with Soft Pads. Appl. Phys. A 1998, 67, 249–252. [Google Scholar] [CrossRef]
- Horng, T.-L. An Analysis of the Pad Deformation for Improved Planarization. Key Eng. Mater. 2003, 238–239, 241–246. [Google Scholar] [CrossRef]
- Baisie, E.; Lin, B.; Zhang, X.; Li, Z. Finite Element Analysis (FEA) of Pad Deformation Due to Diamond Disc Conditioning in Chemical Mechanical Polishing (CMP). ECS Trans. 2011, 34, 633. [Google Scholar] [CrossRef]
- Wang, T.; Lu, X. Numerical and Experimental Investigation on Multi-Zone Chemical Mechanical Planarization. Microelectron. Eng. 2011, 88, 3327–3332. [Google Scholar] [CrossRef]
- Chen, C.-C.A.; Pham, Q.-P.; Li, Y.-T.; Li, T.-H.; Hsueh, C.-T. Study on Quasi-Orthogonal Machining of Elastomer Pad by Single-Point Diamond Tool. Int. J. Adv. Manuf. Technol. 2018, 95, 2555–2565. [Google Scholar] [CrossRef]
- Tsai, M.Y.; Liao, Y.S. Dressing Characteristics of Oriented Single Diamond on CMP Polyurethane Pad. Mach. Sci. Technol. 2009, 13, 92–105. [Google Scholar] [CrossRef]
- Zhao, D.; He, Y.; Wang, T.; Lu, X. Effect of Kinematic Parameters and Their Coupling Relationships on Global Uniformity of Chemical-Mechanical Polishing. IEEE Trans. Semicond. Manuf. 2012, 25, 502–510. [Google Scholar] [CrossRef]
- Zhao, D.; He, Y.; Wang, T.; Lu, X.; Luo, J. Effects of the Polishing Variables on the Wafer-Pad Interfacial Fluid Pressure in Chemical Mechanical Polishing of 12-Inch Wafer. J. Electrochem. Soc. 2012, 159, H342. [Google Scholar] [CrossRef]


| Condition | Status |
|---|---|
| Pad product type | DH3002 |
| Pad total thickness | About 3.5 mm unused |
| Platen diameter | 380 mm |
| Pad diameter | 15.15 inches (385 mm) About 380 mm on the platen (effective) |
| Disk product type | OPTECH M1685 |
| Disk diameter | 108 mm 104.5 mm with diamonds on it (effective) |
| Average diamond pitch | 430 m |
| Average diamond width | 150 m |
| Average diamond protrusion | 250 m |
| Pad rotating speed | 100 RPM |
| Disk rotating speed | 73 RPM |
| Disk downforce | 4 lbf |
| Conditioner arm sweep mode | Sinusoidal mode |
| Conditioner arm sweep speed | 19 RPM |
| Conditioner arm sweep range | Radial 83~308 mm |
| Conditioning total time | 8 h |
| Slurry | DI-water |
| Partition No. | 1 | 2 | 3 | 4 | 5 | 6 | 7 | 8 | 9 | 10 | 11 | 12 | 13 |
|---|---|---|---|---|---|---|---|---|---|---|---|---|---|
| Sinusoidal (%) | 17.89 | 7.77 | 6.24 | 5.53 | 5.15 | 4.96 | 4.9 | 4.96 | 5.15 | 5.53 | 6.24 | 7.77 | 17.89 |
| Adjusted (%) | 8.47 | 7.24 | 7.29 | 7.33 | 7.37 | 7.42 | 7.46 | 7.5 | 7.55 | 7.59 | 7.63 | 7.72 | 9.42 |
| Parameter | Status |
|---|---|
| Pad taken region | Concentric with wafer, diameter: 370 mm |
| Elastic modulus of sub pad | 3.9 MPa |
| Poisson’s ratio of sub pad | 0.4 |
| Wafer diameter | 300 mm |
| Wafer thickness | 775 m |
| Elastic modulus of wafer | 193 GPa |
| Poisson’s ratio of wafer | 0.3 |
| Retaining ring material | Polyphenylene Sulfide (PPS) |
| Retaining ring (RR) width | Diameter 301~348 mm |
| Retaining ring thickness | 2.54 mm |
| Elastic modulus of retaining ring | 210 GPa |
| Poisson’s ratio of retaining ring | 0.3 |
| Downforce P1 | 4.3 psi |
| Downforce P2 | 3.5 psi |
| Grid size | 1 mm |
| Amount of grid | With RR: approximately 1.2 million Without RR: approximately 0.95 million |
Disclaimer/Publisher’s Note: The statements, opinions and data contained in all publications are solely those of the individual author(s) and contributor(s) and not of MDPI and/or the editor(s). MDPI and/or the editor(s) disclaim responsibility for any injury to people or property resulting from any ideas, methods, instructions or products referred to in the content. |
© 2023 by the authors. Licensee MDPI, Basel, Switzerland. This article is an open access article distributed under the terms and conditions of the Creative Commons Attribution (CC BY) license (https://creativecommons.org/licenses/by/4.0/).
Share and Cite
Zheng, P.; Zhao, D.; Lu, X. Prediction of Pad Wear Profile and Simulation of Its Influence on Wafer Polishing. Micromachines 2023, 14, 1683. https://doi.org/10.3390/mi14091683
Zheng P, Zhao D, Lu X. Prediction of Pad Wear Profile and Simulation of Its Influence on Wafer Polishing. Micromachines. 2023; 14(9):1683. https://doi.org/10.3390/mi14091683
Chicago/Turabian StyleZheng, Pengjie, Dewen Zhao, and Xinchun Lu. 2023. "Prediction of Pad Wear Profile and Simulation of Its Influence on Wafer Polishing" Micromachines 14, no. 9: 1683. https://doi.org/10.3390/mi14091683
APA StyleZheng, P., Zhao, D., & Lu, X. (2023). Prediction of Pad Wear Profile and Simulation of Its Influence on Wafer Polishing. Micromachines, 14(9), 1683. https://doi.org/10.3390/mi14091683