1. Introduction
Quartz-enhanced photoacoustic spectroscopy (QEPAS) is a well-known technique used for the detection of specific trace gases in complex mixtures [
1,
2,
3,
4,
5,
6,
7]. The high performances in terms of selectivity and sensitivity allow for the exploitation of this technique in a wide range of applications, such as environmental monitoring [
8,
9,
10], chemical analysis [
11,
12], and advanced biomedical diagnostics [
13,
14]. In QEPAS, acoustic waves are generated between the prongs of a quartz tuning fork (QTF) by the absorption of modulated light from the gas molecules, via non-radiative relaxation processes [
2,
15]. QTFs are employed as piezoelectric sensitive elements to transduce pressure waves in an electric signal [
2,
6]. This technique was firstly introduced in 2002 and exploited standard QTFs resonating at 32 kHz [
16]. These quartz resonators are characterized by a good immunity to environmental acoustic noise because of their high quality factors (Q) and compact dimensions. Due to the sharp resonance, external noise sources outside of the resonator’s small bandwidth (~4 Hz at atmospheric pressure) do not influence the QTF signal [
17].
Suitable front-end electronics must be designed to read-out the signal generated by the QTF. The common read-out architecture employed in QEPAS sensors is the transimpedance amplifier (TIA) [
8,
9,
10,
11,
12,
13,
14], schematically depicted in
Figure 1.
In this configuration, the current generated by the QTF (Iqtf) due to the charge displacement caused by piezoelectric effect when pressure waves put prongs in vibration is forced to flow entirely in the feedback resistor RF. Due to the virtual ground established on the inverting node of the operational amplifier (OPAMP), the measurement is insensitive to the stray capacitance Cst and, in turn, the output voltage (Vout) is proportional to Iqtf.
Recently, it has been demonstrated that a voltage-mode approach for the read-out electronics of QTFs can be advantageous in terms of signal-to-noise ratio (SNR) [
18,
19,
20,
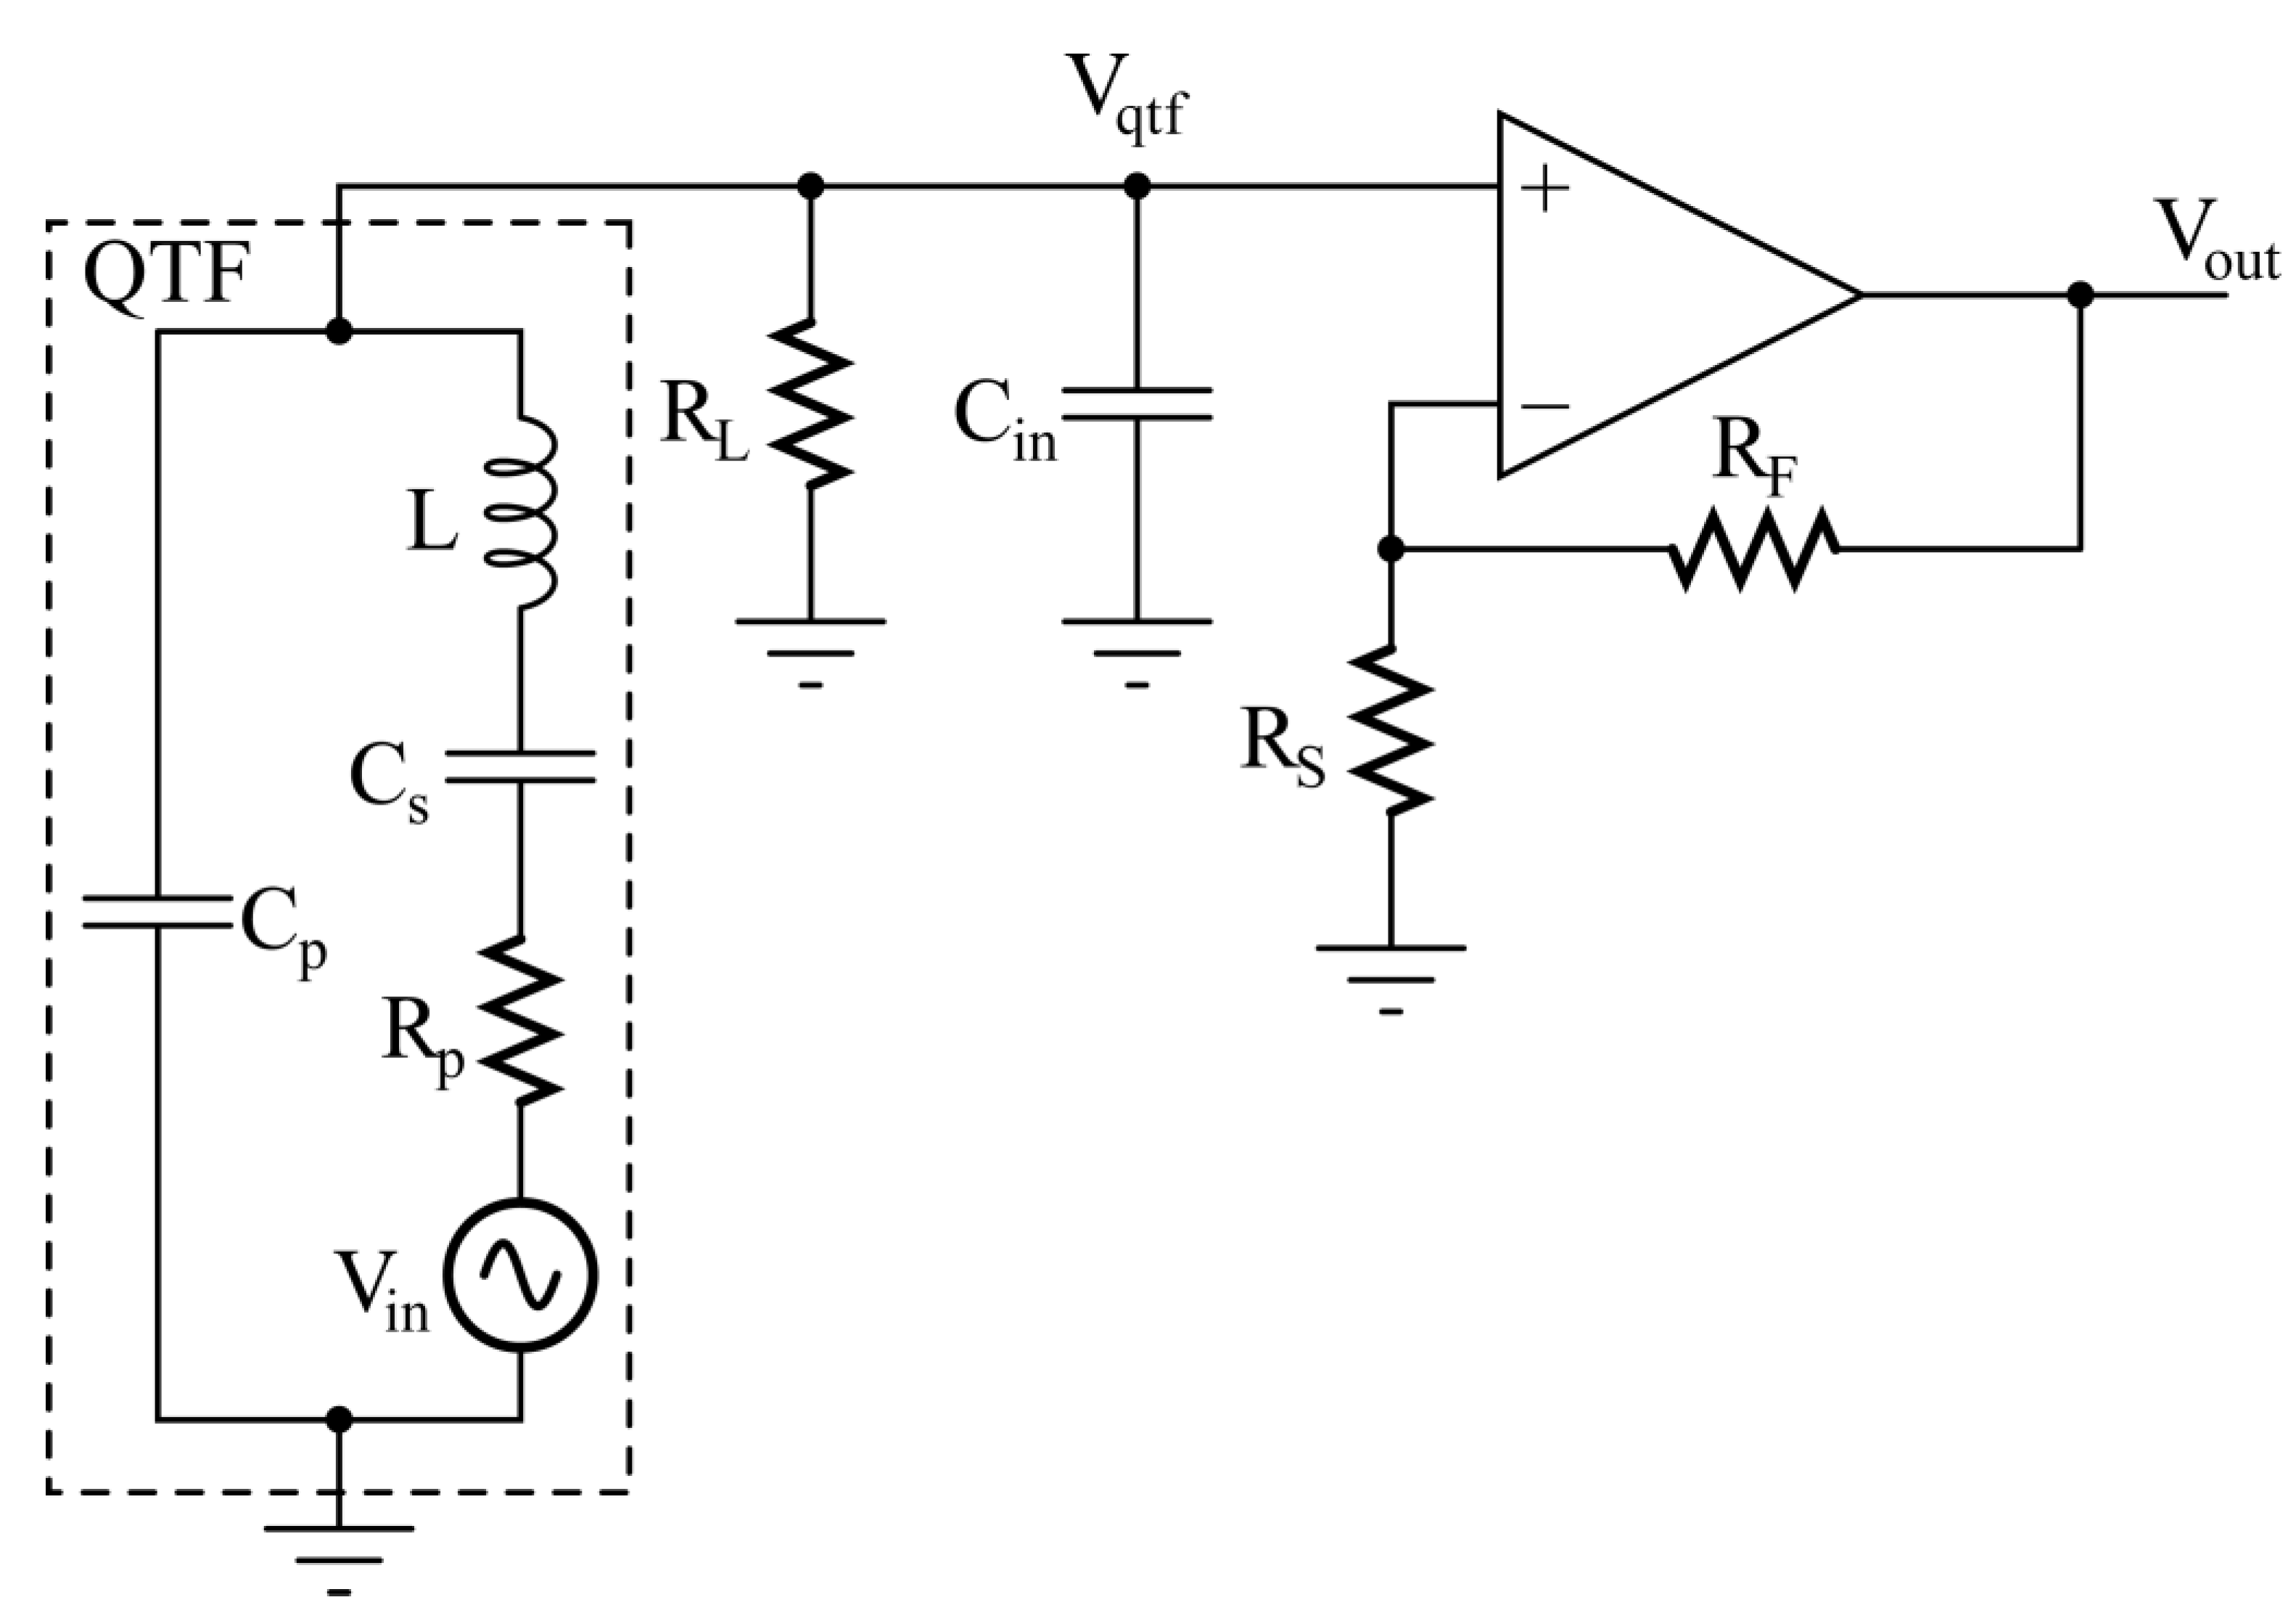
21]. In this case, the piezoelectric transducer is coupled to a voltage amplifier, realized by means of a classic OPAMP in a non-inverting configuration, as illustrated in
Figure 2, and characterized by very high input impedance. Since the QTF is an open circuit at DC, a load resistor R
L must necessarily be connected to the non-inverting input of the amplifier to establish its DC voltage to ground, when the input bias current of the OPAMP can be neglected.
The thermal noise of the resistor RL contributes to the overall noise spectral density of the circuit output. Furthermore, the QTF experiences the loading effect due to RL; then, the input voltage Vqtf of the amplifier results from the product of the current generated by the QTF under this load and the value of RL itself. As a consequence, RL has a direct impact on both the level of the useful signal Vout and the noise at the output of the preamplifier.
QEPAS requires synchronous detection techniques based on lock-in amplifiers (LIAs) to efficiently extract the useful signal component from the noise floor [
2,
22,
23,
24,
25,
26]. In LIAs, the amplifier signal is first multiplied with both a sinewave and a 90° phase-shifted copy of that sinewave at a selected operating frequency (f
op); then, a low-pass filter (LPF) is used to retrieve the signal component at f
op or its multiples [
22,
26]. The phase noise in high-Q mechanical oscillators, such as QTFs, could be detrimental when LIAs are employed, since the amplitude of the output signal, and, in turn, the SNR, will be affected [
27].
Both QTF signal and noise sources undergo the signal conditioning chain composed of the front-end voltage amplifier, the multiplication with a sine wave at frequency fop, and the low-pass filter. Therefore, a study on the SNR as a function of (i) the parameters of the amplifier components, (ii) the operating frequency, and (iii) the low-pass filter bandwidth must be carefully conducted to fully exploit the resonance properties of the QTF and maximize the performances of a QEPAS sensor.
In this work, we reported the effect of the R
L value on the frequency where the SNR exhibits its peak at the output of the lock-in amplifier, i.e., the optimum operating frequency for the QEPAS system. Starting from the well-known Butterworth–Van Dyke model for the QTF [
17,
28,
29,
30], we derived an analytical expression for the amplitude of the signal generated by the QTF as a function of frequency at different R
L values. For our purposes, only the main electronic noise contributions were considered, whereas phase noise was not taken into account. Furthermore, a mathematical modelling was developed with MATLAB for all the relevant contributions to the total noise spectral density at the output of the preamplifier, making possible a comparison among their relative weights. Finally, the behavior of the SNR as a function of the lock-in demodulation frequency was studied at different R
L values and LPF bandwidths, namely, the acquisition time. All the proposed analytical expressions were validated by comparing the developed MATLAB model with SPICE simulations, carried out considering a realistic model for the OPAMP used in the preamplifier. As a result of the study, general guidelines for the choice of the resistor R
L and the most suitable operating frequency for the QEPAS system implementing the voltage-mode read-out of QTFs can be derived. Furthermore, the proposed analysis allows for the study of the noise contributions at different bandwidths to optimize the acquisition time of QEPAS measurements.
2. Signal Response of a Quartz Tuning Fork Read Out in Voltage Mode
As mentioned above, the Butterworth–Van Dyke circuit and an equivalent Thevenin source were employed to model the QTF when excited by an acoustic wave [
17] to find an analytical expression of the output signal V
out as a function of frequency for the circuit in
Figure 2. For this investigation, we considered (i) an OPAMP with sufficiently high gain-bandwidth product so that the gain of the non-inverting configuration is A
v = V
out/V
qtf = 1 + R
F/R
S, as shown in
Figure 2; and (ii) the capacitance C
in between the non-inverting input and ground. Thus, the circuit to be studied is sketched in
Figure 3.
Here, the parasitic shunt capacitance C
p between the terminals of the QTF is in parallel with the input capacitance of the voltage amplifier C
in, so that the total parasitic capacitance which loads the QTF is C
pt = C
p + C
in. The voltage source V
in represents the internal electric signal generated by the piezoelectric effect, when the QTF is excited by an acoustic wave. Straightforward calculations provide the expression of the transfer function H
v(jω) between the internal voltage V
in(jω) and the output voltage V
out(jω):
The squared modulus of this transfer function, which describes how the squared amplitude of the circuit response depends on the frequency, can be written as follows:
where
is the angular frequency in which the transfer function H
v(jω) exhibits a real value and
is the parallel-resonant angular frequency of the QTF as loaded in the circuit shown in
Figure 3.
AC SPICE simulations have been carried out to confirm the validity of the expression in Equation (2). The set of typical parameters listed in
Table 1 has been used for the QTF in both the analytical model and SPICE simulations. Moreover, in SPICE simulations, C
in is included in the model of the AD8067, provided by Analog Devices. AD8067 is a low-noise, high speed, FET input operational amplifier. Thanks to its very low input bias current, it is suitable for precision and high gain applications [
31].
The series-resonant frequency
of the QTF is:
whereas its quality factor
is
which are typical values for a standard QTF used in QEPAS sensors [
2,
16,
17,
26]. Moreover, the gain of the non-inverting configuration is A
v = 48 and the parallel-resonant frequency of the QTF is f
P = ω
P/2π = 32,781 Hz. The value of C
P ≅ C
P + C
S could be found by measuring the equivalent capacitance of the QTF at low frequencies using the capacitance-voltage profiling technique. The ratio C
S/C
P is extracted by the ratio f
P/f
S after measuring the parallel and series-resonant frequencies of the QTF, where the sensor exhibits the minimum and maximum admittance, respectively. Last, L can be found from f
S, knowing C
S, and R
P is extracted from the quality factor Q of the QTF [
21].
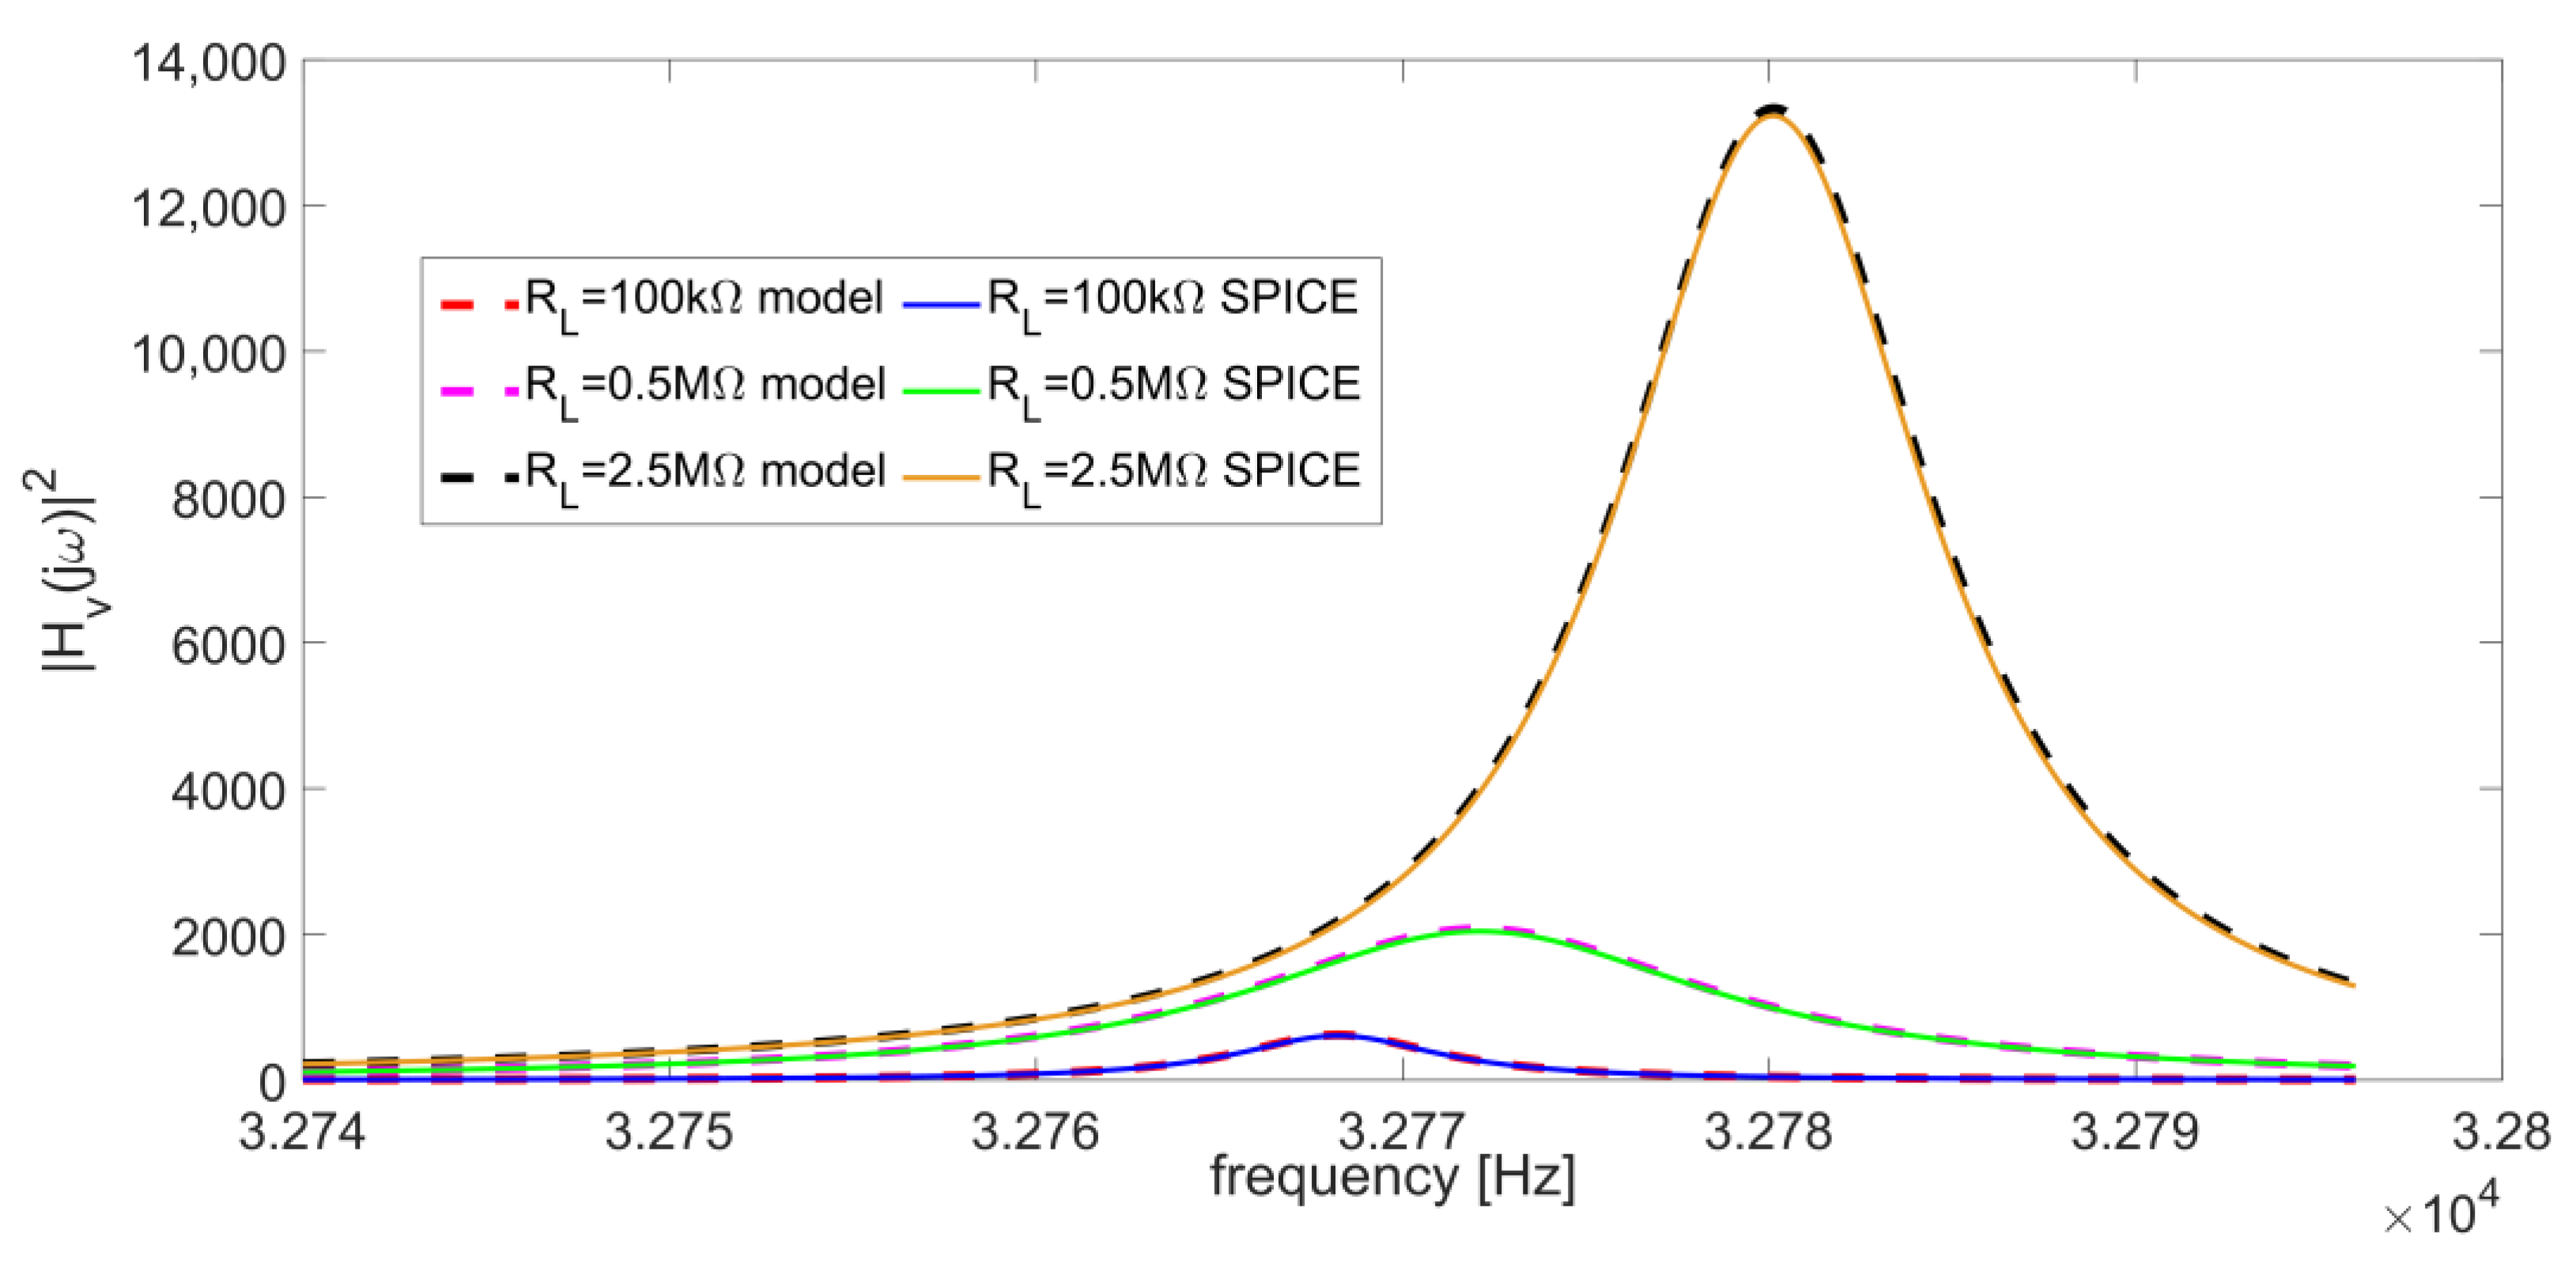
Figure 4 shows the comparison between the results provided by the SPICE simulations and the analytical model for three different values of R
L (100 kΩ, 0.5 MΩ, and 2.5 MΩ).
The perfect matching between two modellings demonstrates that Equation (2) can be used to accurately represent the behavior of the circuit in
Figure 3. The maximum difference between the peak frequencies of corresponding curves is in the order of a few hundredths of Hz and the mean absolute percentage error between corresponding curves is about 1.8%.
2.1. Peak Frequency of the QTF Signal Response as a Function of RL
As shown in
Figure 4, the output signal amplitude and the peak frequency f
peak strongly depend on the value of the resistor R
L. This is particularly relevant for an optimal choice of the operating frequency in the QEPAS technique, aimed at exploiting as much as possible the resonance properties of the QTF.
Figure 5 shows the f
peak trend as a function of R
L. This curve was retrieved computing |H
v(jω)|
2 for different values of R
L and then applying MATLAB “max” function to yield f
peak values.
For RL values lower than 100 kΩ, fpeak tends to the series-resonant frequency fS = 32768 Hz; whereas, for values of RL higher than 2 MΩ, fpeak tends to assume the values of the parallel-resonant frequency fP, in our case equal to 32781 Hz.
The behavior of the peak position as a function of the value of R
L can be explained considering the two terms which compose the denominator of the function |H
v(jω)|
2 in Equation (2), reported here, below, for ease of reading, as Den1 and Den2:
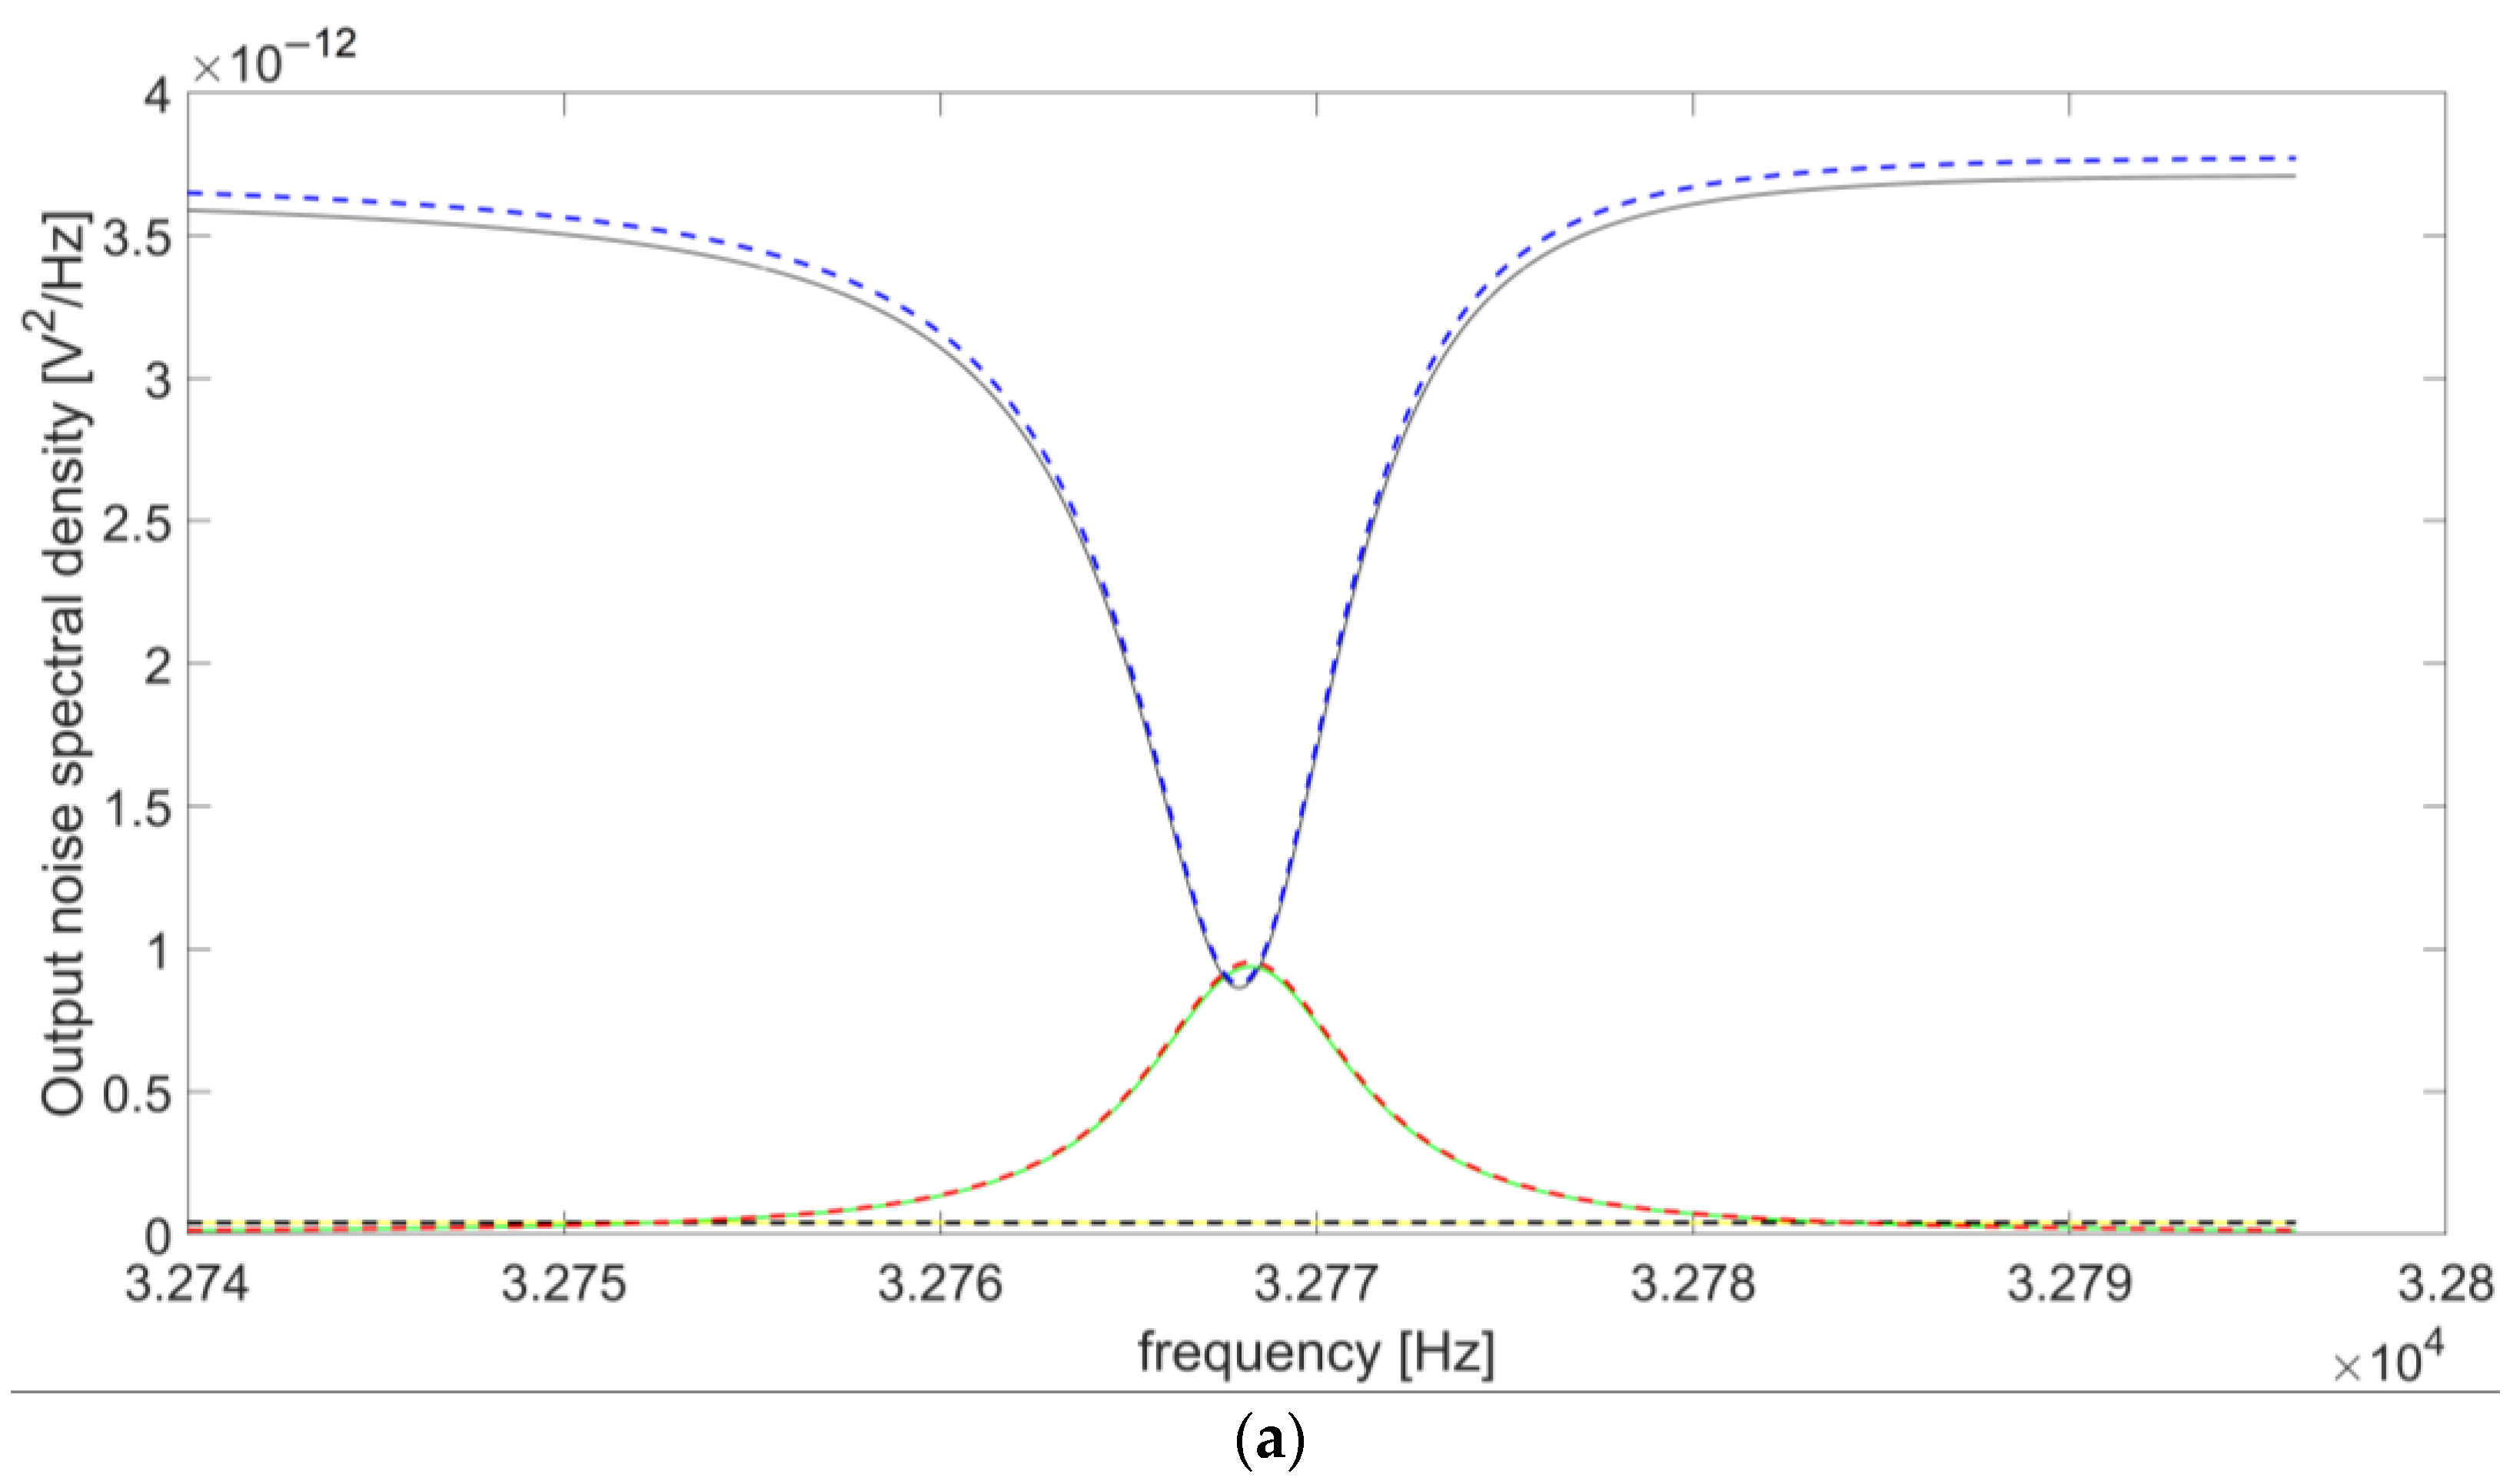
The behavior of Den1 and Den2 as a function of frequency is reported in
Figure 6a,b for R
L = 100 kΩ and R
L = 10 MΩ, respectively.
Results show that Den1(ω) is strongly dependent on the value of R
L. In the investigated frequency range: (i) the maximum value of Den1 varies from 868.3 in
Figure 6a to 0.17 in
Figure 6b; (ii) the blue curve at 100 kΩ varies more rapidly than the Den1 curve at 10 MΩ in the frequency range close to the minimum; and (iii) the frequency where the Den1 minimum occurs decreases by more than 20 Hz, from 32,768 Hz in
Figure 6a to 32,746 Hz in
Figure 6b. Conversely, the dependence of Den2(ω) on R
L is only due to the term
, which is negligible when R
L ≥ 1 MΩ, since C
s << C
pt and R
P << R
L. Indeed: (i) the red curve maximum value varies from 30.8 in
Figure 6a to 21.5 in
Figure 6b; (ii) Den2 value variations in the frequency range close to the minimum value are slightly different at 100 kΩ and at 10 MΩ; and (iii) the difference frequency where the Den2 minimum occurs is about 13 Hz, from 32,794 Hz in
Figure 6a to 32,781 Hz in
Figure 6b. As a result, for R
L < 100 kΩ, the contribution of Den1(ω) becomes dominant, so that when R
L decreases, the minimum value of the denominator of |H
v(jω)|
2 tends to the zero of Den1(ω) function, located at ω = ω
R. Moreover, in this range of R
L values, ω
R could be approximated to ω
S:
and the peak of |H
v(jω)|
2 tends to the series-resonant frequency of the QTF. Instead, for R
L > 2 MΩ, Den1(ω) becomes less relevant and Den2(ω) tends to be dominant in the sum of the two terms. As a consequence, the minimum of the sum tends to the zero of Den2(ω). Finally, in this range of R
L, this zero is very close to ω = ω
P, thus, the peak of |H
v(jω)|
2 is almost coincident with the parallel-resonant frequency of the QTF.
2.2. Peak of the QTF Signal Response as a Function of RL
The trend of the peak value of |H
v(jω)|
2 as a function of R
L value is shown in
Figure 7. The same method applied for
Figure 5 was used to obtain this curve.
The peak value of |H
v(jω)|
2 is an increasing function of R
L up to a saturation value at R
L > 1 GΩ. As discussed in the previous section, for large values of R
L, ω
peak = 2πf
peak is very close to the parallel-resonant angular frequency ω
p and the peak of |H
v(jω)|
2 tends to the following value:
The denominator of Equation (4) can be rewritten as:
Since C
Equation ≅ C
s and R
L is very large, it results
which is independent on R
L.
However, the performance of the QEPAS technique will depend on the SNR obtained at the output of the preamplifier, not only on the amplitude of the signal. Therefore, it is mandatory to carry out a detailed study of the electronic noise contributions that are involved in the circuit, with the purpose of finding out the optimal operating frequency maximizing the SNR.
3. Contributions to the Output Noise Spectral Density
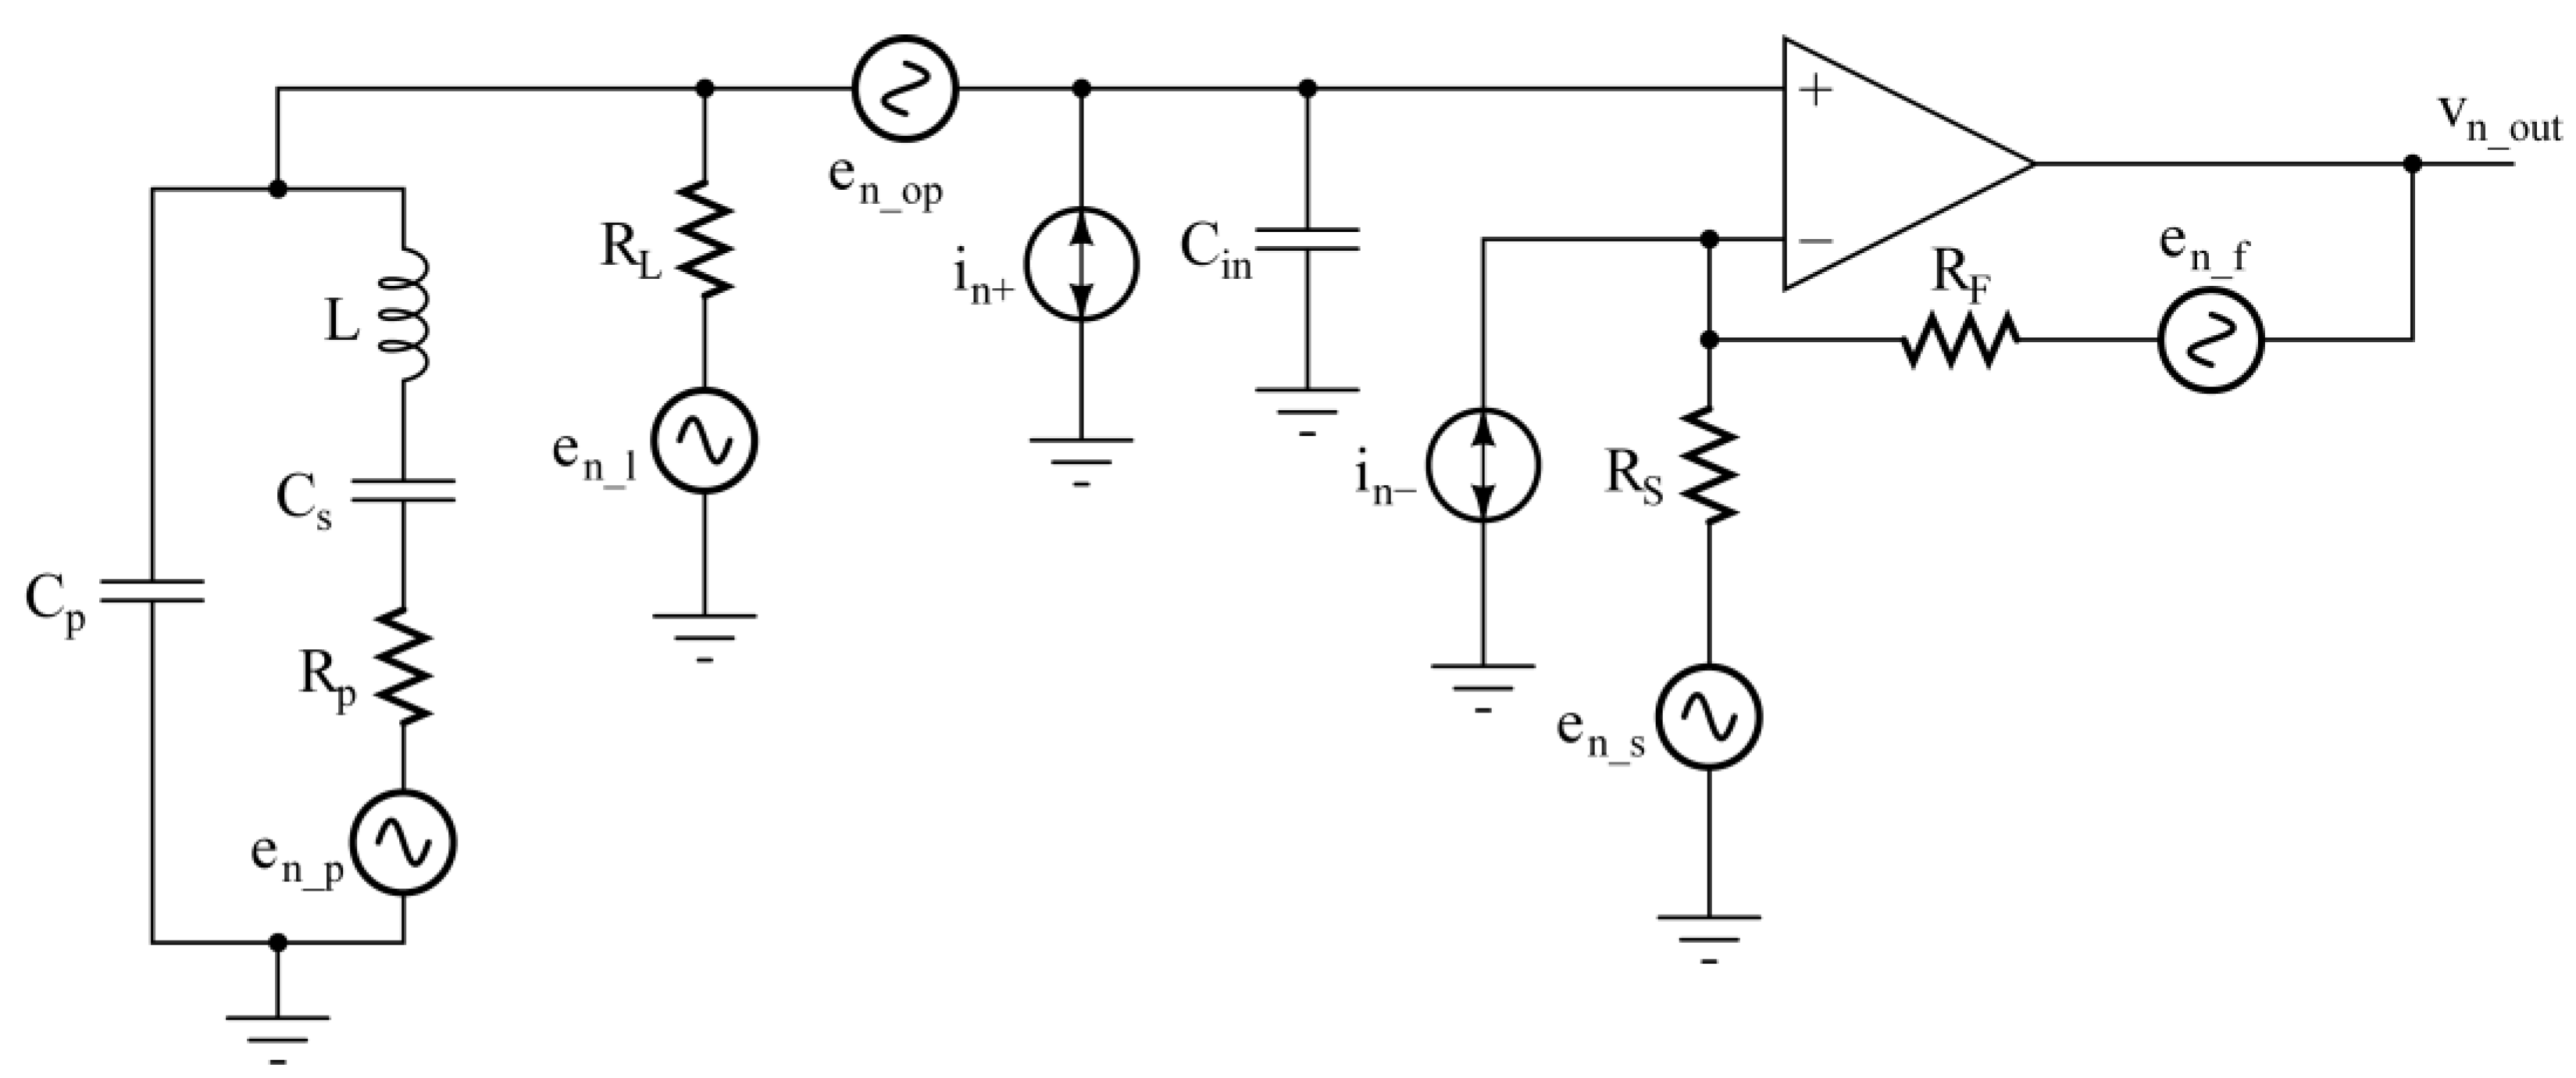
The most relevant contributions to the total electronic noise at the output of the voltage-mode preamplifier are shown in
Figure 8.
In our calculation, the phase noise was neglected [
27] and only the main electronic noise contributions were considered. Each resistor R
i of the circuit has been associated to its thermal noise voltage source, e
n_i2 = 4kTR
i. The OPAMP noise has been characterized by means of the classic equivalent input noise voltage (e
n_op) and current (i
n+ and i
n−) sources. To simplify the study without losing accuracy, it is possible to neglect the noise contributions of R
F and R
S, composing the feedback network, due to the small values of these resistors. For the same reasons, the equivalent noise current i
n− associated to the inverting input of the OPAMP likewise does not give any relevant contribution. Moreover, all the sources in
Figure 8 can be considered independent, so that the total output noise power spectral density S
ntot(ω) can be evaluated as follows:
where the terms of the right-hand side come from R
p, R
L, e
n_op, and i
n+, respectively. In Equation (5), the single terms are the product of the spectral density of each noise source multiplied by the squared modulus of the transfer function between the noise source and the output of the circuit, determined using the superposition principle [
32].
Concerning the noise associated to the resistor R
p, the transfer function
between the source e
n_p and the output of the preamplifier is H
v(jω), thus:
As a consequence, the behavior of S
np(ω) as a function of both the frequency and R
L is the same discussed in
Section 2.
Let us now consider the noise contribution from the resistor R
L. The transfer function between the source e
n_l and the output of the front-end is:
The denominators of H
v(jω) and H
L(jω) are the same and the two transfer functions differ only in their numerator. The contribution of the thermal noise of the resistor R
L to the total output noise spectral density is:
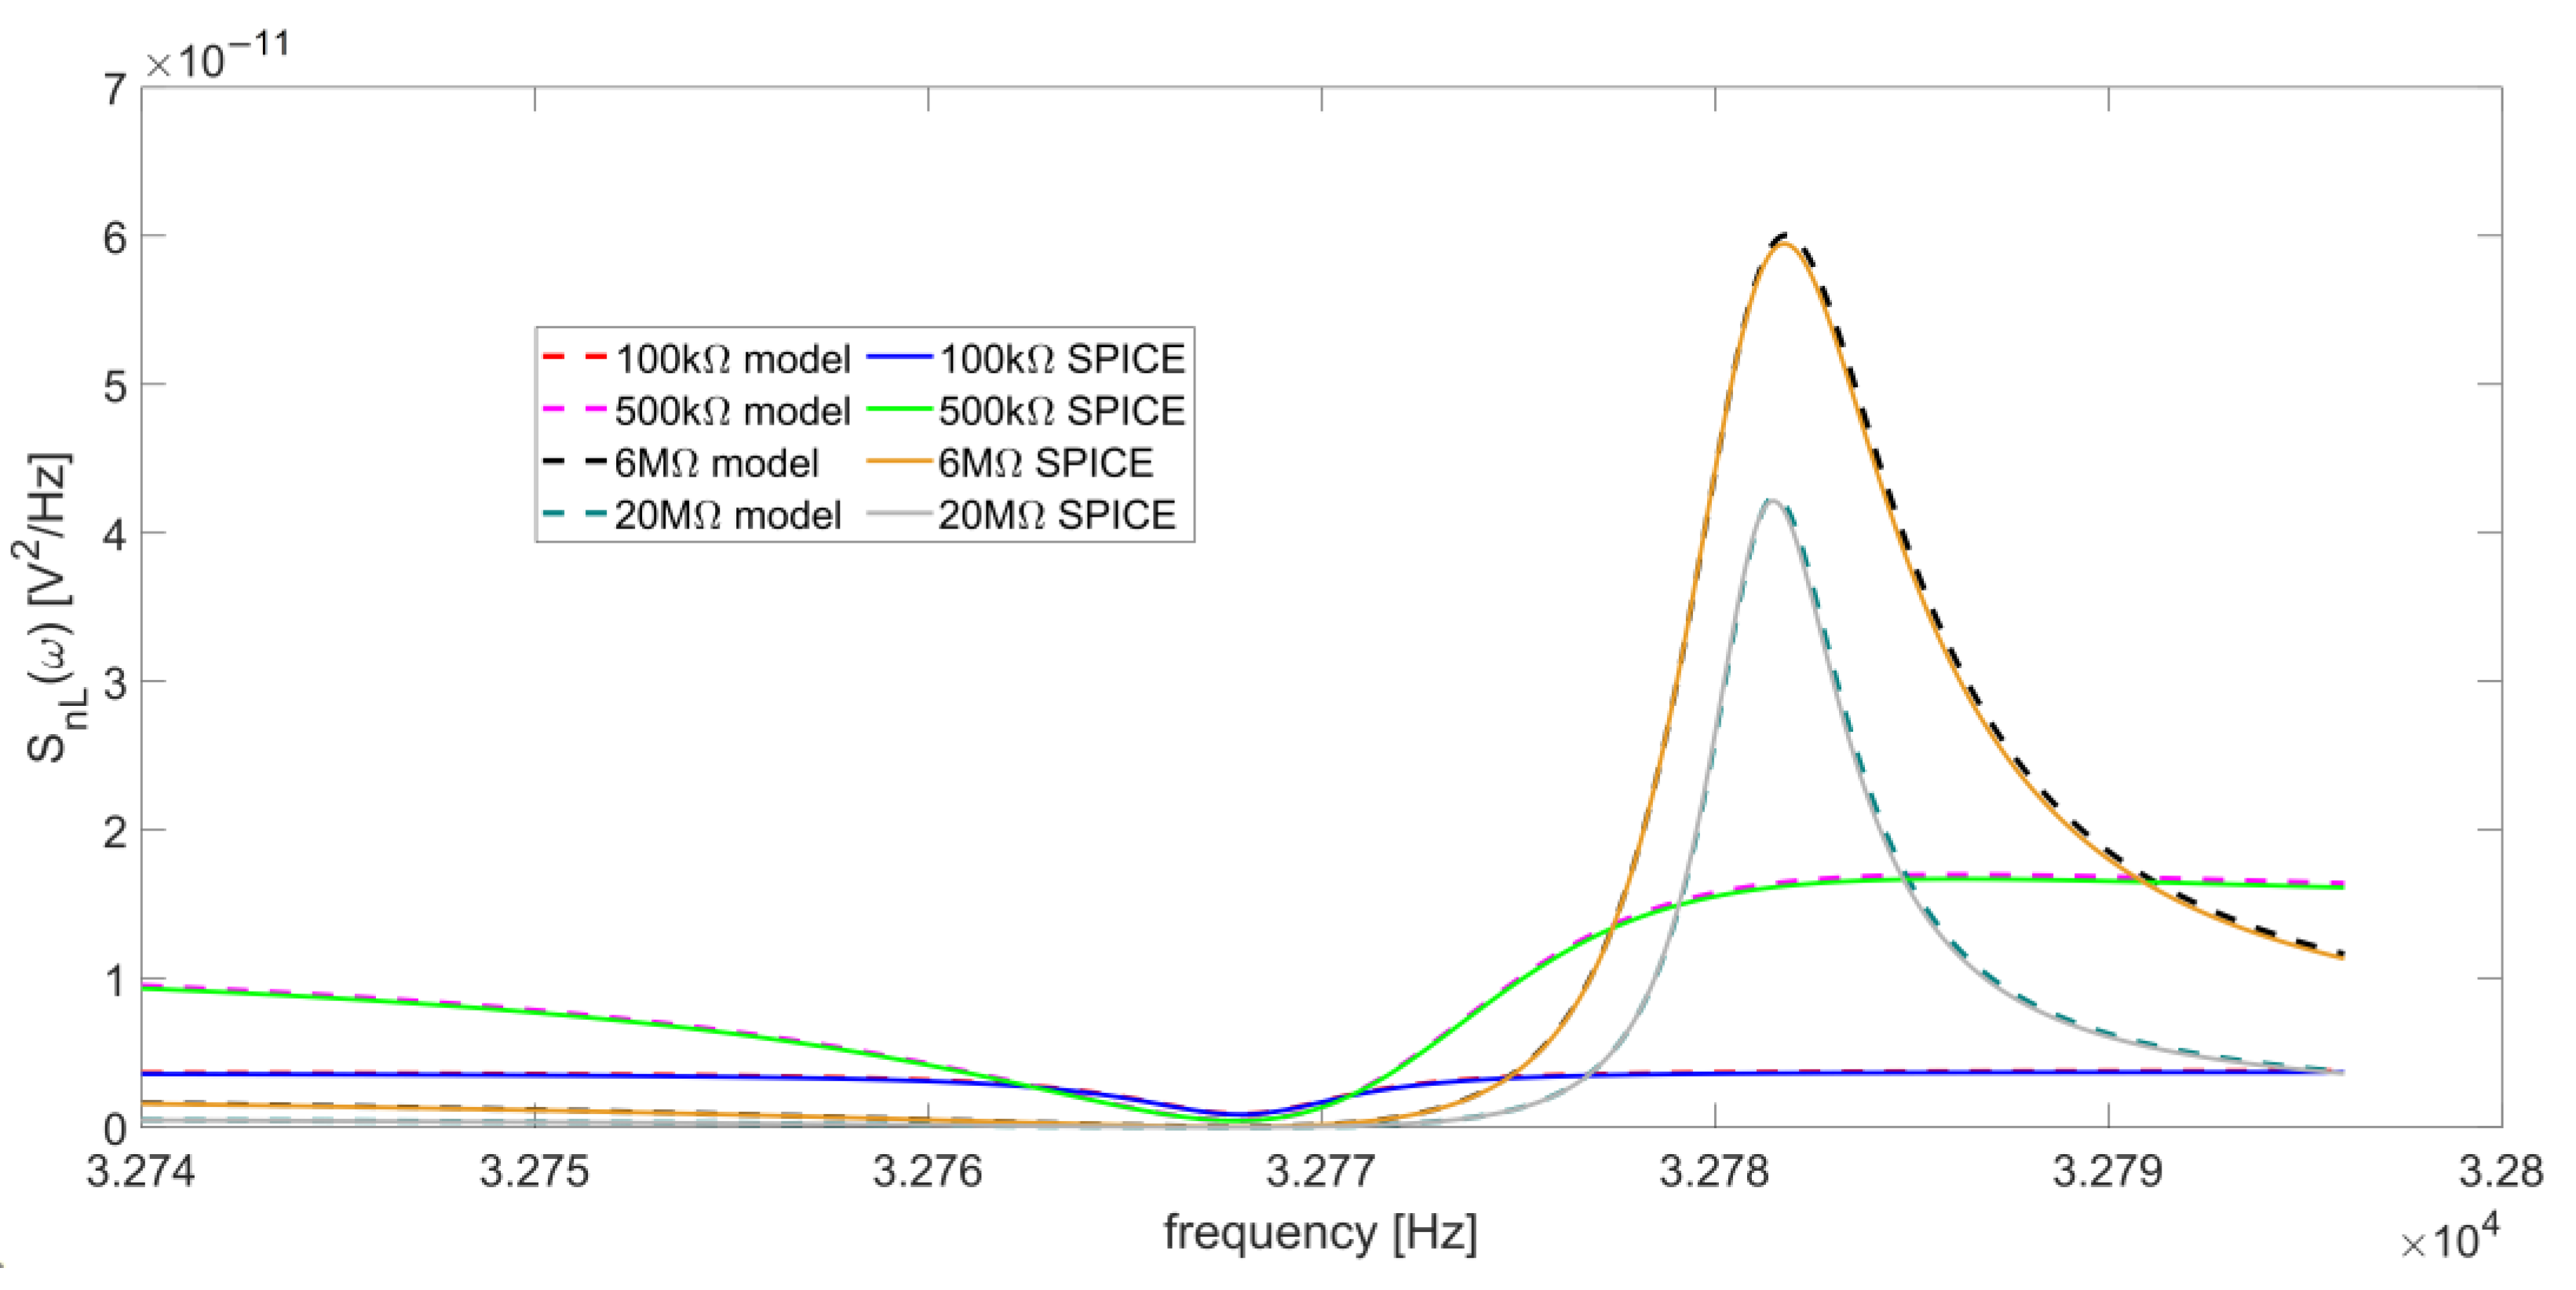
Figure 9 shows the behavior of S
nL as a function of the frequency, for four different values of R
L (100 kΩ, 500 kΩ, 6 MΩ, and 20 MΩ).
The curves calculated with Equation (7) and those obtained by SPICE simulation are in excellent agreement. The function |H
L(jω)| has a minimum located at ω = ω
S, since, at the series-resonant frequency, the Butterworth–Van Dyke impedance model of the QTF is reduced to R
p, which is its minimum value. Accordingly, also S
nL(ω) exhibits a minimum at the same frequency. Furthermore, a peak appears around the parallel-resonant frequency for increasing values of R
L.
Figure 10 reports the behavior of the peak value of S
nL(ω) as a function of R
L, which varies from 500 kΩ to 20 MΩ.
Using the set of parameters listed in
Table 1, starting from low values of R
L, this peak appears when R
L ≅ 500 kΩ (dashed magenta and green curves in
Figure 9), then increases up to R
L ≅ 6 MΩ (
Figure 10). Beyond this value, the peak decreases for increasing values of R
L and the function S
nL(ω) assumes lower values in the frequency range under investigation.
Figure 7 and
Figure 10 suggest that, at least for what concerns the noise contributions considered up to now, it is convenient to work with large values of the resistor R
L because the amplitude of the output signal increases with R
L (see
Figure 7) and the noise contribution due to this resistor decreases (see
Figure 10), whereas the contribution from the thermal noise of R
p has exactly the same frequency behavior of the signal.
Let us now consider the contribution of the input equivalent voltage noise of the OPAMP to the total output noise:
Since the flicker noise has been considered negligible in the narrow bandwidth of interest, namely, around the QTF resonance frequency, the input equivalent noise voltage has a constant power spectral density, i.e., it can be considered as white noise. The value of e
n_op has been set at 6.6 nV/√Hz, as reported in the data sheet of the AD8067 [
31]. The transfer function H
en(jω) is the following:
in which the numerator differs from the denominator only for the capacitance C
pt = C
p + C
in replaced by C
p. This contribution can be considered as constant in the frequency range investigated for QEPAS applications.
The contribution of the input equivalent current noise i
n+ to the overall output noise spectral density S
ntot(ω) is
Using Equations (10) and (7), the contributions to S
ntot(ω), respectively due to i
n+ and R
L, can be compared:
The contribution of S
in+(ω) can be neglected with respect to S
nL(ω) if
If we consider a large R
L value, i.e., 100 MΩ, S
in+(ω) will be negligible at room temperature if i
n+ << 13 fA/√Hz. Since the AD8067 has FET inputs, i
n+(ω) cannot be considered white, but is a linear function of the frequency, in the range where the flicker noise can be neglected [
33]. In our model, the value of i
n+(ω) at 10 kHz has been set to 1 fA/√Hz, a slightly higher value than the one reported in the datasheet of the OPAMP, which is 0.6 fA/√Hz [
31], and the slope of the linear function has been set to +20 dB/dec [
33].
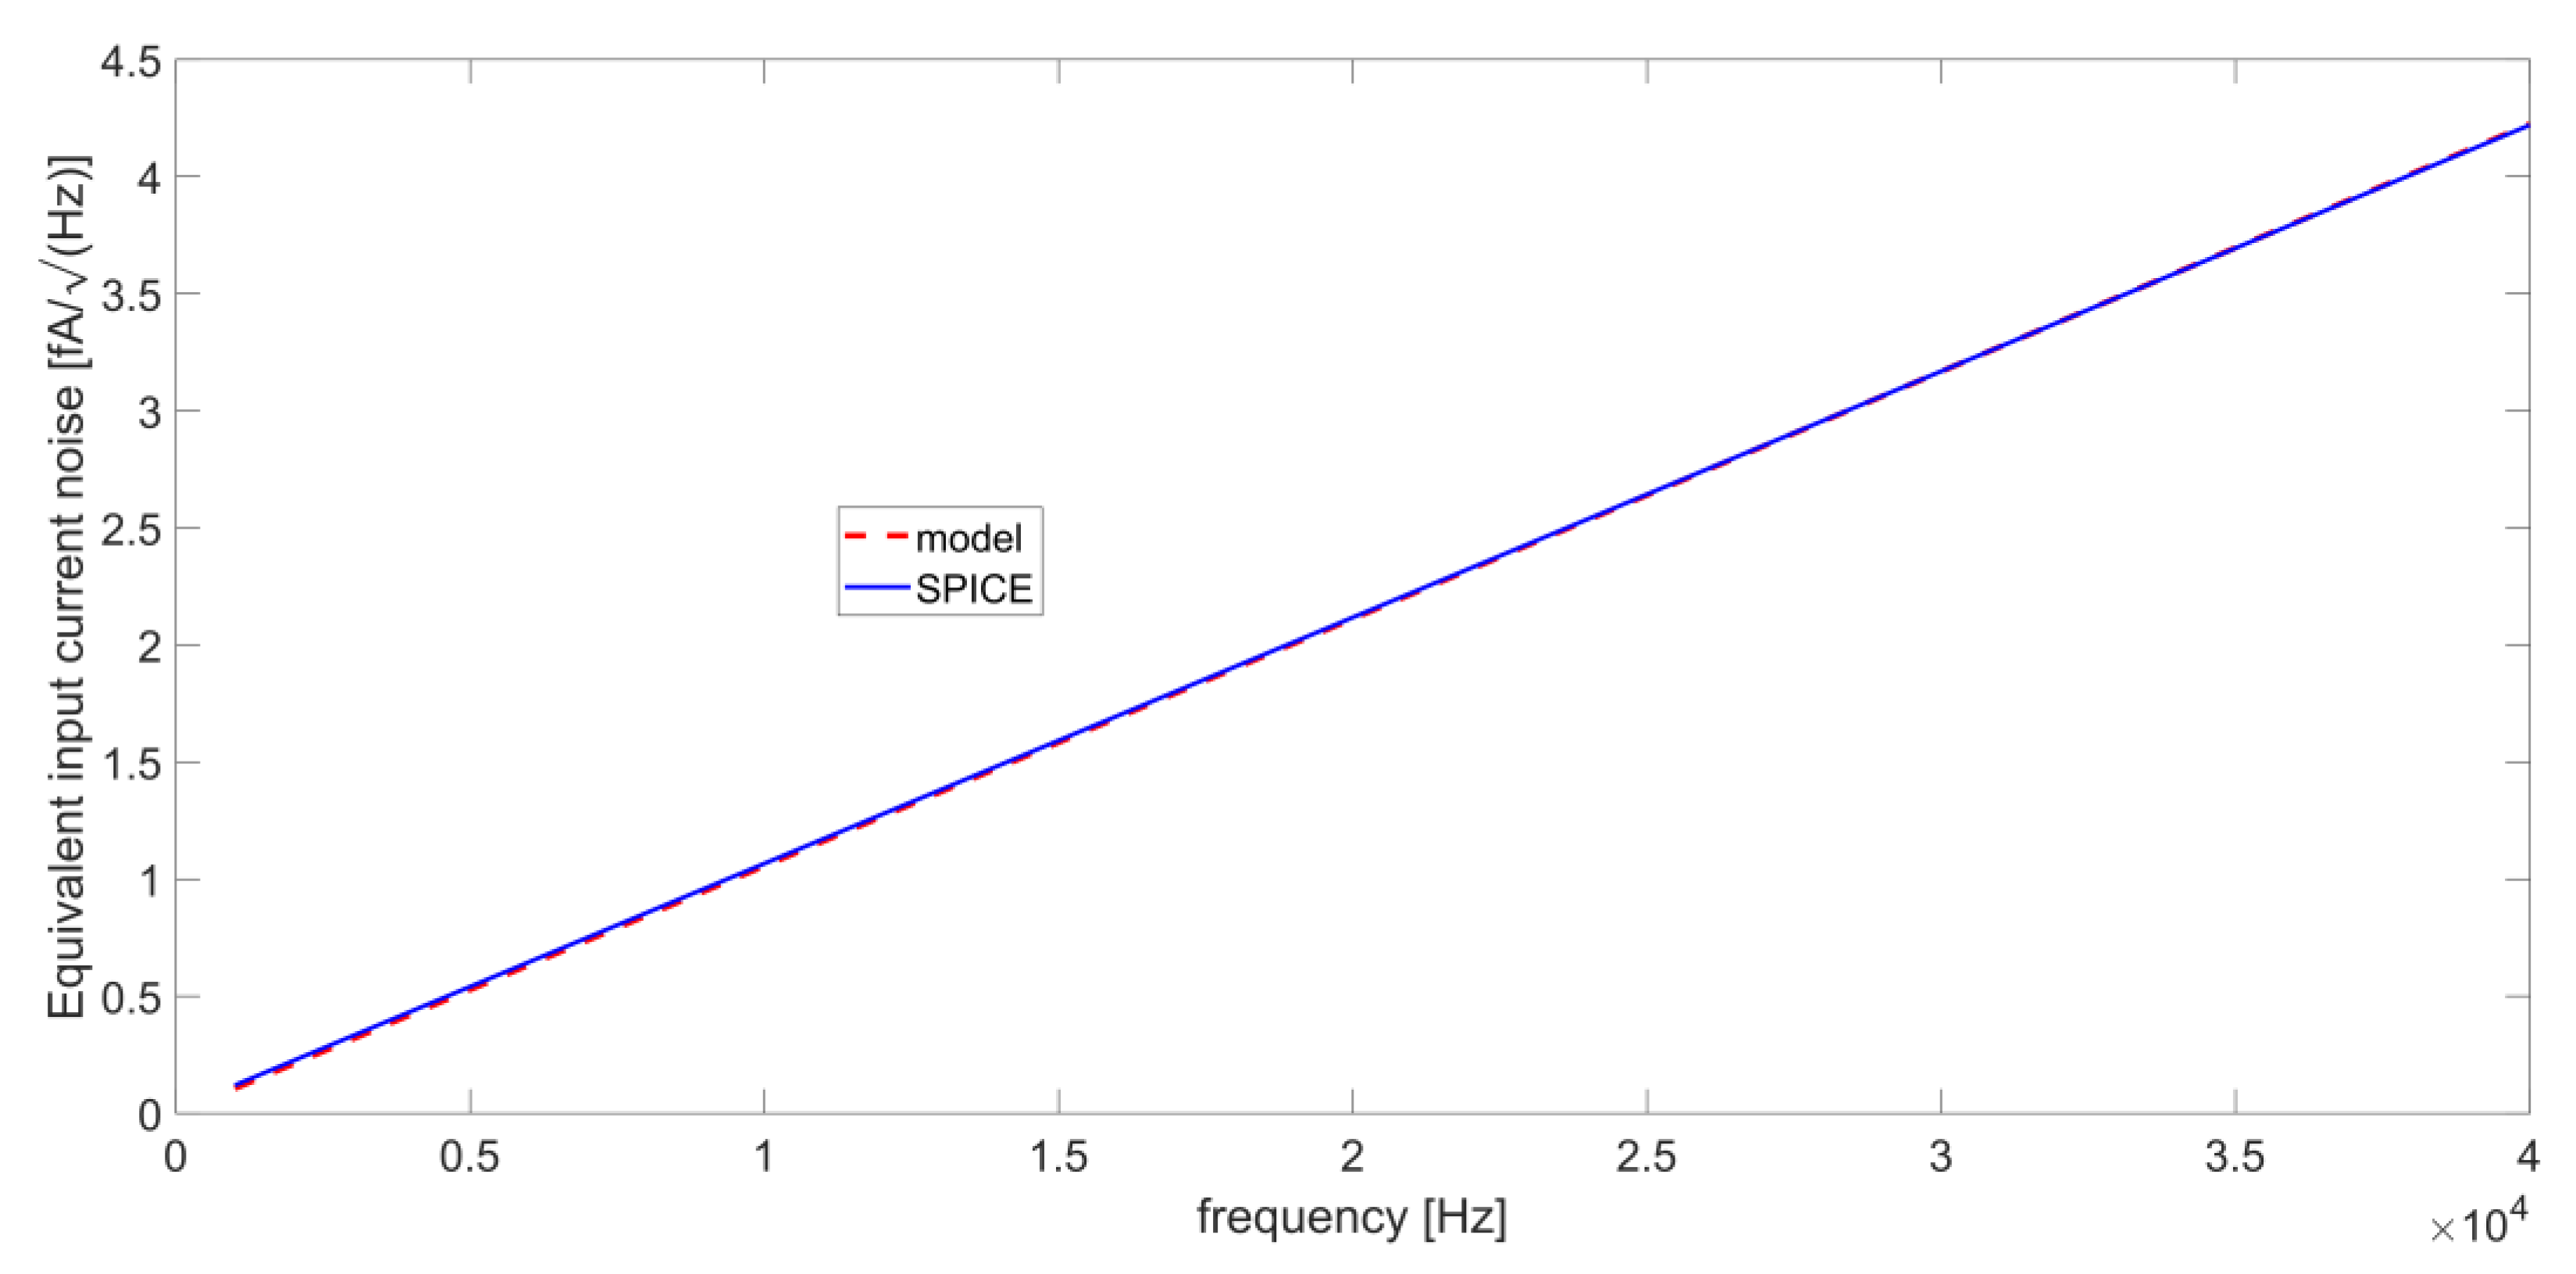
Figure 11 shows the excellent correspondence between the analytical model used for i
n+(ω) and the input equivalent noise current resulting from a simulation carried out with the SPICE model of the AD8067.
It is worth noticing that around the resonance frequencies of the QTF, the level of in+(ω) remains lower than the limit of 13 fA/√Hz determined above. Thus, we can conclude that the contribution Sin+(ω) can be neglected with respect to SnL(ω) in the noise analysis of our circuit without losing accuracy.
The analysis carried out so far allows for a comparison of the terms in Equation (5) to understand which ones are dominant for the output noise spectral density of the preamplifier.
Figure 12 compares the spectral contributions of the OPAMP and the resistors R
p and R
L to the overall S
ntot(ω) at the output of the circuit. The terms due to e
n_op and i
n+, namely, S
nop(ω) and S
nin+(ω), respectively, have been summed, resulting in the overall noise contribution of the OPAMP (S
opamp(ω)) and allowing for a comparison of the analytical model with the results of SPICE simulations, in which the two terms are not distinguishable. The same R
L values of
Figure 9 have been considered (100 kΩ, 500 kΩ, 6 MΩ, and 20 MΩ).
For all the considered cases, the results provided by the analytical model and the SPICE simulations exhibit a very good agreement. In addition, the contribution of the OPAMP to the total output noise is always negligible compared to the sum of the contributions from R
L and R
p. S
nL(ω) tends to prevail over S
np(ω) for R
L < 6 MΩ (
Figure 12a,b), whereas the opposite happens when the value of R
L is larger than 6 MΩ (
Figure 12c,d). This confirms the previous conclusion about the advantage of working with large values of the resistor R
L in order to achieve good performance in terms of SNR.
4. Signal-to-Noise Ratio at the Output of the Lock-in Amplifier
Synchronous detection techniques based on laser modulation and lock-in amplifier are always used in QEPAS sensors to increase the SNR of the measurements. In the previous sections, the amplitude of the useful signal and the noise spectral density at the output of the voltage-mode preamplifier are expressed as a function of frequency. These expressions can be conveniently exploited to evaluate the SNR at the output of the LIA. Thanks to synchronous demodulation and narrow-band low-pass filtering, the LIA output signal is DC-level proportional to the amplitude of the preamplifier response at the operating frequency. When the preamplifier response is acquired at the QTF resonance frequency, the trend of the SNR can be investigated in a small range around f
s. Thus, if the preamplifier response is acquired at a certain frequency f
op close to f
s, the output signal is proportional to |H
v(f
op)|. For what concerns noise, as a result of demodulation, the LIA transfers around DC the noise spectrum at the output of the preamplifier, centered around the LIA reference frequency. This noise is then filtered by means of the LIA narrow low-pass filter. Thus, the LIA behaves in practice like a narrow band-pass filter centered around its reference frequency. Hence, LIA was modelled as a biquadratic band-pass filter with a transfer function:
characterized by unity gain at center frequency and −3dB bandwidth BW = ω
op/Q
filt [
34].
Therefore, we can describe the behavior of the SNR at the output of the LIA as a function of the chosen operating frequency f
op = ω
op/2π by means of the following function:
where the amplitude of the input signal V
in (see
Figure 3) has been normalized to 1 V.
By separating the noise contributions from R
p and R
L, we can define two functions:
and
Thus, the total normalized squared-SNR can be rewritten as follows:
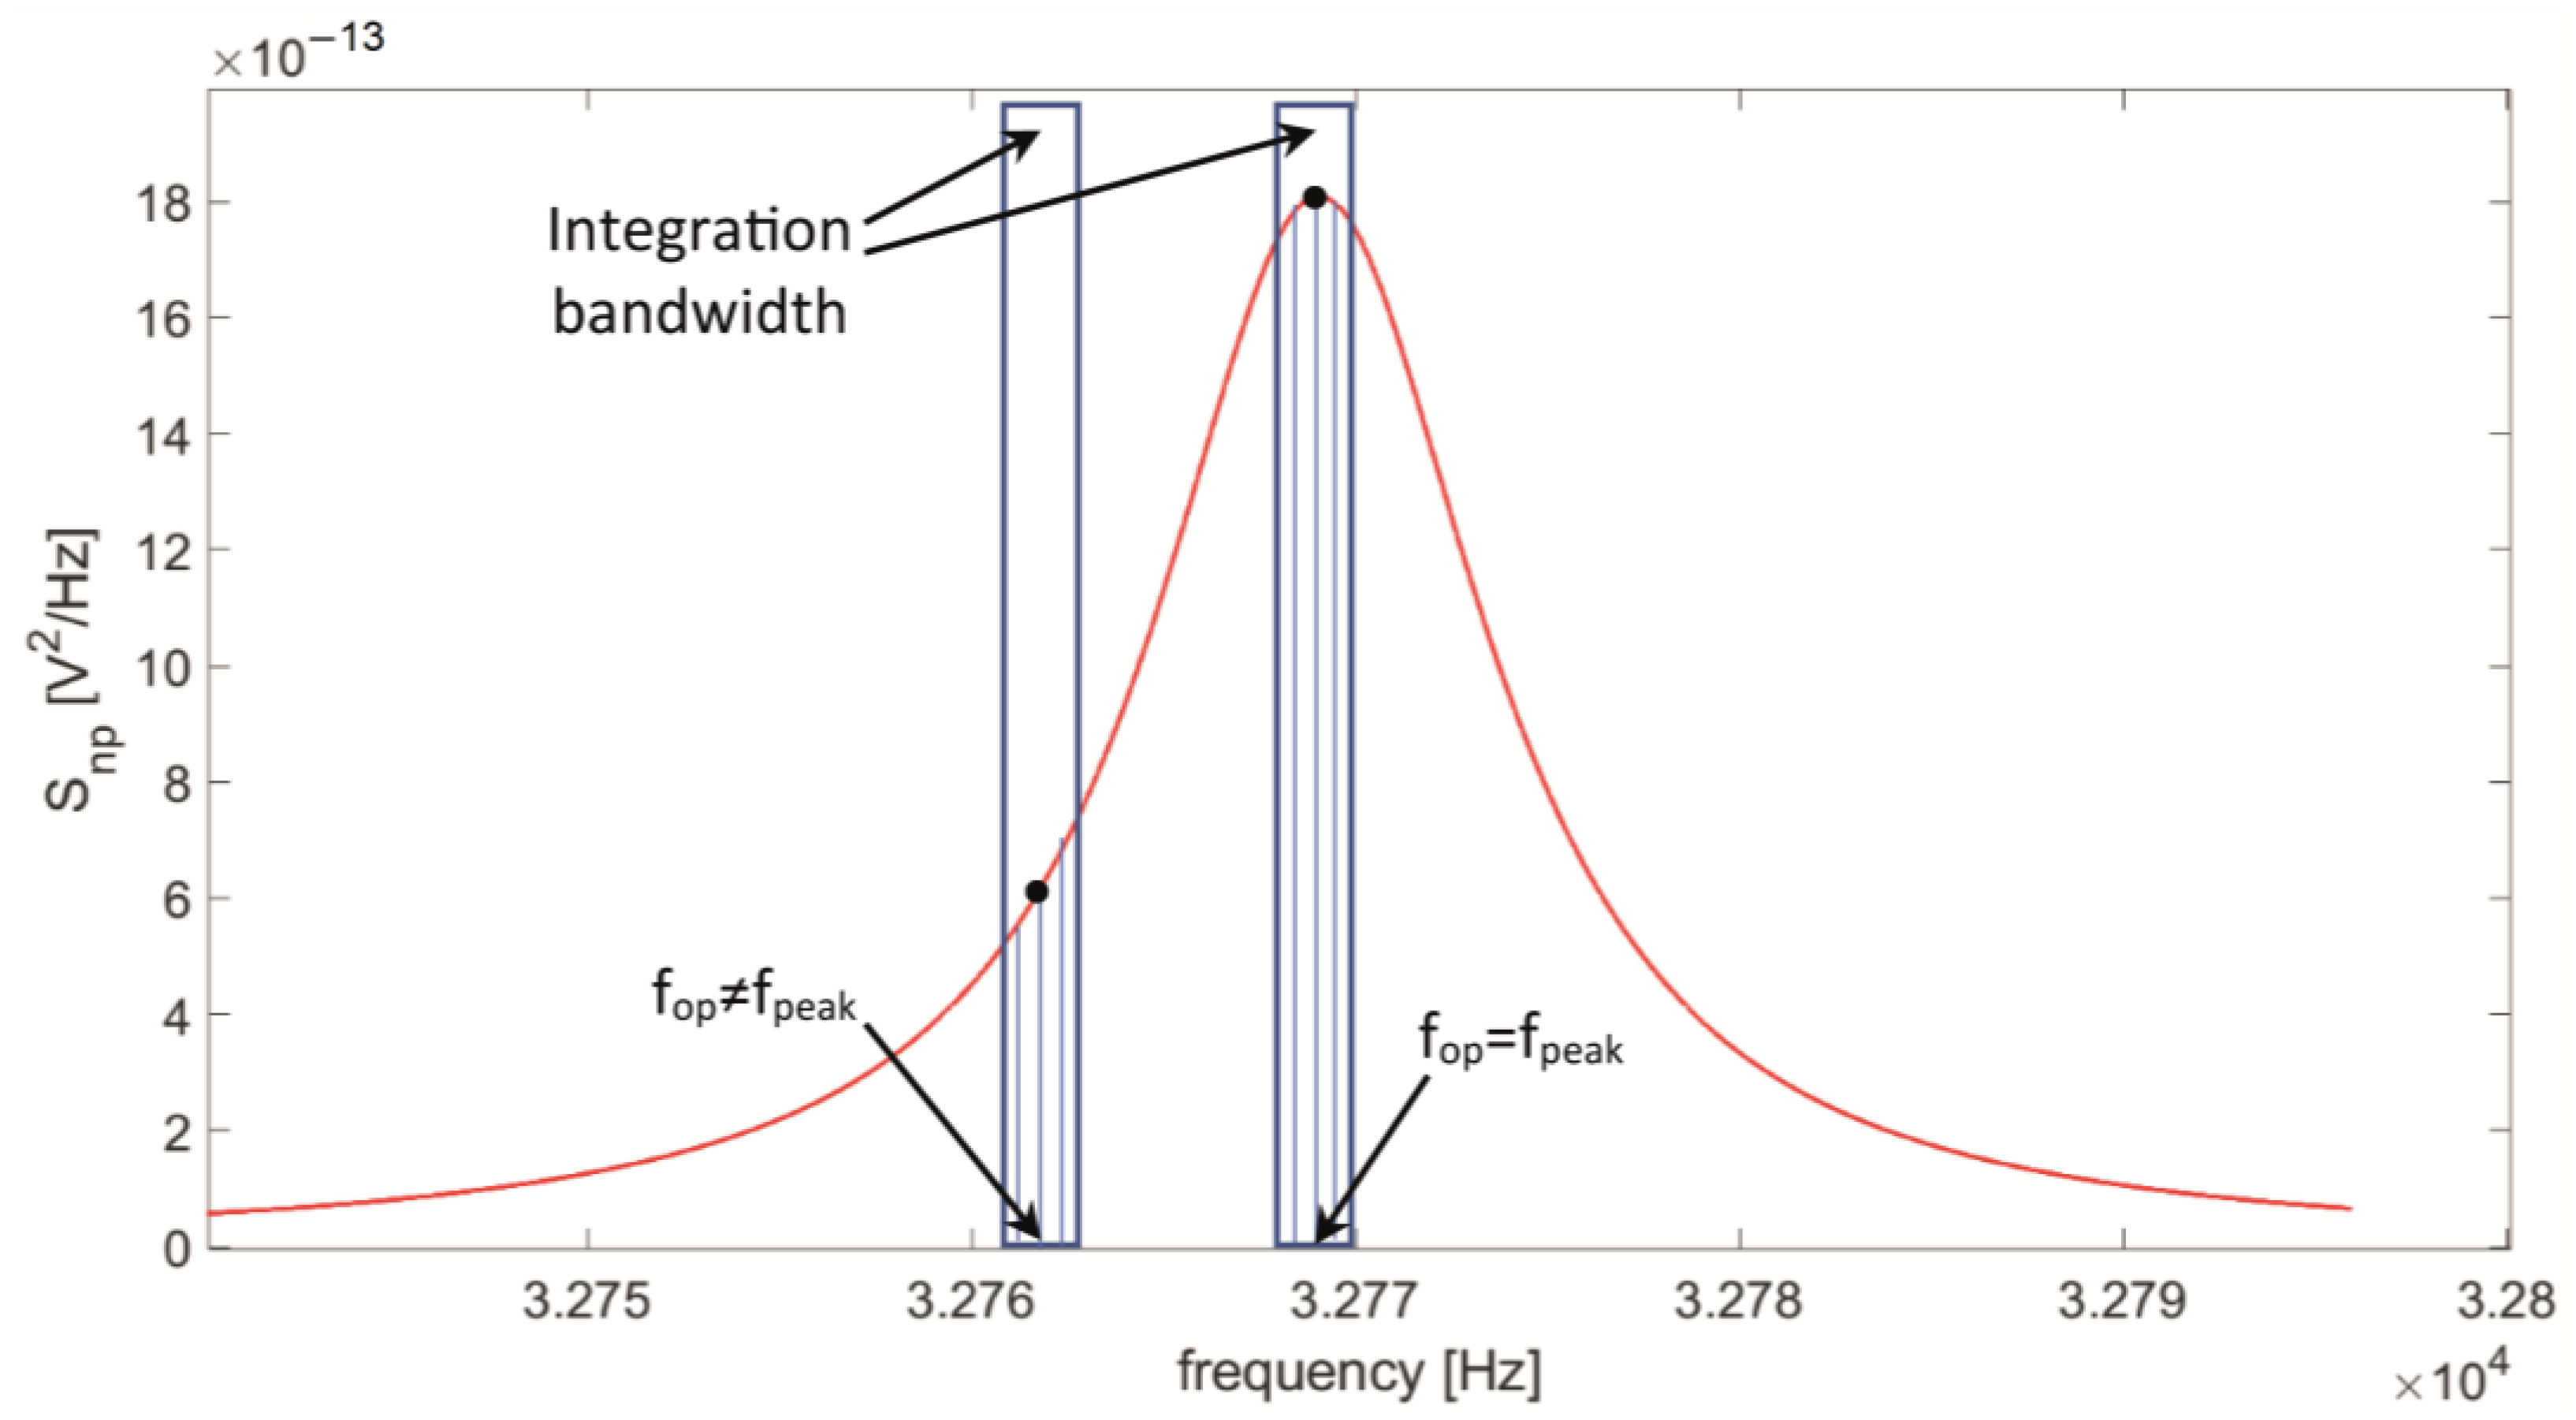
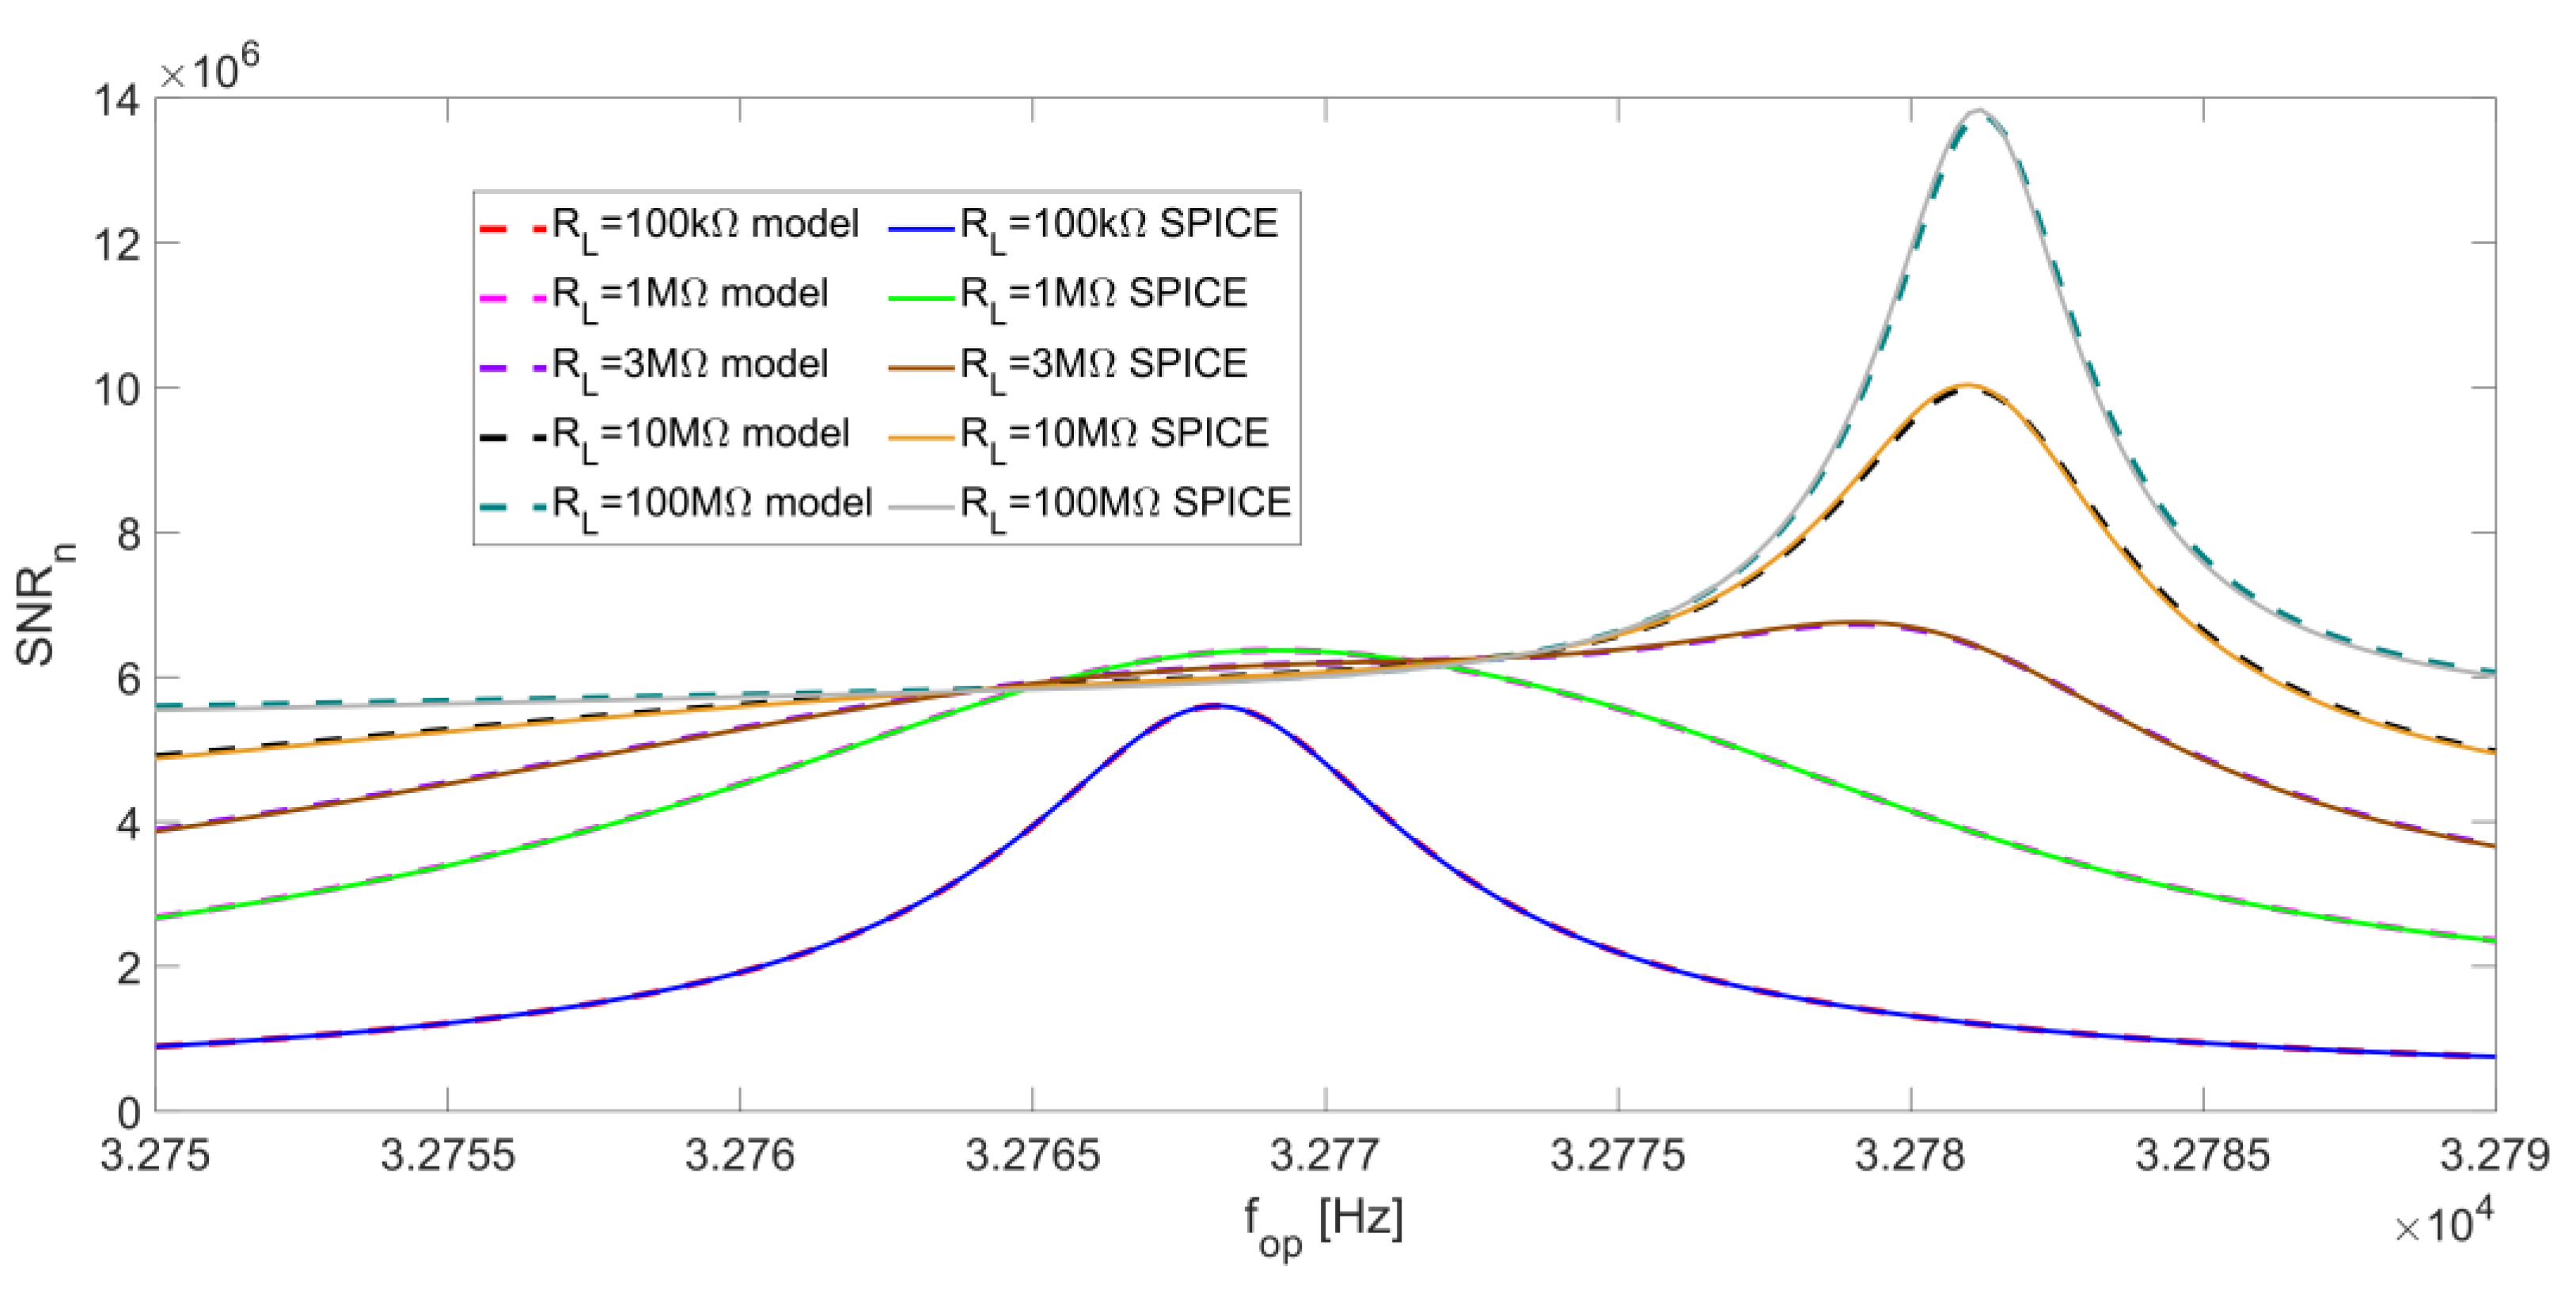
First, let us consider a very narrow-bandwidth BW = 0.5 Hz, corresponding to a settling time of about 1.3 s for an equivalent first-order LIA low-pass filter. In this case, the behavior of the integrated noise as a function of f
op is expected to be very similar to the output noise spectral density. Thus, the SNR
np contribution is expected to be almost spectrally flat since the noise from R
P and the signal have the same transfer function H
v(f). Nonetheless, considering a representative value for R
L = 100 kΩ, a peak of SNR
np emerges around the peak frequency of |H
v(f)|, because of the effect of integration, as reported in
Figure 13. As shown in
Figure 13, for a bandpass filter, the effect of the integration bandwidth on the input noise spectral density can be more intuitively represented by means of a simple brick-wall filter.
Indeed, in the narrow integration bandwidth, the function S
np(f) takes monotonically decreasing values on both sides of f
op = f
peak; whereas, for any other frequency value, S
np(f) has decreasing values in one direction, but increasing values in the other, as illustrated in
Figure 13. As a consequence, the value of the integrated noise normalized to the value of the signal reaches a minimum value at f
op = f
peak, generating a peak value in the function SNR
np(f
op).
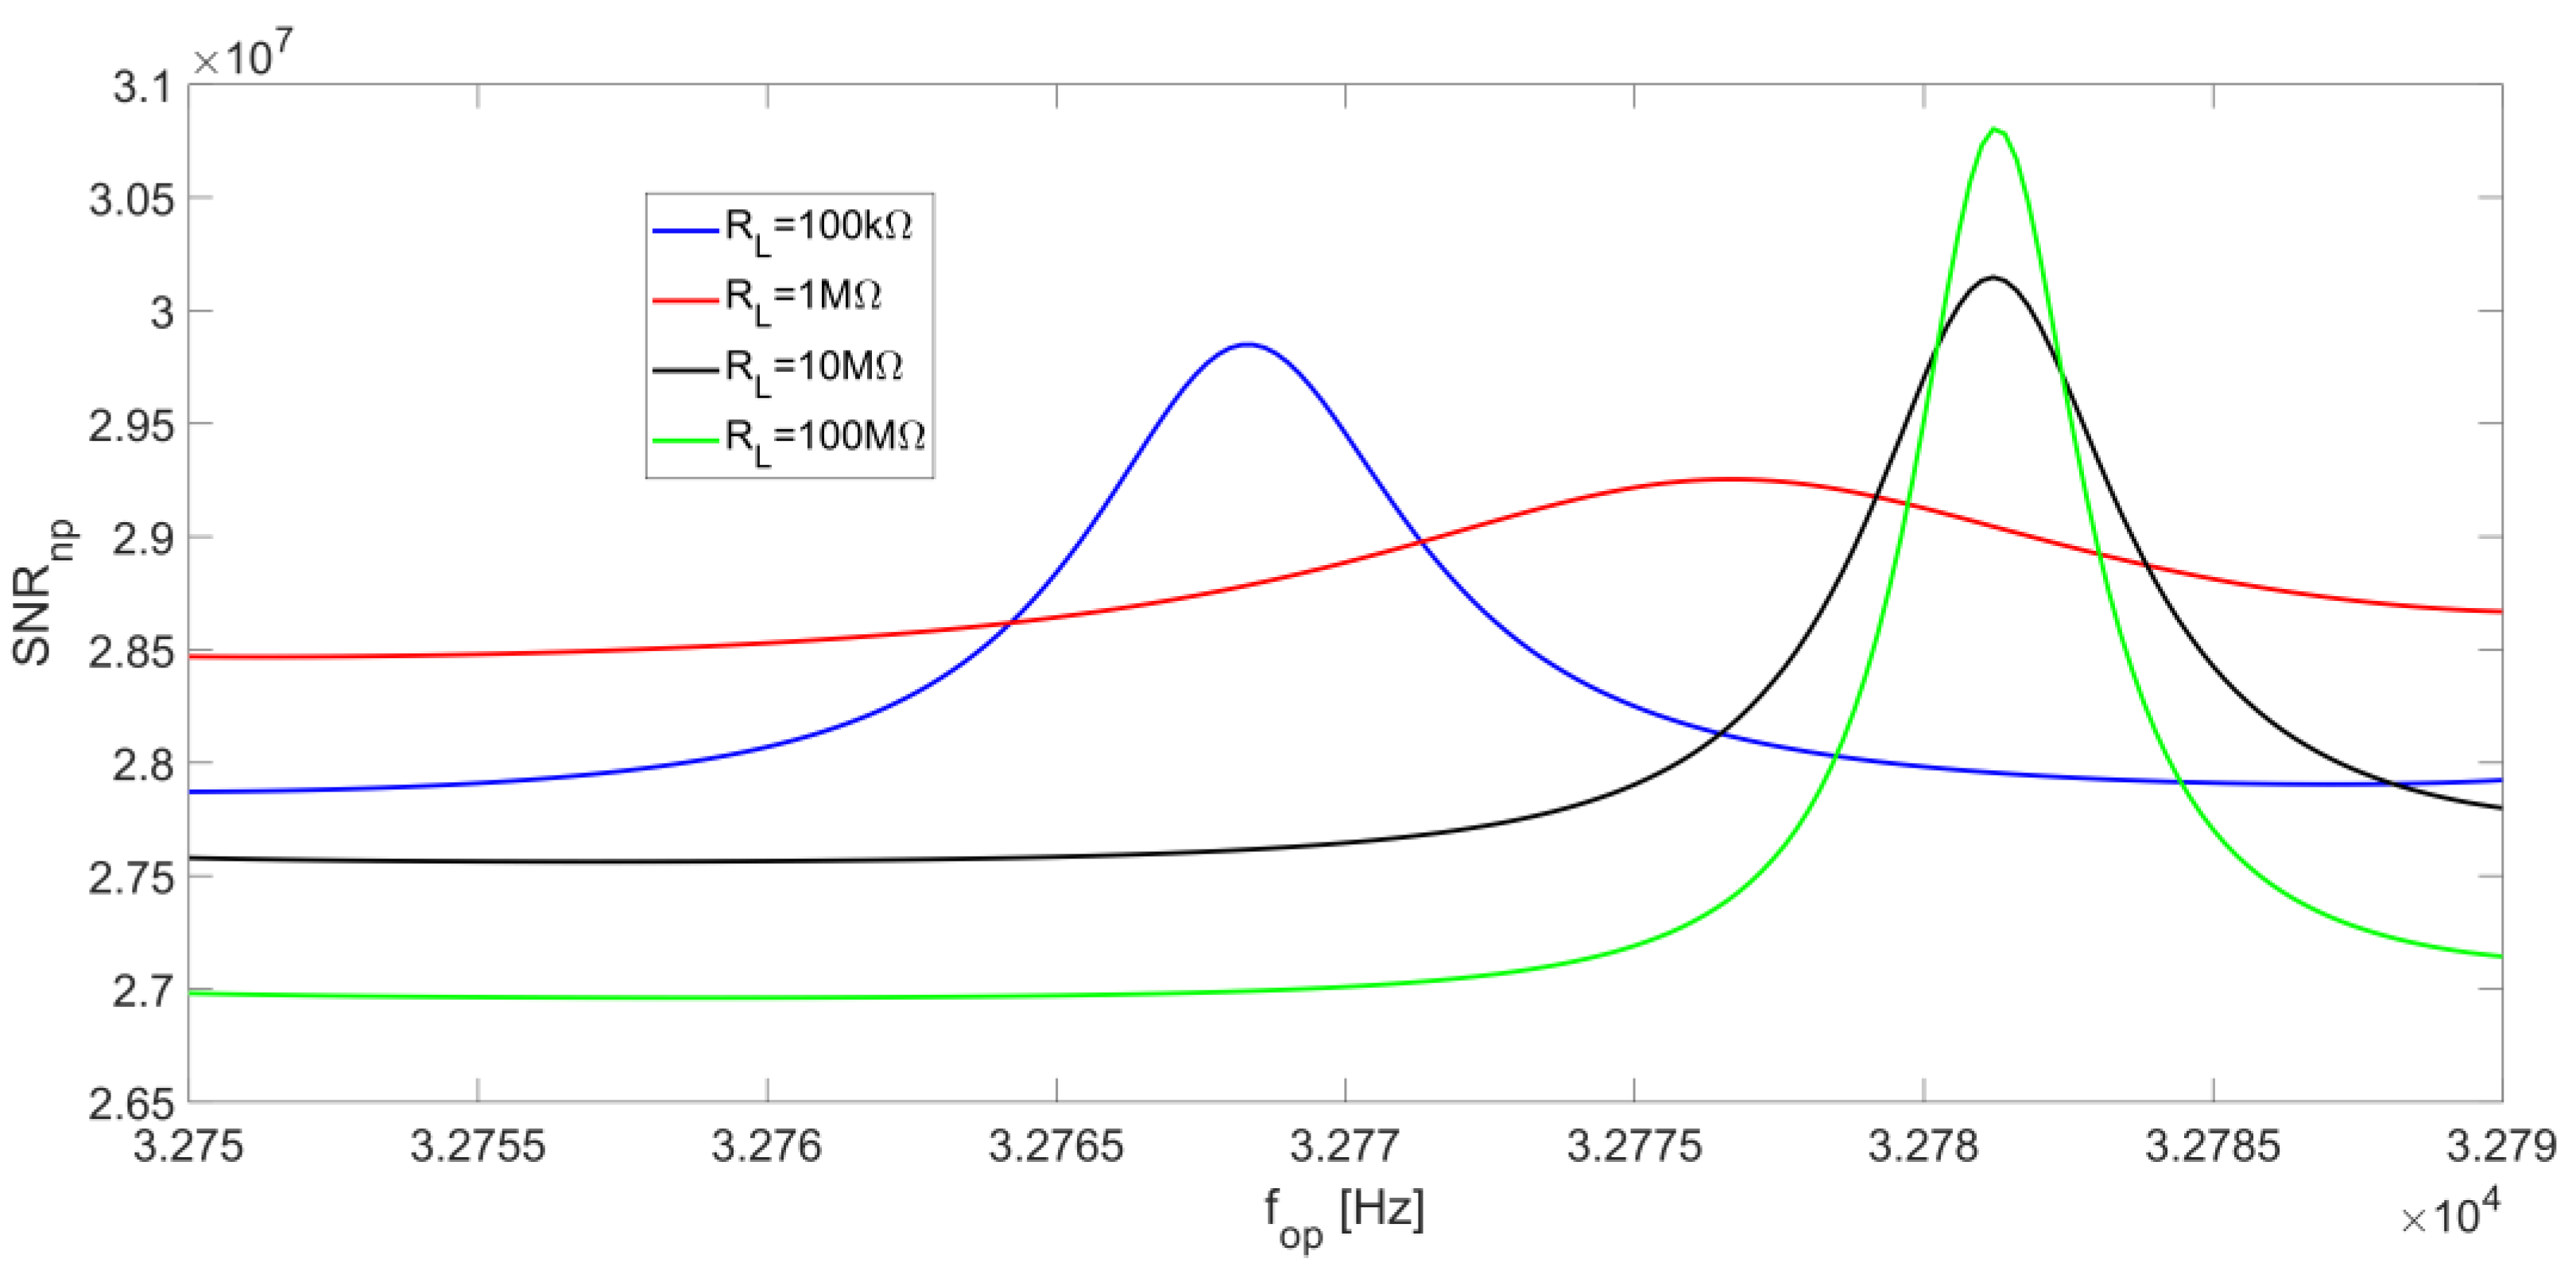
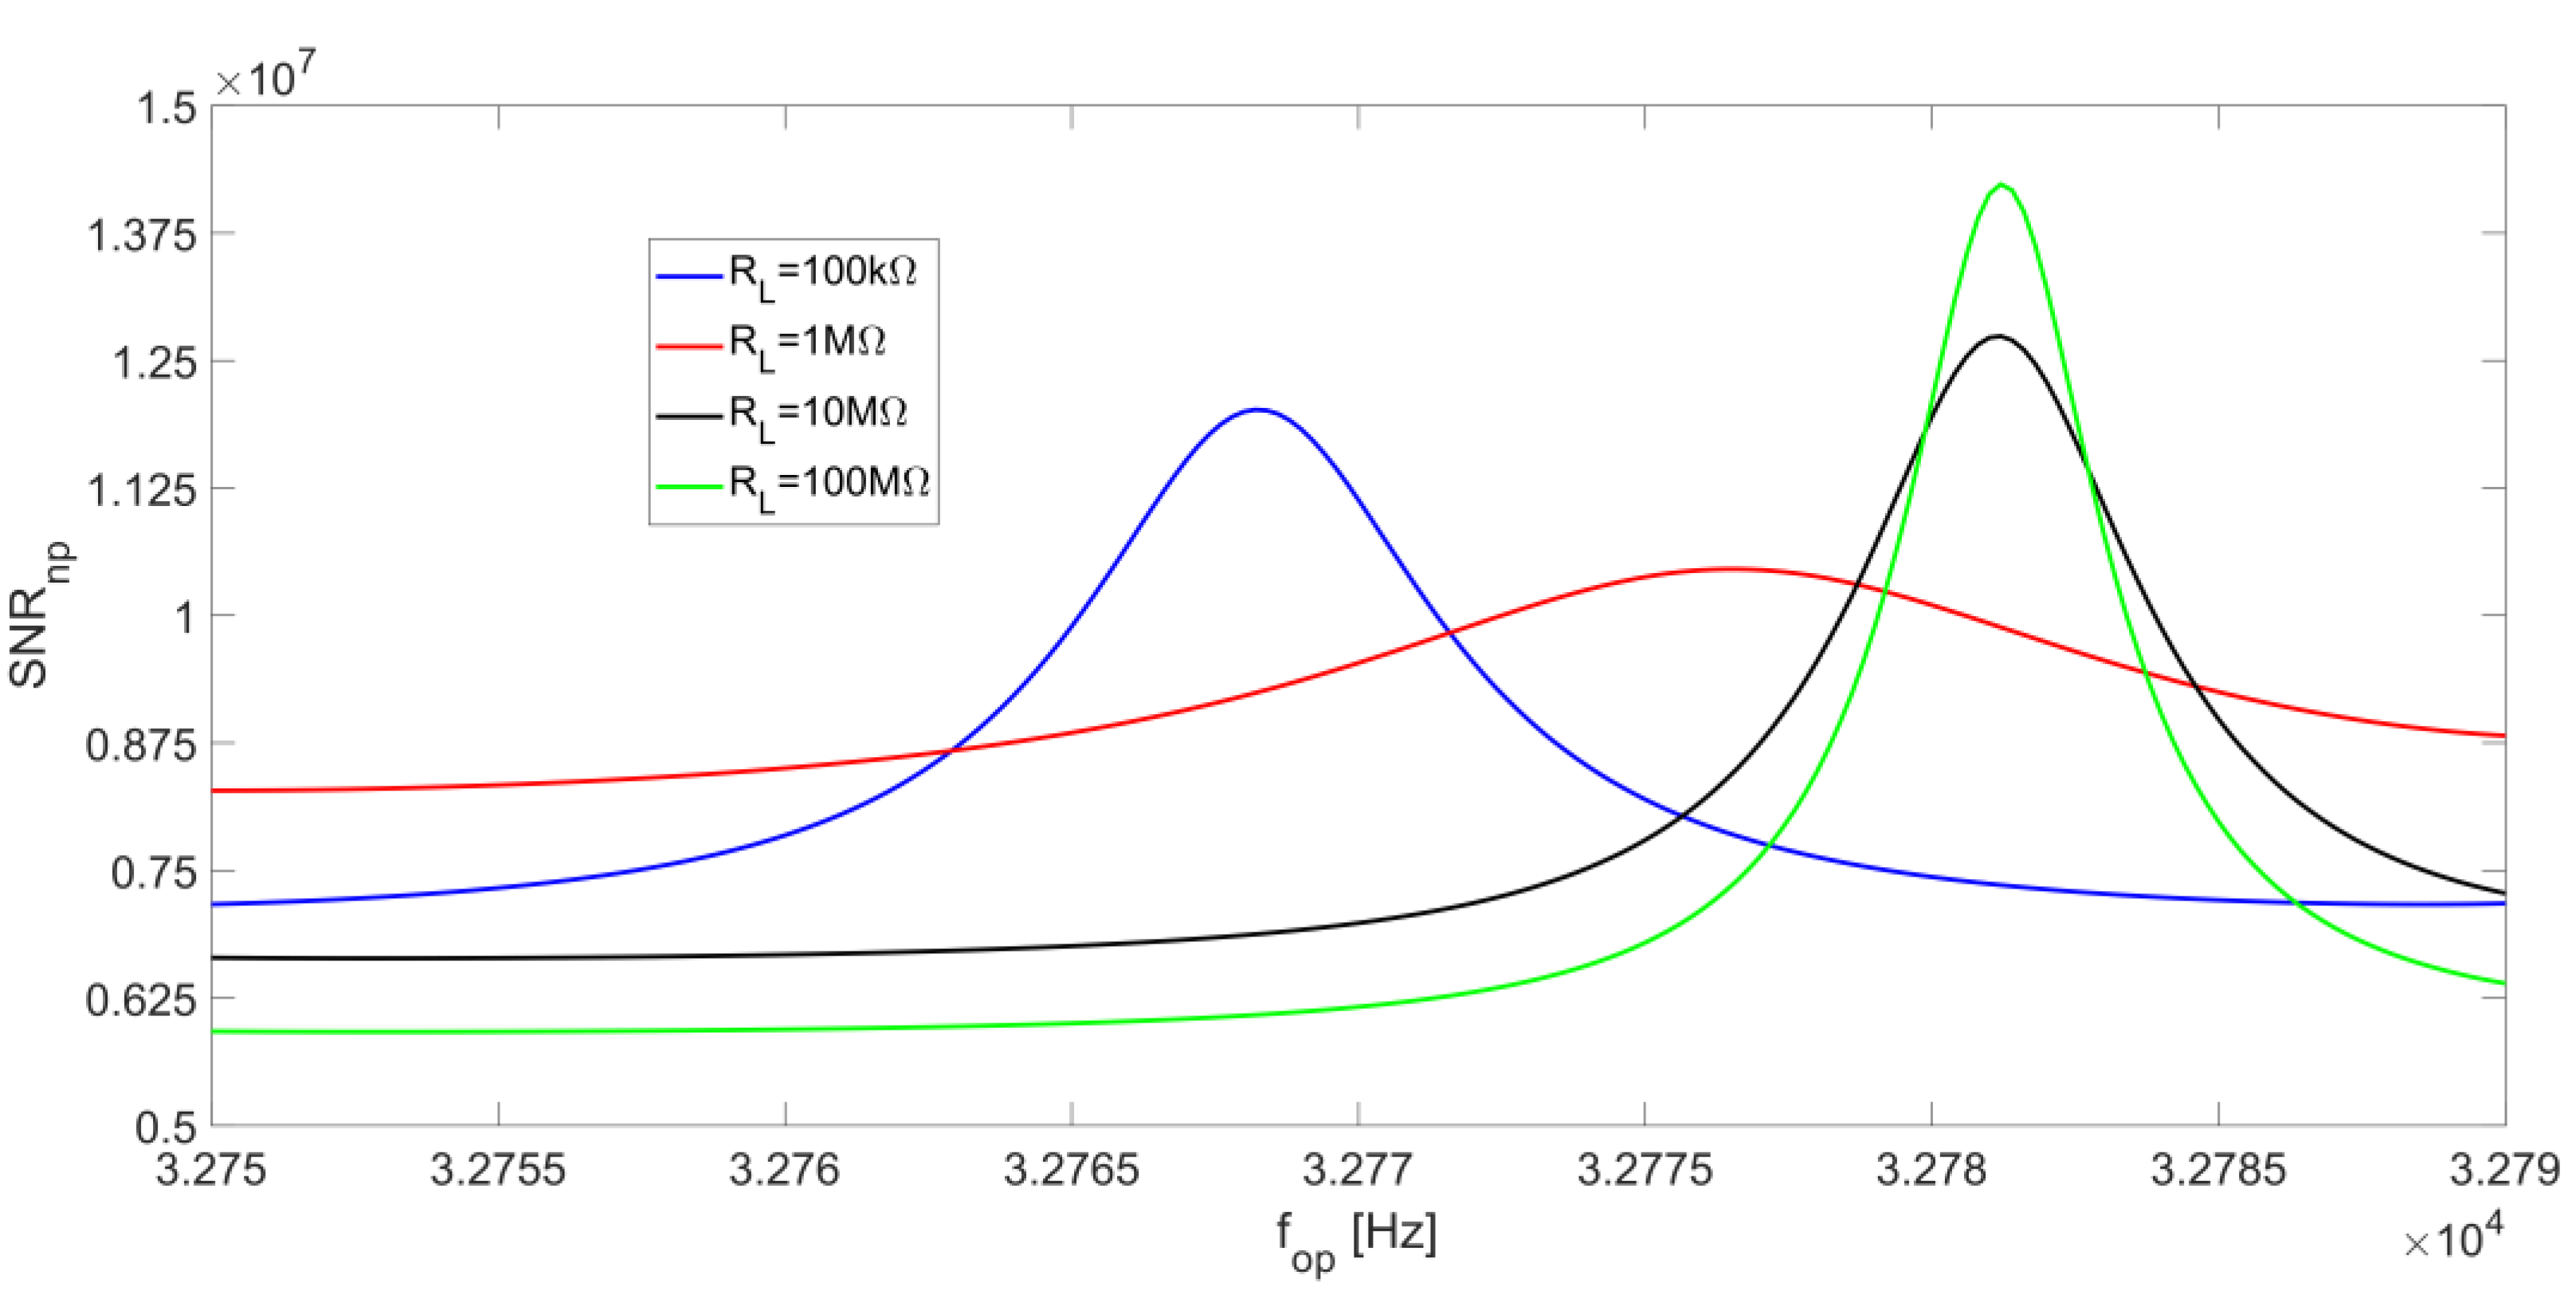
The presence of a peak value for SNR
np is also visible in
Figure 14, which reports SNR
np as a function of the frequency f
op, for different values of R
L. Moreover, for increasing values of R
L, the peak moves from f
S to f
P; for large values of R
L, it becomes slightly more pronounced, even though the overall behavior always remains rather flat.
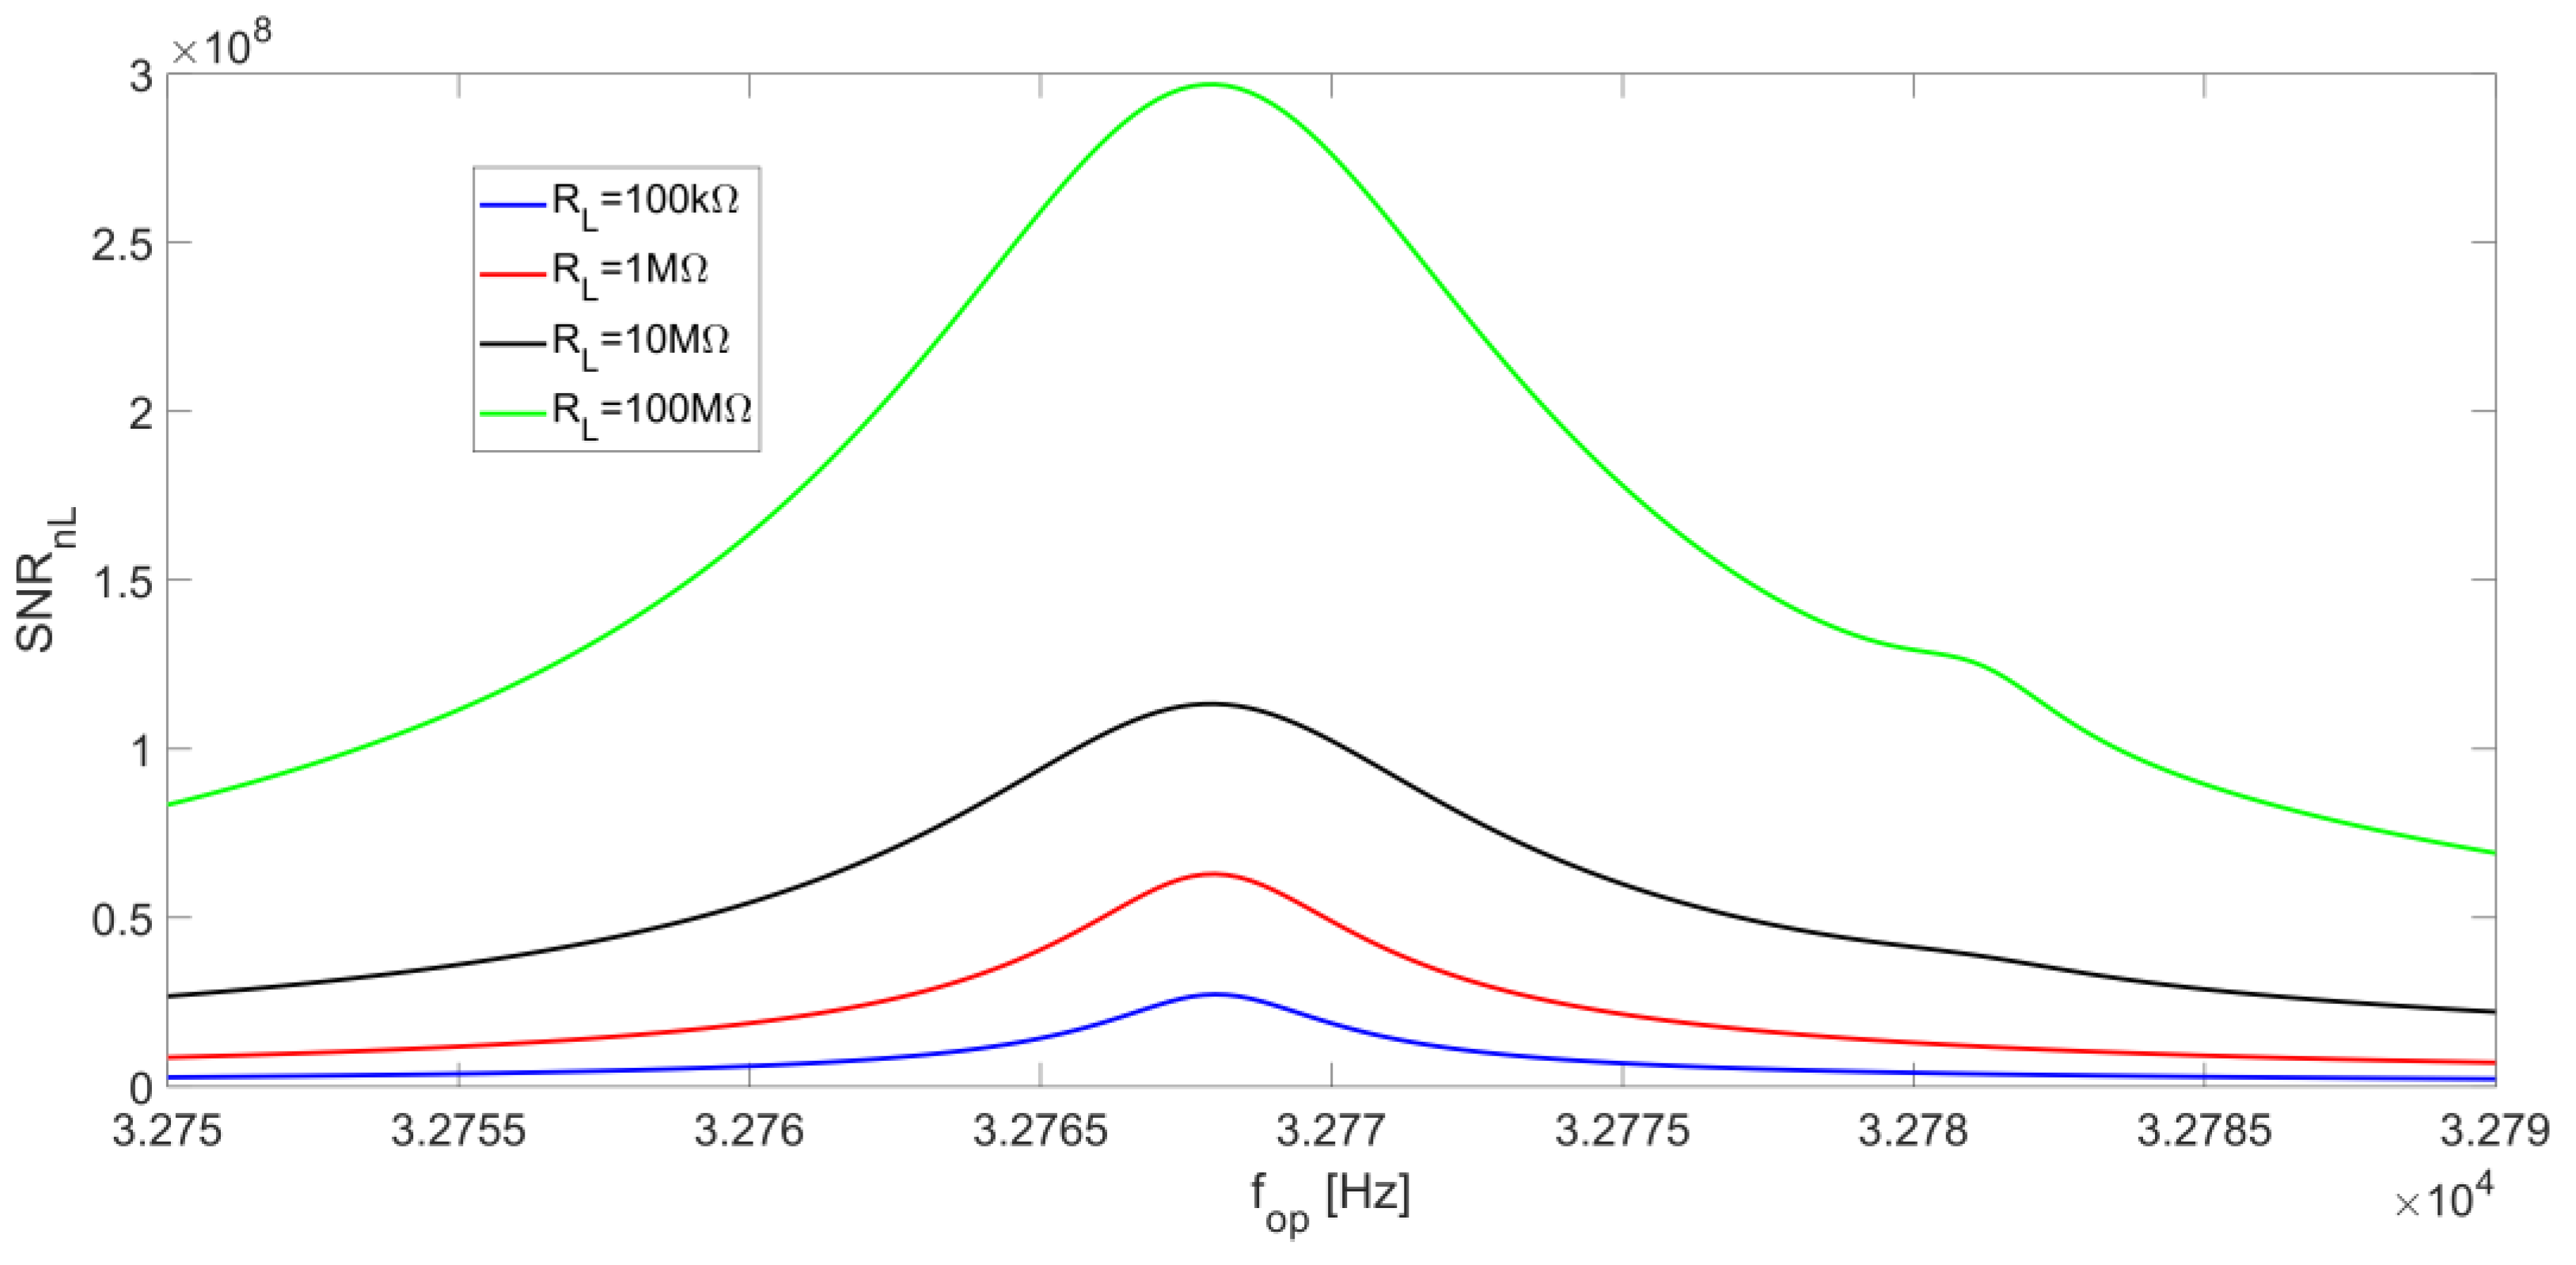
As for the term SNR
nL, its behavior as a function of f
op is strongly affected by the minimum of the noise spectral density S
nL at f
S. This effect prevails over the peak value of the signal, which moves towards f
P for increasing values of R
L, resulting in a local maximum point on SNR
nL which is always located at the series-resonant frequency f
S for any value of R
L.
Figure 15 shows the behavior of SNR
nL as a function of the operating frequency for different R
L values.
Higher values of SNRnL are obtained for increasing values of RL values. Therefore, as reported in Equation (13), SNRnp becomes dominant in the calculation of the overall SNR for large values of RL.
We can now consider the overall SNR at the LIA output given by Equation (13) as a function of f
op.
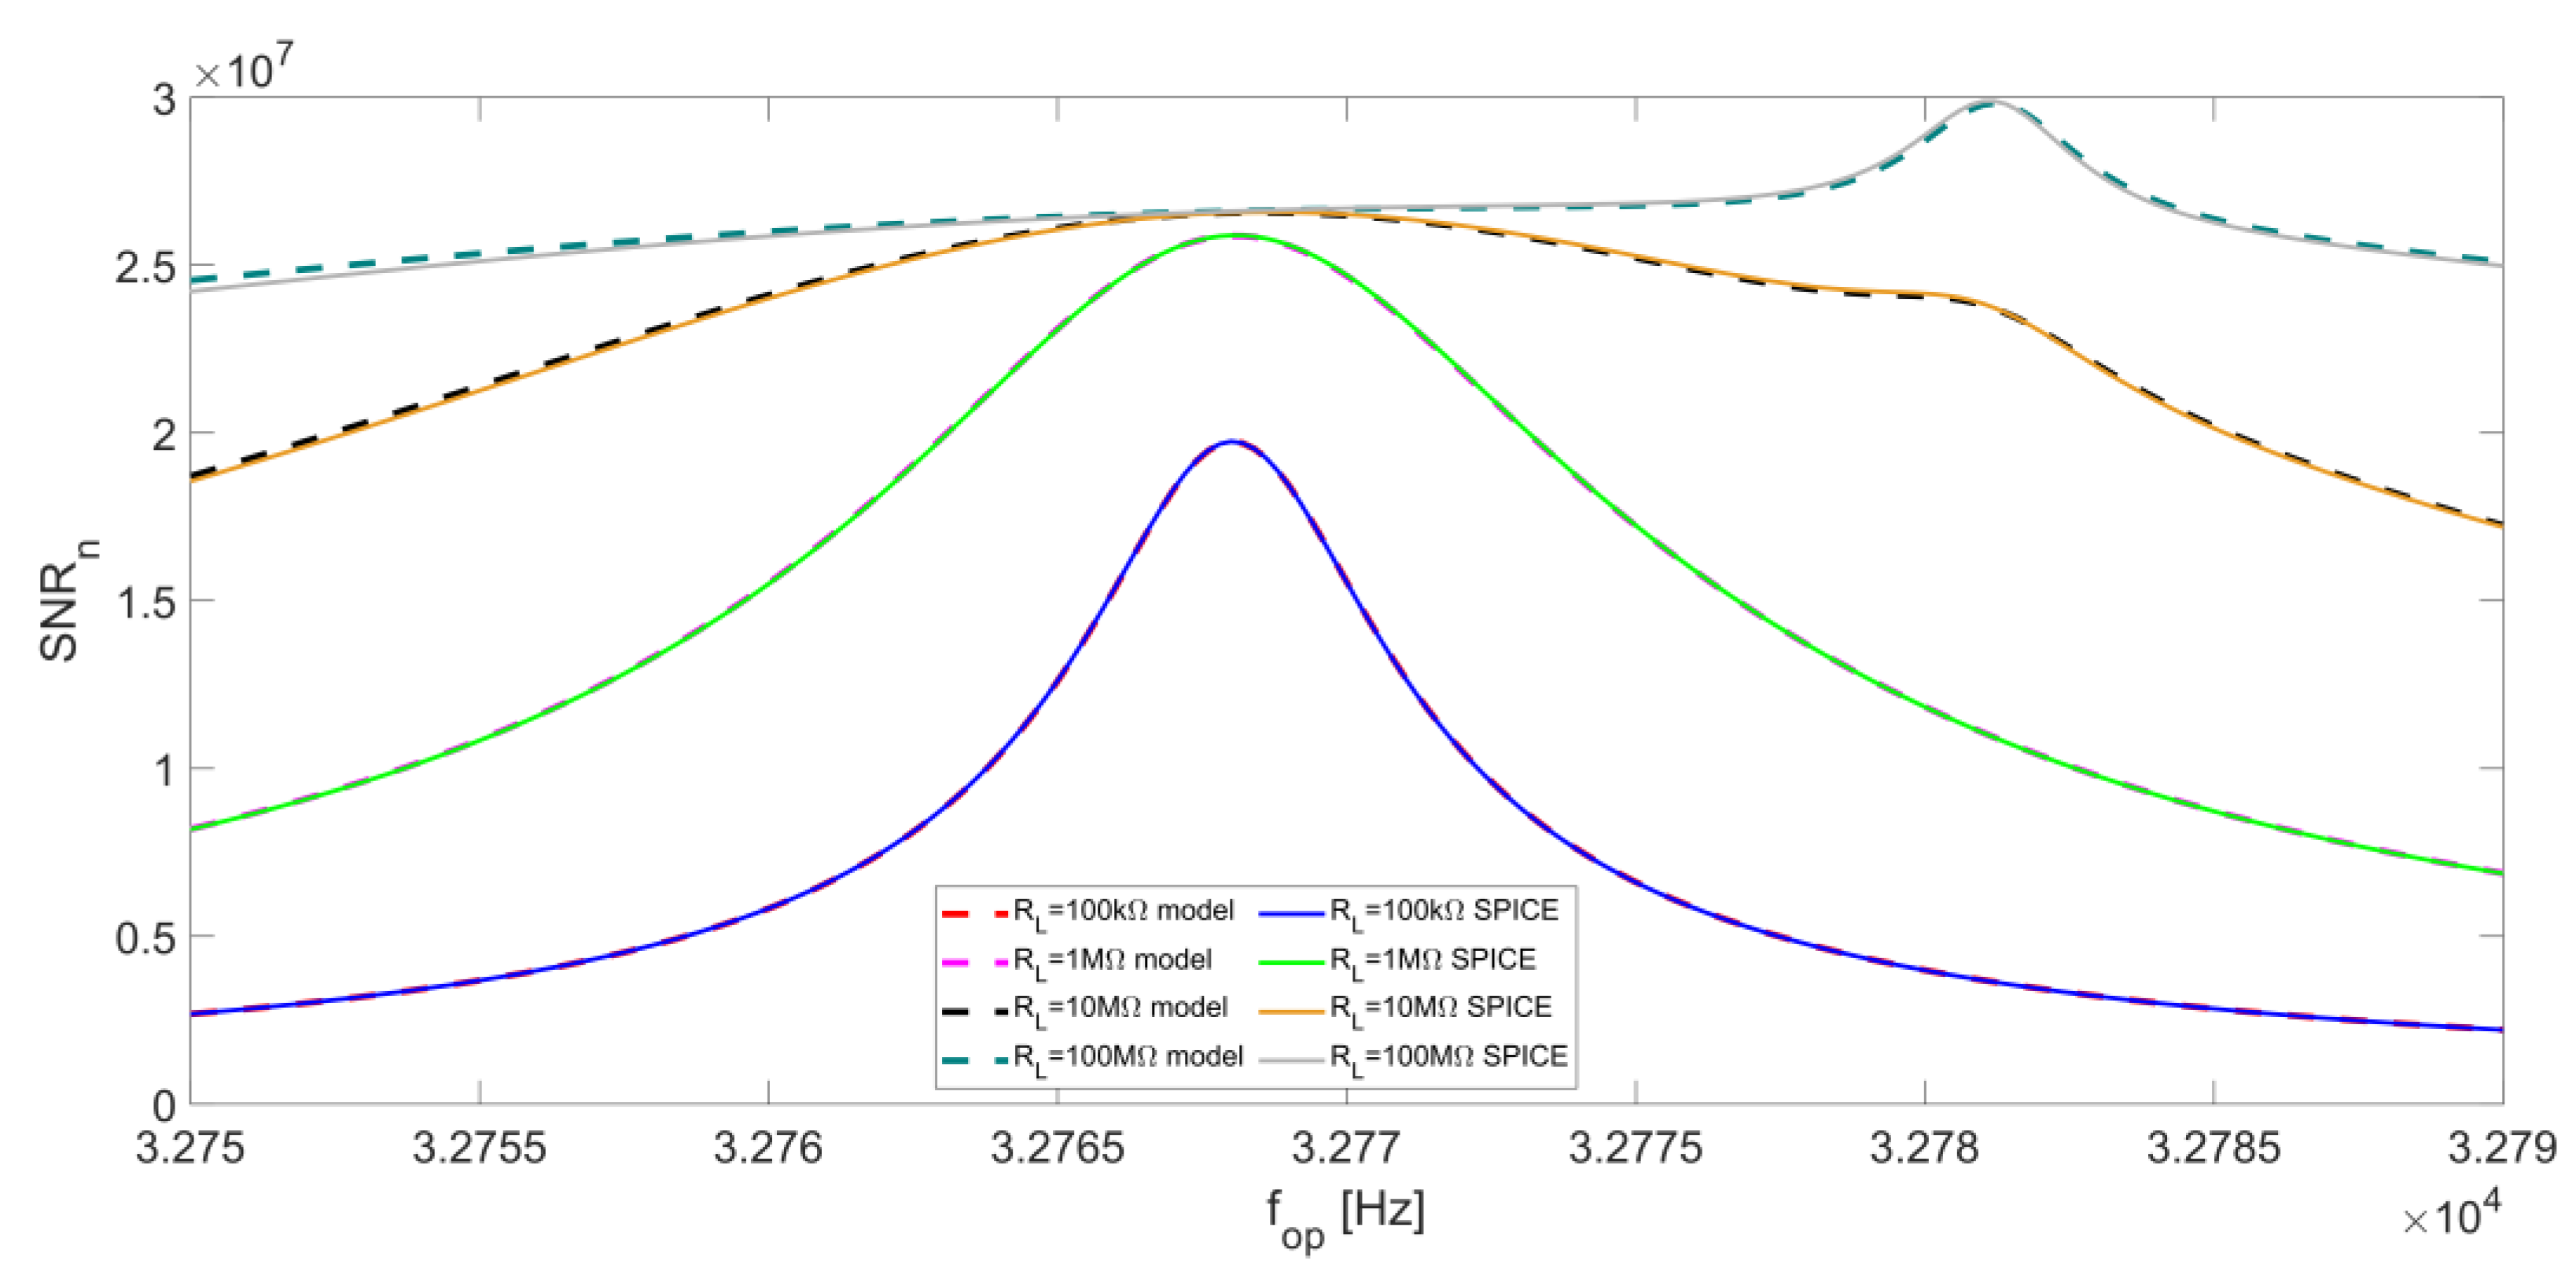
Figure 16 reports the SNR
n as a function of f
op for different values of R
L with BW = 0.5 Hz. Here, a comparison between the results given by the analytical model and the corresponding SPICE simulation is also proposed, highlighting an excellent correspondence.
For low values of R
L, SNR
np is almost flat (see
Figure 14) and the peak of the total SNR
n coincides with the peak of SNR
nL, so the best operating frequency for QEPAS is the series-resonant frequency f
S of the QTF. When R
L is increased, as already pointed out, the contribution of SNR
nL becomes less relevant, so a local peak in the SNR
n emerges, corresponding to the peak of SNR
np, which occurs at the parallel-resonant frequency f
P.
From
Figure 16, it is evident that the SNR
n peak feature at f
S becomes less sharp as R
L increases. For R
L = 100 MΩ, the SNR
n becomes quite flat around f
S and a sharp peak appears at f
P. In general, slightly better results in terms of SNR are obtained with large values of R
L.
The study above has been carried out for a LIA with a very narrow-band filter, which is useful when the requirements in terms of noise rejection are very harsh and the long time needed for a single measurement can be tolerated. With fast measurements [
35,
36], the bandwidth of the LIA filter must necessarily be increased, and the results of the previous analysis must be revised. Moreover, the QTF response time represents a further issue to deal with when fast measurements are needed. The response time is given by:
This implies that, in conventional QEPAS applications, a long integration time (300 to 400 ms) is required to acquire the LIA output signal. Nevertheless, specific QEPAS techniques such as Beat Frequency (BF) QEPAS exploit the fast transient response of an acoustically excited QTF to retrieve the gas concentration, the resonance frequency, and the quality factor of the QTF [
7]. This approach overcomes the limitations imposed by the time response of the QTF, allowing shorter acquisition times and faster measurements.
As concerns the contribution to the total SNR at the LIA output due to the resistor R
p, since the integration bandwidth is larger, the effect of the integration around f
peak, described above (see
Figure 13), is more relevant. Consequently, the peak of SNR
np as a function of the operating frequency, always placed at f
peak, becomes sharper and more pronounced.
Figure 17 shows the behavior of SNR
np as a function of f
op when BW = 5 Hz, corresponding to a settling time of about 130 ms for an equivalent first order LIA low-pass filter for the same values of R
L considered in
Figure 14.
We now analyze the R
L noise contribution to the SNR for increasing values of the LIA bandwidth. The effect of the minimum of S
nL, placed at f
S, tends to be less relevant, because of the increase of the integration bandwidth. Therefore, the function SNR
nL becomes flatter around the series-resonant frequency. Nonetheless, for small values of R
L, the peak of the signal is located at f
S and, consequently, the peak of SNR
nL is still placed at f
S. When R
L is increased, the peak of the signal moves towards the parallel-resonant frequency f
P and the effect of the minimum of S
nL becomes less relevant, so SNR
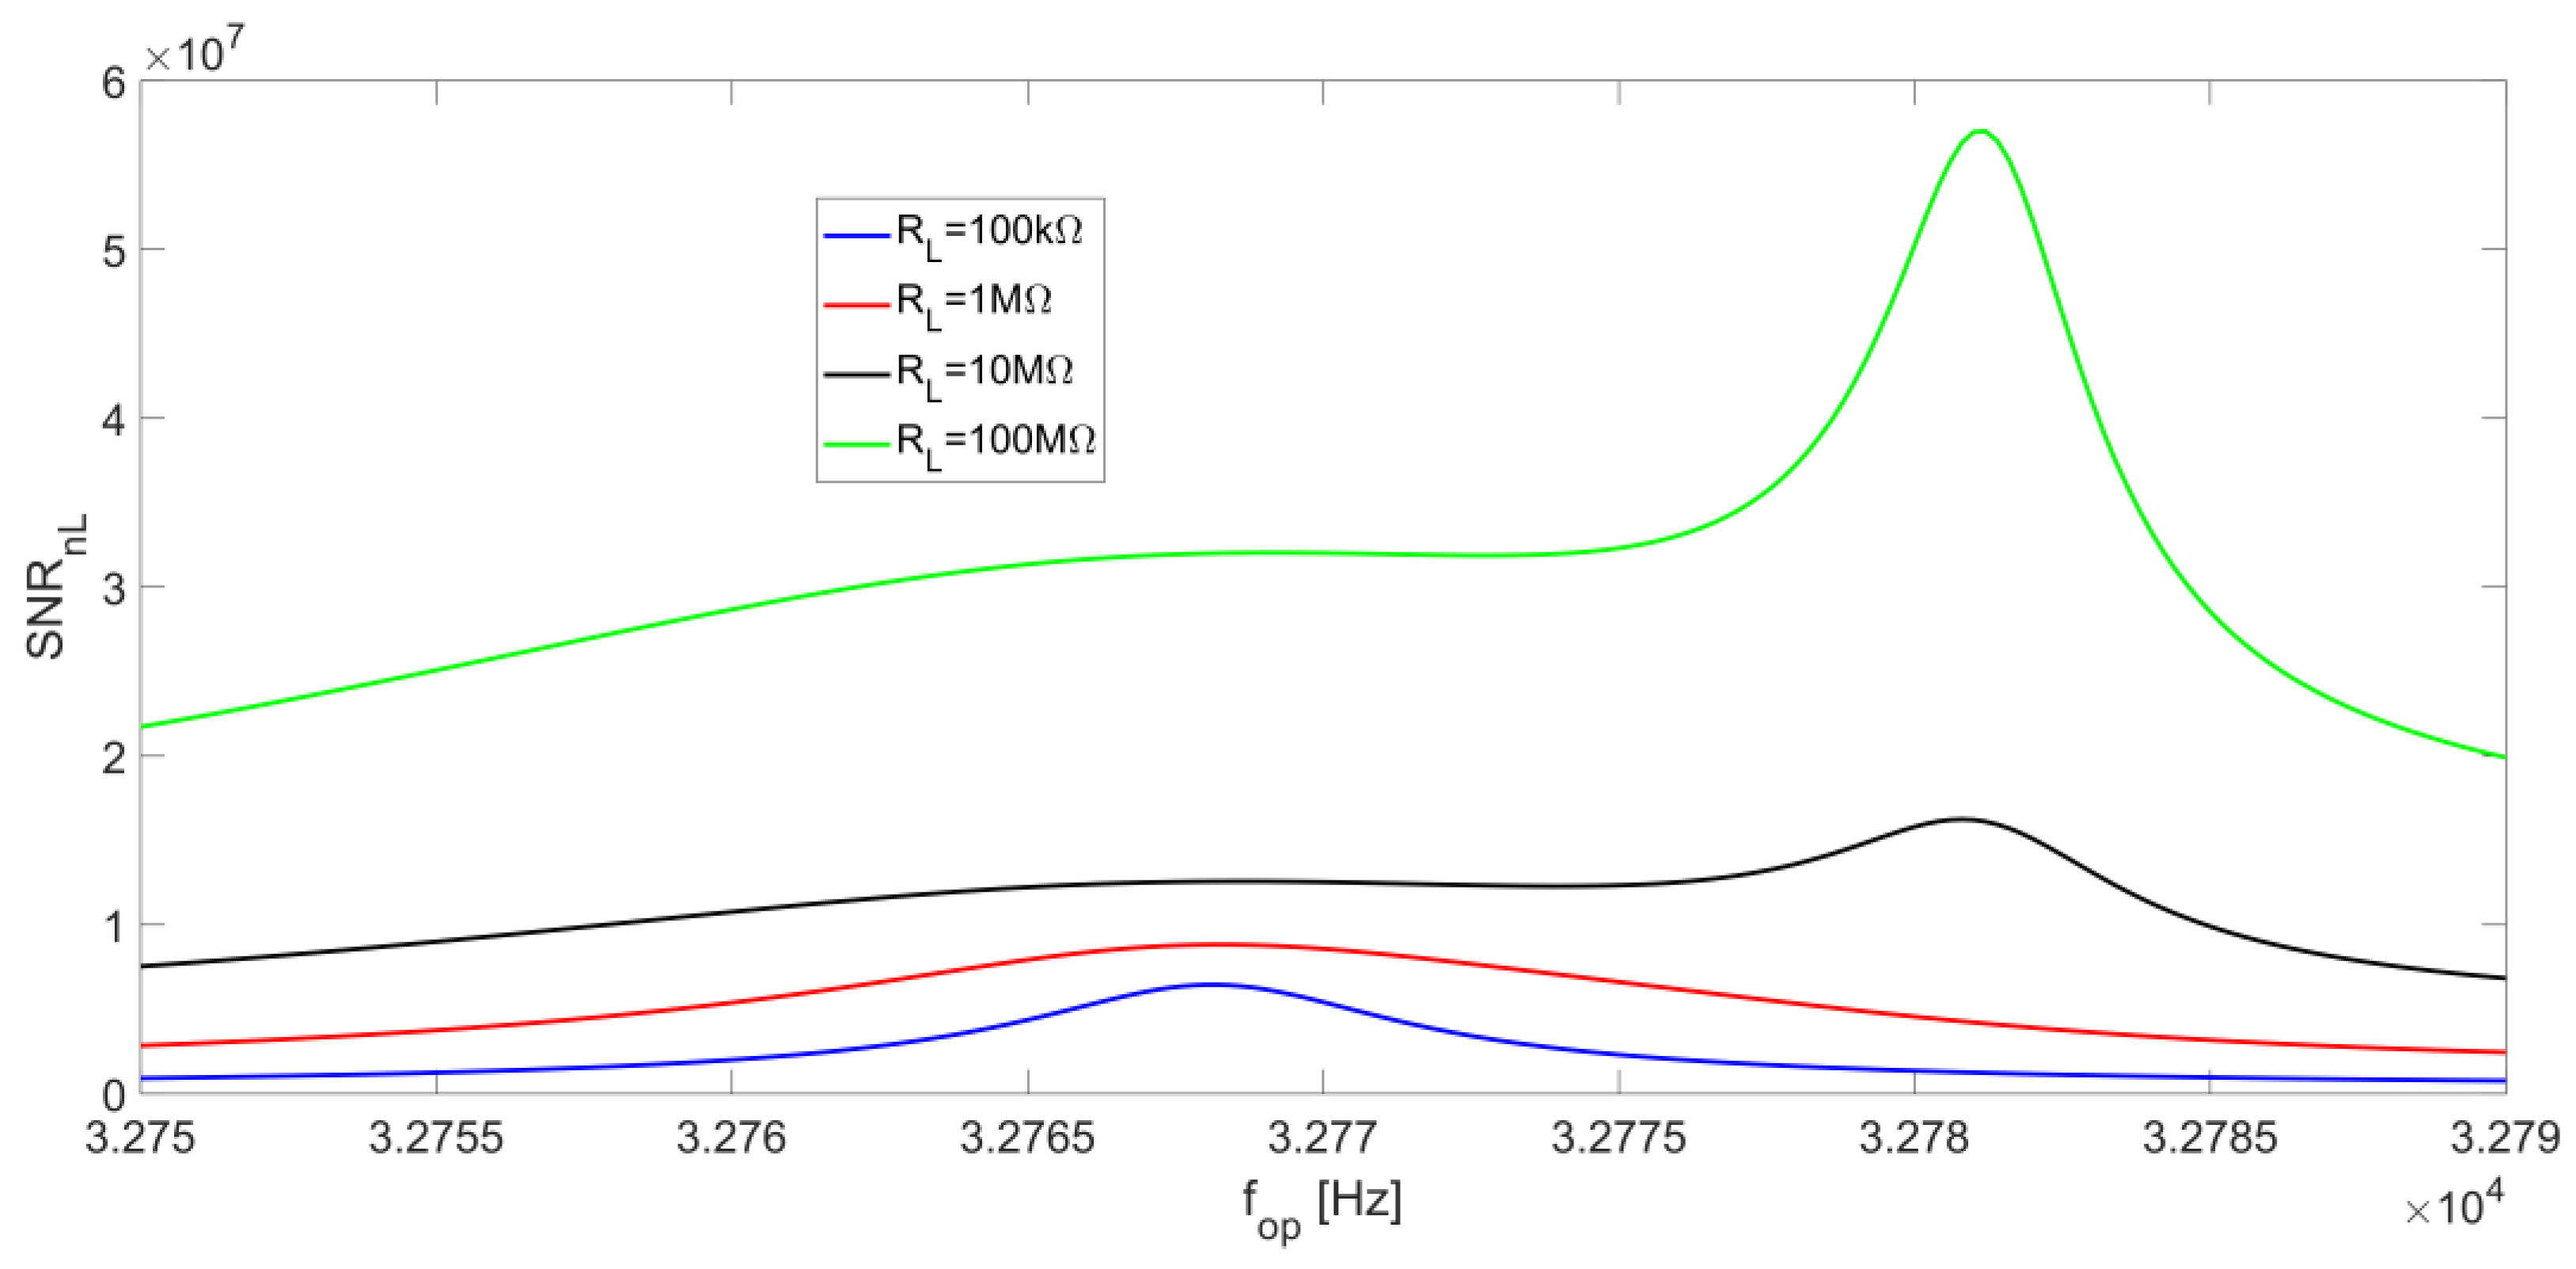
nL tends to be flat. For large values of R
L, S
nL values decrease (see
Figure 12c,d), whereas the peak of the signal placed at f
P increases; as a result, SNR
nL exhibits a peak at f
P, which becomes sharper as R
L increases. The behavior of SNR
nL as a function of the operating frequency f
op is shown in
Figure 18 for BW = 5 Hz.
Finally, from Equation (13),
Figure 19 shows that the peak value of SNR
n results at f
S, where the peak of both SNR
np and SNR
nL is located, for low values of R
L.
For increasing values of R
L, the SNR
n peak feature starts to flatten out until, for values of R
L larger than about 2 MΩ, a peak emerges close to f
P, where both SNR
np and SNR
nL have their maximum value. This peak becomes as sharper as R
L increases, as shown in
Figure 19, which represents the behavior of SNR as a function of f
op for BW = 5 Hz. Additionally in this case, SPICE simulations are in very good agreement with the results provided by the analytical model. The SNR
n peak at 100 MΩ is more than two times higher than the values close to f
s.
Finally, the presented study can be applied to compute the Normalized Noise Equivalent Absorption (NNEA), an important parameter to compare QEPAS sensors [
2,
4,
5,
7,
10]. NNEA is defined as follows:
where P is the laser optical power, α is the absorption coefficient of the gas under investigation, SNR is the signal-to-noise ratio, and Δf is the integration bandwidth.
In [
10], an NNEA of 5.0 × 10
−9 W∙cm
−1/√Hz for the detection of CO
2 in an N
2 mixture, employing a transimpedance amplifier with a 10-MΩ feedback resistor and a narrow-bandwidth LIA filter, was demonstrated. Assuming the same value of NNEA for a voltage preamplifier with a 10-MΩ bias resistor and an integration bandwidth of 0.5 Hz, a 100-MΩ bias resistor and the same integration bandwidth would lead to an NNEA of 4.4 × 10
−9 W·cm
−1/√Hz, thus an improvement of a factor of 1.1, as suggested from
Figure 16.
Considering a 5 Hz LIA filter bandwidth, an NNEA of 5.8 × 10
−9 W∙cm
−1/√Hz can be calculated for a bias resistor of 10 MΩ. An improvement of a 1.4 factor can be calculated when a bias resistor of 100 MΩ is employed, leading to a NNEA of 4.1 × 10
−9 W·cm
−1/√Hz.
Table 2 summarizes the NNEA values obtained for different values of R
L and Δf: it can be observed that increasing R
L at a fixed filter bandwidth always results in an improvement of the NNEA.
5. Discussion and Conclusions
In this work, we investigated the SNR trend as a function of the operating frequency for a voltage-mode read-out of QTFs, comparing the results obtained by the developed model with SPICE simulations. The effects of the RL values, the operating frequency, and the bandwidth of the LIA low-pass filter on the overall SNR were investigated. We firstly demonstrated that the contribution of the OPAMP to the output noise of the voltage preamplifier can be always neglected and the output noise power density is dominated by the contributions of the QTF-equivalent resistor Rp and RL. Moreover, the dominant contribution to the total noise changes from RL, when RL < 10 MΩ, to Rp, for RL > 10 MΩ.
According to our model, the peak value of the SNR tends to increase along with the bias resistor RL.
When a narrowband low-pass filter of the LIA is employed (e.g., bandwidth of 0.5 Hz), the curves shown in
Figure 16 suggest that only a limited increase of the SNR can be obtained by either increasing the value of the resistor R
L or varying the operating frequency. For R
L < 10 MΩ, the best operating frequency for the QEPAS technique is the series-resonant frequency of the QTF f
S, where SNR function exhibits a peak value. This peak becomes less pronounced when R
L is increased. A 10-MΩ bias resistor ensures a 1.3 times higher SNR at the series-resonant frequency f
S, with respect to a 100 kΩ-bias resistor. For large values of R
L, SNR tends to be flat around f
S and a small peak emerges at the parallel-resonant frequency f
P. For instance, increasing the value of R
L up to 100 MΩ leads to a further increase of the SNR peak by a factor of 1.4. Thus, for these large values of R
L, the choice of the optimal operating frequency for QEPAS is not very critical, in case of a narrow-band LIA filter.
When a wider LPF bandwidth of the LIA is employed (e.g., bandwidth of 5 Hz), the SNR peak as a function of the operating frequency is still placed at f
S for small values of R
L, as in the case of narrow-band filter (see
Figure 19). For large values of R
L, the SNR peak at f
P tends to be sharper as compared to the case of narrow-band LIA filter, thus the operating frequency for the QEPAS technique must be chosen as close as possible to f
P to maximize SNR. As an example, for R
L = 100 MΩ, the SNR peak is 1.4 times higher with respect to R
L =10 MΩ.
In addition, the parallel-resonant frequency fP of the QTF depends on the input capacitance of the OPAMP, so it is not an intrinsic property of the sensitive element. Thus, suitable techniques must be used to measure fP in presence of Cin to exploit large values of RL, increase SNR, and optimize the performance of the QEPAS sensor, especially when short acquisition times are needed. Instead, for long acquisition times, large values of RL are not very effective for the increase of the overall SNR, and an accurate setting of the operating frequency close to fs is not critical because of the flatness of SNR as a function of fop. Of course, the value of RL cannot be made too large, since the input bias current of the OPAMP would cause unacceptable input offset levels. All the results obtained with the previous analysis have been confirmed by AC and noise SPICE simulations of the voltage preamplifier followed by a band-pass filter with center frequency fop and variable bandwidth.
Since, in QEPAS applications, several QTFs have been employed [
1,
2,
3,
4,
5,
6,
7,
8,
9,
10,
11,
12,
13,
14], the same study has also been carried out for a representative QTF characterized by an f
S = 12.484 kHz and a quality factor of 10
4 [
9], and the same results were found.
The reported voltage amplifier, implementing the AD8067, will be employed to validate the results obtained both with our model and with the SPICE simulation.


