
An Ankle Joint Flexion and Extension Movement-Monitoring Device Based on Pressure Sensors


Abstract
:1. Introduction
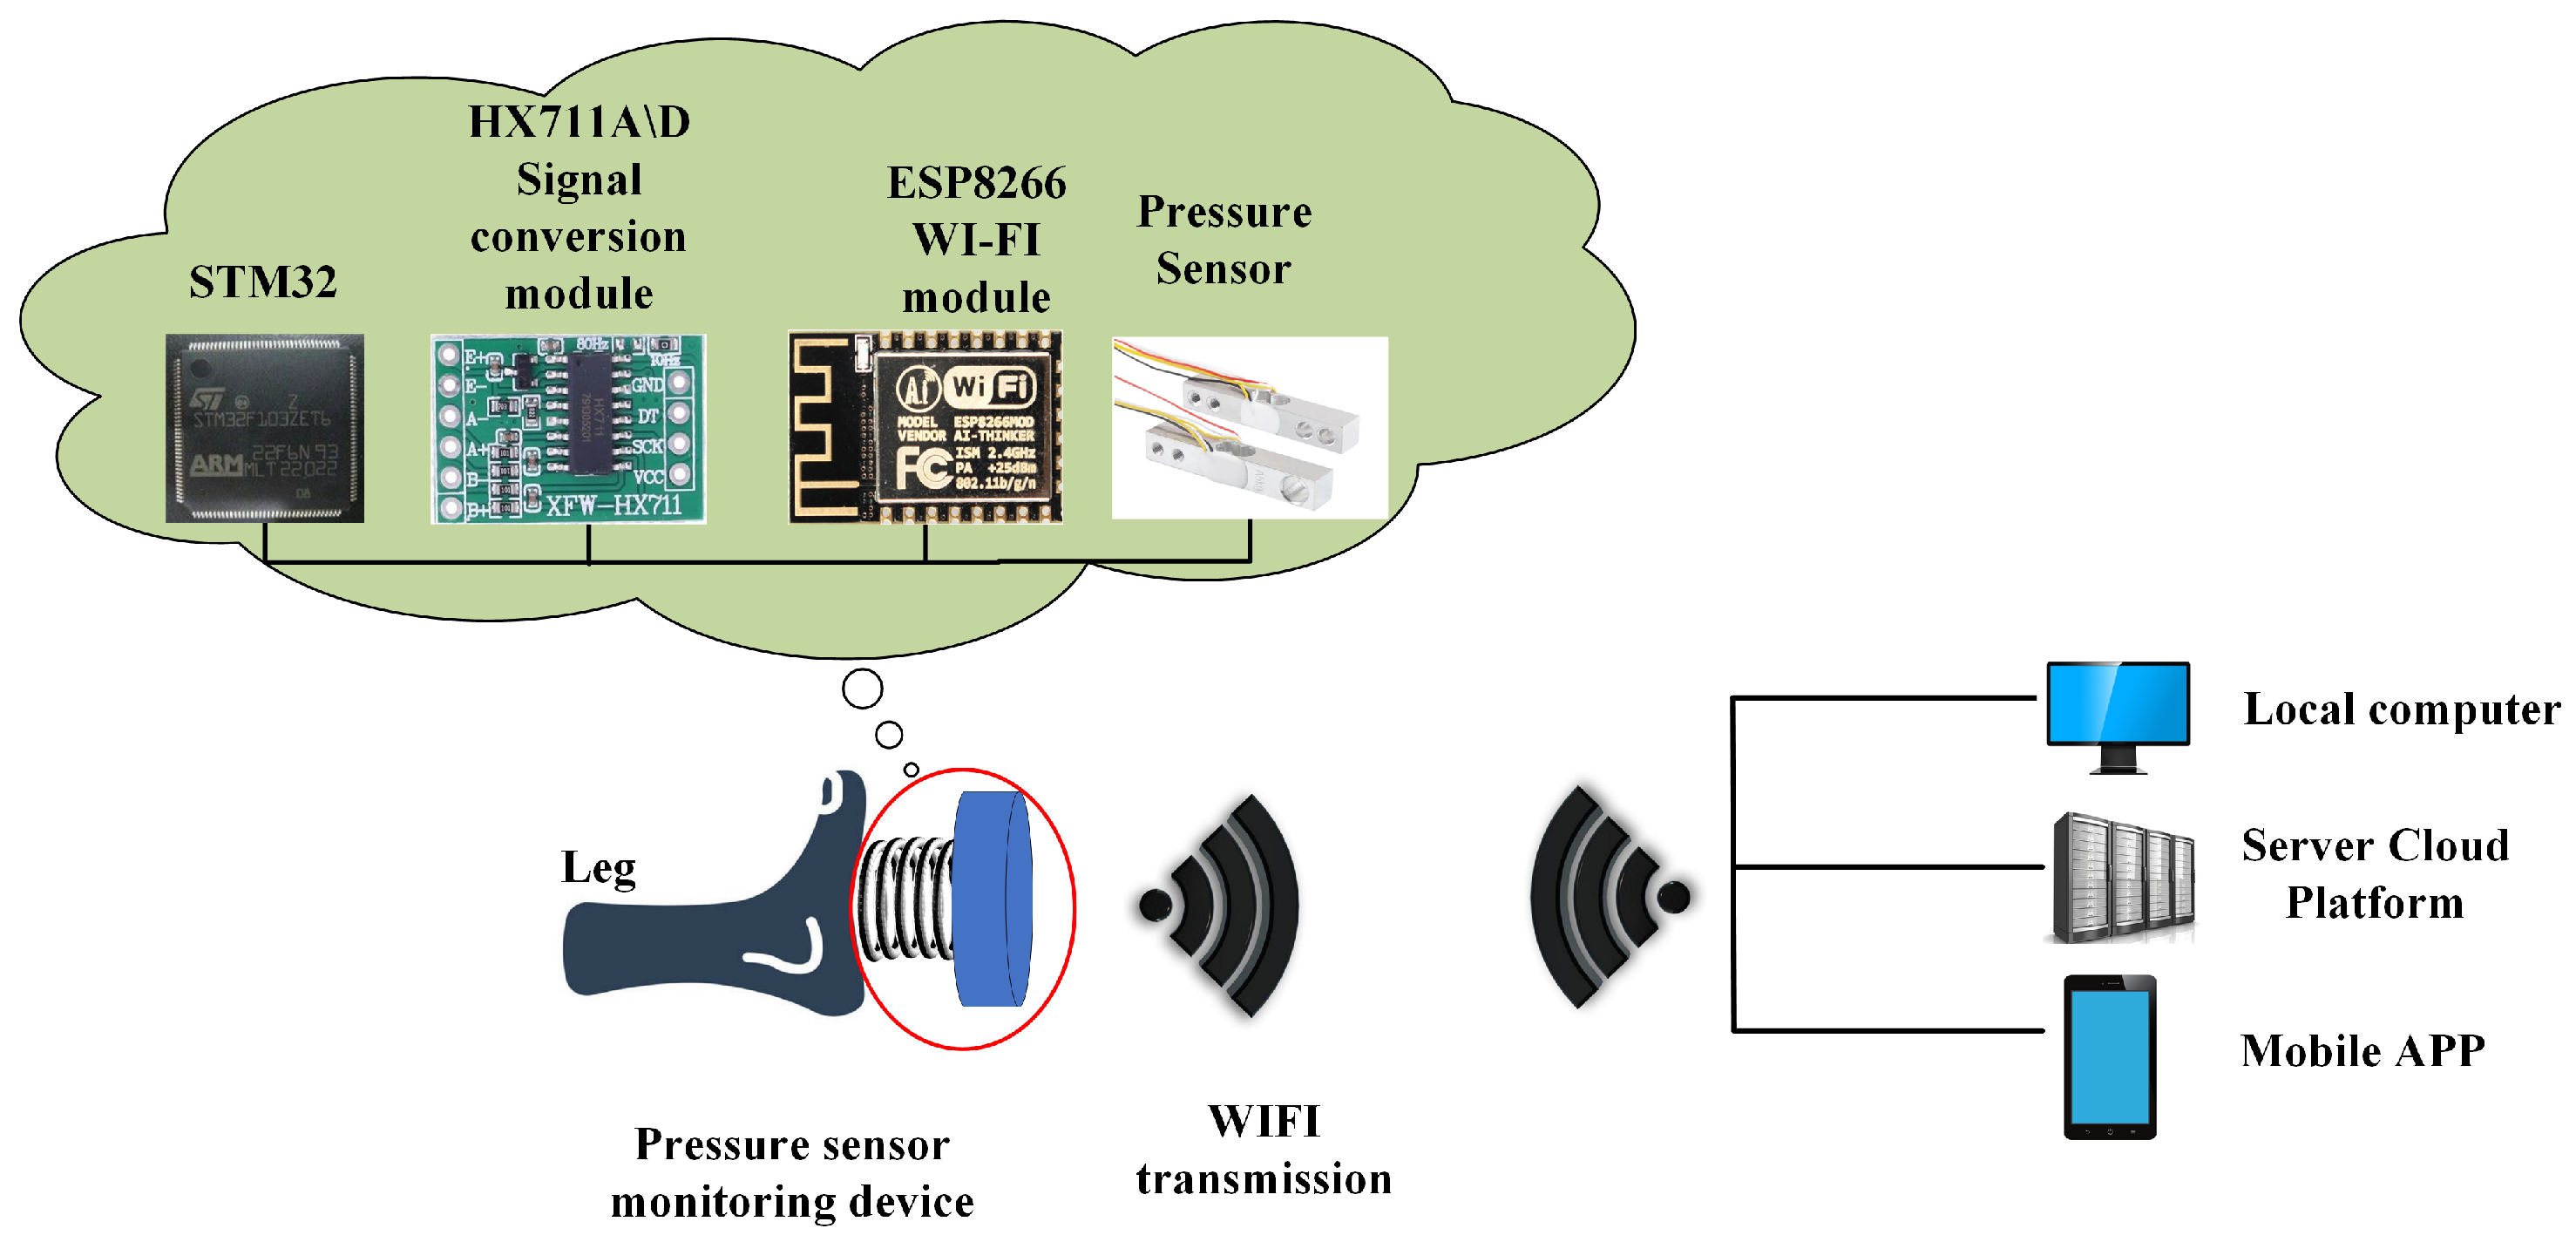
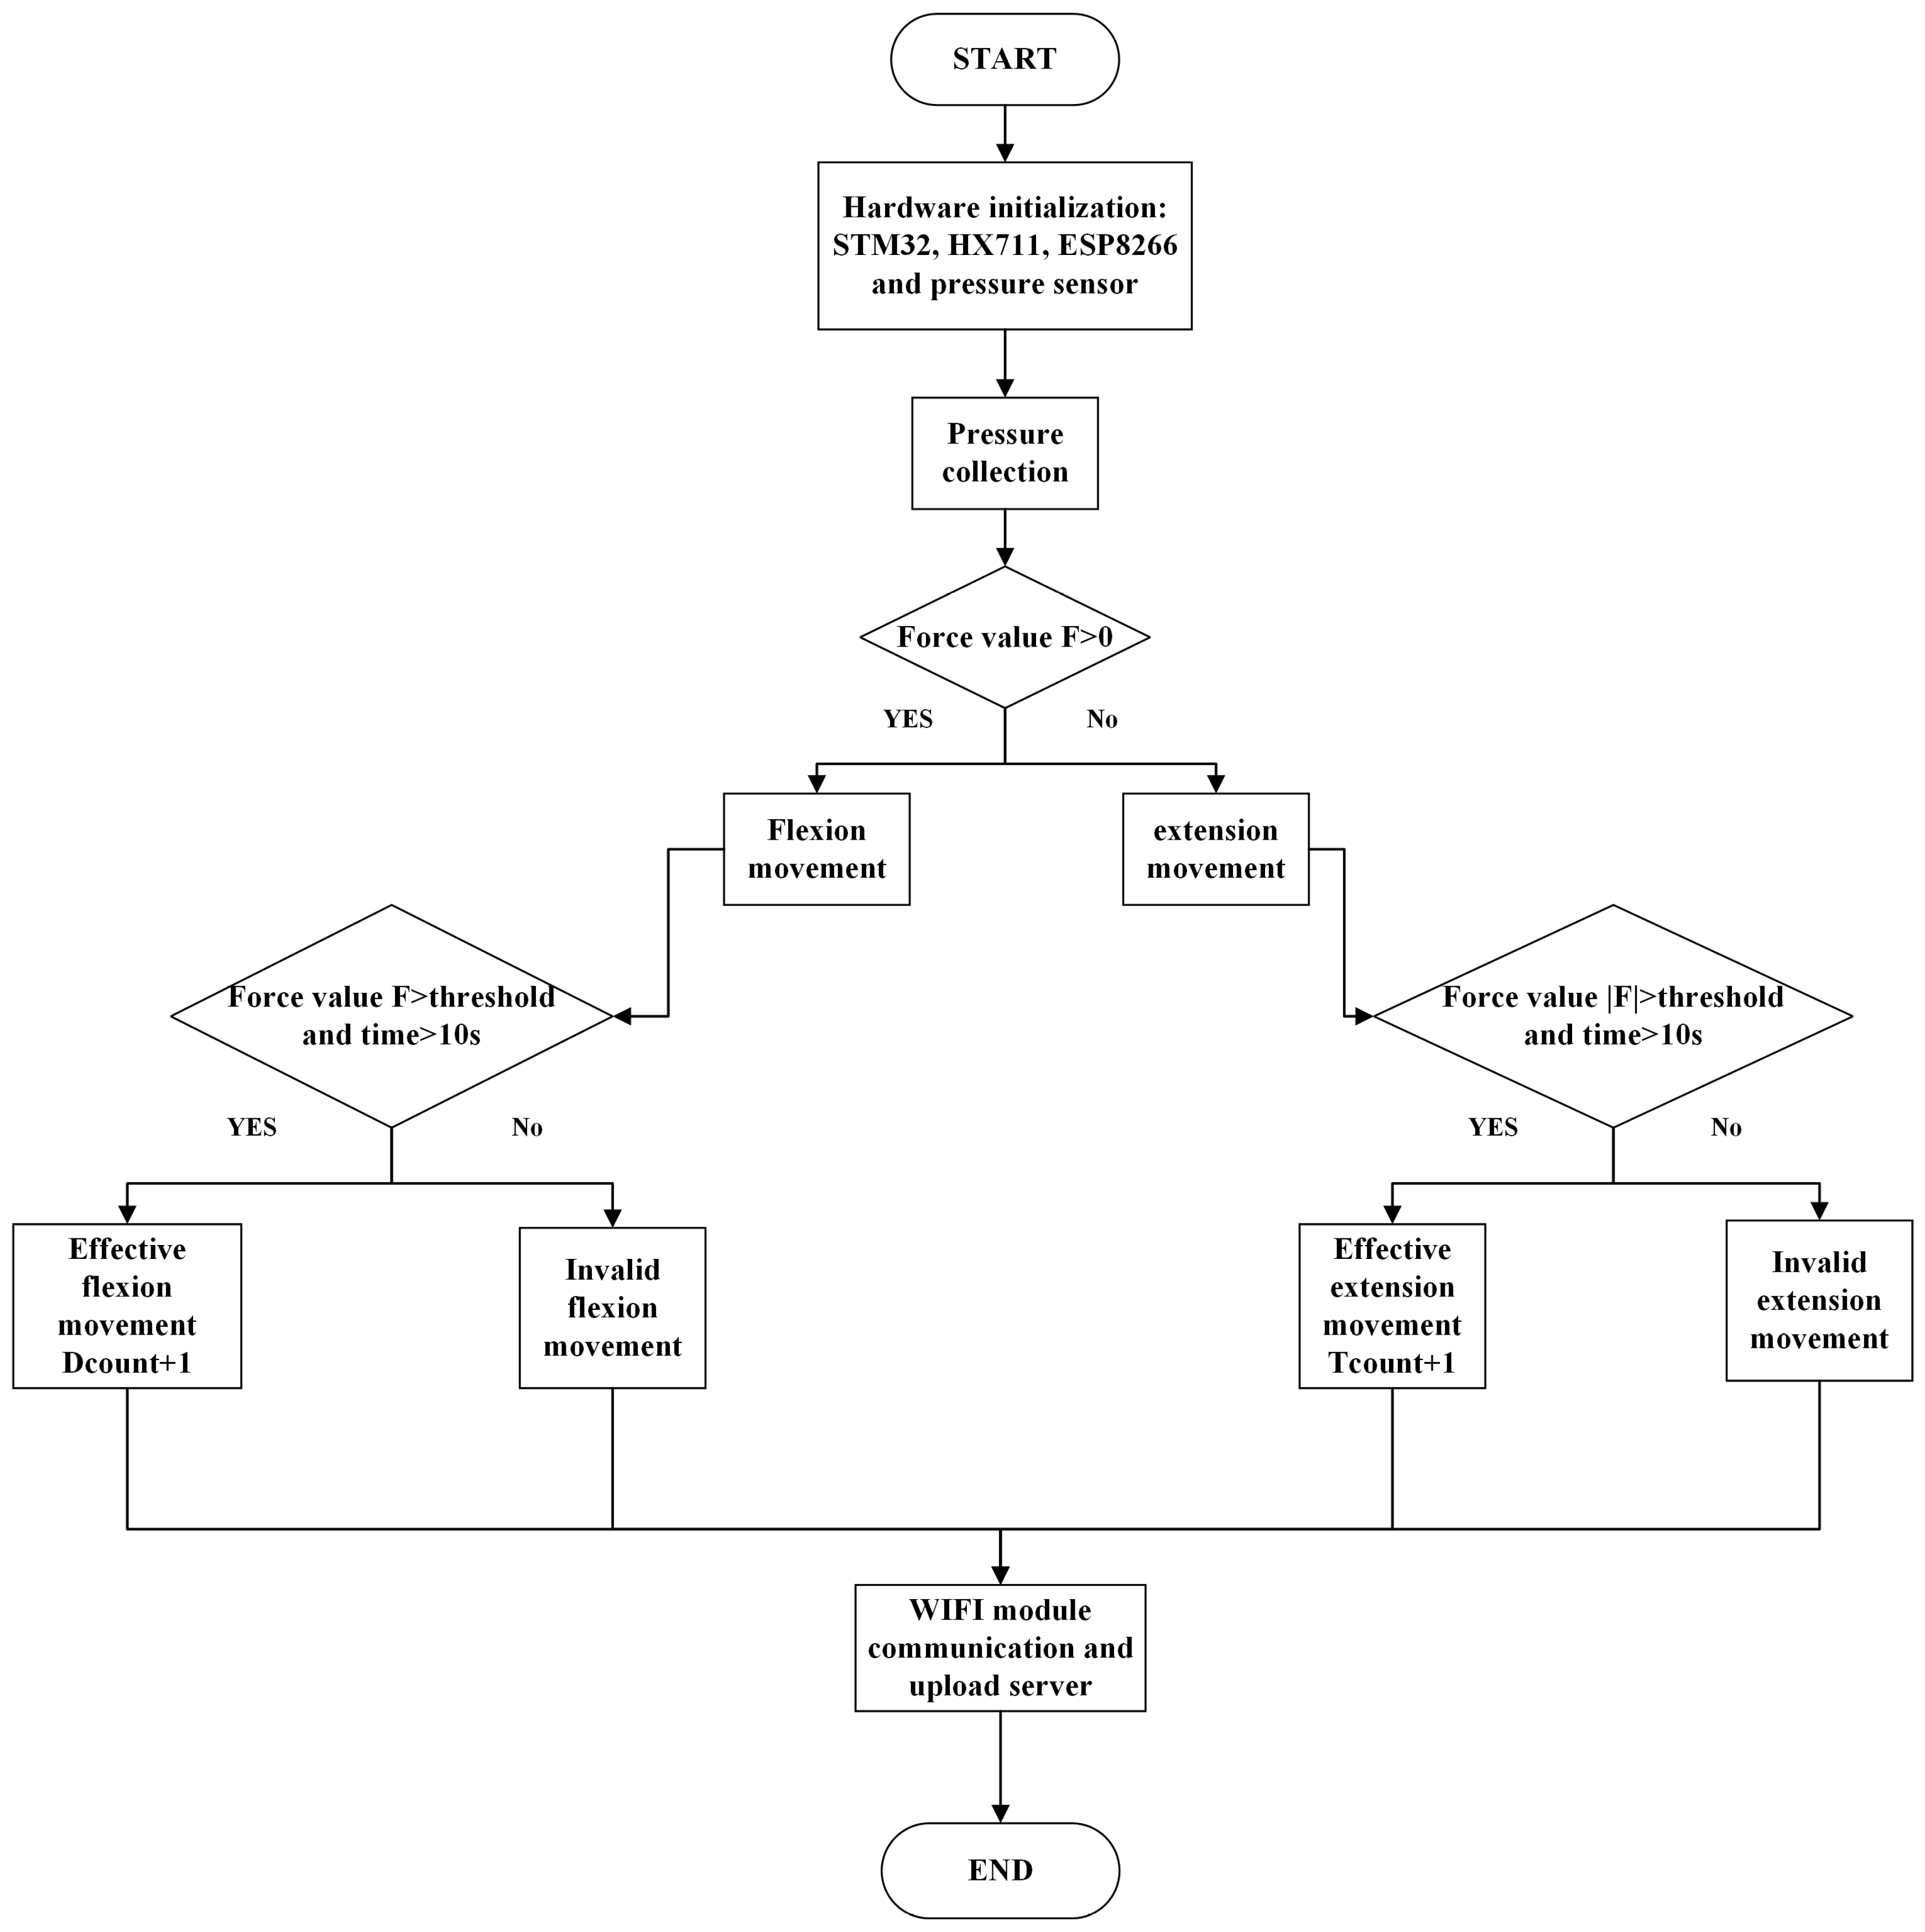
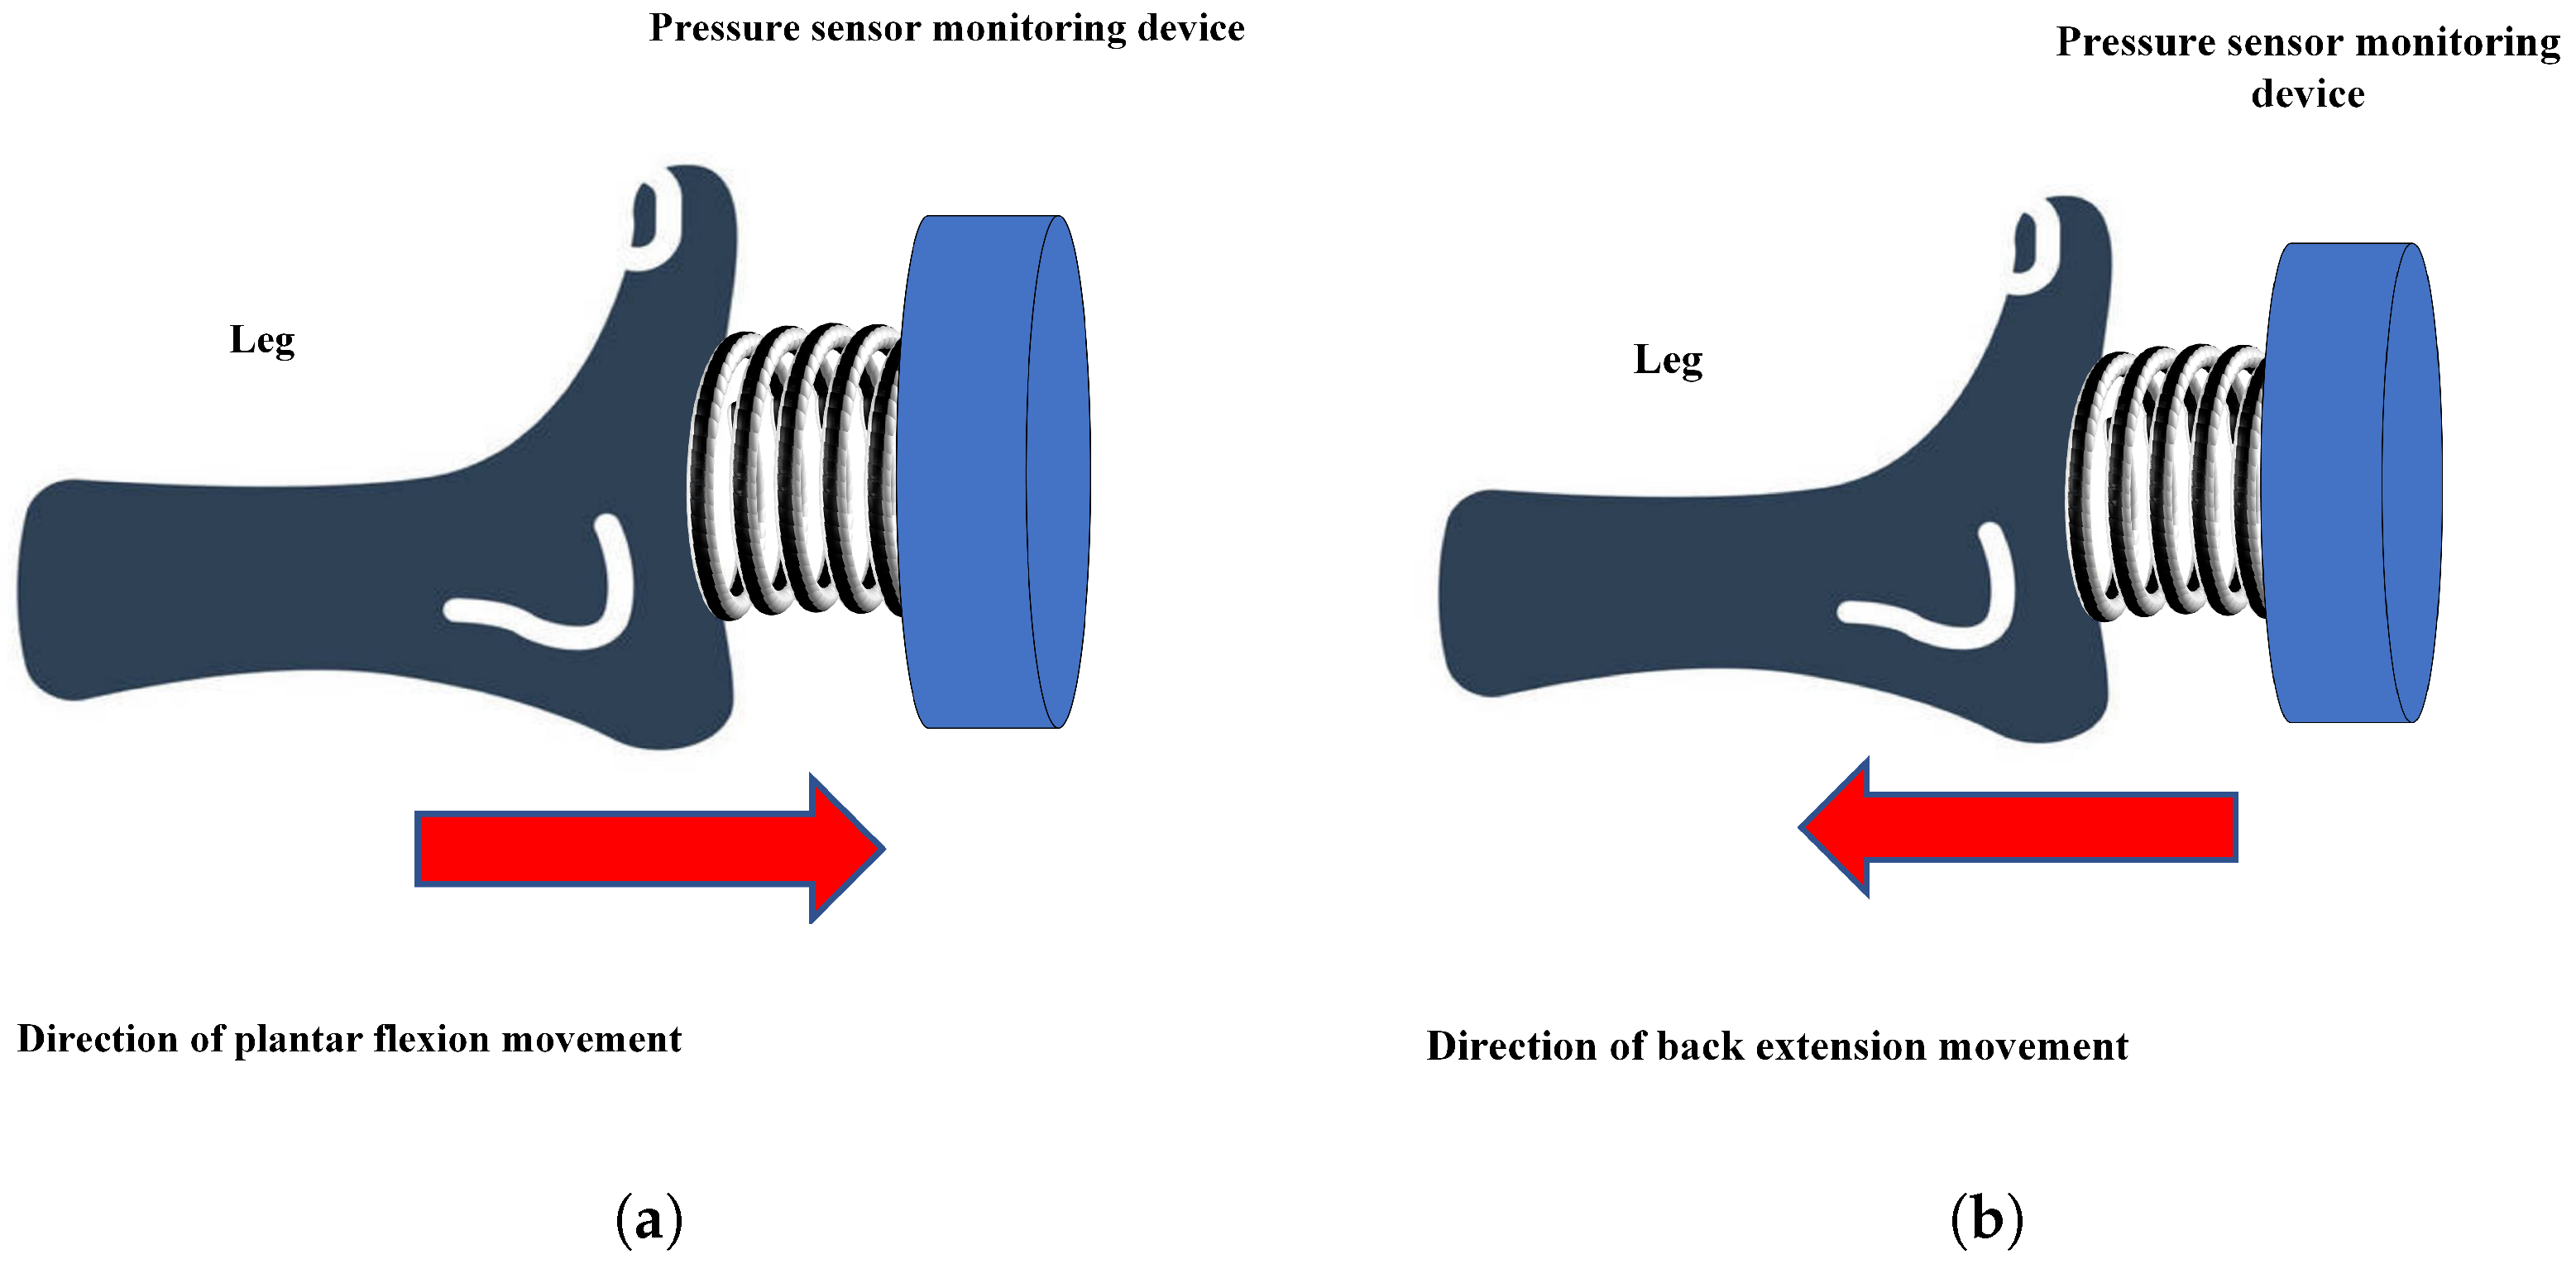
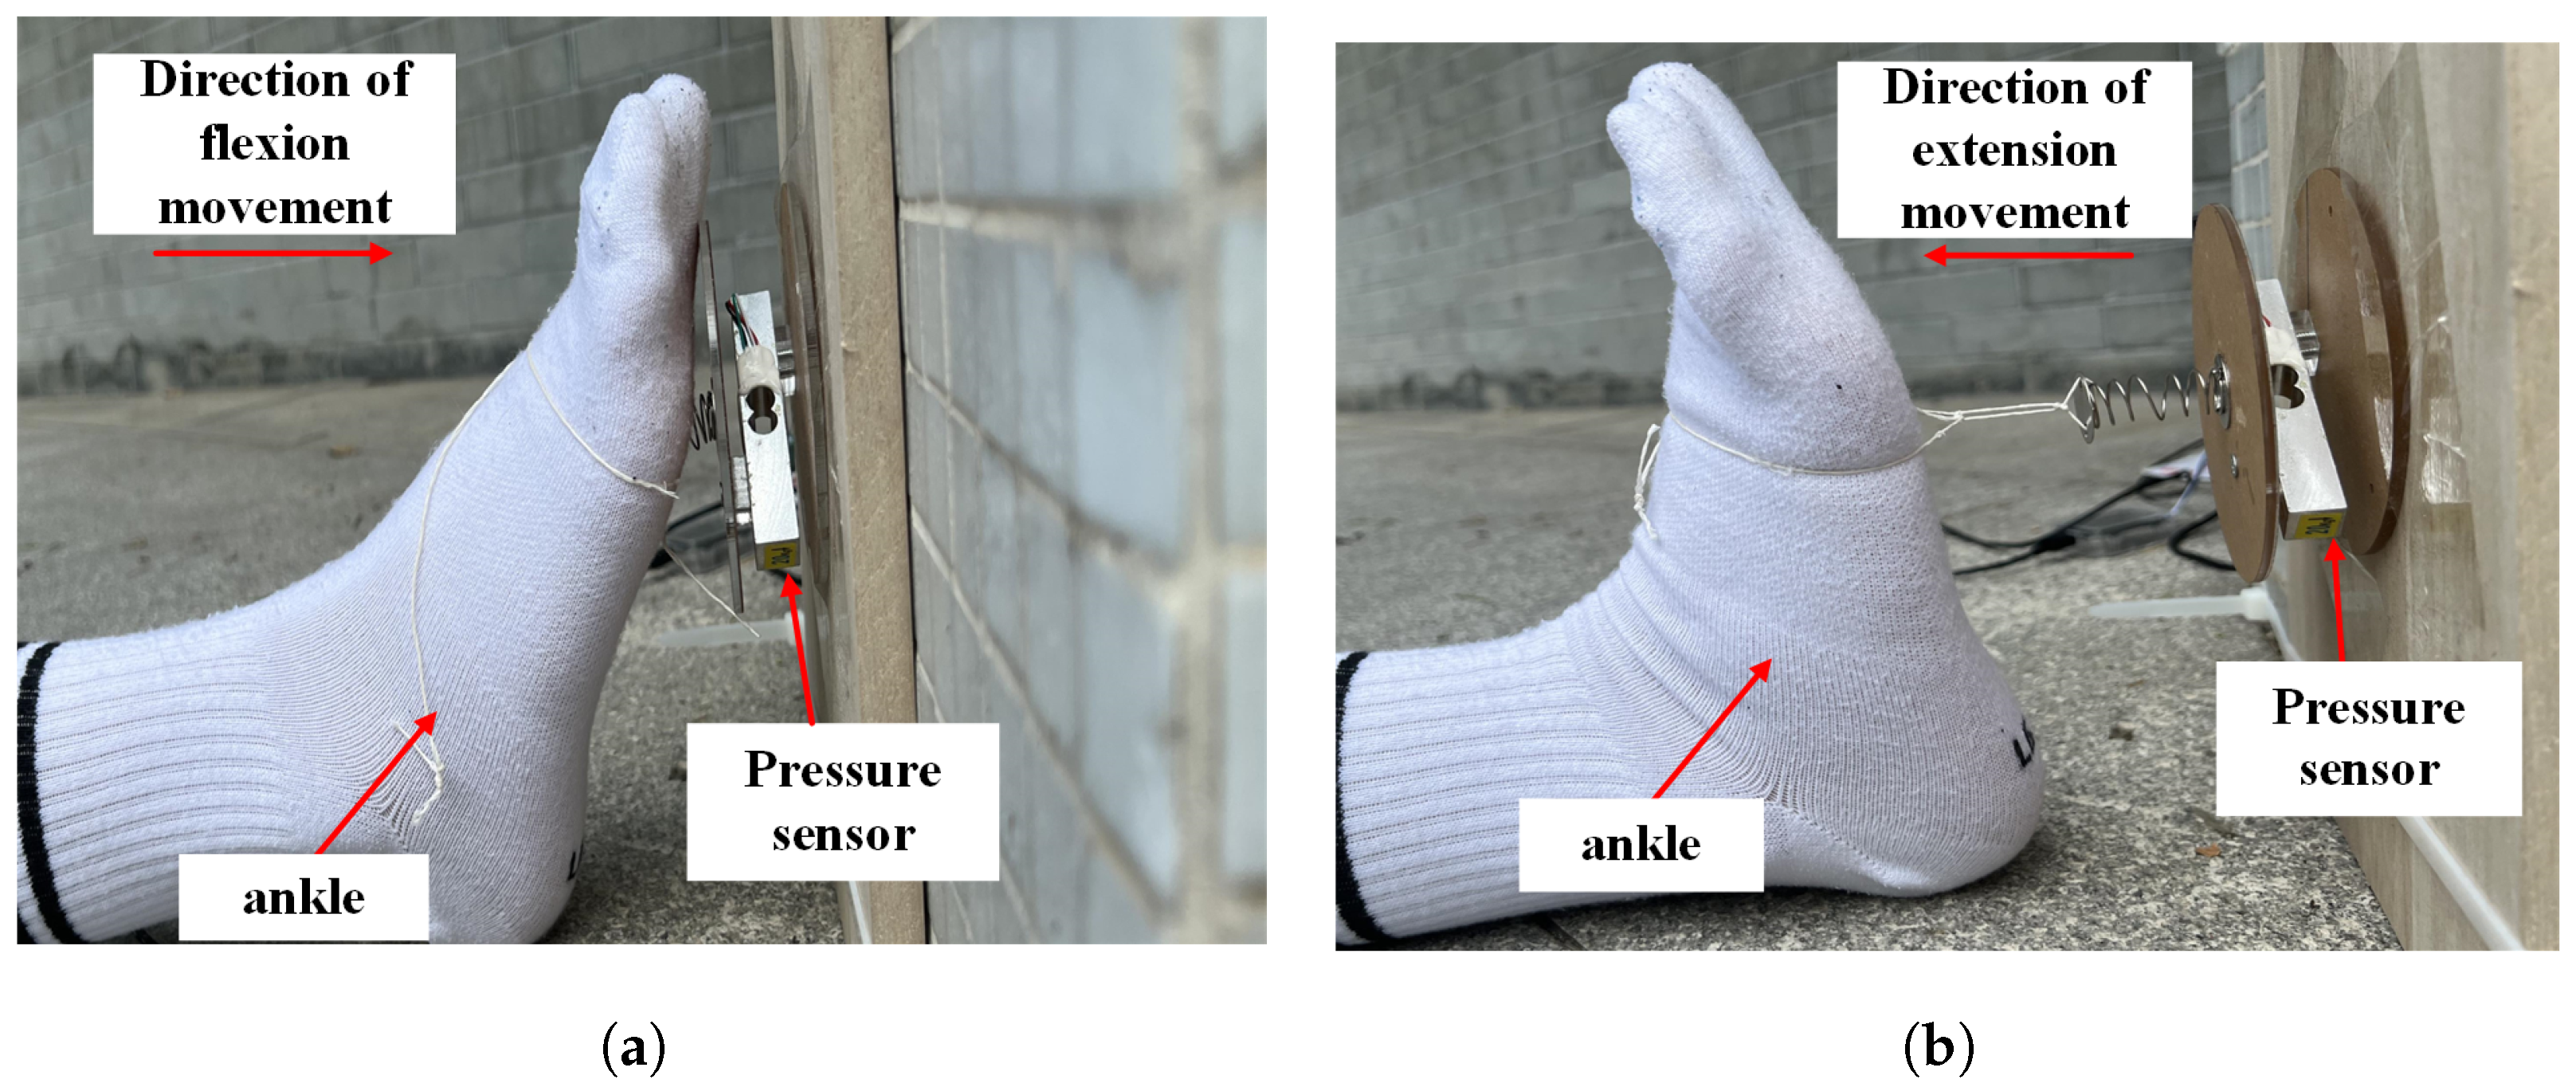
2. Method
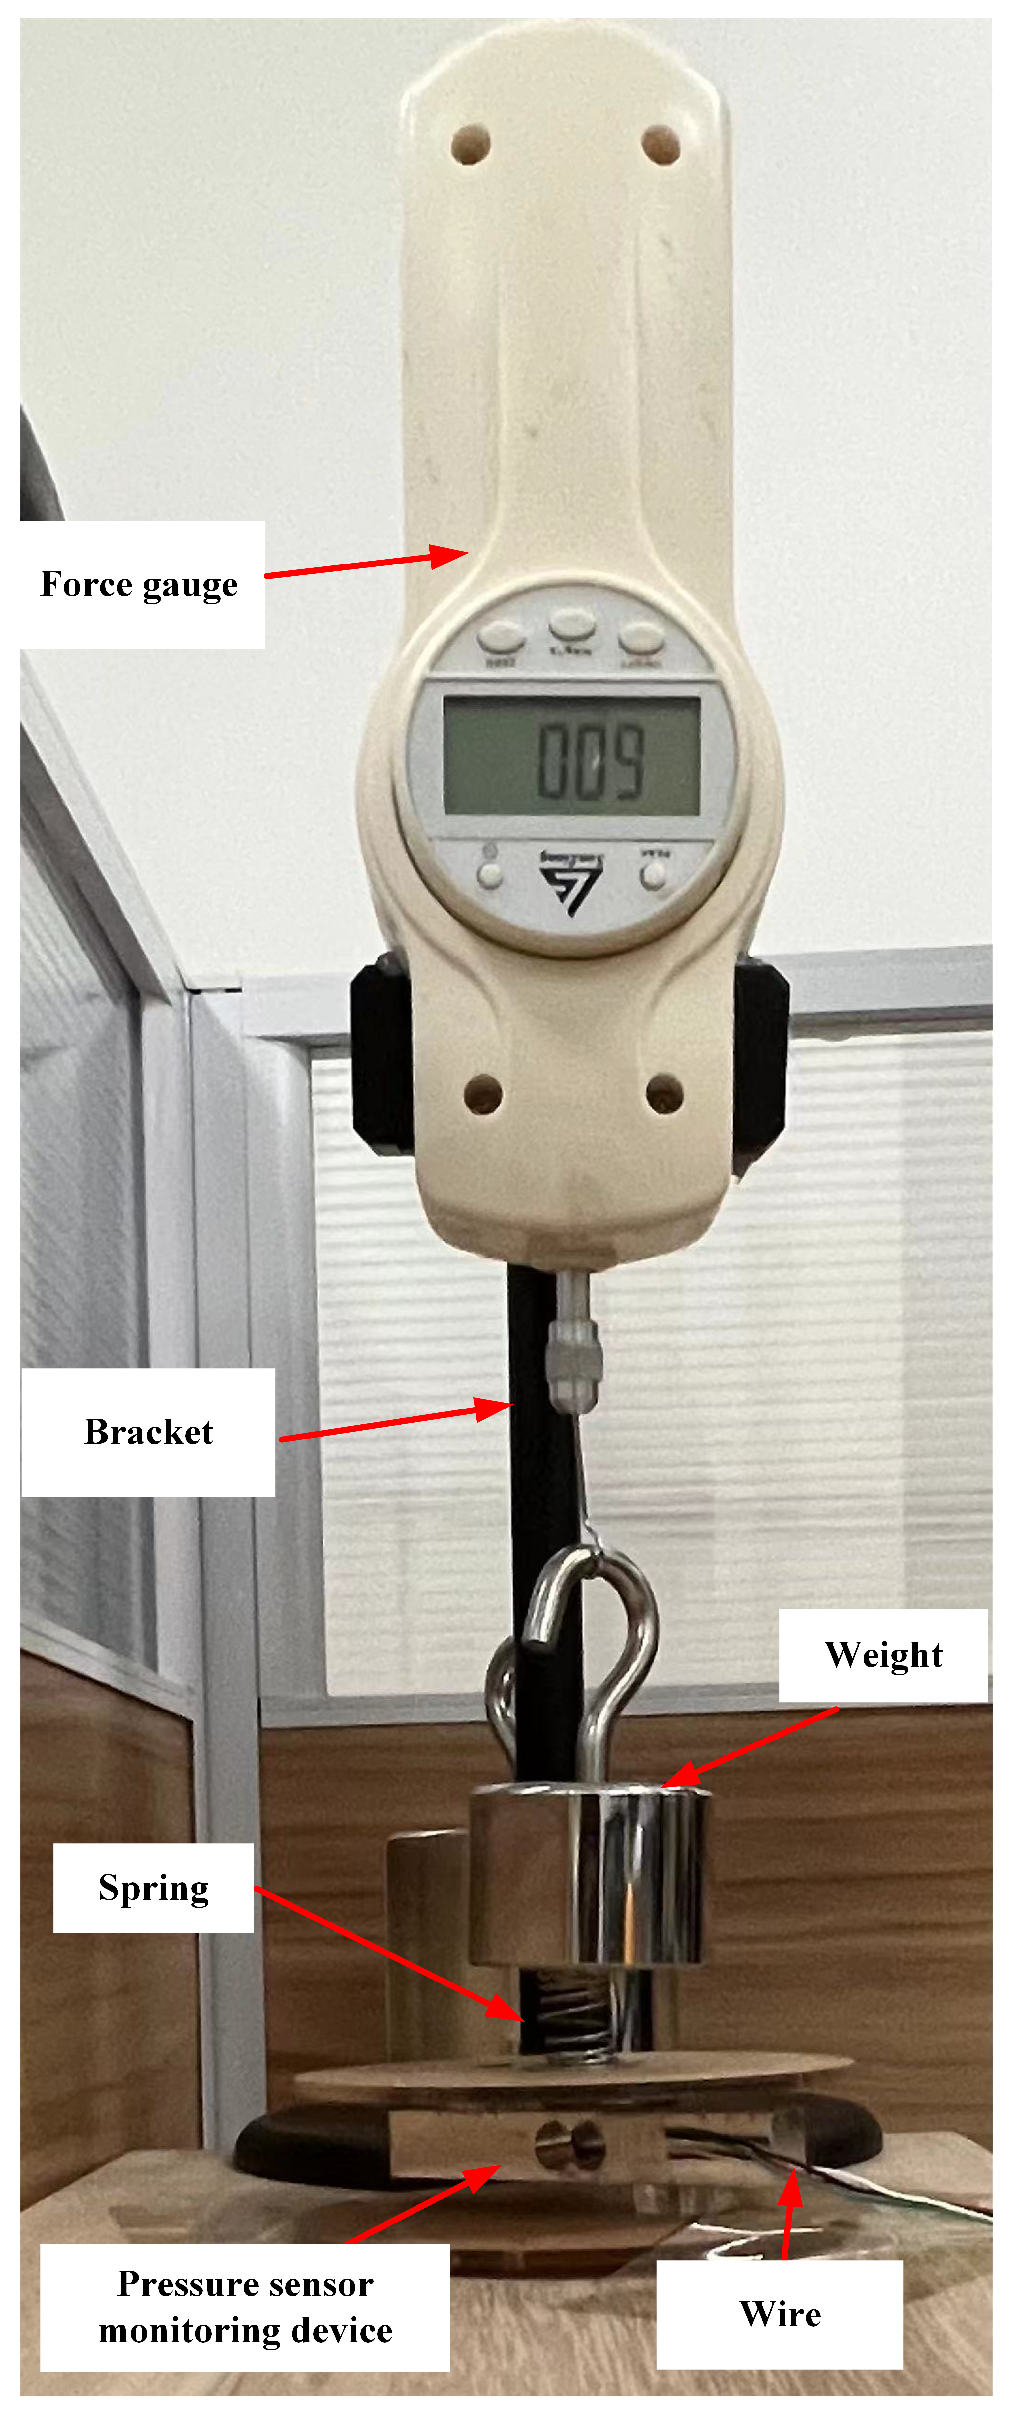
3. Experiment and Accuracy Analysis
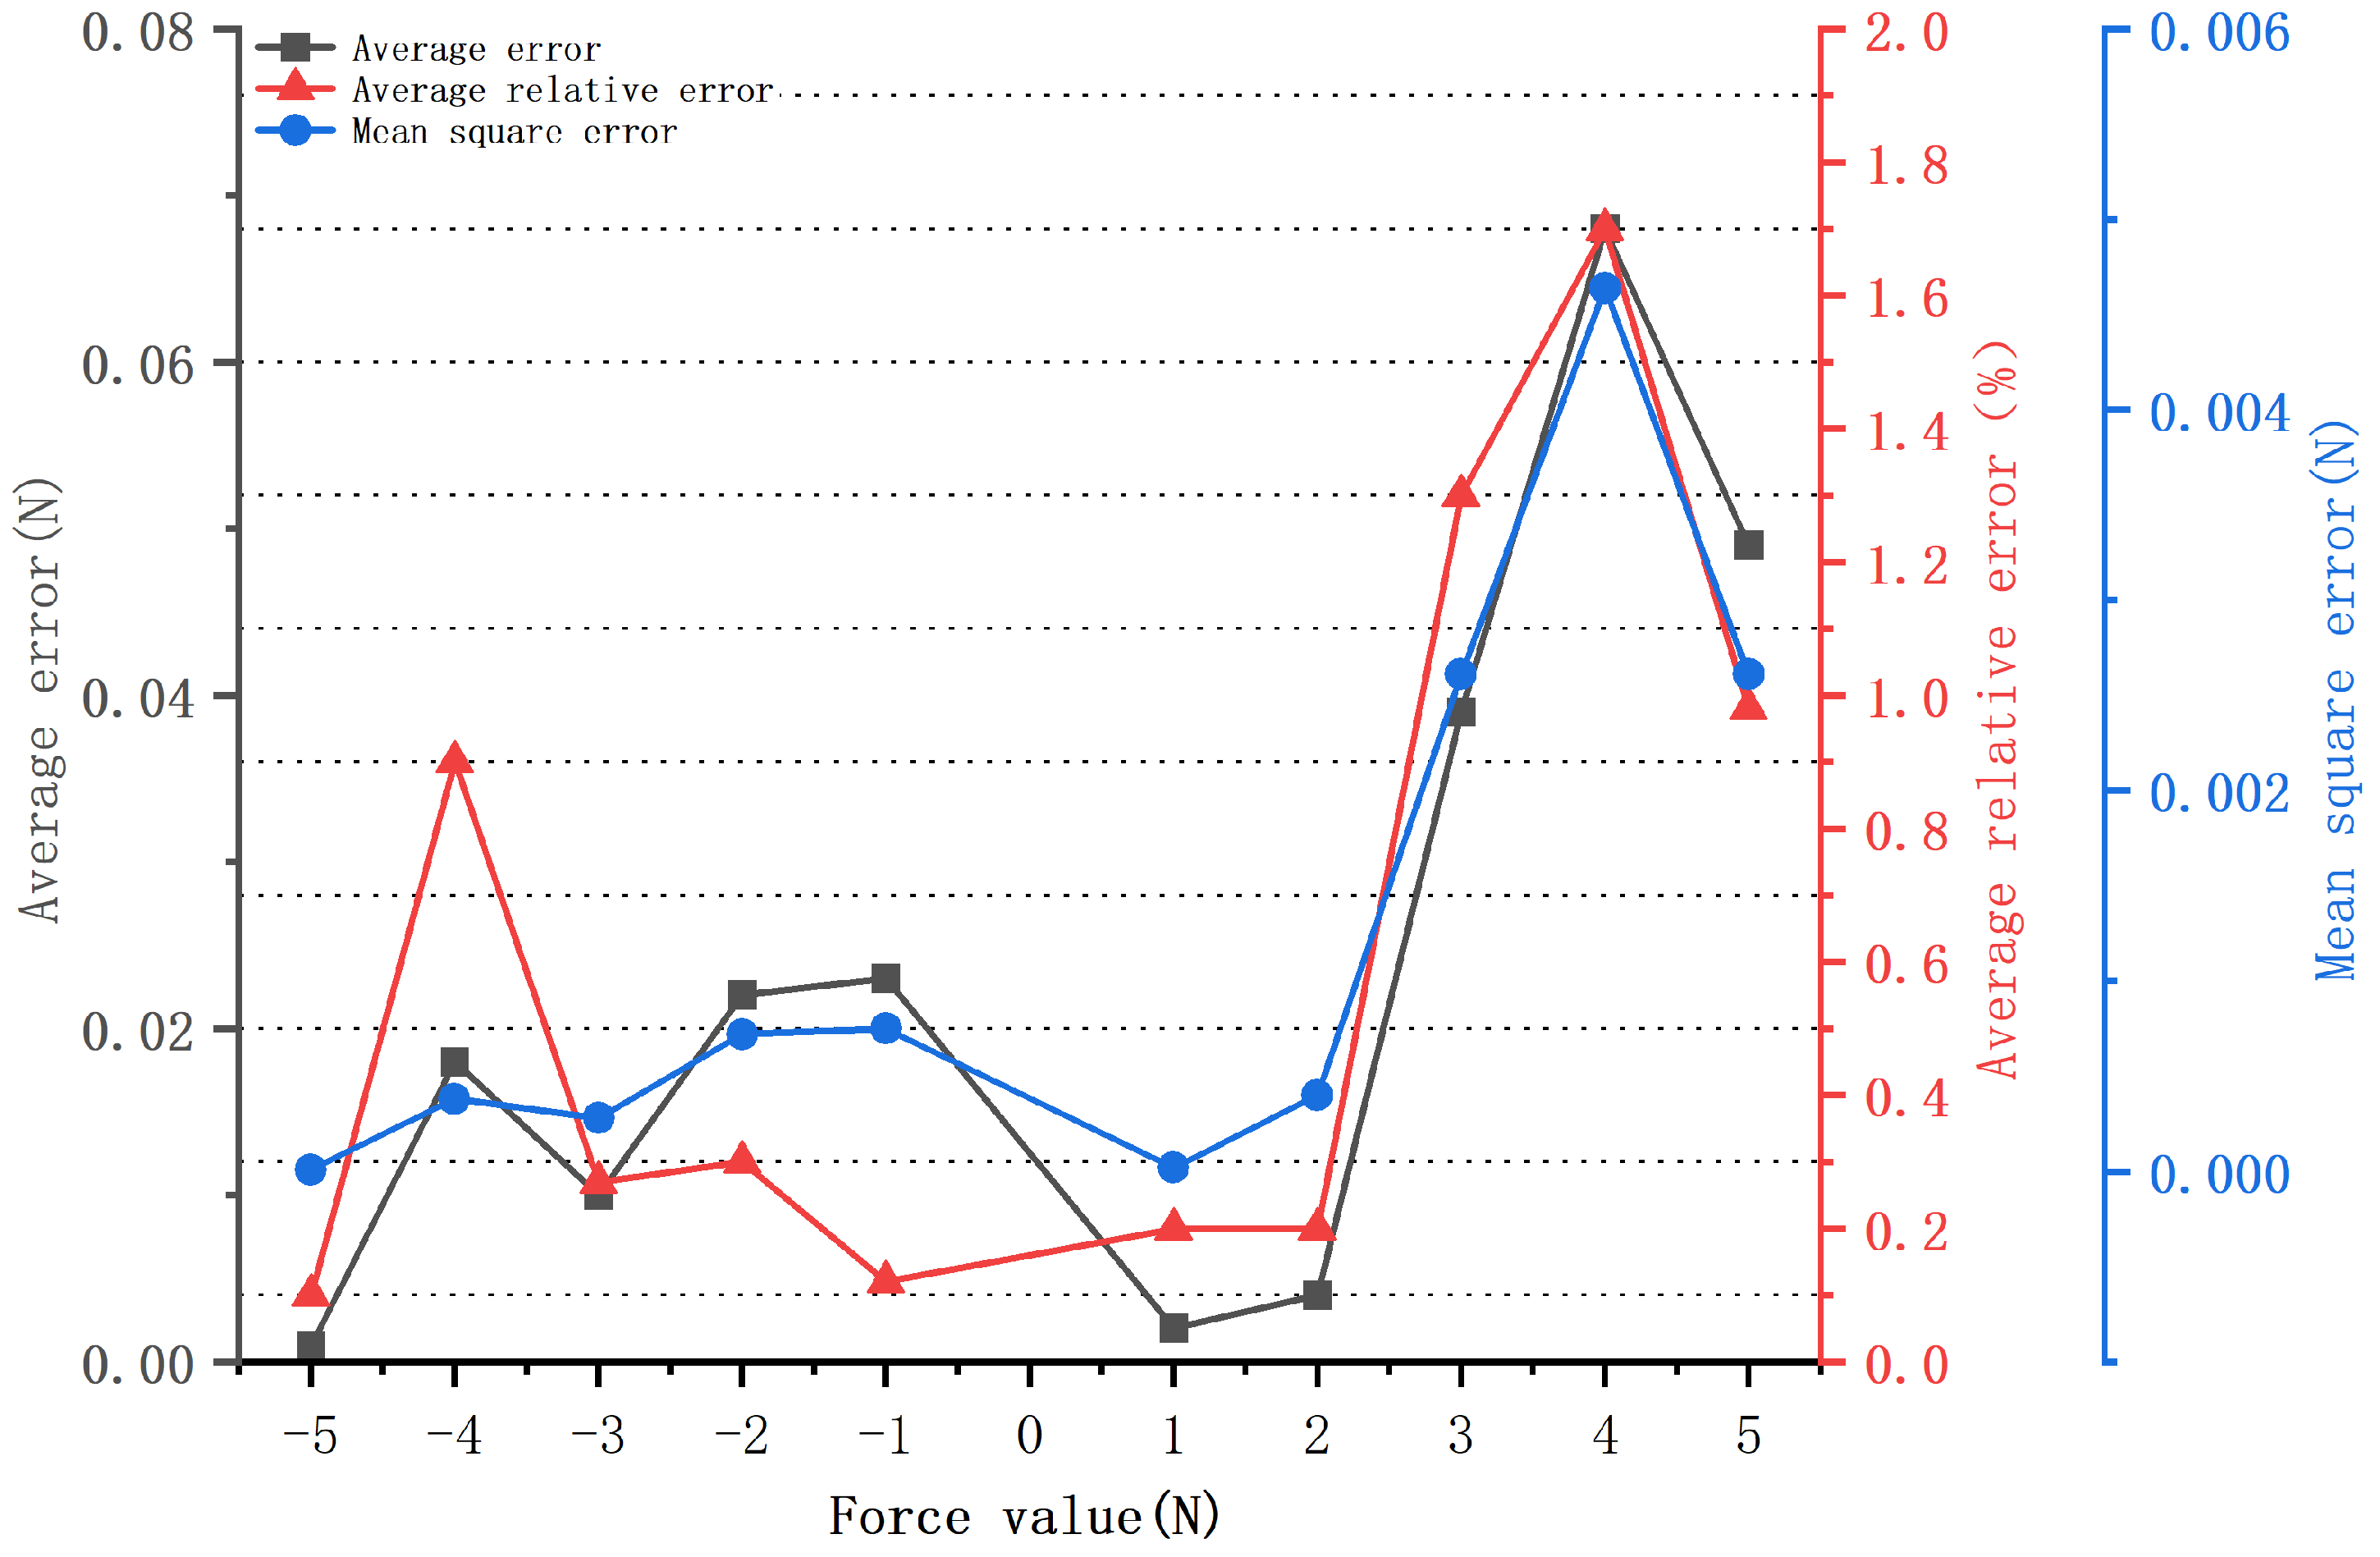
3.1. Analysis of Extension Movement Accuracy
3.2. Analysis of Flexion Movement Accuracy
3.3. Experimental Data Record of Ankle Joint Flexion and Extension Movement
4. Conclusions
Author Contributions
Funding
Institutional Review Board Statement
Informed Consent Statement
Data Availability Statement
Conflicts of Interest
References
- Shimizu, Y.; Kamada, H.; Sakane, M.; Aikawa, S.; Mutsuzaki, H.; Tanaka, K.; Mishima, H.; Kanamori, A.; Nishino, T.; Ochiai, N.; et al. A novel exercise device for venous thromboembolism prophylaxis improves venous flow in bed versus ankle movement exercises in healthy volunteers. J. Orthop. Surg. 2017, 25, 2309499017739477. [Google Scholar] [CrossRef] [PubMed]
- Brindle, T.J.; Lebiedowska, M.K.; Miller, J.L.; Stanhope, S.J. The influence of ankle joint movement on knee joint kinesthesia at various movement velocities. Scand. J. Med. Sci. Sports 2010, 20, 262–267. [Google Scholar] [CrossRef] [PubMed]
- Westrich, G.H.; Specht, L.M.; Sharrock, N.E.; Windsor, R.E.; Sculco, T.P.; Haas, S.B.; Trombley, J.F.; Peterson, M. Venous haemodynamics after total knee arthroplasty: Evaluation of active dorsal to plantar flexion and several mechanical compression devices. J. Bone Jt. Surg. Br. 1998, 80-B, 1057–1066. [Google Scholar] [CrossRef]
- yeon Yoon, J.; Seop Oh, J.; hyun An, D. Three-Dimensional Analysis of Foot Motion after Uphill Walking with Mobilization with Movement Using Tape Applied to the Talocrural Joint in Women with Limited Ankle Dorsiflexion. Foot Ankle Int. 2014, 35, 1217–1225. [Google Scholar] [CrossRef] [PubMed]
- Kim, B.H.; Hong, S.H.; Oh, I.W.; Lee, Y.W.; Kee, I.H.; Lee, S.Y. Measurement of Ankle Joint Movements Using IMUs during Running. Sensors 2021, 21, 4240. [Google Scholar] [CrossRef] [PubMed]
- Knyazev, A.A.; Yatsun, S.F.; Fedorov, A.V. Control of a Device for Mechanotherapy of the Ankle Joint. Biomed. Eng. 2023, 56, 392–396. [Google Scholar] [CrossRef]
- Al-Quraishi, M.S.; Ishak, A.J.; Ahmad, S.A.; Hasan, M.K. Impact of feature extraction techniques on classification accuracy for EMG based ankle joint movements. In Proceedings of the 2015 10th Asian Control Conference (ASCC), Kota Kinabalu, Malaysia, 31 May–3 June 2015; pp. 1–5. [Google Scholar] [CrossRef]
- Toda, H.; Kawamoto, H. Device Design of Ankle Joint Stretching System Controlled by the Healthy Side Ankle Joint Movement for Self-Rehabilitation. J. Robot. Mechatron. 2023, 35, 556–564. [Google Scholar] [CrossRef]
- Zhetenbayev, N.; Balbayev, G.; Iliev, T.; Bakhtiyar, B. Exoskeleton for the ankle joint design and control system. In Proceedings of the 2022 International Conference on Communications, Information, Electronic and Energy Systems (CIEES), Veliko Tarnovo, Bulgaria, 24–26 November 2022; pp. 1–6. [Google Scholar]
- Zhang, H.; Zhang, D.; Zhang, B.; Wang, D.; Tang, M. Wearable pressure sensor array with layer-by-layer assembled MXene nanosheets/Ag nanoflowers for motion monitoring and human–machine interfaces. ACS Appl. Mater. Interfaces 2022, 14, 48907–48916. [Google Scholar] [CrossRef] [PubMed]
- Yang, P.; Shi, Y.; Li, S.; Tao, X.; Liu, Z.; Wang, X.; Wang, Z.L.; Chen, X. Monitoring the degree of comfort of shoes in-motion using triboelectric pressure sensors with an ultrawide detection range. ACS Nano 2022, 16, 4654–4665. [Google Scholar] [CrossRef] [PubMed]
- Yu, J.; Chen, L.; Hou, X.; Mu, J.; He, J.; Geng, W.; Qiao, X.; Chou, X. Stretchable and skin-conformal piezo-triboelectric pressure sensor for human joint bending motion monitoring. J. Mater. 2022, 8, 247–256. [Google Scholar] [CrossRef]
- Lee, S.; Franklin, S.; Hassani, F.A.; Yokota, T.; Nayeem, M.O.G.; Wang, Y.; Leib, R.; Cheng, G.; Franklin, D.W.; Someya, T. Nanomesh pressure sensor for monitoring finger manipulation without sensory interference. Science 2020, 370, 966–970. [Google Scholar] [CrossRef] [PubMed]
- Wu, Q.; Qiao, Y.; Guo, R.; Naveed, S.; Hirtz, T.; Li, X.; Fu, Y.; Wei, Y.; Deng, G.; Yang, Y.; et al. Triode-mimicking graphene pressure sensor with positive resistance variation for physiology and motion monitoring. ACS Nano 2020, 14, 10104–10114. [Google Scholar] [CrossRef] [PubMed]
- Gerlach, C.; Krumm, D.; Illing, M.; Lange, J.; Kanoun, O.; Odenwald, S.; Hübler, A. Printed MWCNT-PDMS-composite pressure sensor system for plantar pressure monitoring in ulcer prevention. IEEE Sens. J. 2015, 15, 3647–3656. [Google Scholar] [CrossRef]
- Xiong, Y.; Shen, Y.; Tian, L.; Hu, Y.; Zhu, P.; Sun, R.; Wong, C.P. A flexible, ultra-highly sensitive and stable capacitive pressure sensor with convex microarrays for motion and health monitoring. Nano Energy 2020, 70, 104436. [Google Scholar] [CrossRef]
- Liu, M.; Pu, X.; Jiang, C.; Liu, T.; Huang, X.; Chen, L.; Du, C.; Sun, J.; Hu, W.; Wang, Z.L. Large-area all-textile pressure sensors for monitoring human motion and physiological signals. Adv. Mater. 2017, 29, 1703700. [Google Scholar] [CrossRef] [PubMed]
- Yang, G.; Tian, M.Z.; Huang, P.; Fu, Y.F.; Li, Y.Q.; Fu, Y.Q.; Wang, X.Q.; Li, Y.; Hu, N.; Fu, S.Y. Flexible pressure sensor with a tunable pressure-detecting range for various human motions. Carbon 2021, 173, 736–743. [Google Scholar] [CrossRef]
- Chattopadhyay, S.; Banerjee, M.; Pal, S. Modified AC Wheatstone bridge network for accurate measurement of pressure using strain gauge type pressure sensor. Sensors Transducers 2012, 136, 25. [Google Scholar]
- Liu, H.; Yang, L. Design of a High-Precision Force Sensor Signal Acquisition System Based on HX711. In Proceedings of the 4th International Conference on Information Technologies and Electrical Engineering, New York, NY, USA, 4–6 March 2022. [Google Scholar] [CrossRef]
- Kodali, R.K.; Soratkal, S. MQTT based home automation system using ESP8266. In Proceedings of the 2016 IEEE Region 10 Humanitarian Technology Conference (R10-HTC), Agra, India, 21–23 December 2016; pp. 1–5. [Google Scholar] [CrossRef]


| Weight Mass | First Force Value (N) | Second Force Value (N) | Third Force Value (N) | Fourth Force Value (N) | Fifth Force Value (N) | Sixth Force Value (N) | Seventh Force Value (N) | Eighth Force Value (N) | Ninth Force Value (N) | Tenth Force Value (N) | Average Error (N) | Average Relative Error (%) | Mean-Squared Error (N) |
|---|---|---|---|---|---|---|---|---|---|---|---|---|---|
| 100 g (1 N) | 1.01 | 1.00 | 1.00 | 1.00 | 1.00 | 1.00 | 1.00 | 1.00 | 1.00 | 1.00 | 0.001 | 0.1 | 1 × |
| 200 g (2 N) | 1.97 | 1.98 | 1.98 | 1.98 | 1.98 | 1.98 | 1.98 | 1.98 | 1.99 | 2.00 | 0.018 | 0.9 | 3.8 × |
| 300 g (3 N) | 3.03 | 3.04 | 3.01 | 3.00 | 3.01 | 3.00 | 3.00 | 3.00 | 3.00 | 2.99 | 0.01 | 0.27 | 2.8 × |
| 400 g (4 N) | 3.95 | 4.00 | 4.02 | 4.03 | 4.00 | 3.98 | 3.99 | 3.98 | 3.96 | 3.97 | 0.022 | 0.3 | 7.2 × |
| 500 g (5 N) | 4.97 | 4.96 | 5.01 | 4.99 | 5.02 | 4.97 | 5.00 | 4.97 | 5.00 | 5.05 | 0.023 | 0.12 | 7.5 × |
| Weight Mass | Force Value (N) | Actual Pressure F (N) | Pressure Value (N) | Pressure Value (N) | Pressure Value (N) | Pressure Value (N) | Pressure Value (N) | Pressure Value (N) | Pressure Value (N) | Pressure Value (N) | Pressure Value (N) | Pressure Value (N) | Average Error (N) | Average Relative Error (%) | Mean Square Error (N) |
|---|---|---|---|---|---|---|---|---|---|---|---|---|---|---|---|
| 200 g (2 N) | 1.00 | 1.00 | 1.00 | 1.00 | 1.00 | 1.00 | 1.00 | 1.01 | 1.01 | 1.00 | 1.00 | 1.00 | 0.002 | 0.2 | 2 × |
| 300 g (3 N) | 1.00 | 2.00 | 1.99 | 1.99 | 1.99 | 1.99 | 2.00 | 2.00 | 2.00 | 2.00 | 2.00 | 2.00 | 0.004 | 0.2 | 4 × |
| 400 g (4 N) | 1.00 | 3.00 | 3.01 | 3.08 | 3.11 | 3.06 | 3.04 | 3.03 | 3.03 | 3.02 | 3.01 | 3.00 | 0.039 | 1.3 | 2.61 × |
| 500 g (5 N) | 1.00 | 4.00 | 4.07 | 4.07 | 4.07 | 4.07 | 4.07 | 4.06 | 4.07 | 4.07 | 4.07 | 4.07 | 0.068 | 1.7 | 4.64 × |
| 1 kg (10 N) | 5.00 | 5.00 | 5.04 | 5.05 | 5.02 | 5.06 | 5.08 | 5.05 | 5.05 | 5.05 | 5.04 | 5.05 | 0.049 | 0.98 | 2.61 × |
| Number of Experiments | The Maximum Force Value of Flexion Movement (N) | The Maximum Force Value of Extension Movement (N) | Effective Number of Flexion Movements (Dcount) | Effective Number of Extension Movements (Tcount) |
|---|---|---|---|---|
| First | 6.05 | 3.57 | 1 | 1 |
| Second | 5.83 | 3.65 | 2 | 2 |
| Third | 6.35 | 3.61 | 3 | 3 |
| Fourth | 6.31 | 3.78 | 4 | 4 |
| Fifth | 6.24 | 4.12 | 5 | 5 |
| Sixth | 6.13 | 4.03 | 6 | 6 |
| Seventh | 6.25 | 3.84 | 7 | 7 |
| Eighth | 6.33 | 3.89 | 8 | 8 |
| Ninth | 6.23 | 5.95 | 9 | 9 |
| Tenth | 5.95 | 3.95 | 10 | 10 |
Disclaimer/Publisher’s Note: The statements, opinions and data contained in all publications are solely those of the individual author(s) and contributor(s) and not of MDPI and/or the editor(s). MDPI and/or the editor(s) disclaim responsibility for any injury to people or property resulting from any ideas, methods, instructions or products referred to in the content. |
© 2023 by the authors. Licensee MDPI, Basel, Switzerland. This article is an open access article distributed under the terms and conditions of the Creative Commons Attribution (CC BY) license (https://creativecommons.org/licenses/by/4.0/).
Share and Cite
Xu, C.; Zhou, Y.; Ji, J.; Wei, C. An Ankle Joint Flexion and Extension Movement-Monitoring Device Based on Pressure Sensors. Micromachines 2023, 14, 2141. https://doi.org/10.3390/mi14122141
Xu C, Zhou Y, Ji J, Wei C. An Ankle Joint Flexion and Extension Movement-Monitoring Device Based on Pressure Sensors. Micromachines. 2023; 14(12):2141. https://doi.org/10.3390/mi14122141
Chicago/Turabian StyleXu, Chunying, Yu Zhou, Jian Ji, and Chuliang Wei. 2023. "An Ankle Joint Flexion and Extension Movement-Monitoring Device Based on Pressure Sensors" Micromachines 14, no. 12: 2141. https://doi.org/10.3390/mi14122141
APA StyleXu, C., Zhou, Y., Ji, J., & Wei, C. (2023). An Ankle Joint Flexion and Extension Movement-Monitoring Device Based on Pressure Sensors. Micromachines, 14(12), 2141. https://doi.org/10.3390/mi14122141