
3D Printed Microfluidic Bioreactors Used for the Preferential Growth of Bacterial Biofilms through Dielectrophoresis

 ,
,  , , , ,
  and
and 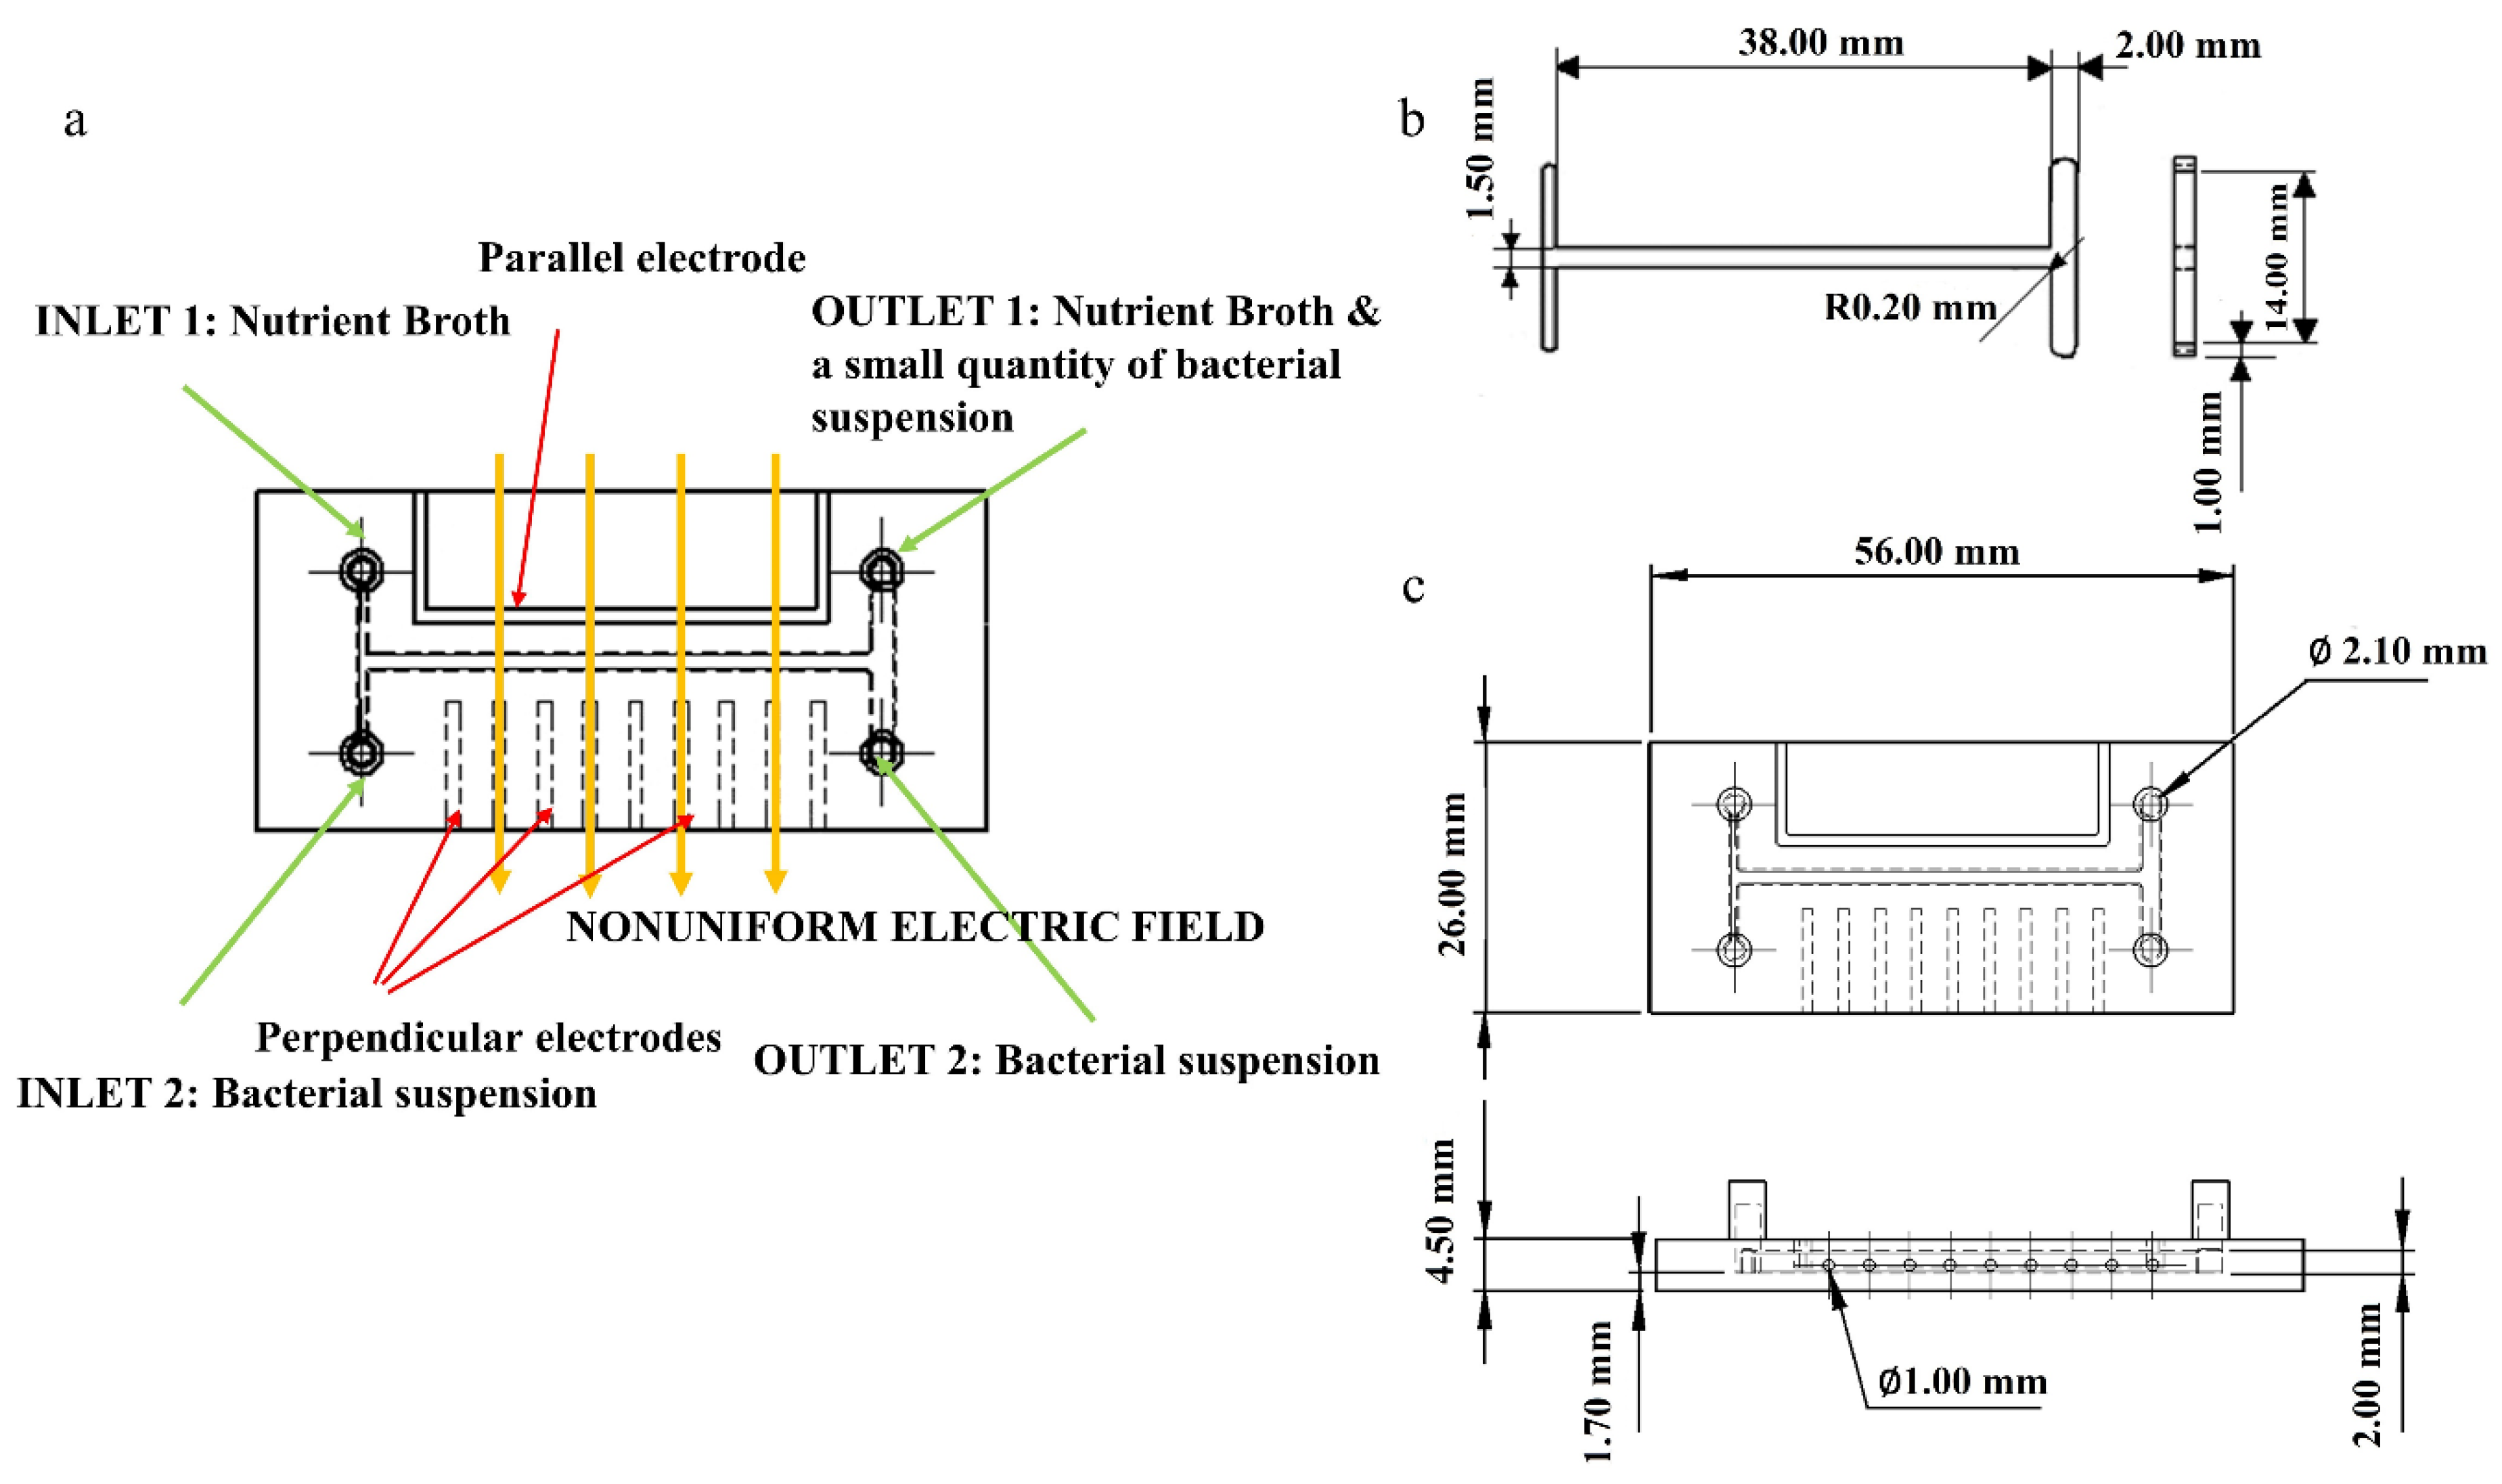
Abstract
1. Introduction
2. Materials and Methods
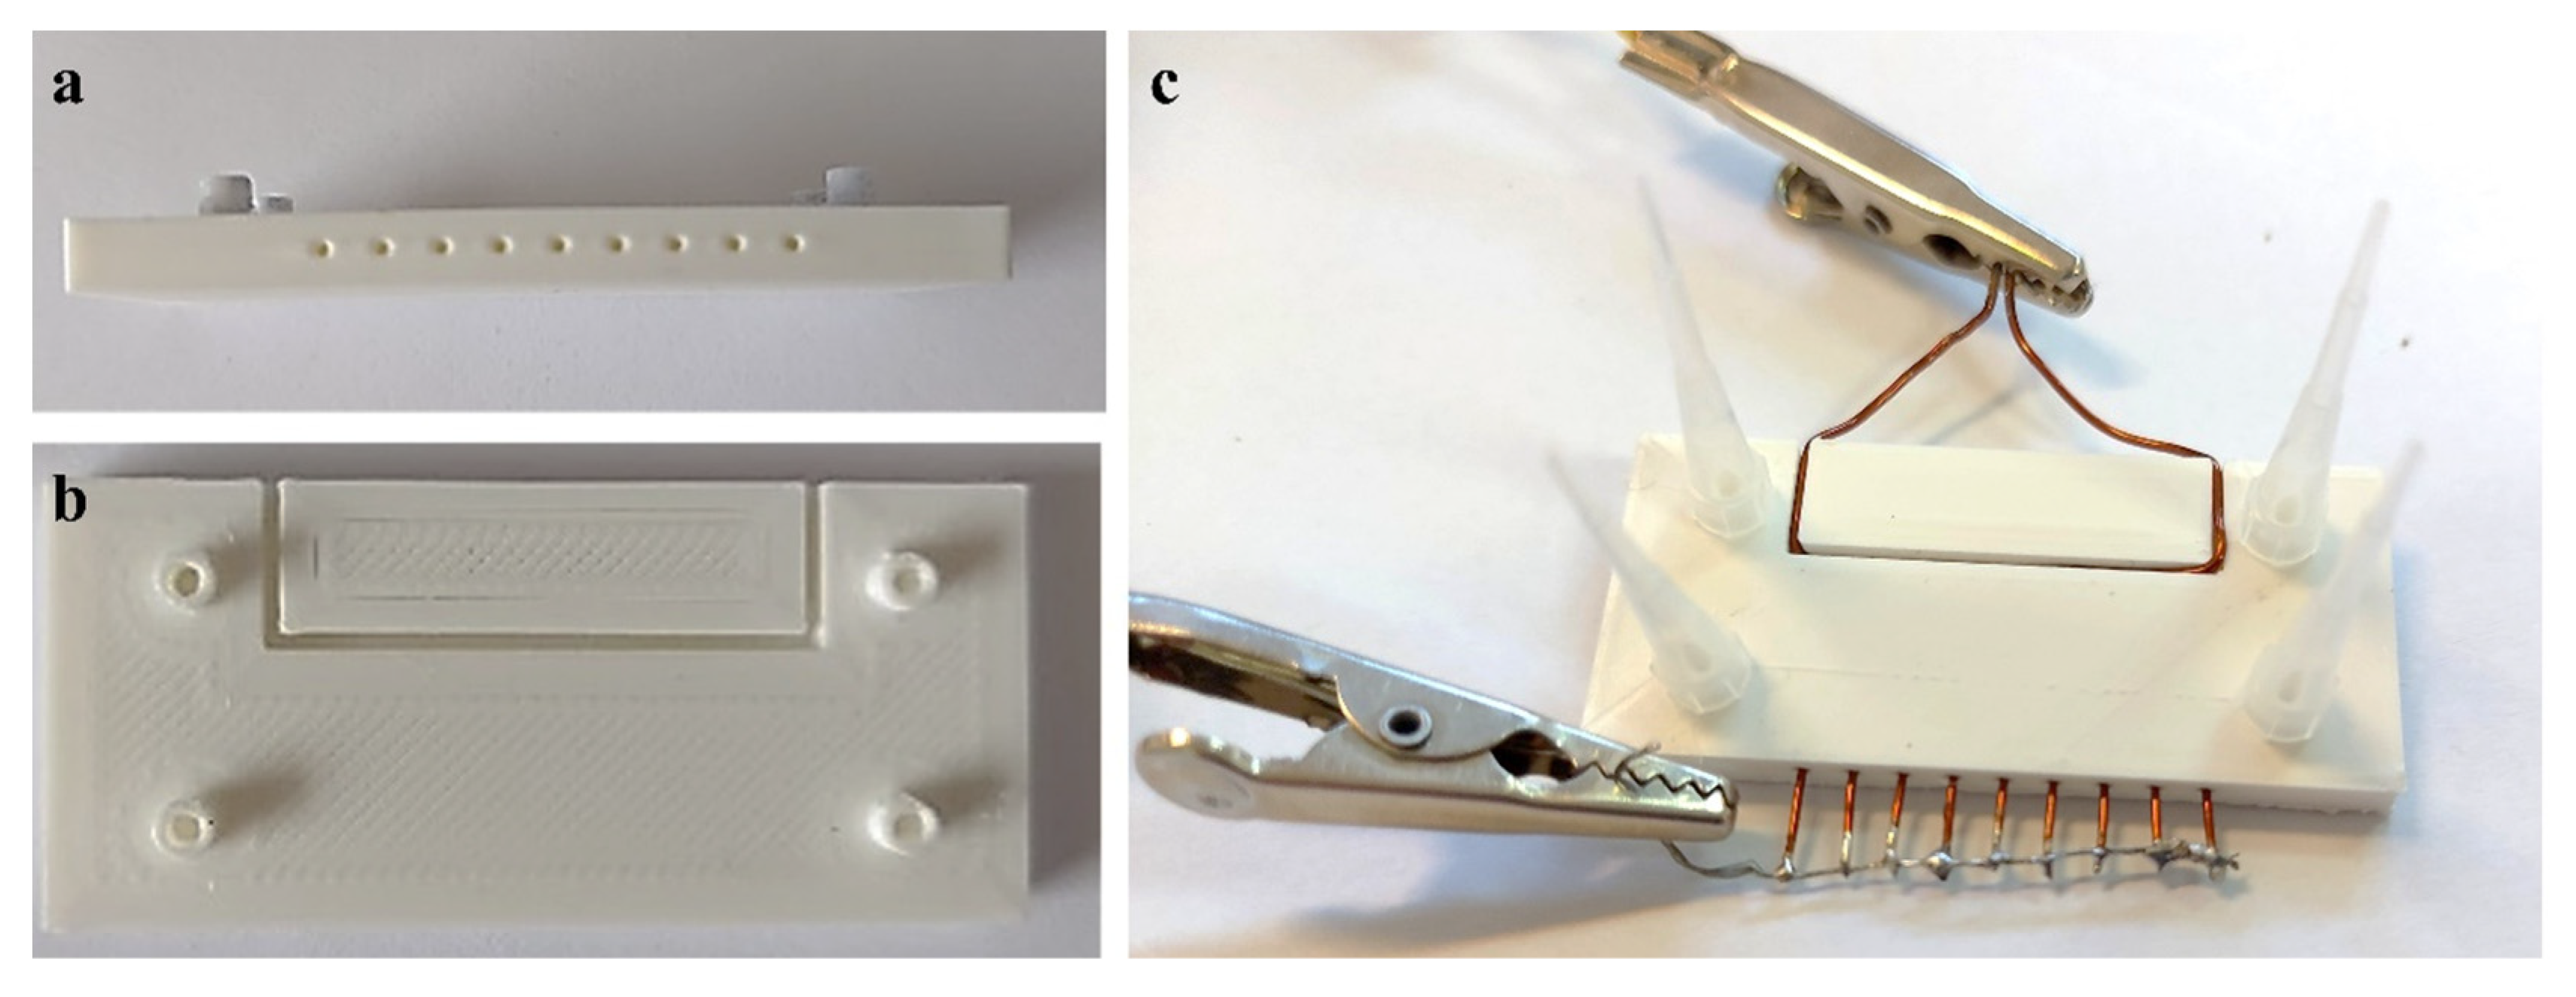
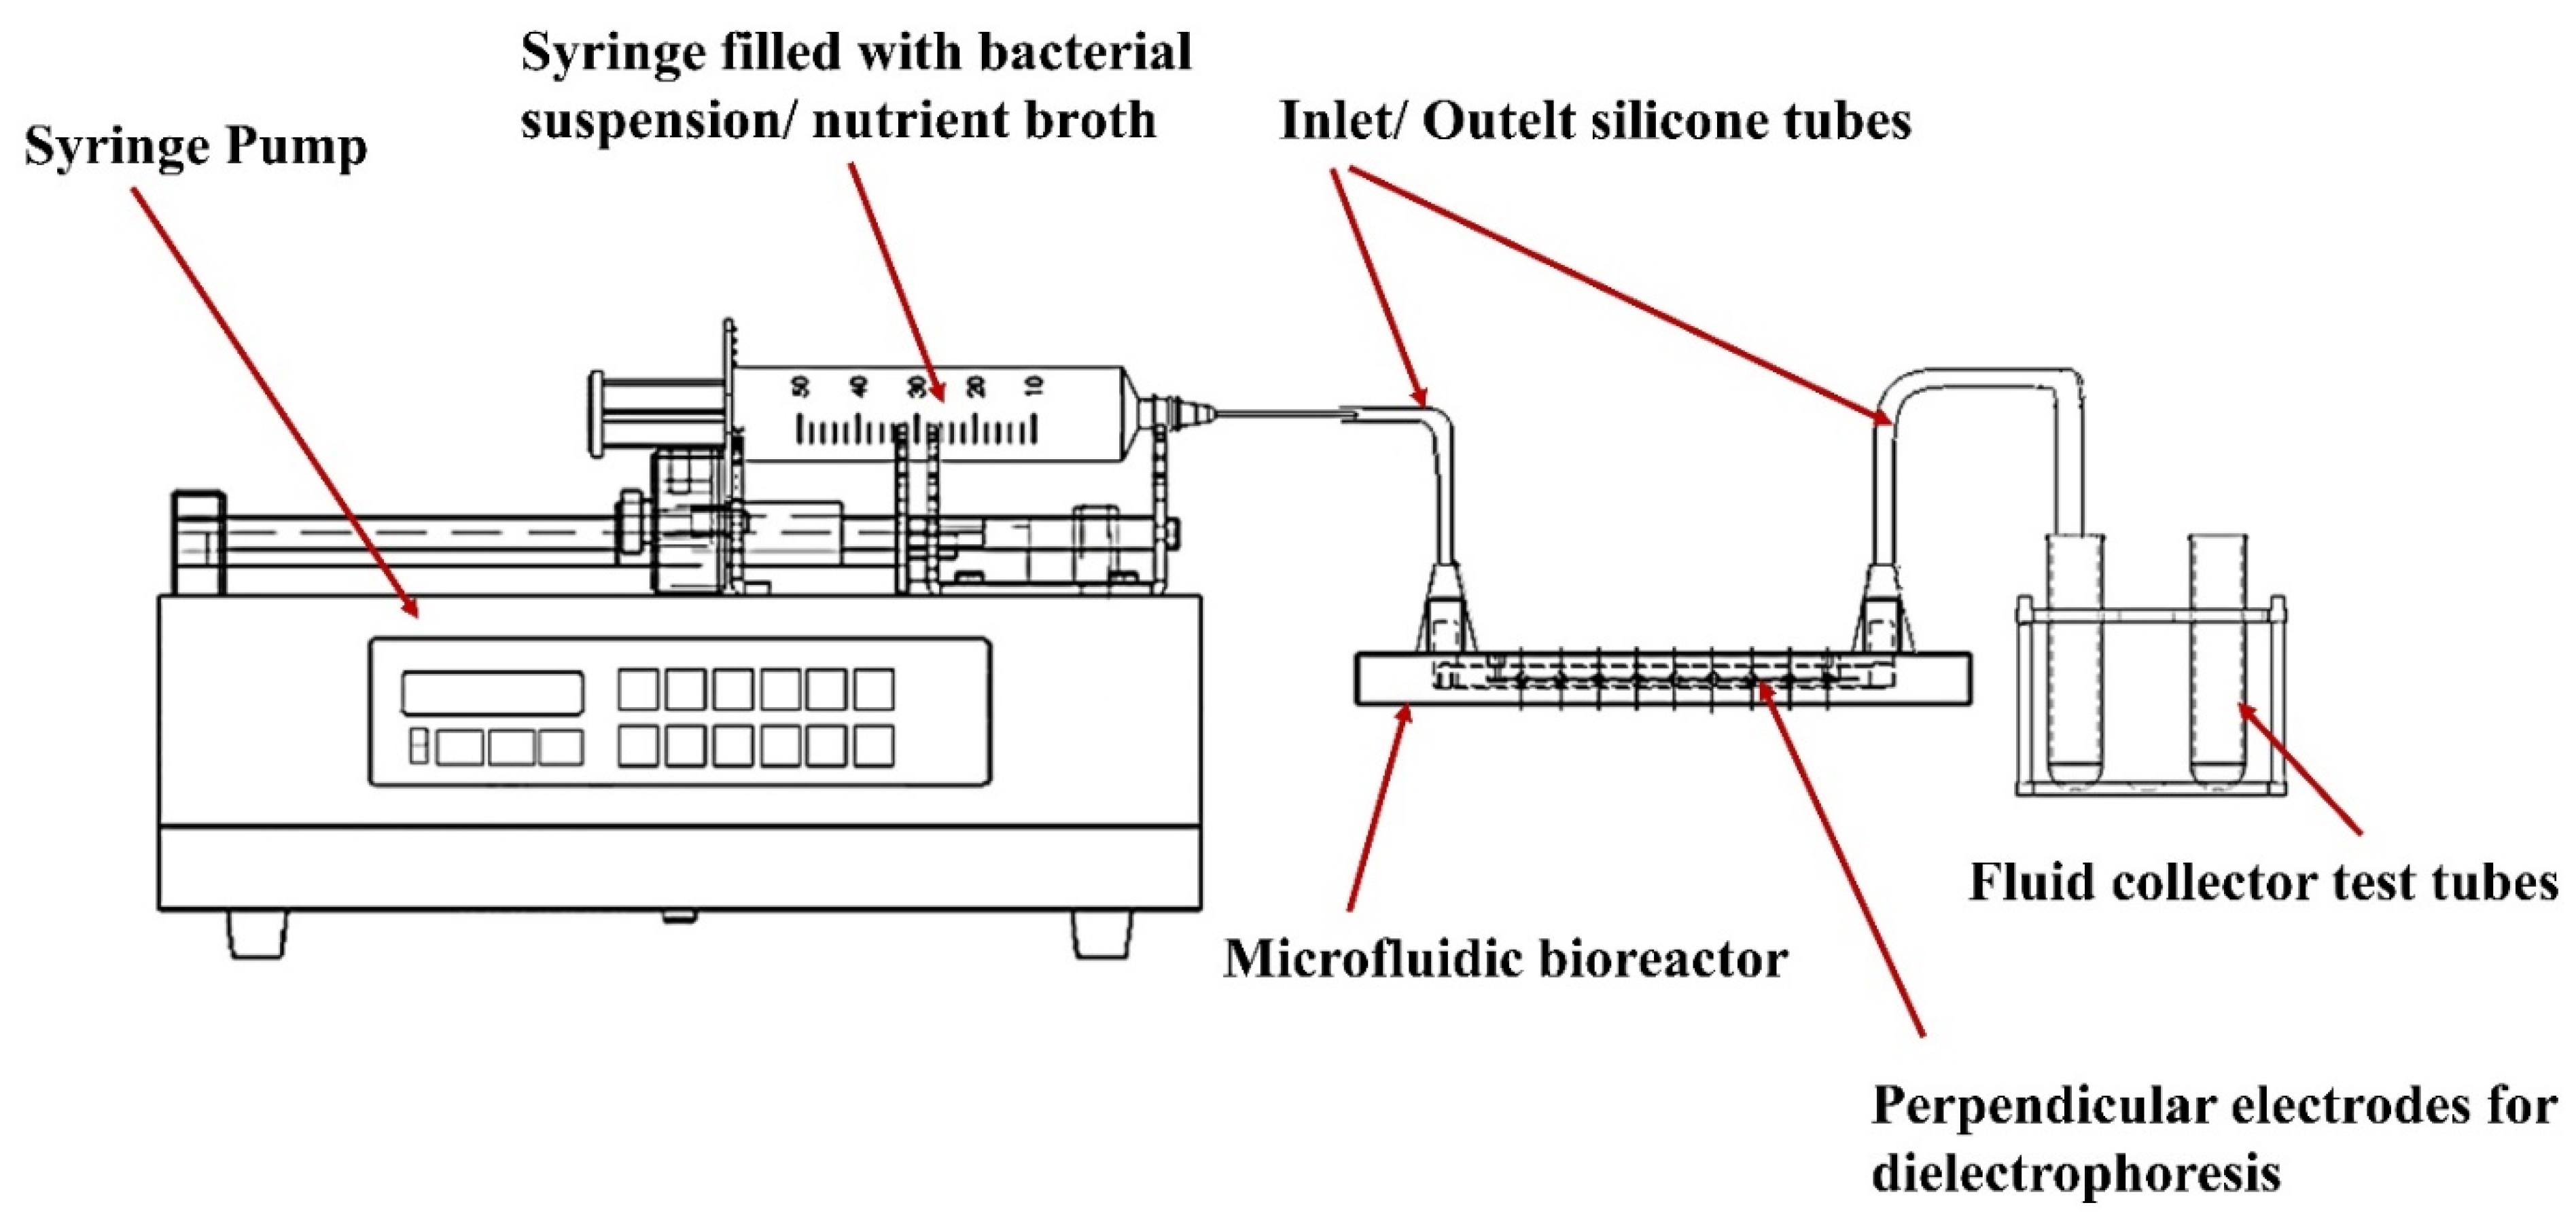
2.1. Device Fabrication and Setup
2.2. Biofilm Formation and Growth
2.3. Analysis Methods
3. Results and Discussions
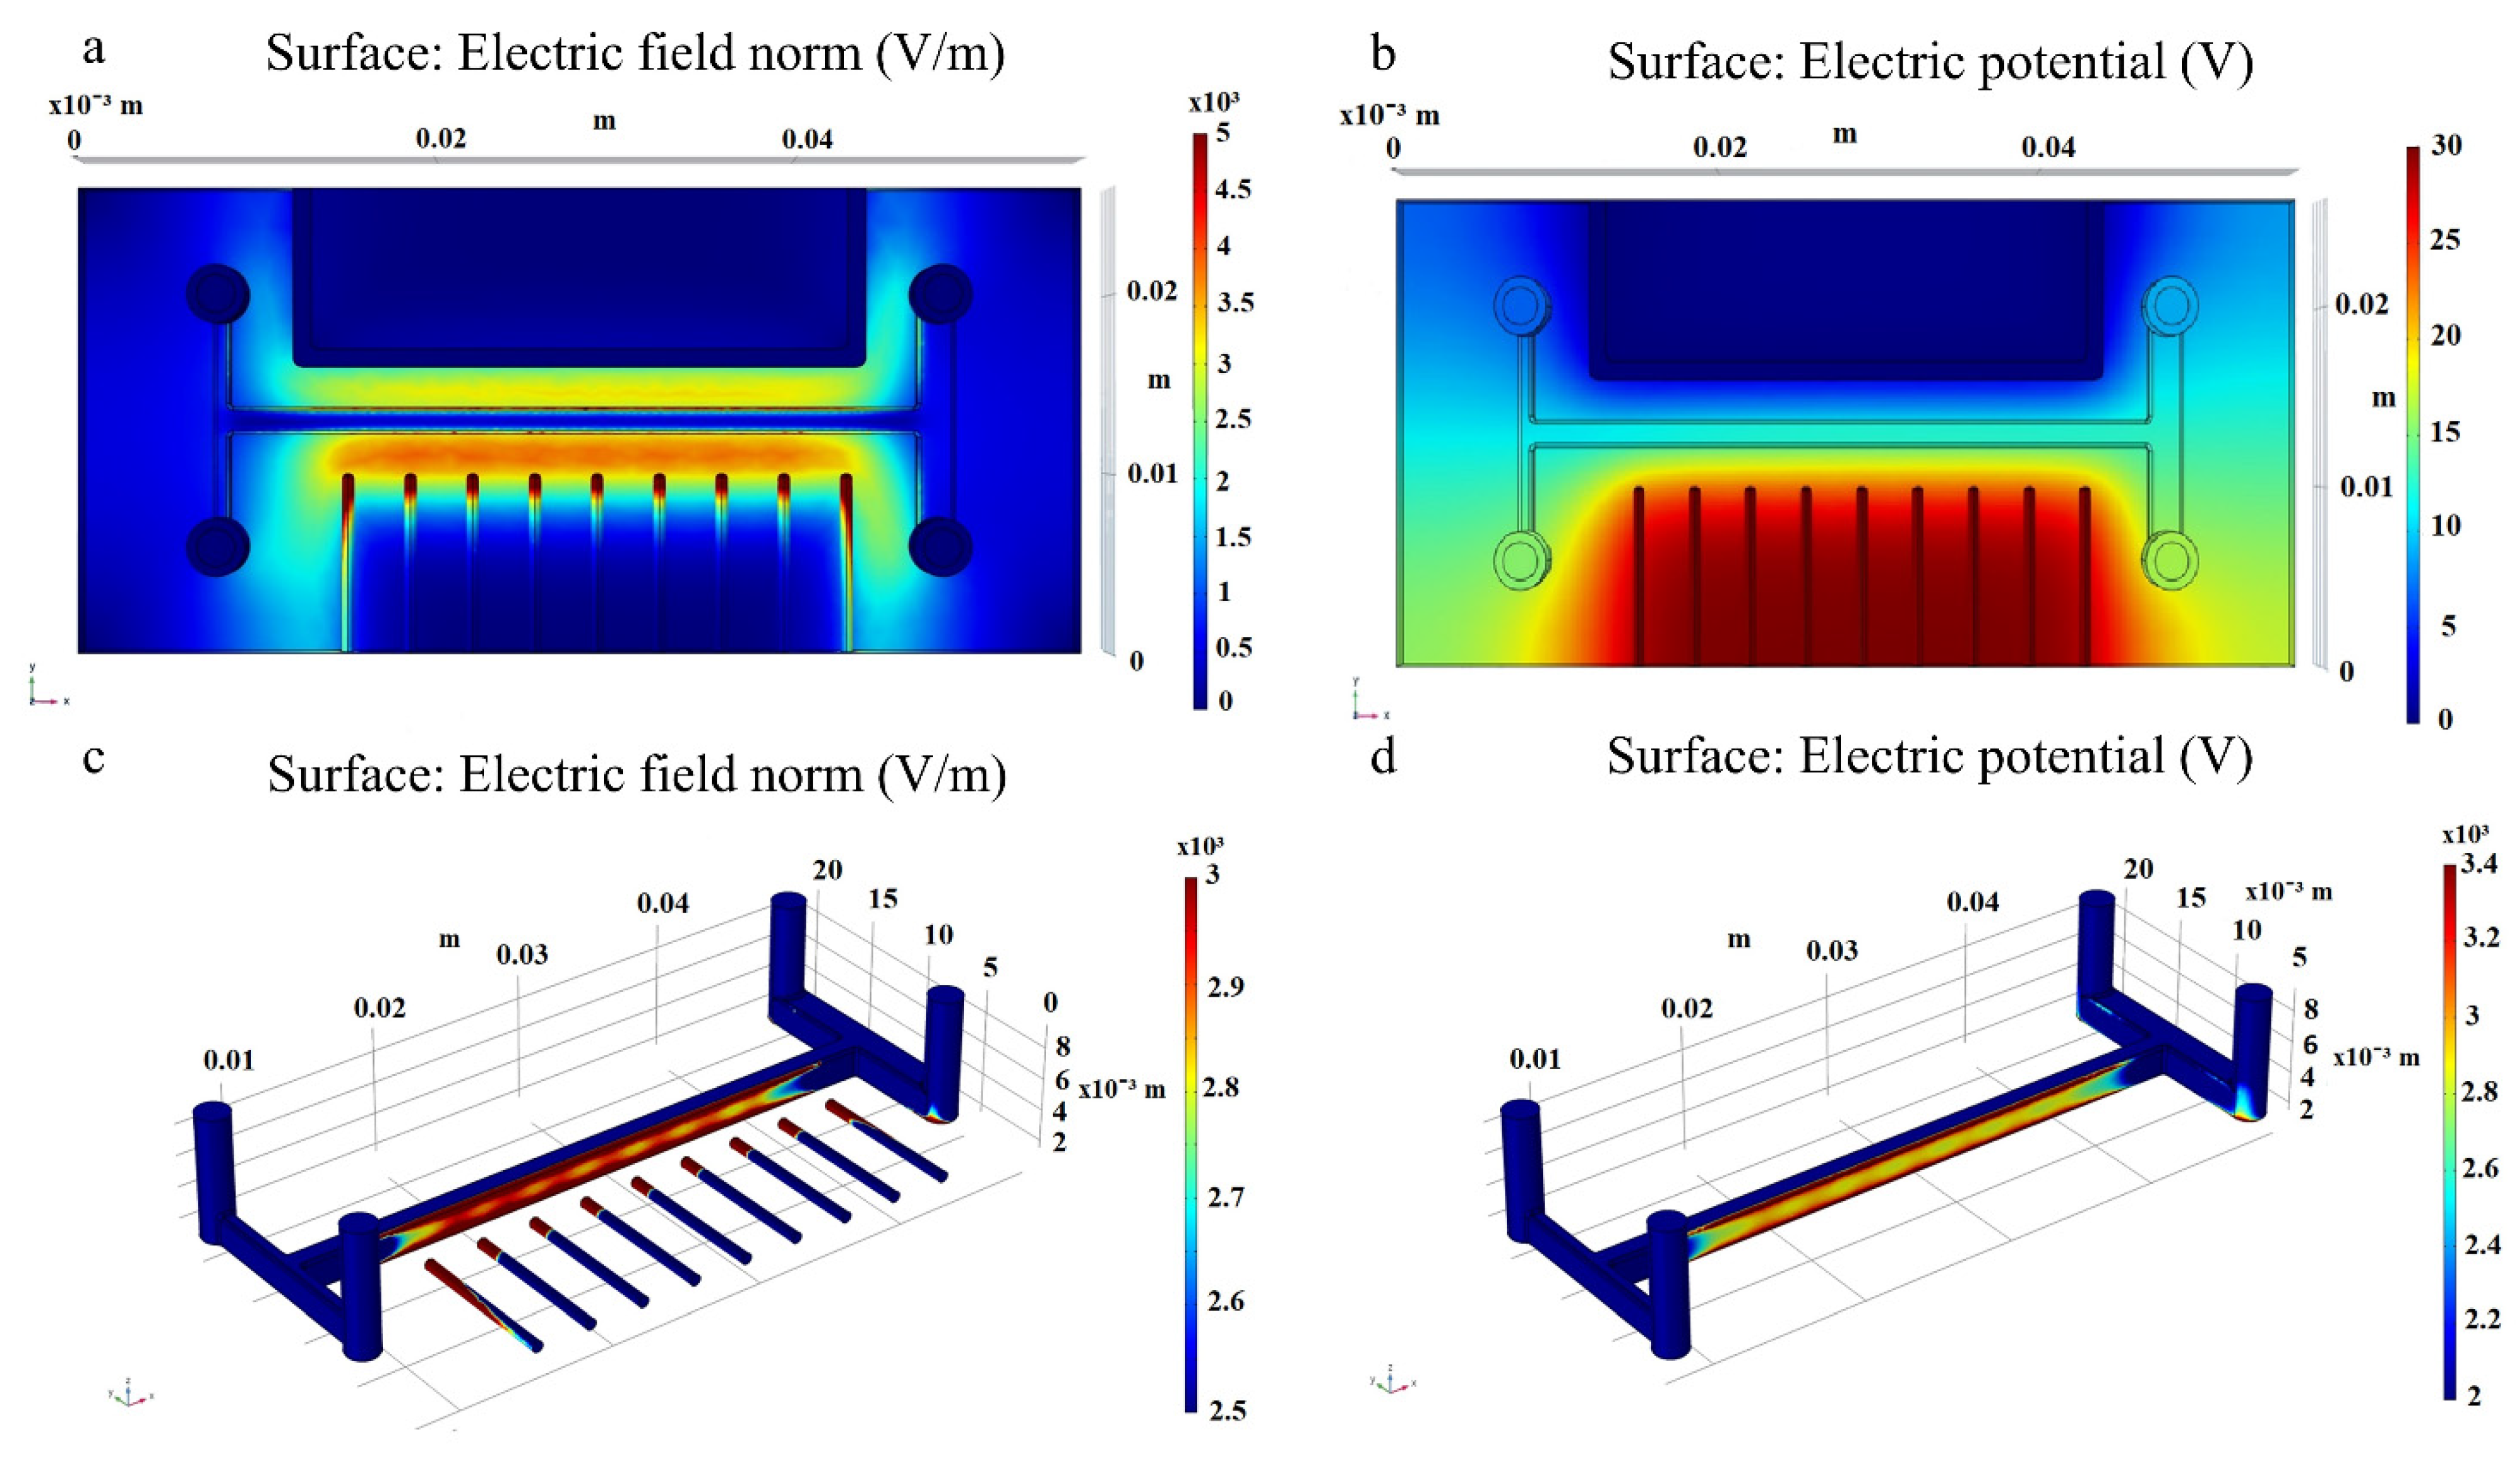
3.1. Distribution of the Electric Field
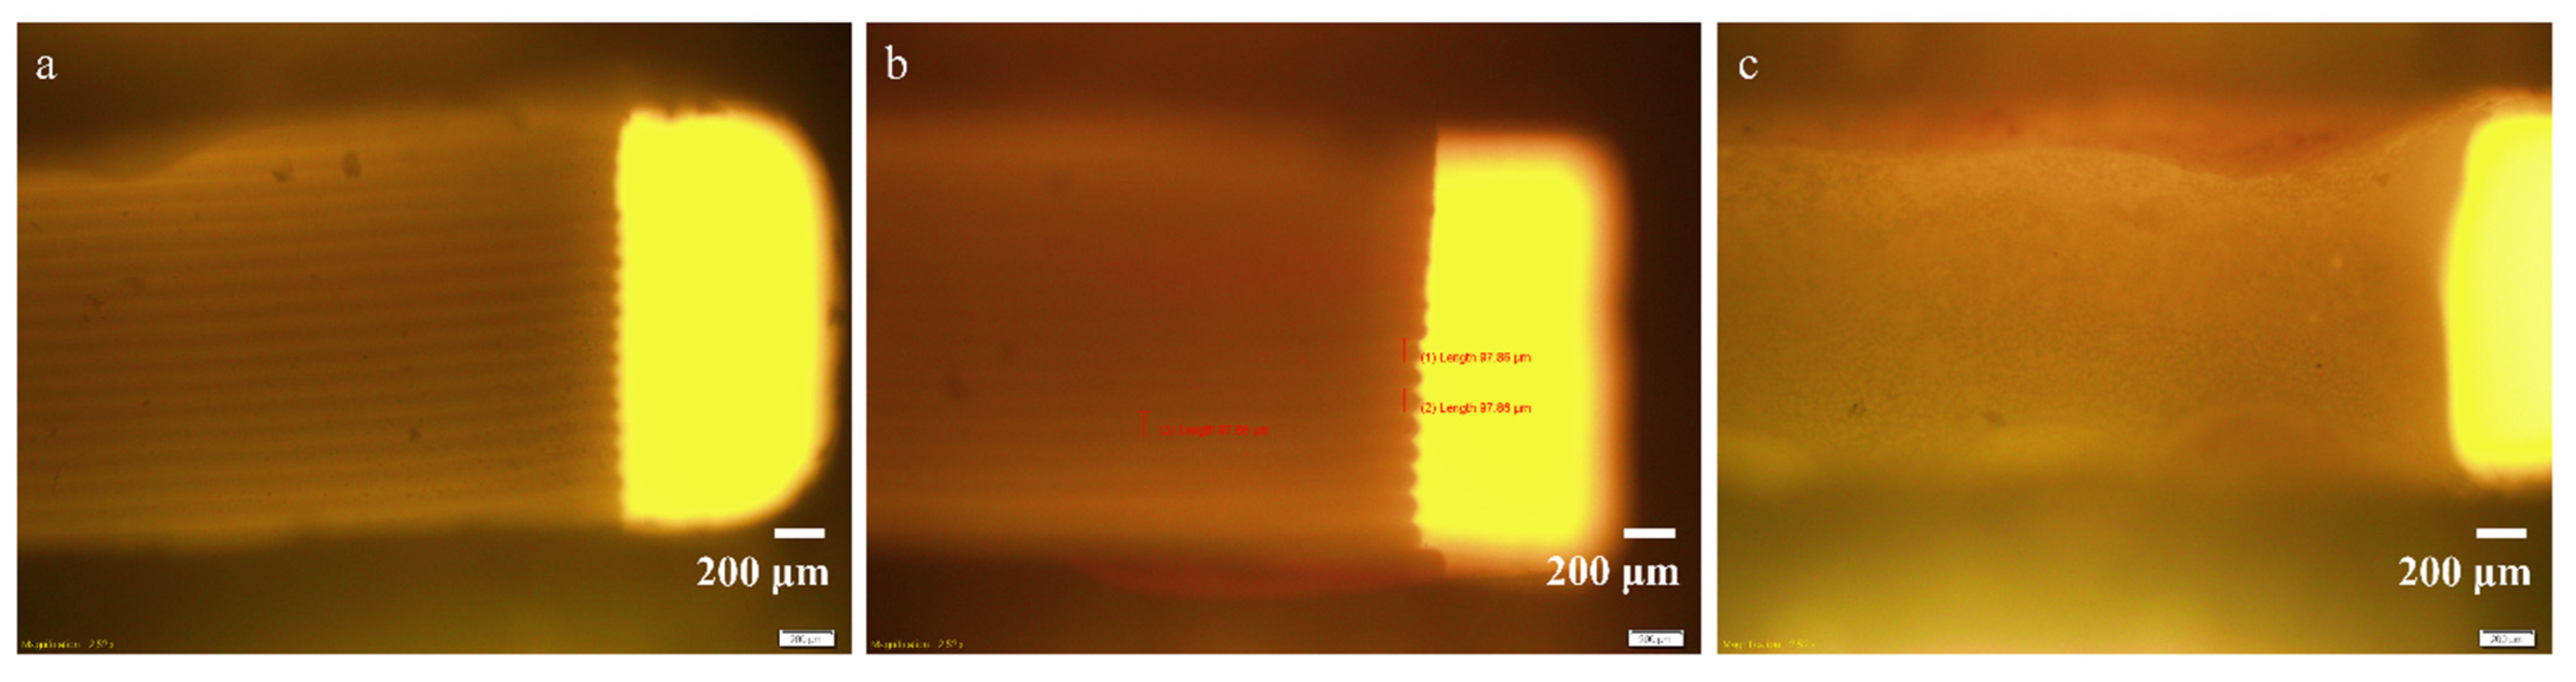
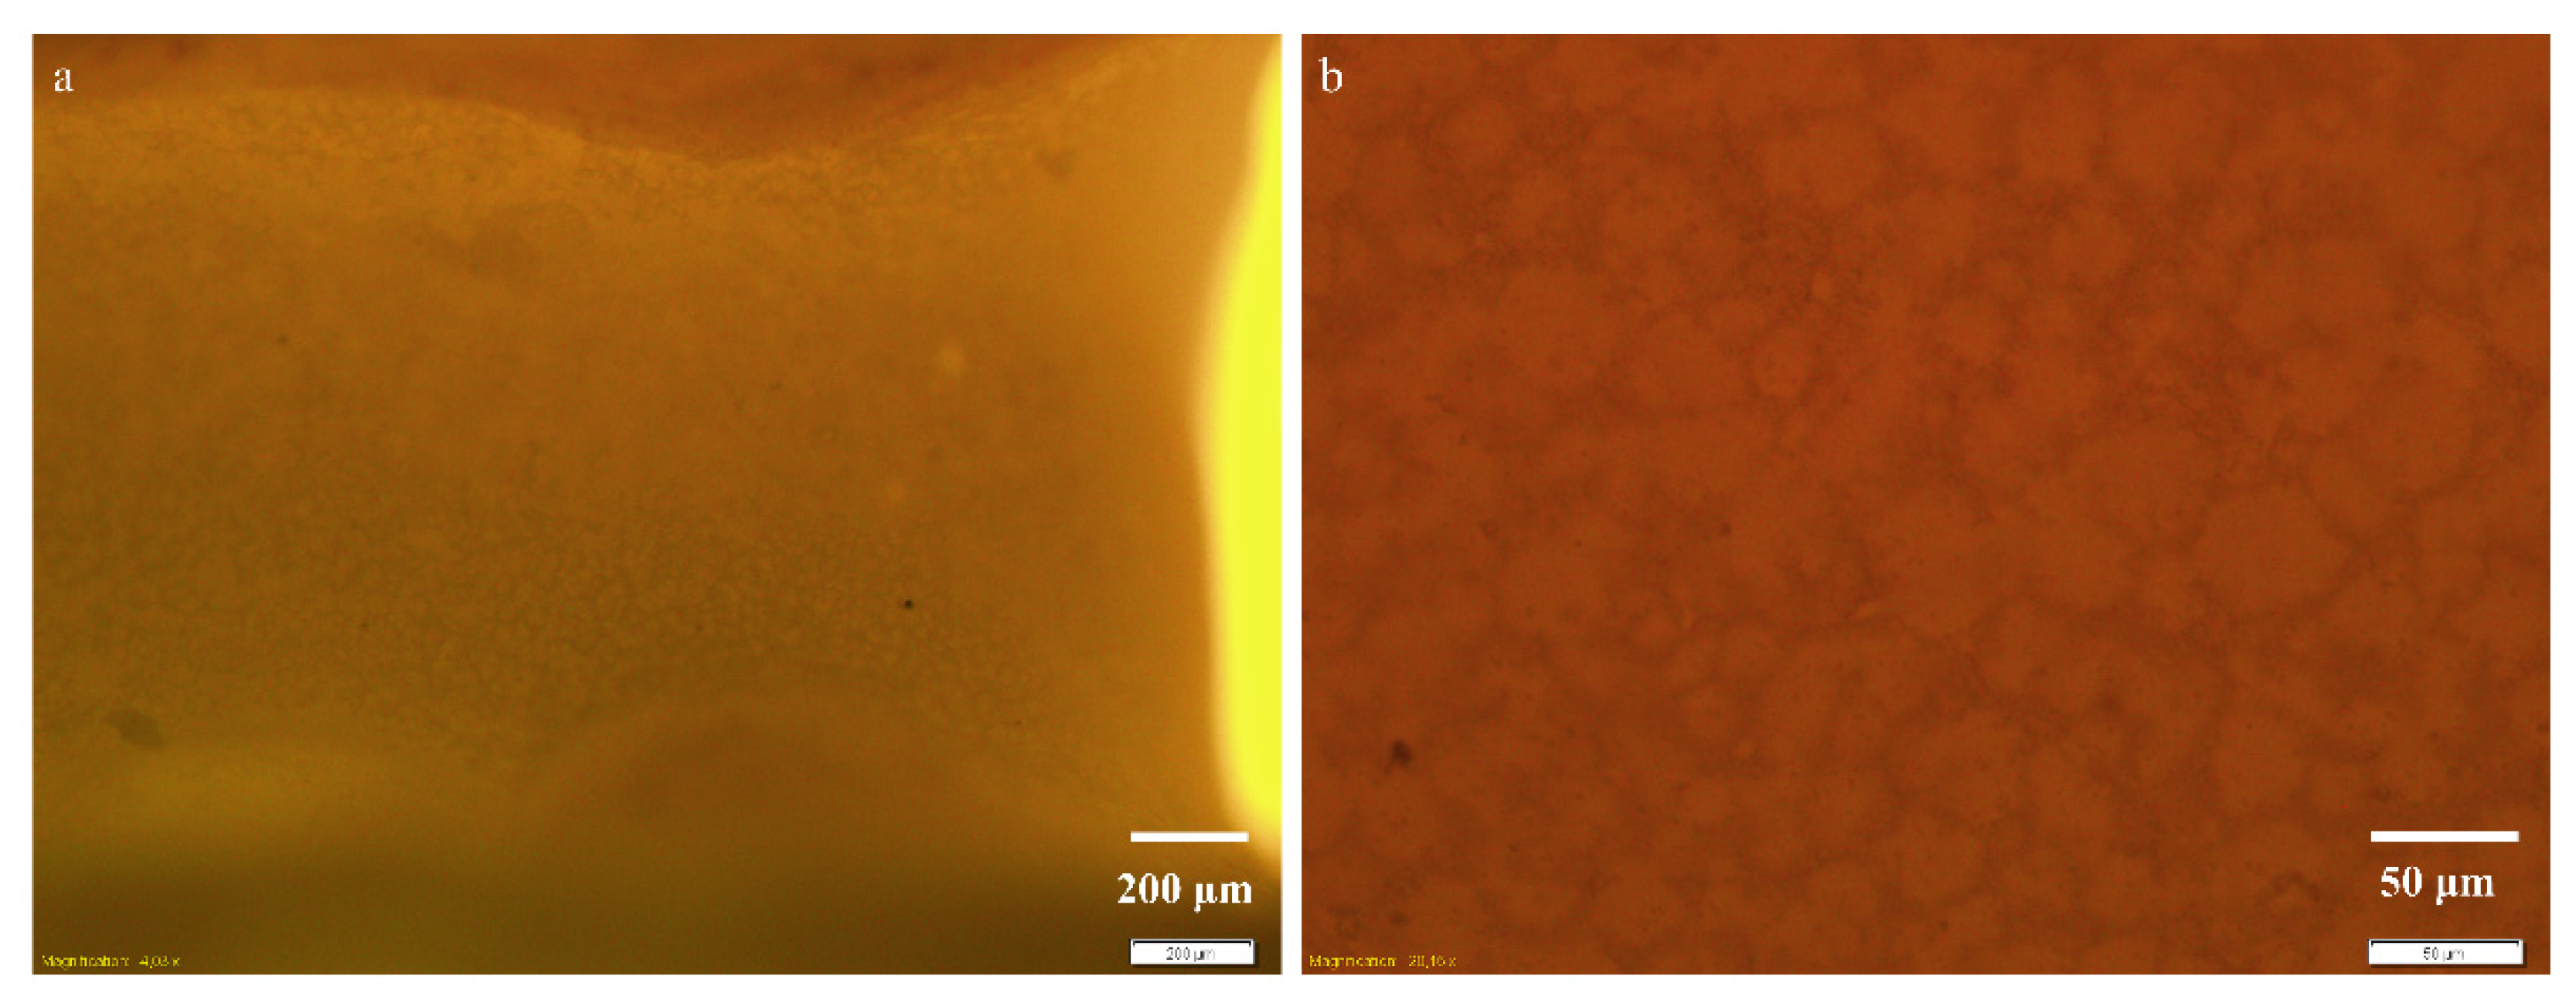
3.2. Optical Microscopy
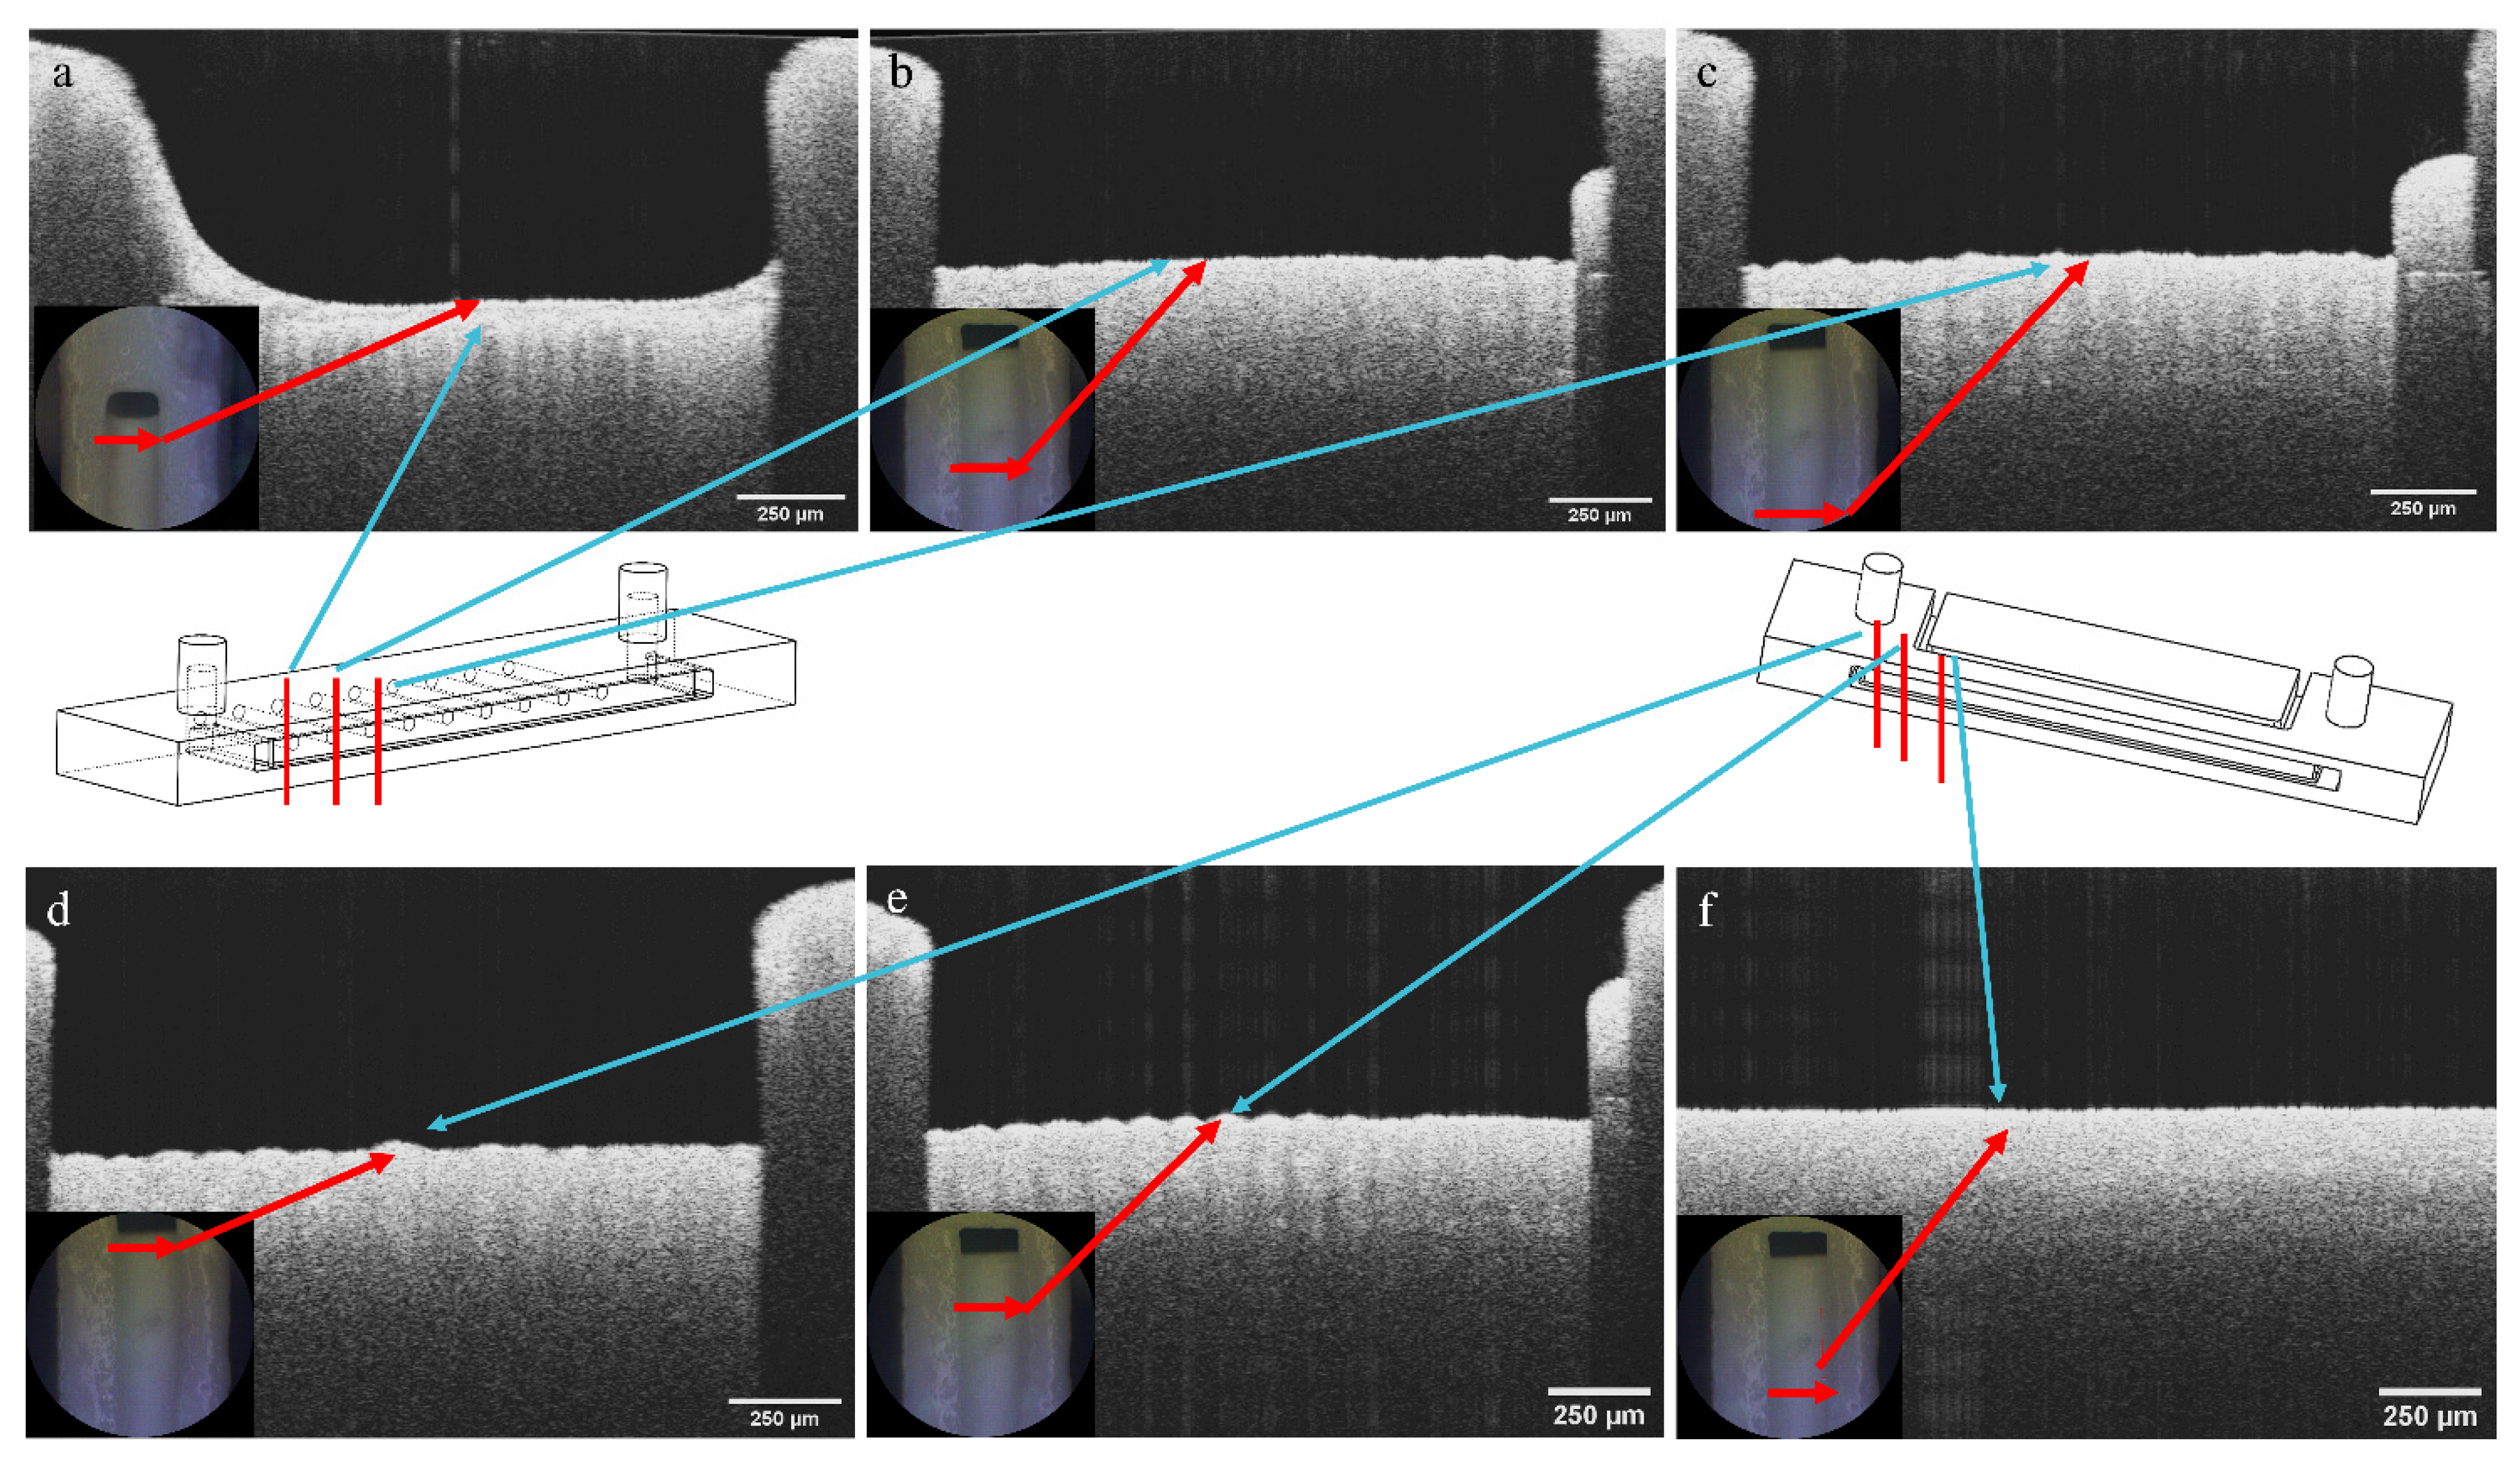
3.3. Spectral Domain Optical Coherence Tomography
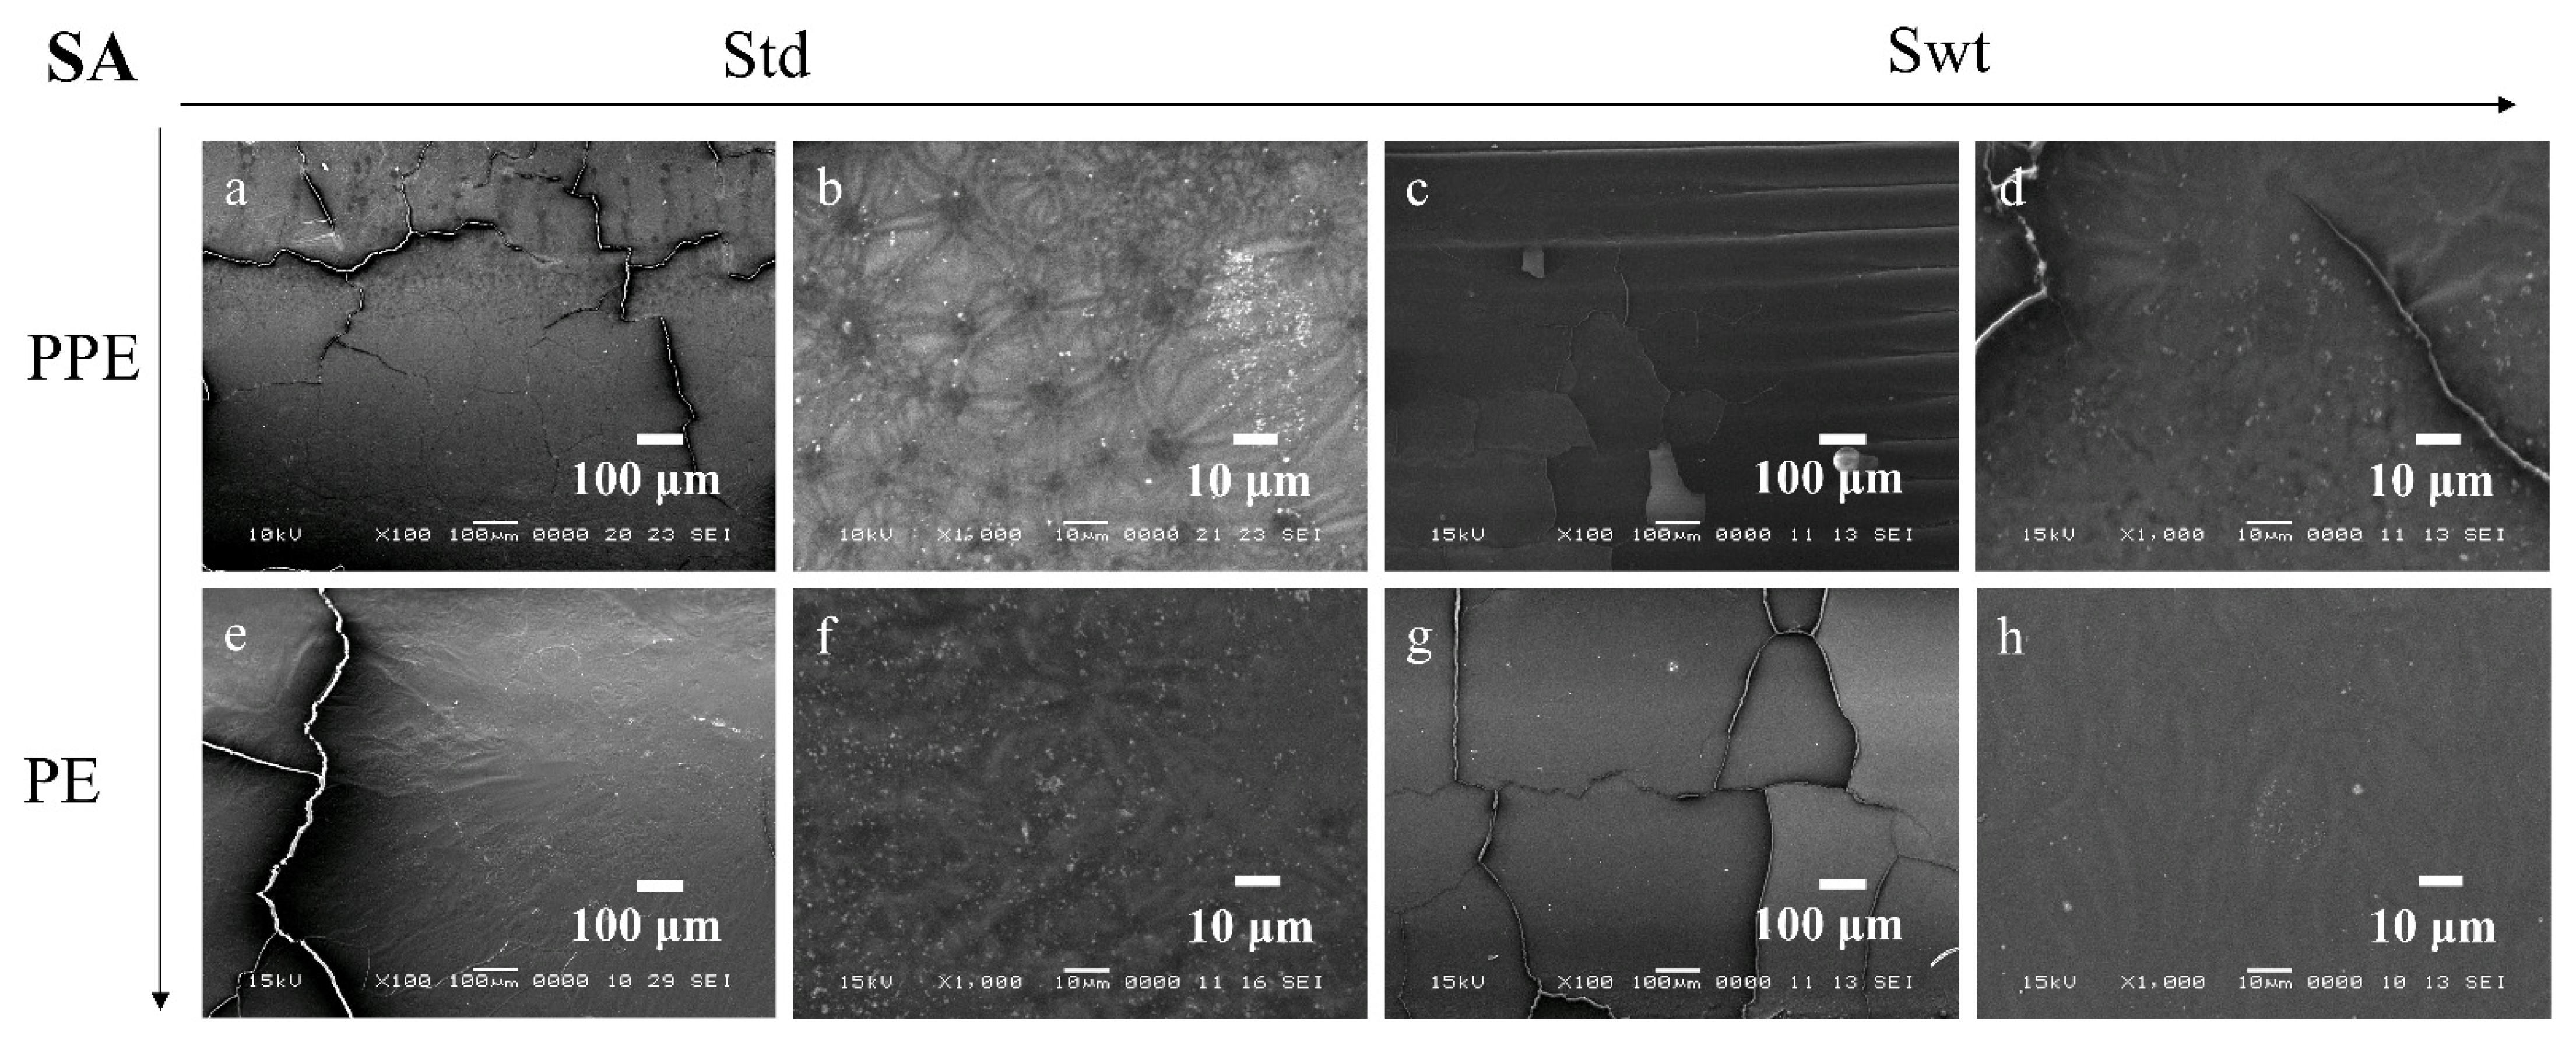
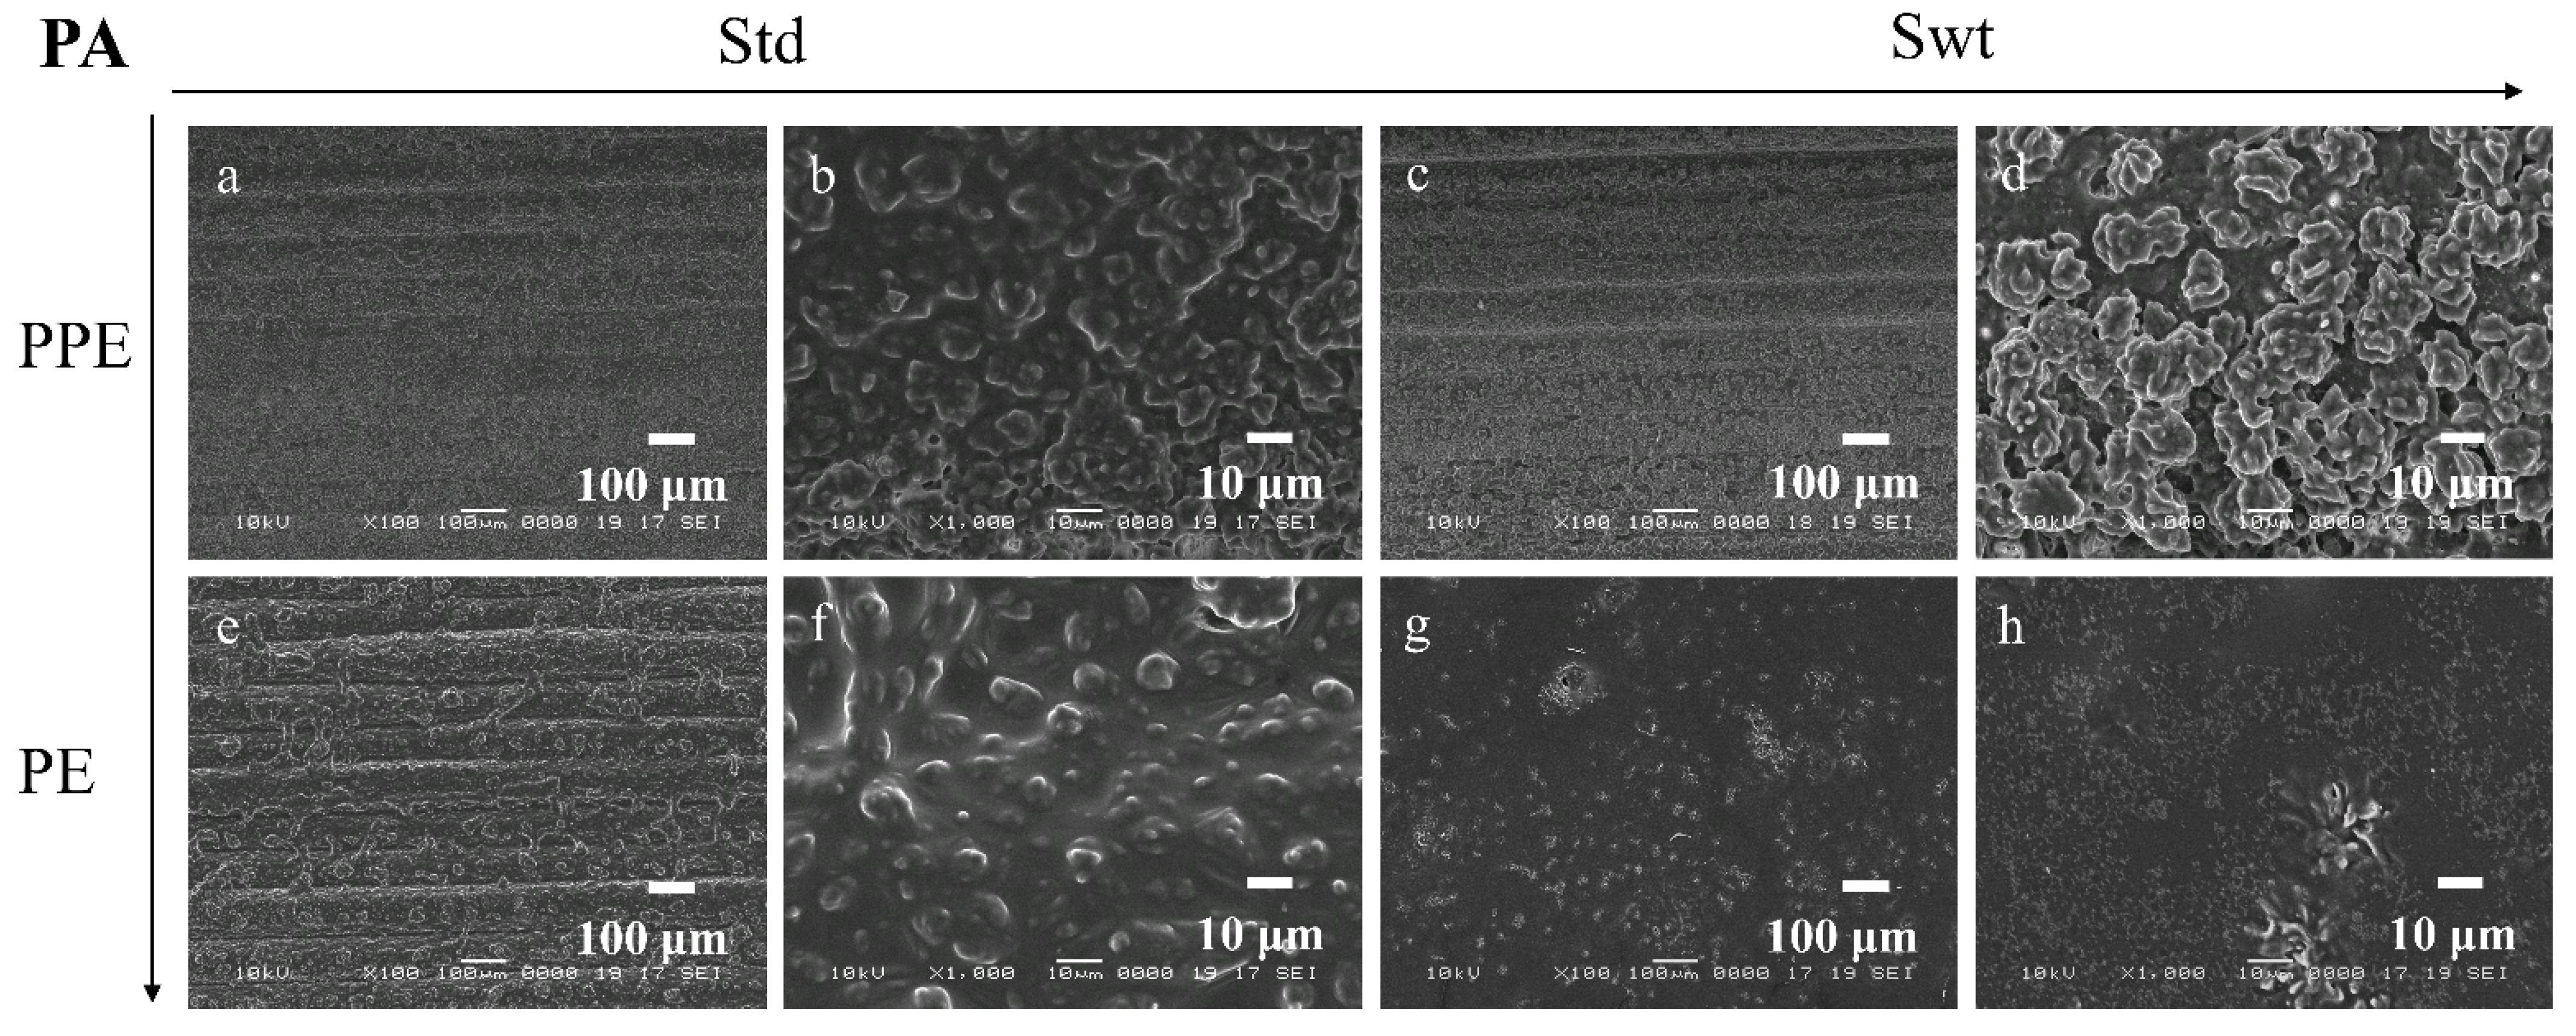
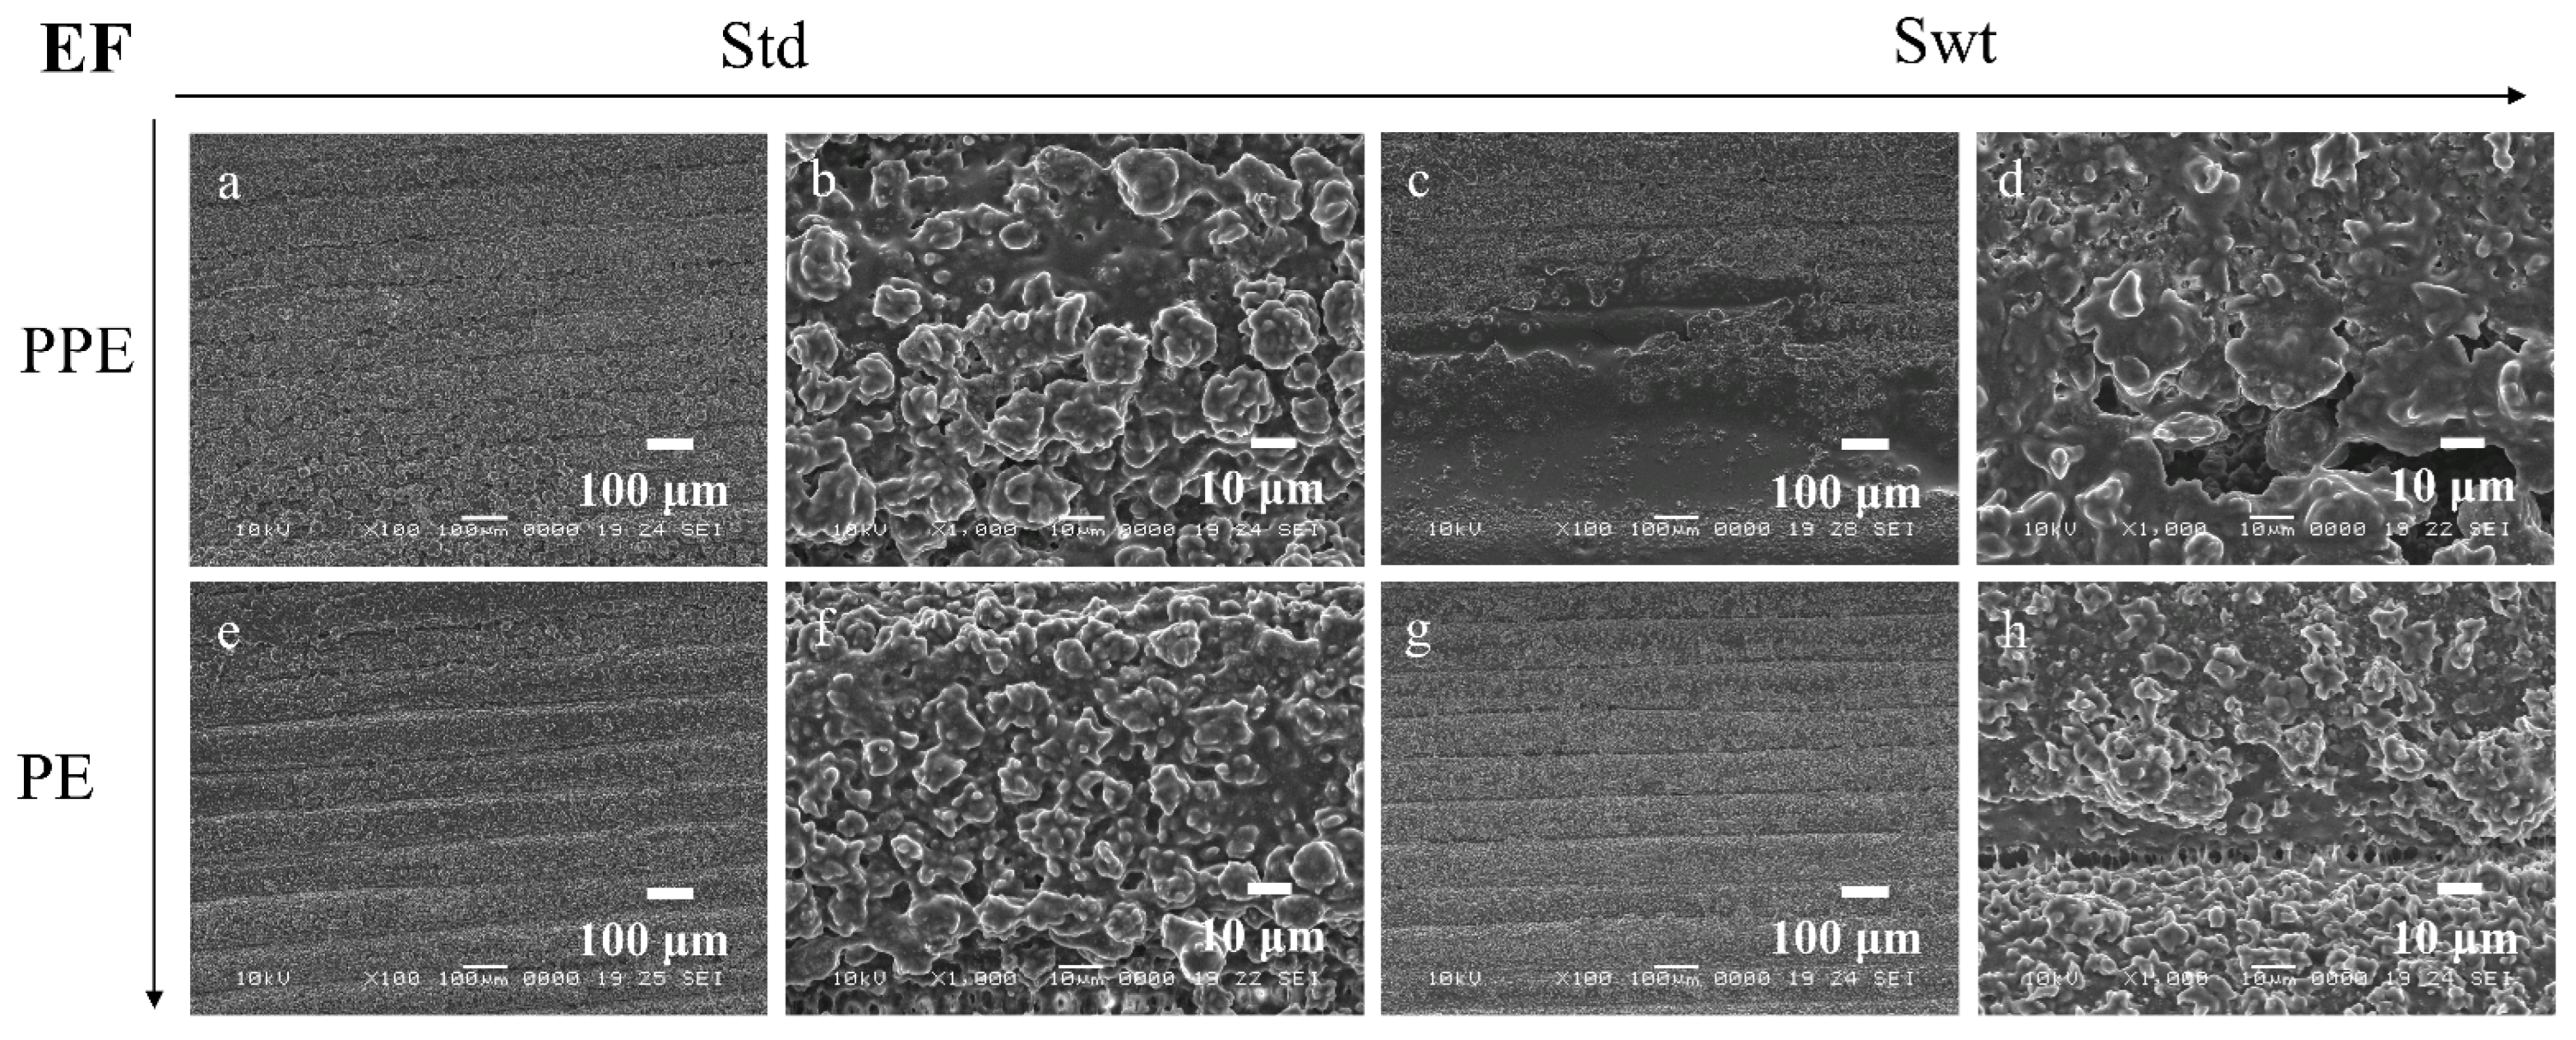
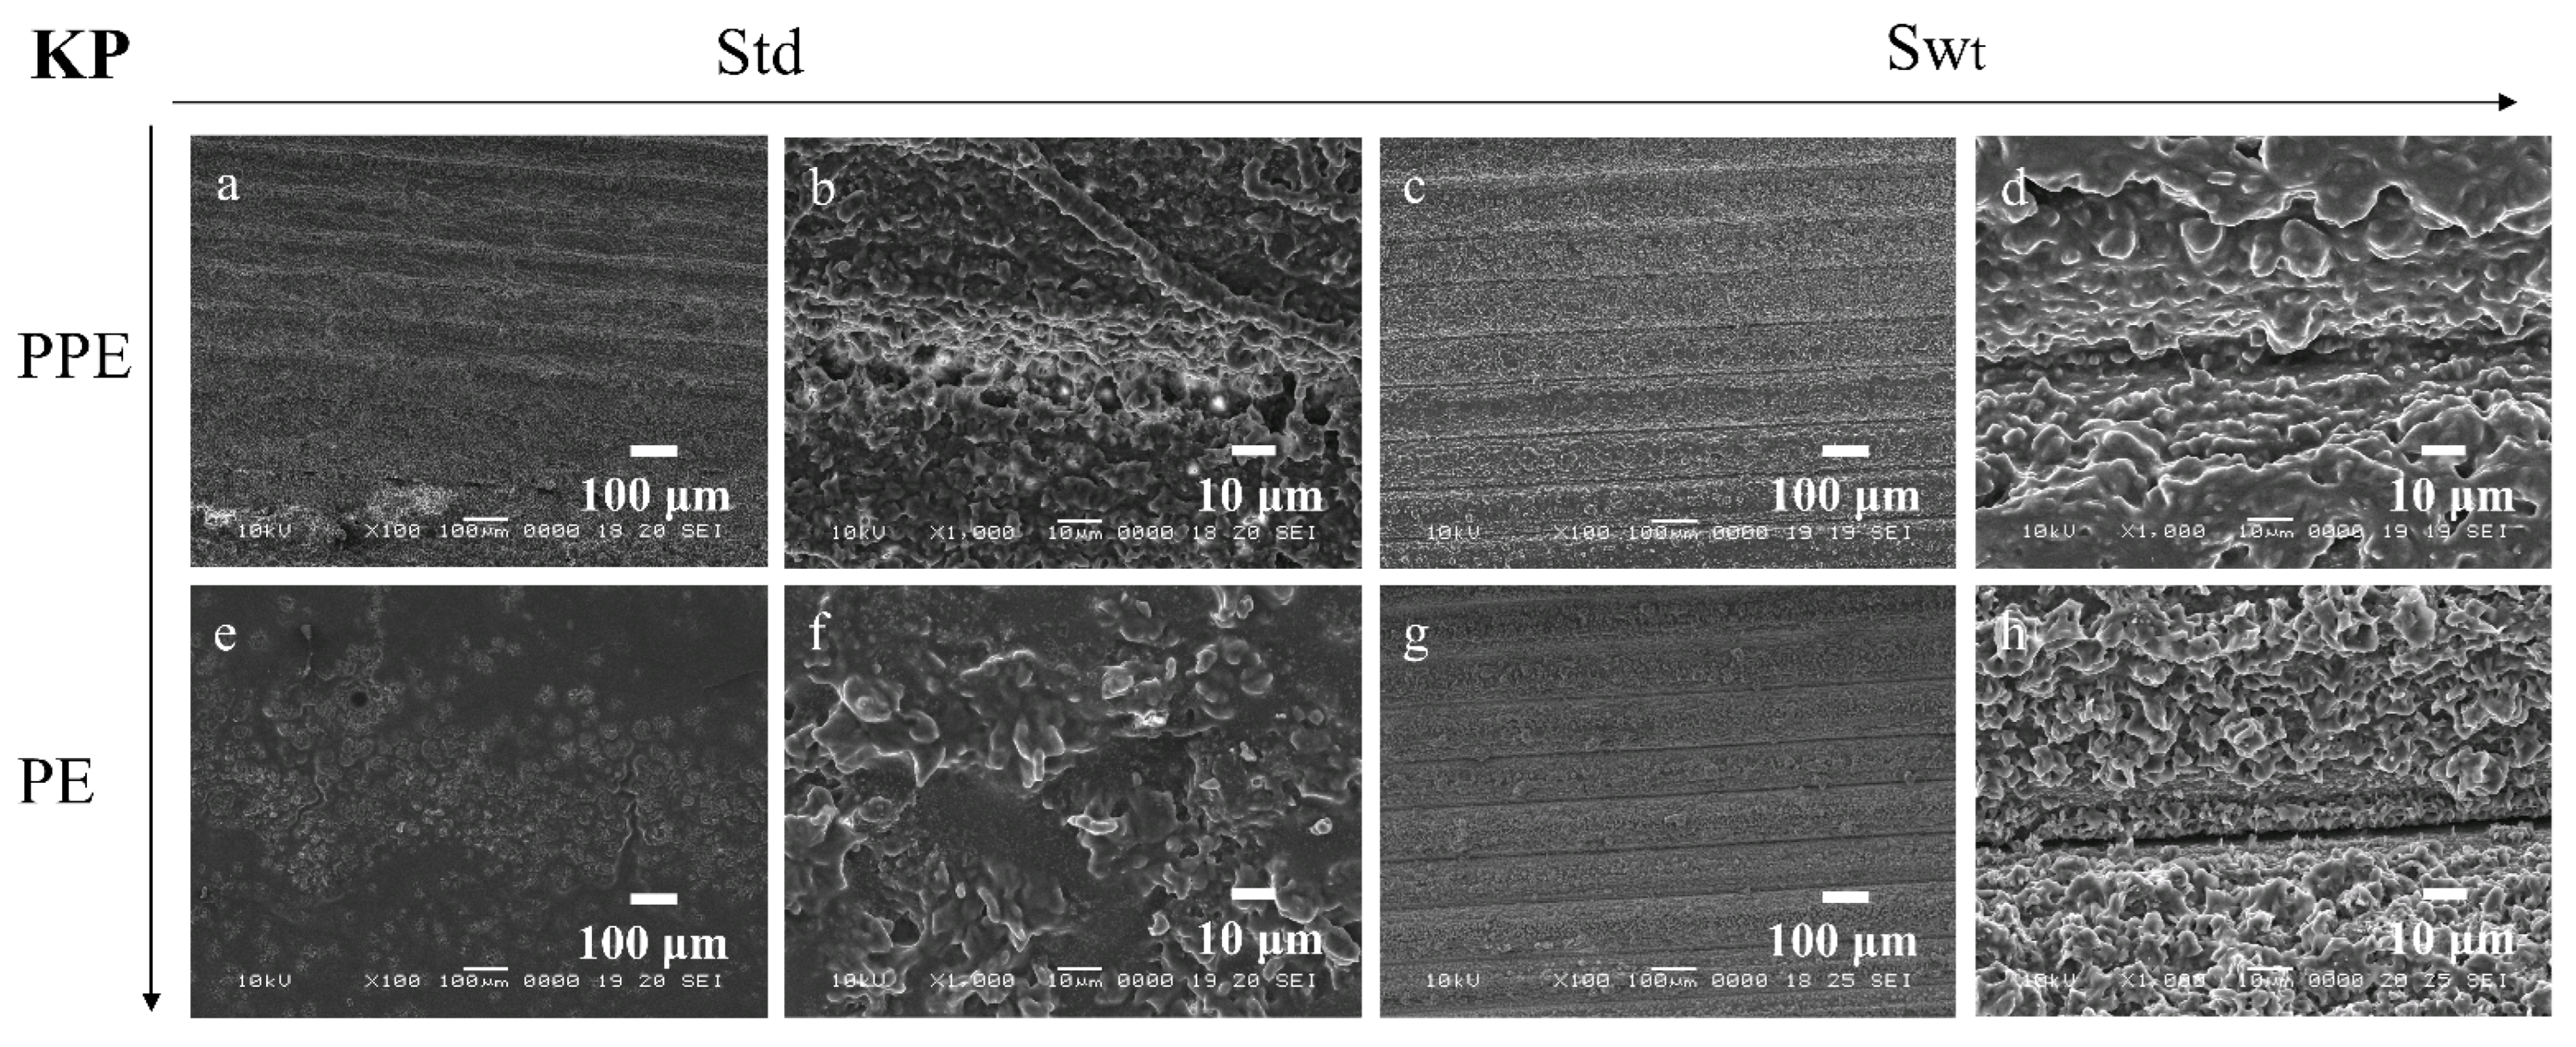
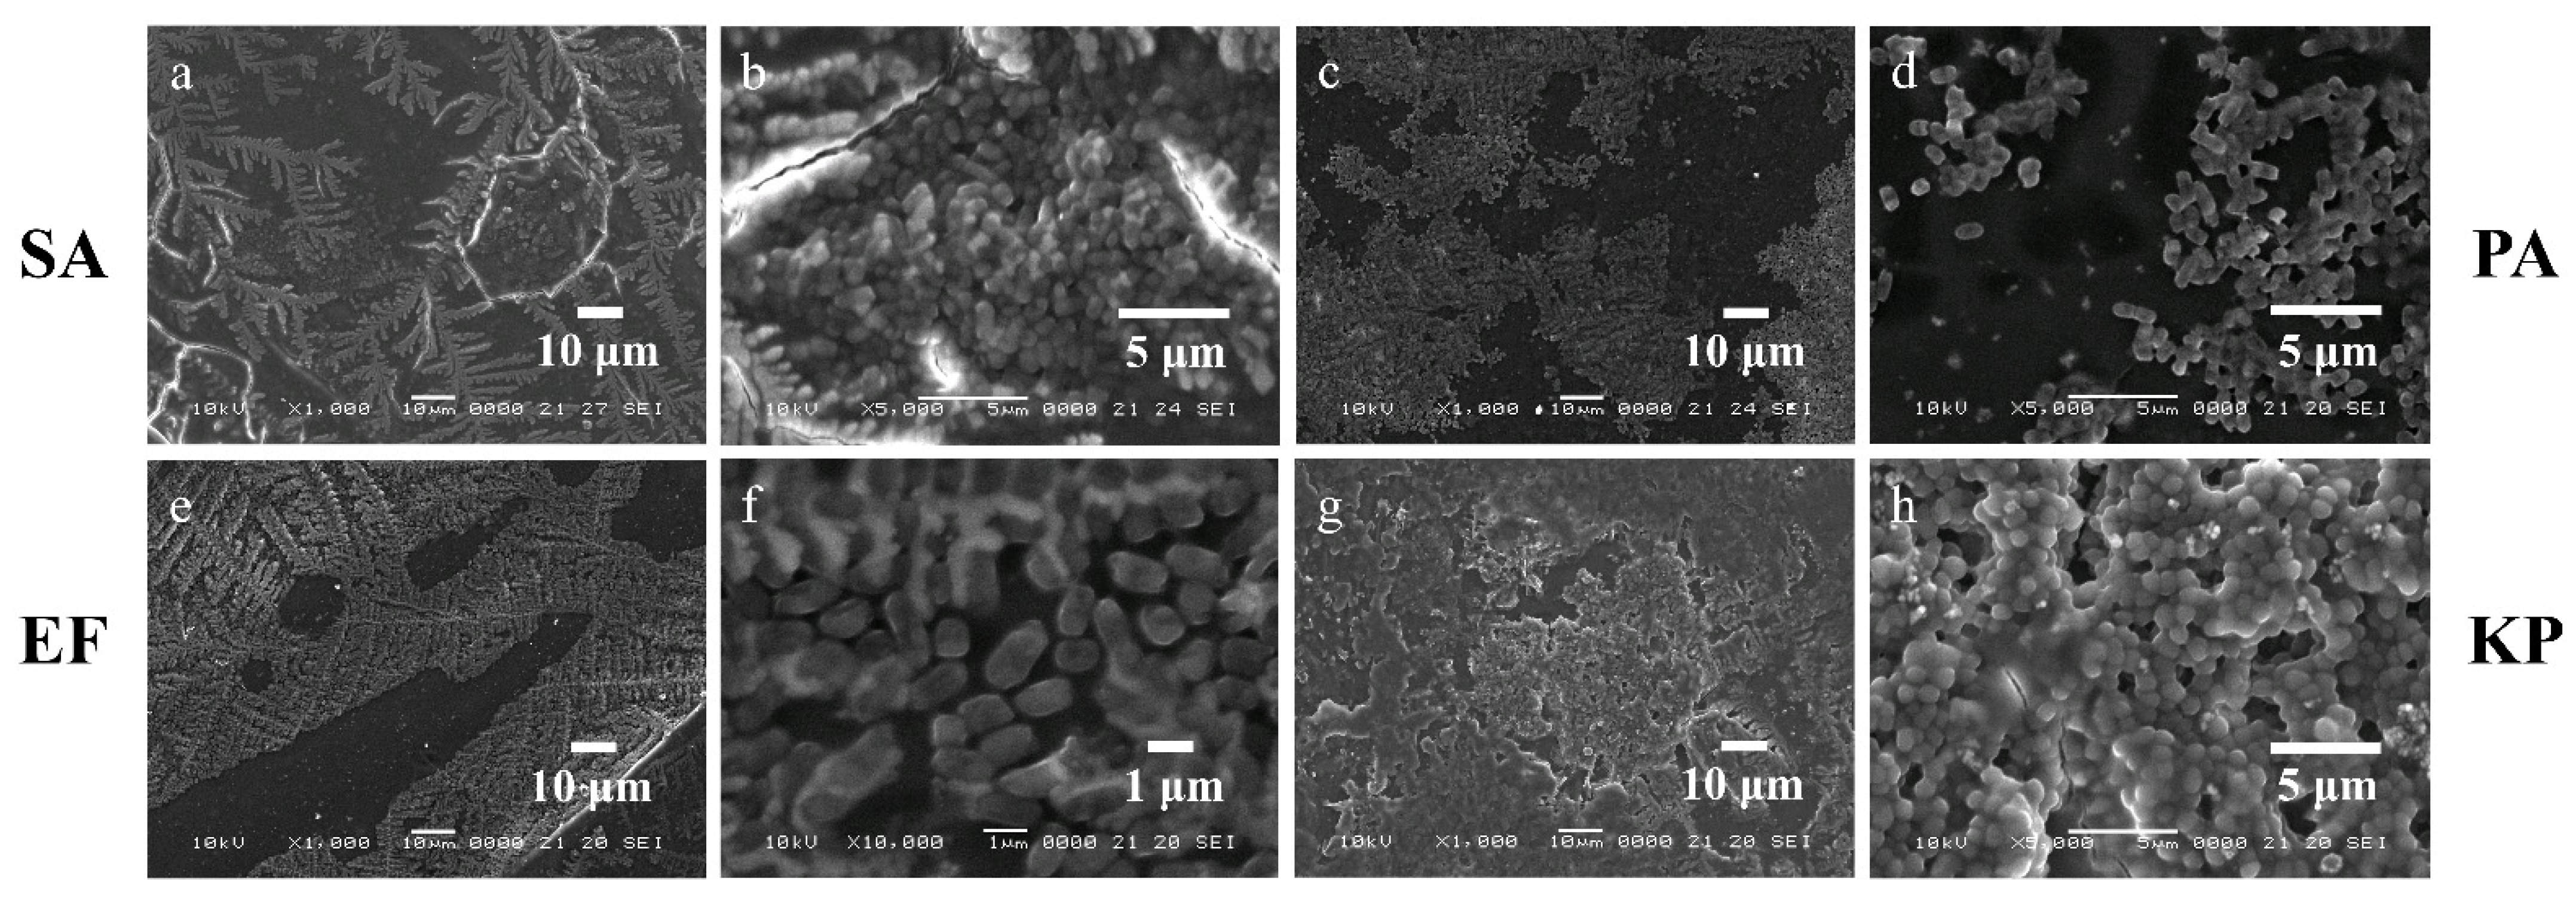
3.4. Scanning Electron Microscopy
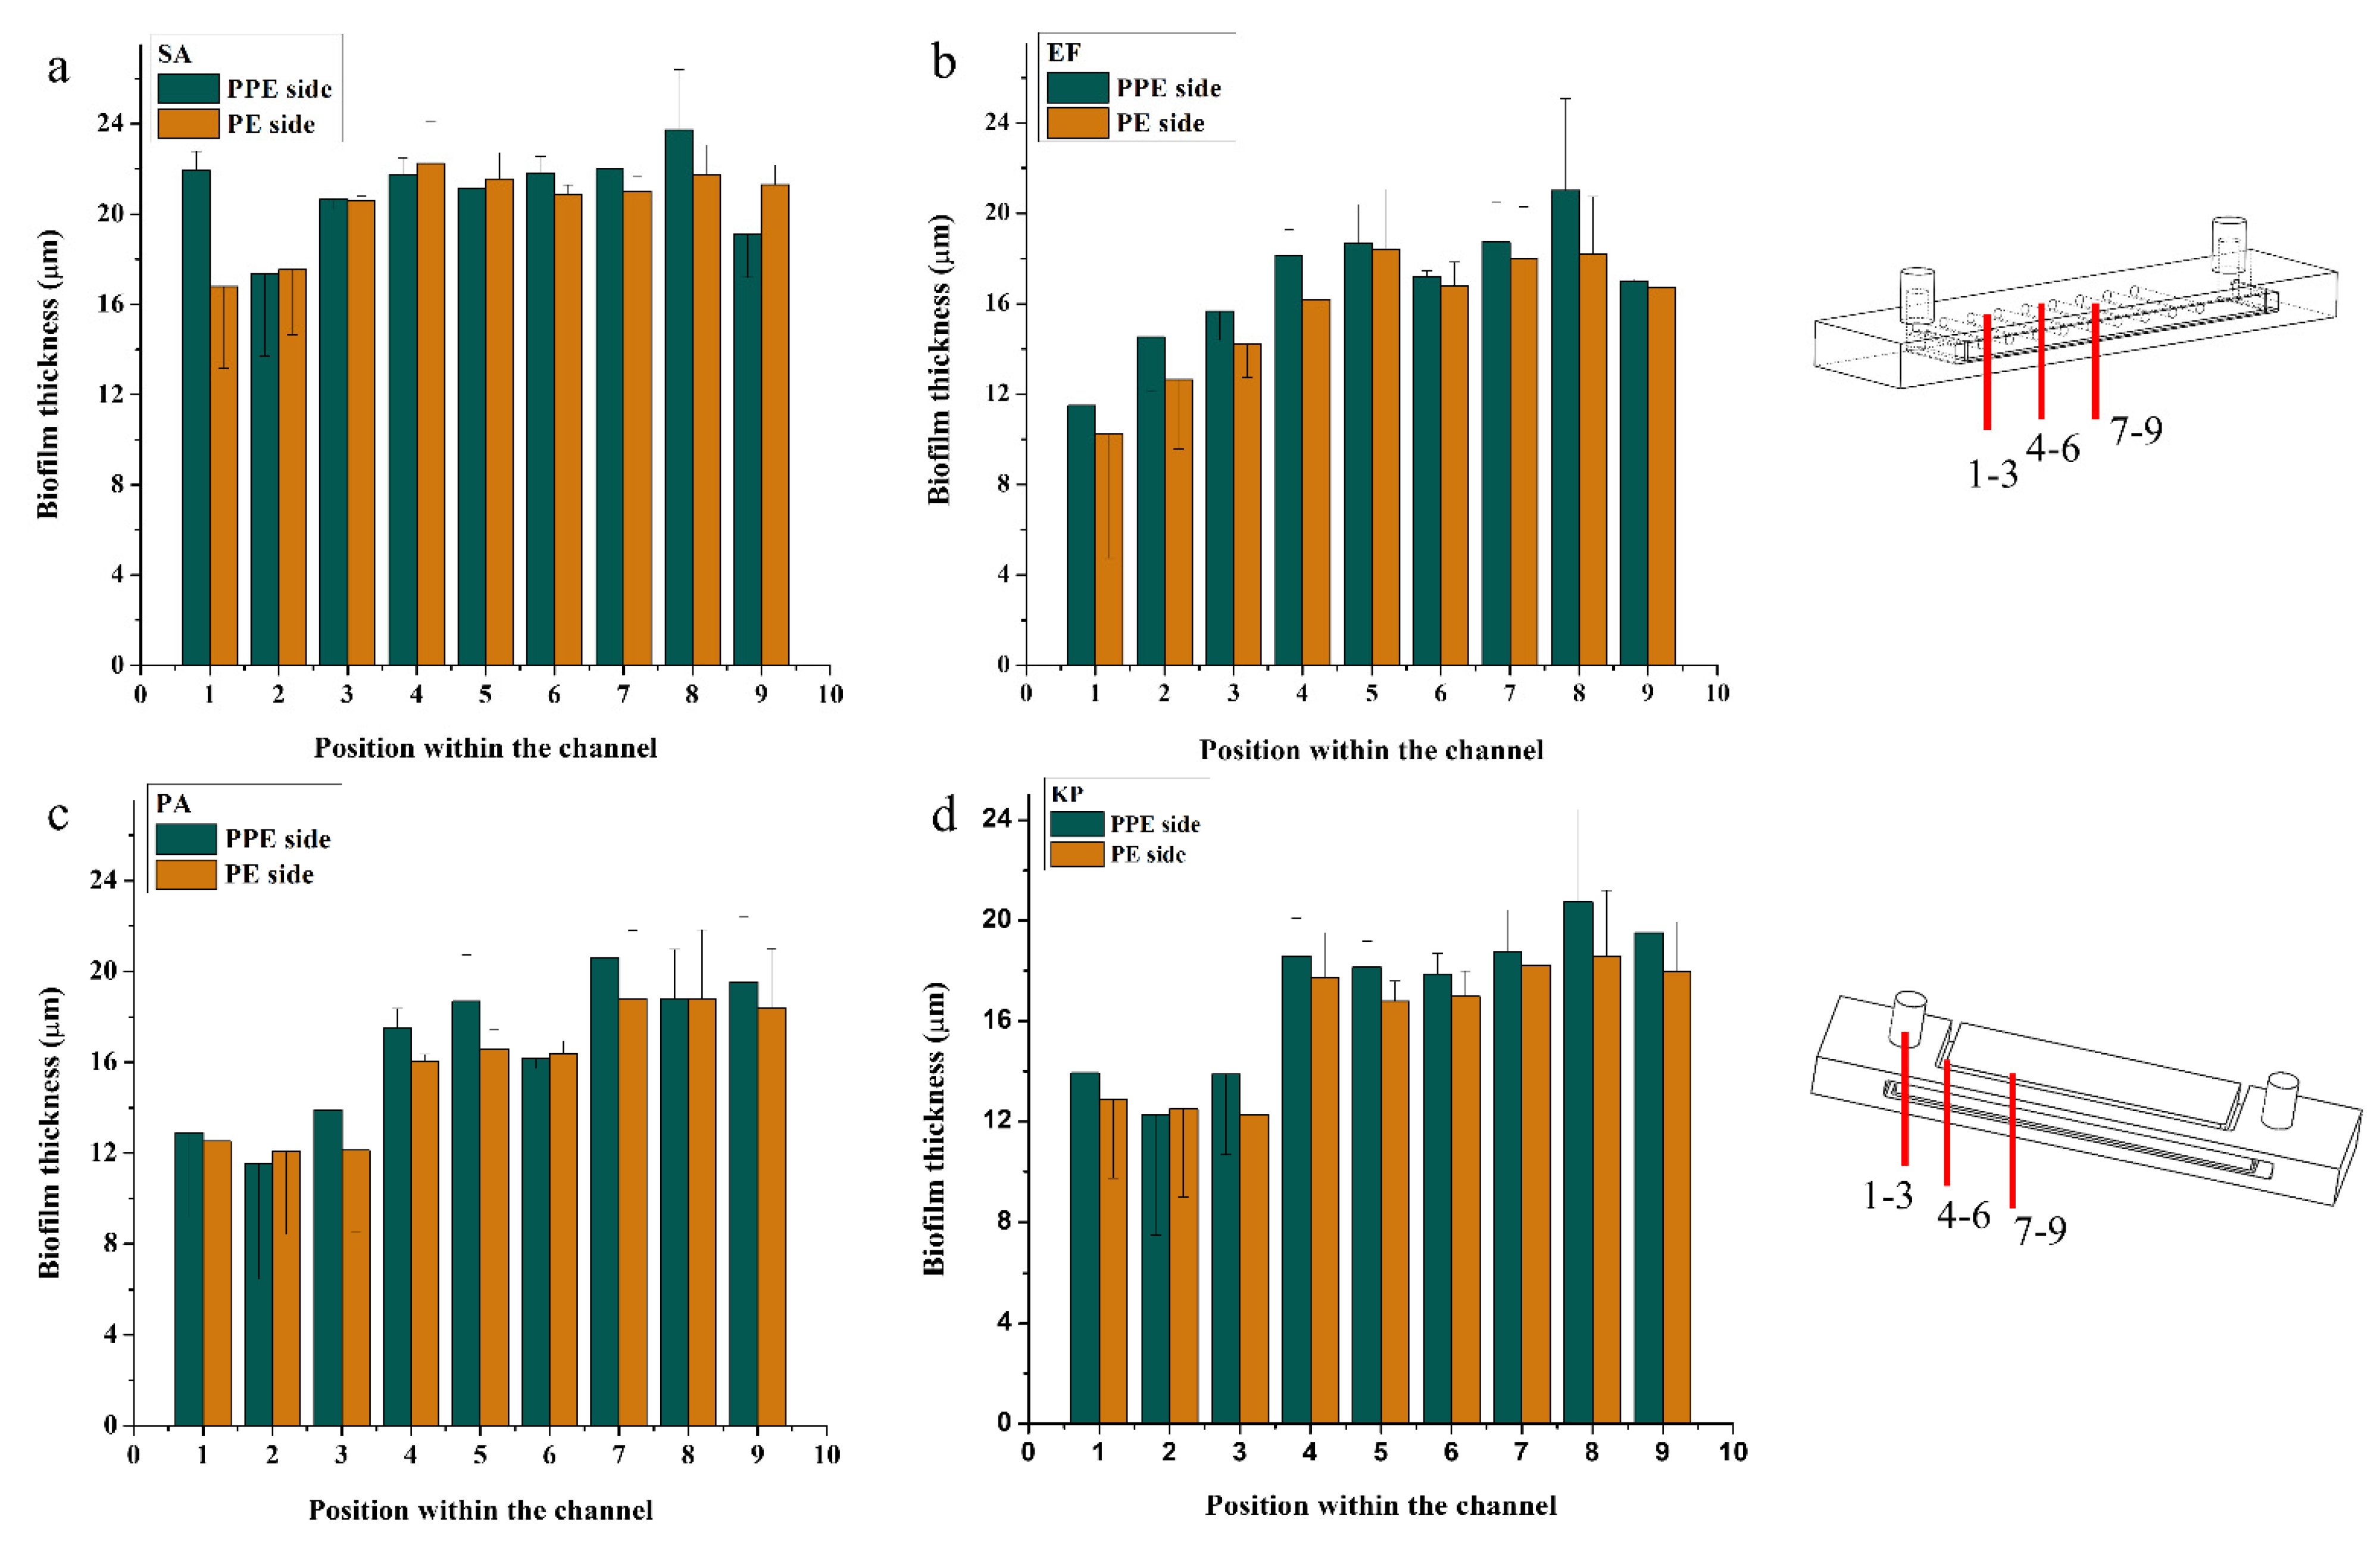
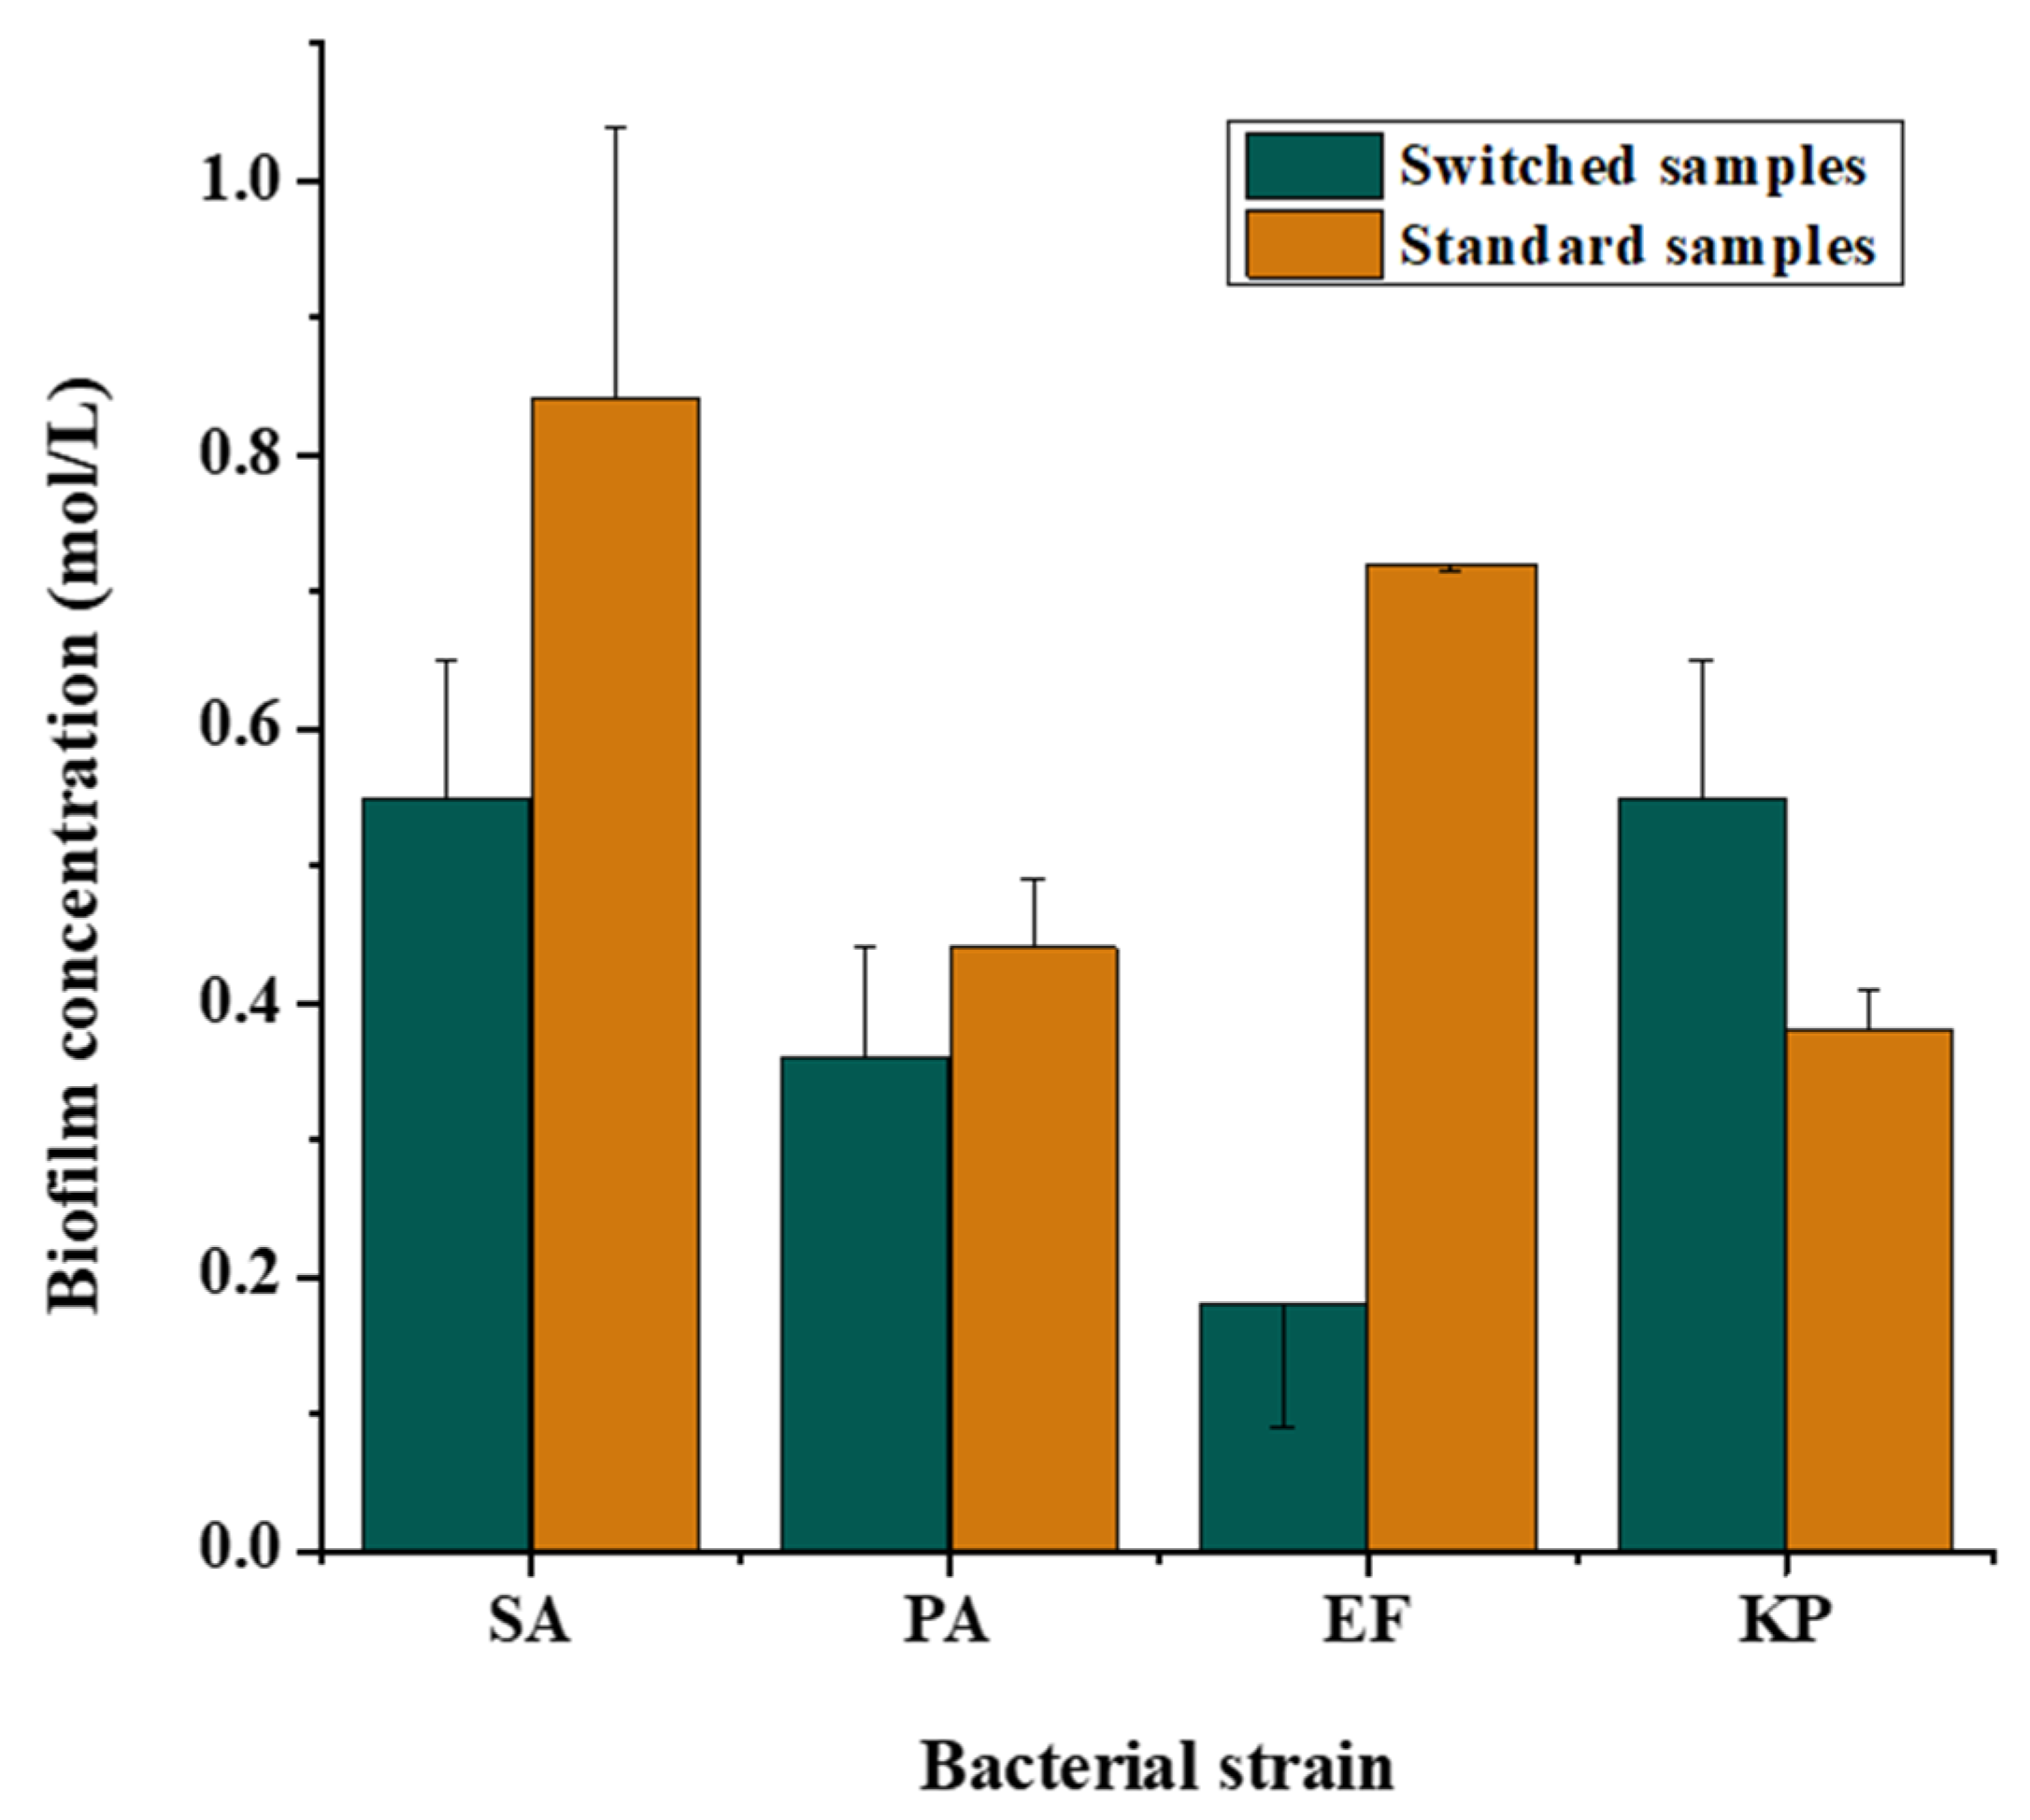
3.5. Quantitative Analysis
4. Conclusions
Author Contributions
Funding
Acknowledgments
Conflicts of Interest
References
- Betts, J.I.; Baganz, F. Miniature bioreactors: Current practices and future opportunities. Microb. Cell Fact. 2006, 5, 21. [Google Scholar] [CrossRef] [PubMed][Green Version]
- Ho, P.; Westerwalbesloh, C.; Kaganovitch, E.; Grünberger, A.; Neubauer, P.; Kohlheyer, D.; von Lieres, E. Reproduction of large-scale bioreactor conditions on microfluidic chips. Microorganisms 2019, 7, 105. [Google Scholar] [CrossRef] [PubMed]
- Nuchtavorn, N.; Suntornsuk, W.; Lunte, S.M.; Suntornsuk, L. Recent applications of microchip electrophoresis to biomedical analysis. J. Pharm. Biomed. Anal. 2015, 113, 72–96. [Google Scholar] [CrossRef] [PubMed]
- Shen, H.H.; Fan, S.K.; Kim, C.J.; Yao, D.J. EWOD microfluidic systems for biomedical applications. Microfluid. Nanofluid. 2014, 16, 965–987. [Google Scholar] [CrossRef]
- Skommer, J.; Wlodkowic, D. Successes and future outlook for microfluidics-based cardiovascular drug discovery. Expert Opin. Drug Discov. 2015, 10, 231–244. [Google Scholar] [CrossRef]
- Vladisavljević, G.T.; Khalid, N.; Neves, M.A.; Kuroiwa, T.; Nakajima, M.; Uemura, K.; Ichikawa, S.; Kobayashi, I. Industrial lab-on-a-chip: Design, applications and scale-up for drug discovery and delivery. Adv. Drug Deliv. Rev. 2013, 65, 1626–1663. [Google Scholar] [CrossRef]
- Ding, X.; Srinivasan, B.; Tung, S. Development and Applications of Portable Biosensors. J. Lab. Autom. 2015, 20, 365–389. [Google Scholar] [CrossRef]
- Mirasoli, M.; Guardigli, M.; Michelini, E.; Roda, A. Recent advancements in chemical luminescence-based lab-on-chip and microfluidic platforms for bioanalysis. J. Pharm. Biomed. Anal. 2014, 87, 36–52. [Google Scholar] [CrossRef]
- Breslauer, D.N.; Lee, P.J.; Lee, L.P. Microfluidics-based systems biology. Mol. Biosyst. 2006, 2, 97–112. [Google Scholar] [CrossRef]
- Azeredo, J.; Azevedo, N.F.; Briandet, R.; Cerca, N.; Coenye, T.; Costa, A.R.; Desvaux, M.; Di Bonaventura, G.; Hébraud, M.; Jaglic, Z.; et al. Critical review on biofilm methods. Crit. Rev. Microbiol. 2017, 43, 313–351. [Google Scholar] [CrossRef]
- Faustino, V.; Catarino, S.O.; Lima, R.; Minas, G. Biomedical microfluidic devices by using low-cost fabrication techniques: A review. J. Biomech. 2016, 49, 2280–2292. [Google Scholar] [CrossRef] [PubMed]
- Ziaie, B.; Baldi, A.; Lei, M.; Gu, Y.; Siegel, R.A. Hard and soft micromachining for BioMEMS: Review of techniques and examples of applications in microfluidics and drug delivery. Adv. Drug Deliv. Rev. 2004, 56, 145–172. [Google Scholar] [CrossRef] [PubMed]
- Amin, R.; Knowlton, S.; Hart, A.; Yenilmez, B.; Ghaderinezhad, F.; Katebifar, S.; Messina, M.; Khademhosseini, A.; Tasoglu, S. 3D-printed microfluidic devices. Biofabrication 2016, 8, 022001. [Google Scholar] [CrossRef] [PubMed]
- Murariu, M.; Dubois, P. PLA composites: From production to properties. Adv. Drug Deliv. Rev. 2016, 107, 17–46. [Google Scholar] [CrossRef] [PubMed]
- Hodžić, D.; Pandžić, A.; Hajro, I.; Tasić, P. Strength comparison of FDM 3D printed PLA made by different manufacturers. TEM J. 2020, 9, 966–970. [Google Scholar] [CrossRef]
- Waheed, S.; Cabot, J.M.; Macdonald, N.P.; Lewis, T.; Guijt, R.M.; Paull, B.; Breadmore, M.C. 3D printed microfluidic devices: Enablers and barriers. Lab Chip 2016, 16, 1993–2013. [Google Scholar] [CrossRef]
- Kwizera, E.A.; Sun, M.; White, A.M.; Li, J.; He, X. Methods of Generating Dielectrophoretic Force for Microfluidic Manipulation of Bioparticles. ACS Biomater. Sci. Eng. 2021, 7, 2043–2063. [Google Scholar] [CrossRef]
- Chin, H.K.; Yee, C.L.; Rodriguez, I.; Yang, C.; Youcef-Toumi, K. Dynamic cell fractionation and transportation using moving dielectrophoresis. Anal. Chem. 2007, 79, 6975–6987. [Google Scholar] [CrossRef]
- Zaman, M.A.; Padhy, P.; Ren, W.; Wu, M.; Hesselink, L. Microparticle transport along a planar electrode array using moving dielectrophoresis. J. Appl. Phys. 2021, 130, 034902. [Google Scholar] [CrossRef]
- Kharboutly, M.; Gauthier, M.; Chaillet, N. Modeling the trajectory of a microparticle in a dielectrophoresis device. J. Appl. Phys. 2009, 106, 114312. [Google Scholar] [CrossRef]
- Costerton, J.W. Bacterial Biofilms: A Common Cause of Persistent Infections. Science 1999, 284, 1318–1322. [Google Scholar] [CrossRef] [PubMed]
- Seneviratne, C.J. Microbial Biofilms; CRC Press: Boca Raton, FL, USA, 2017. [Google Scholar]
- Tong, S.Y.C.; Davis, J.S.; Eichenberger, E.; Holland, T.L.; Fowler, V.G. Staphylococcus aureus infections: Epidemiology, pathophysiology, clinical manifestations, and management. Clin. Microbiol. Rev. 2015, 28, 603–661. [Google Scholar] [CrossRef] [PubMed]
- Rasigade, J.P.; Vandenesch, F. Staphylococcus aureus: A pathogen with still unresolved issues. Infect. Genet. Evol. 2014, 21, 510–514. [Google Scholar] [CrossRef] [PubMed]
- García-Solache, M.; Rice, L.B. The enterococcus: A model of adaptability to its environment. Clin. Microbiol. Rev. 2019, 32, e00058-e18. [Google Scholar] [CrossRef]
- Bassetti, M.; Vena, A.; Croxatto, A.; Righi, E.; Guery, B. How to manage Pseudomonas aeruginosa infections. Drugs Context 2018, 7, 212527. [Google Scholar] [CrossRef]
- Bengoechea, J.A.; Sa Pessoa, J. Klebsiella pneumoniae infection biology: Living to counteract host defences. FEMS Microbiol. Rev. 2018, 43, 123–144. [Google Scholar] [CrossRef]
- Hou, J.; Wang, C.; Roze, R.T.; Gusnaniar, N.; Jong, E.D.; De Woudstra, W.; Ge, G.I.; Atema-smit, J.; Sjollema, J.; Ren, Y.; et al. Bacterial Density and Biofilm Structure Determined by Optical Coherence Tomography. Sci. Rep. 2019, 9, 9794. [Google Scholar] [CrossRef]


Publisher’s Note: MDPI stays neutral with regard to jurisdictional claims in published maps and institutional affiliations. |
© 2022 by the authors. Licensee MDPI, Basel, Switzerland. This article is an open access article distributed under the terms and conditions of the Creative Commons Attribution (CC BY) license (https://creativecommons.org/licenses/by/4.0/).
Share and Cite
Csapai, A.; Toc, D.A.; Popa, F.; Tosa, N.; Pascalau, V.; Costache, C.; Botan, A.; Popa, C.O. 3D Printed Microfluidic Bioreactors Used for the Preferential Growth of Bacterial Biofilms through Dielectrophoresis. Micromachines 2022, 13, 1377. https://doi.org/10.3390/mi13091377
Csapai A, Toc DA, Popa F, Tosa N, Pascalau V, Costache C, Botan A, Popa CO. 3D Printed Microfluidic Bioreactors Used for the Preferential Growth of Bacterial Biofilms through Dielectrophoresis. Micromachines. 2022; 13(9):1377. https://doi.org/10.3390/mi13091377
Chicago/Turabian StyleCsapai, Alexandra, Dan A. Toc, Florin Popa, Nicoleta Tosa, Violeta Pascalau, Carmen Costache, Alexandru Botan, and Catalin O. Popa. 2022. "3D Printed Microfluidic Bioreactors Used for the Preferential Growth of Bacterial Biofilms through Dielectrophoresis" Micromachines 13, no. 9: 1377. https://doi.org/10.3390/mi13091377
APA StyleCsapai, A., Toc, D. A., Popa, F., Tosa, N., Pascalau, V., Costache, C., Botan, A., & Popa, C. O. (2022). 3D Printed Microfluidic Bioreactors Used for the Preferential Growth of Bacterial Biofilms through Dielectrophoresis. Micromachines, 13(9), 1377. https://doi.org/10.3390/mi13091377