
Concurrent Topological Structure and Cross-Infill Angle Optimization for Material Extrusion Polymer Additive Manufacturing with Microstructure Modeling


Abstract
:1. Introduction
2. Details of the Proposed Method
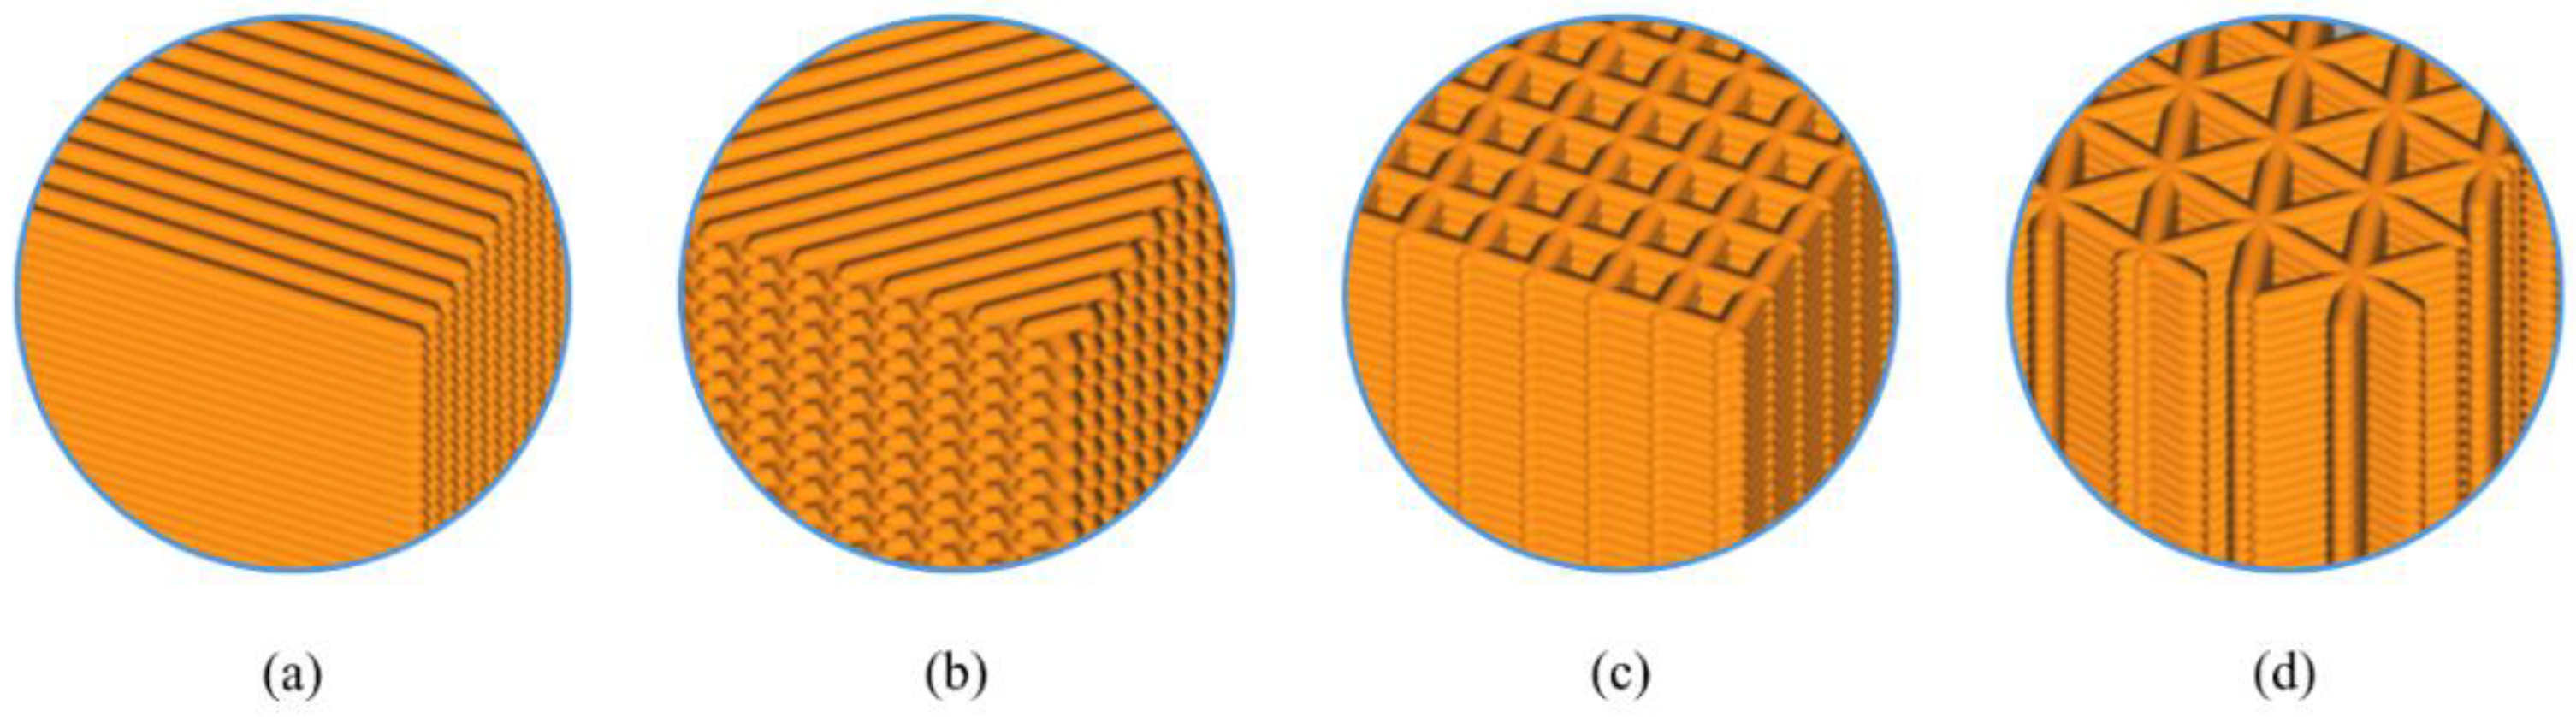
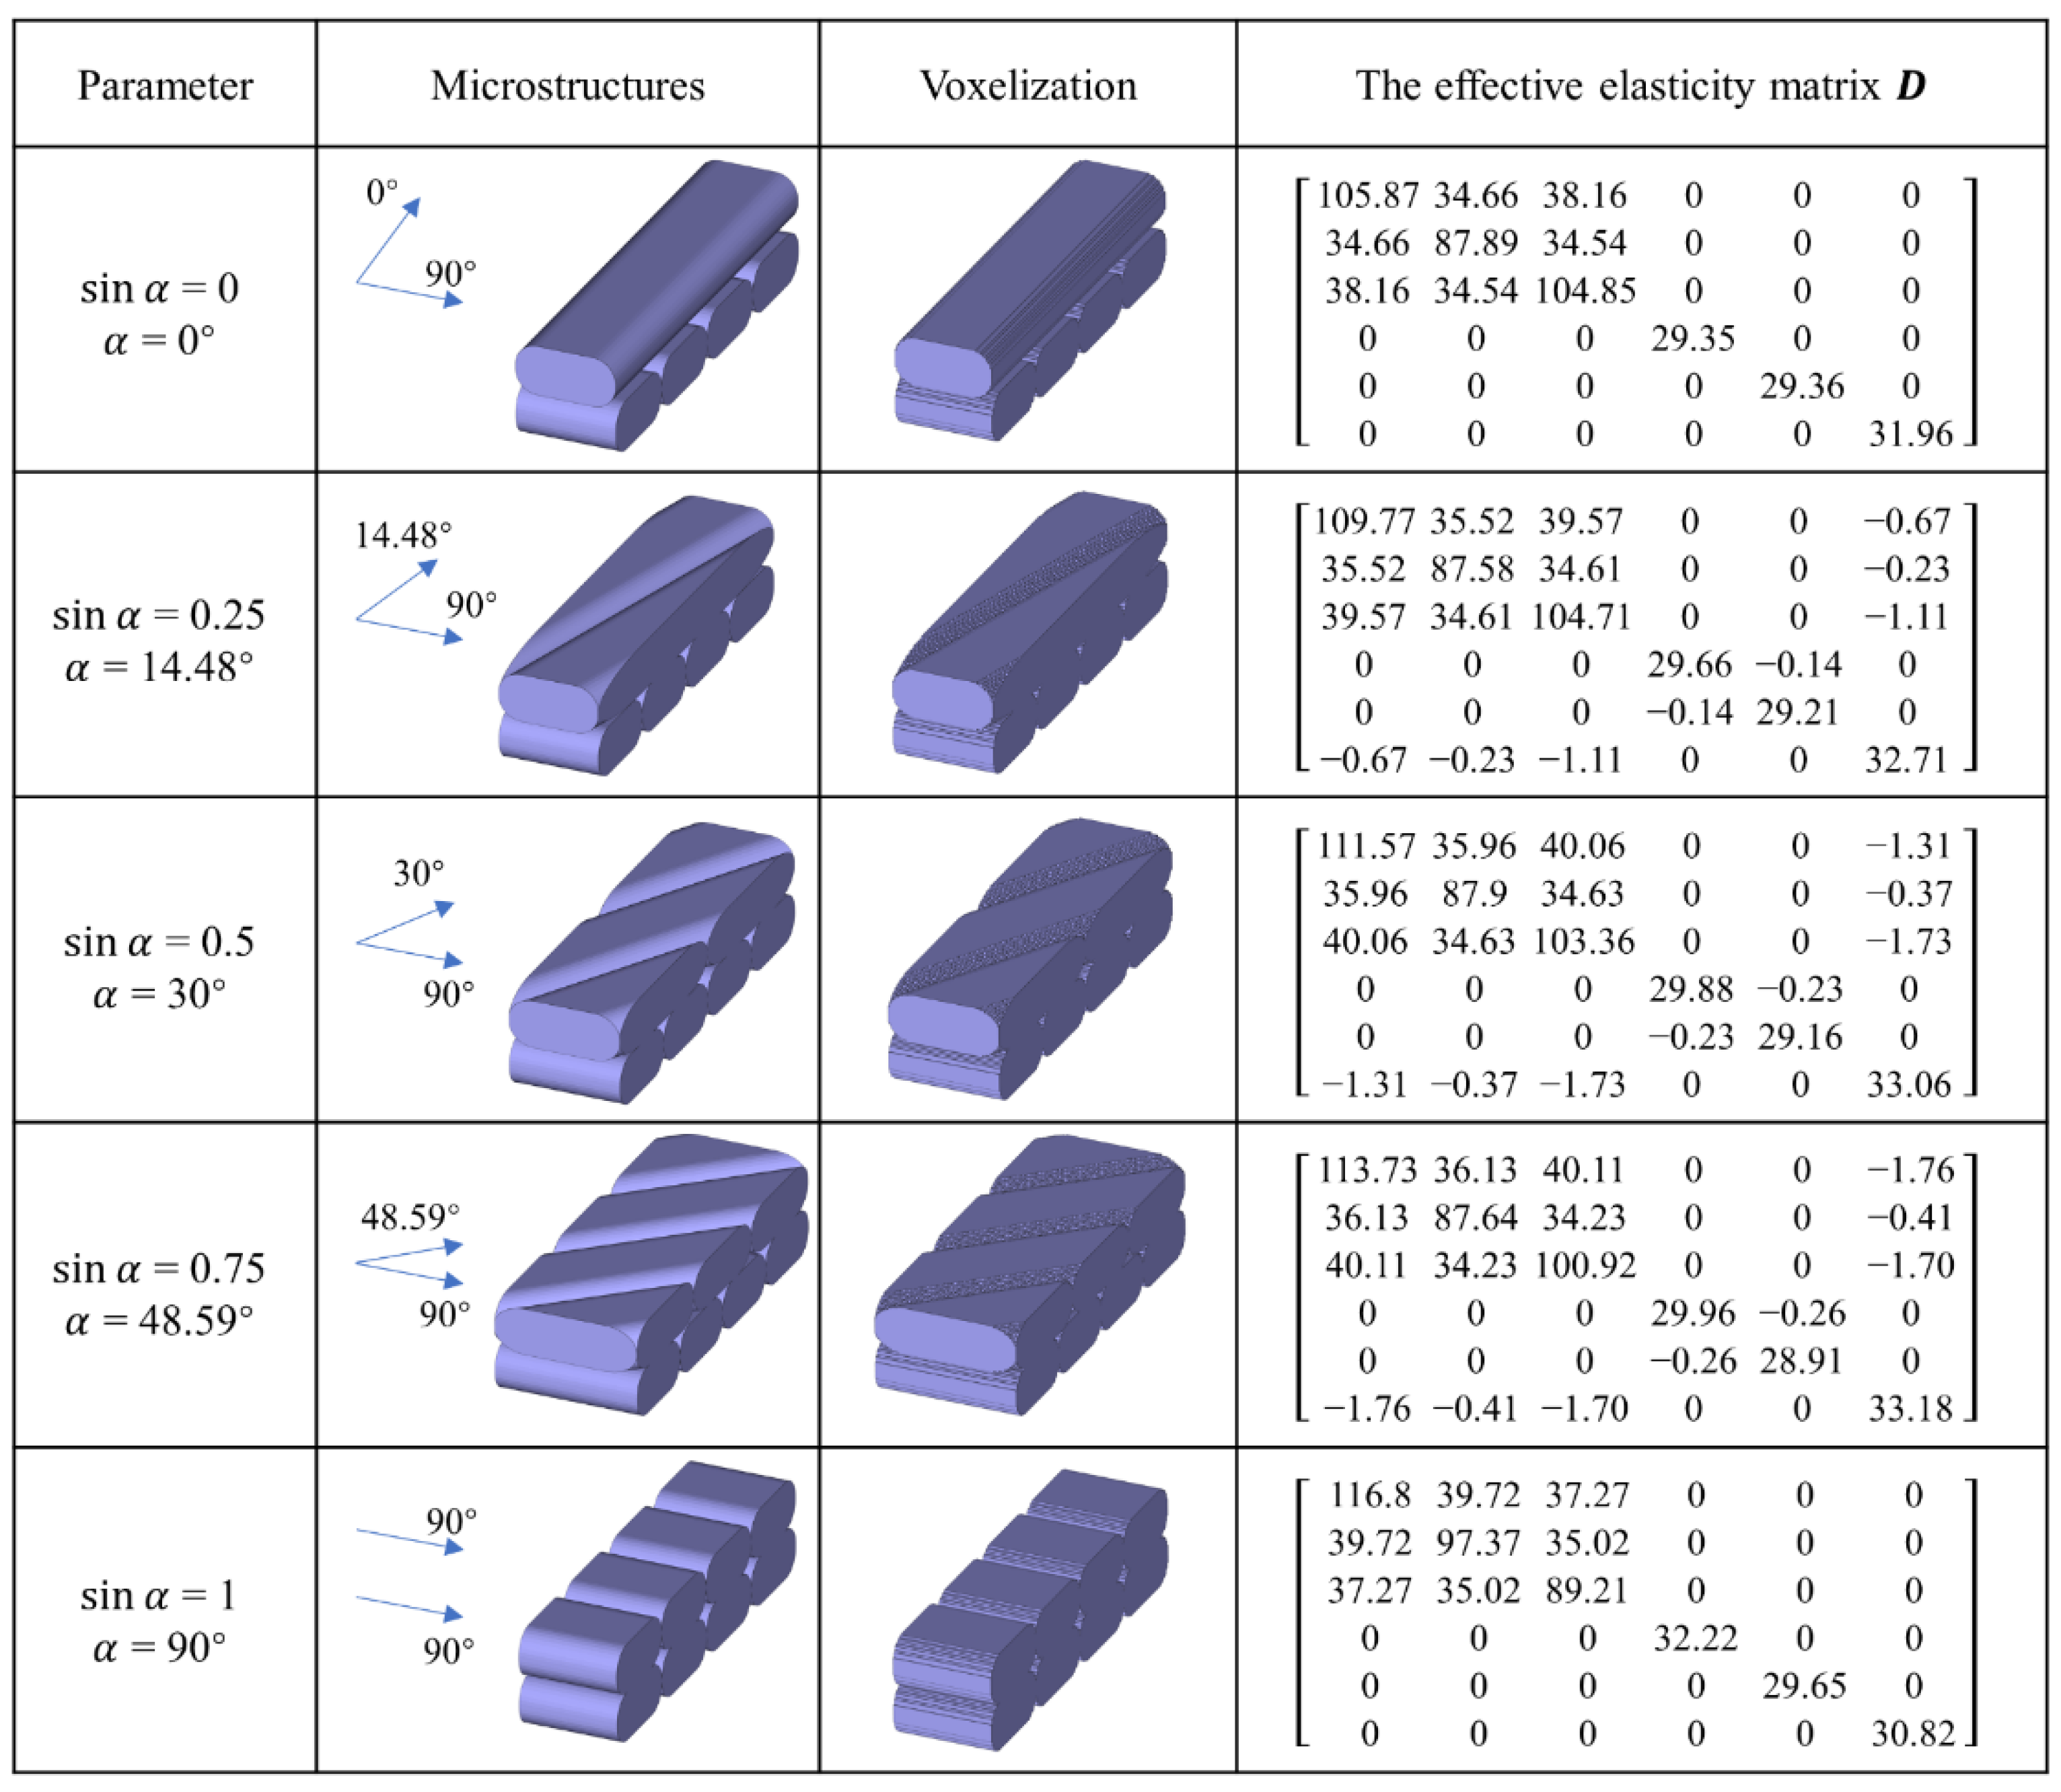
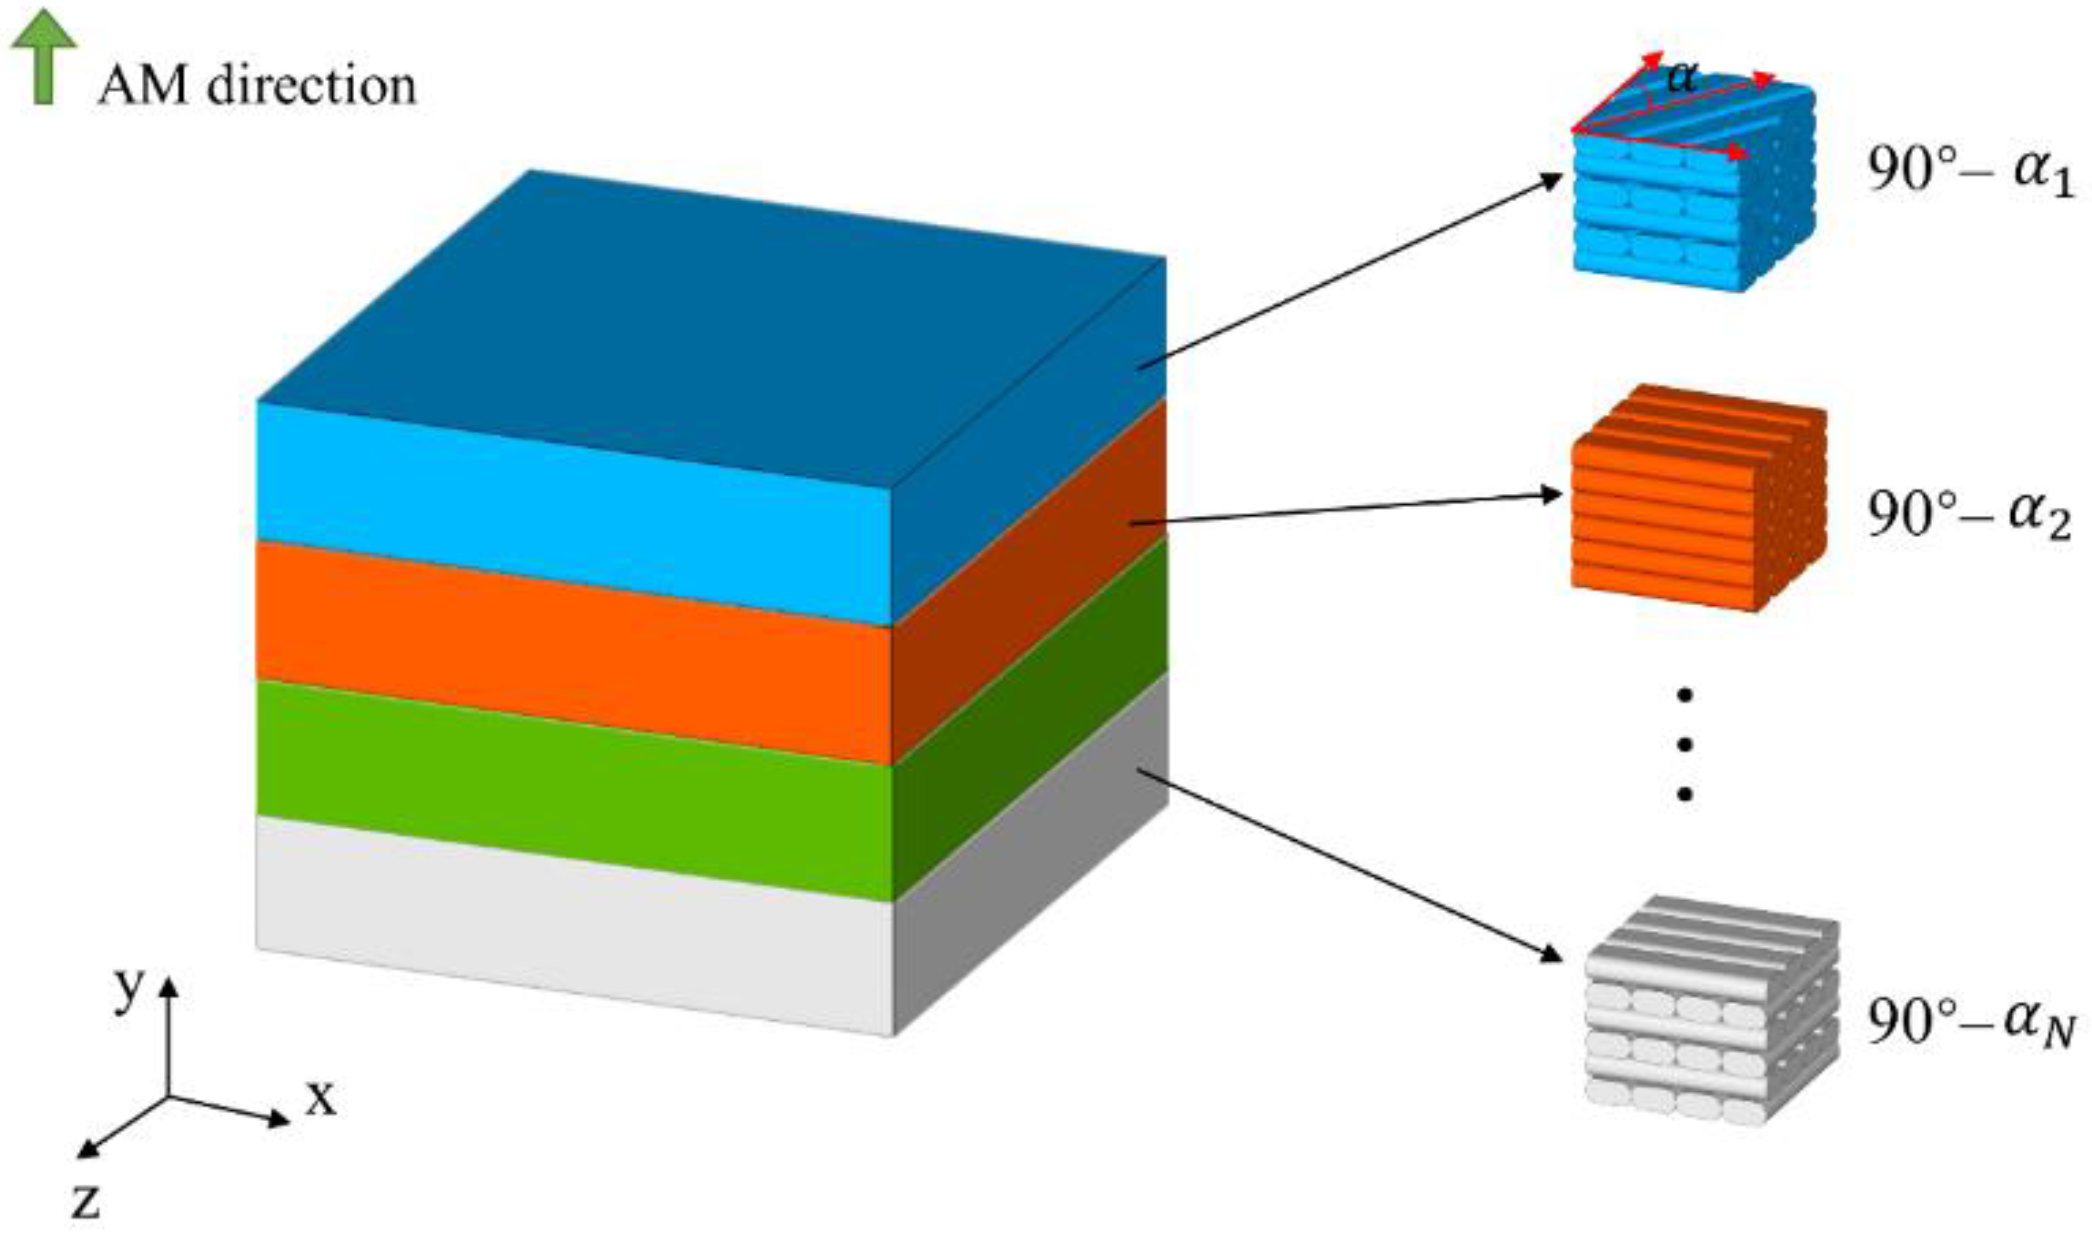
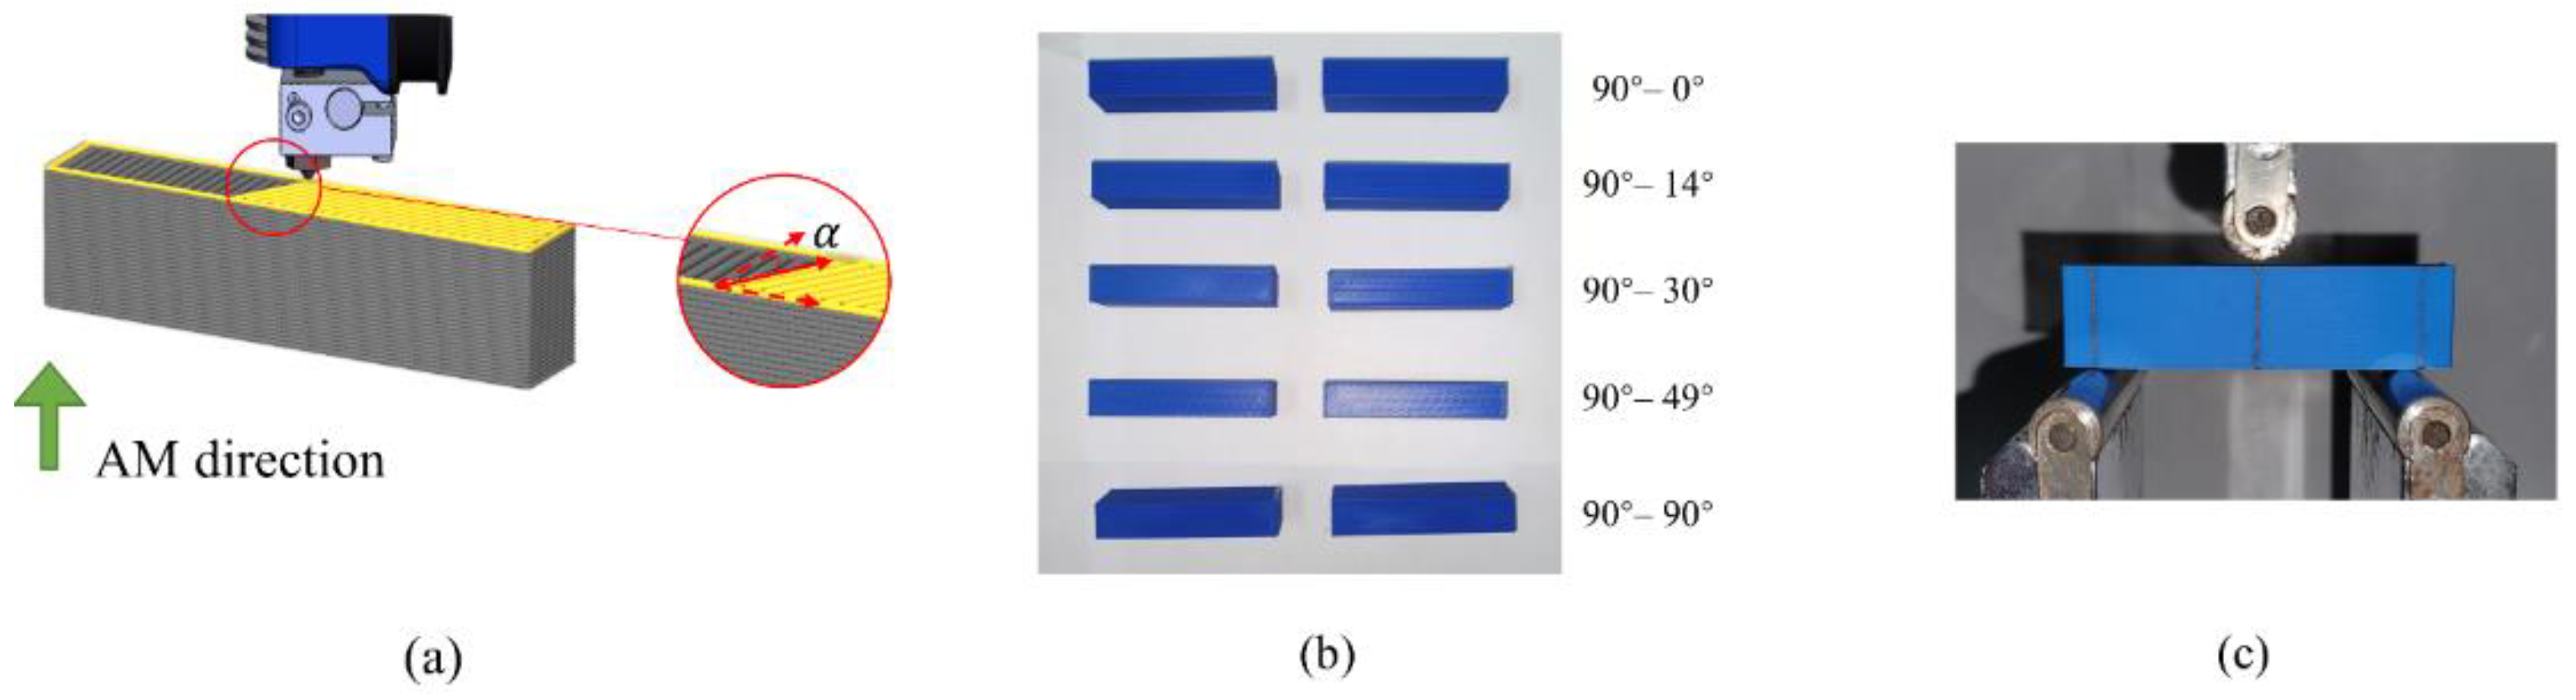
2.1. Geometric Modeling and Numerical Homogenization
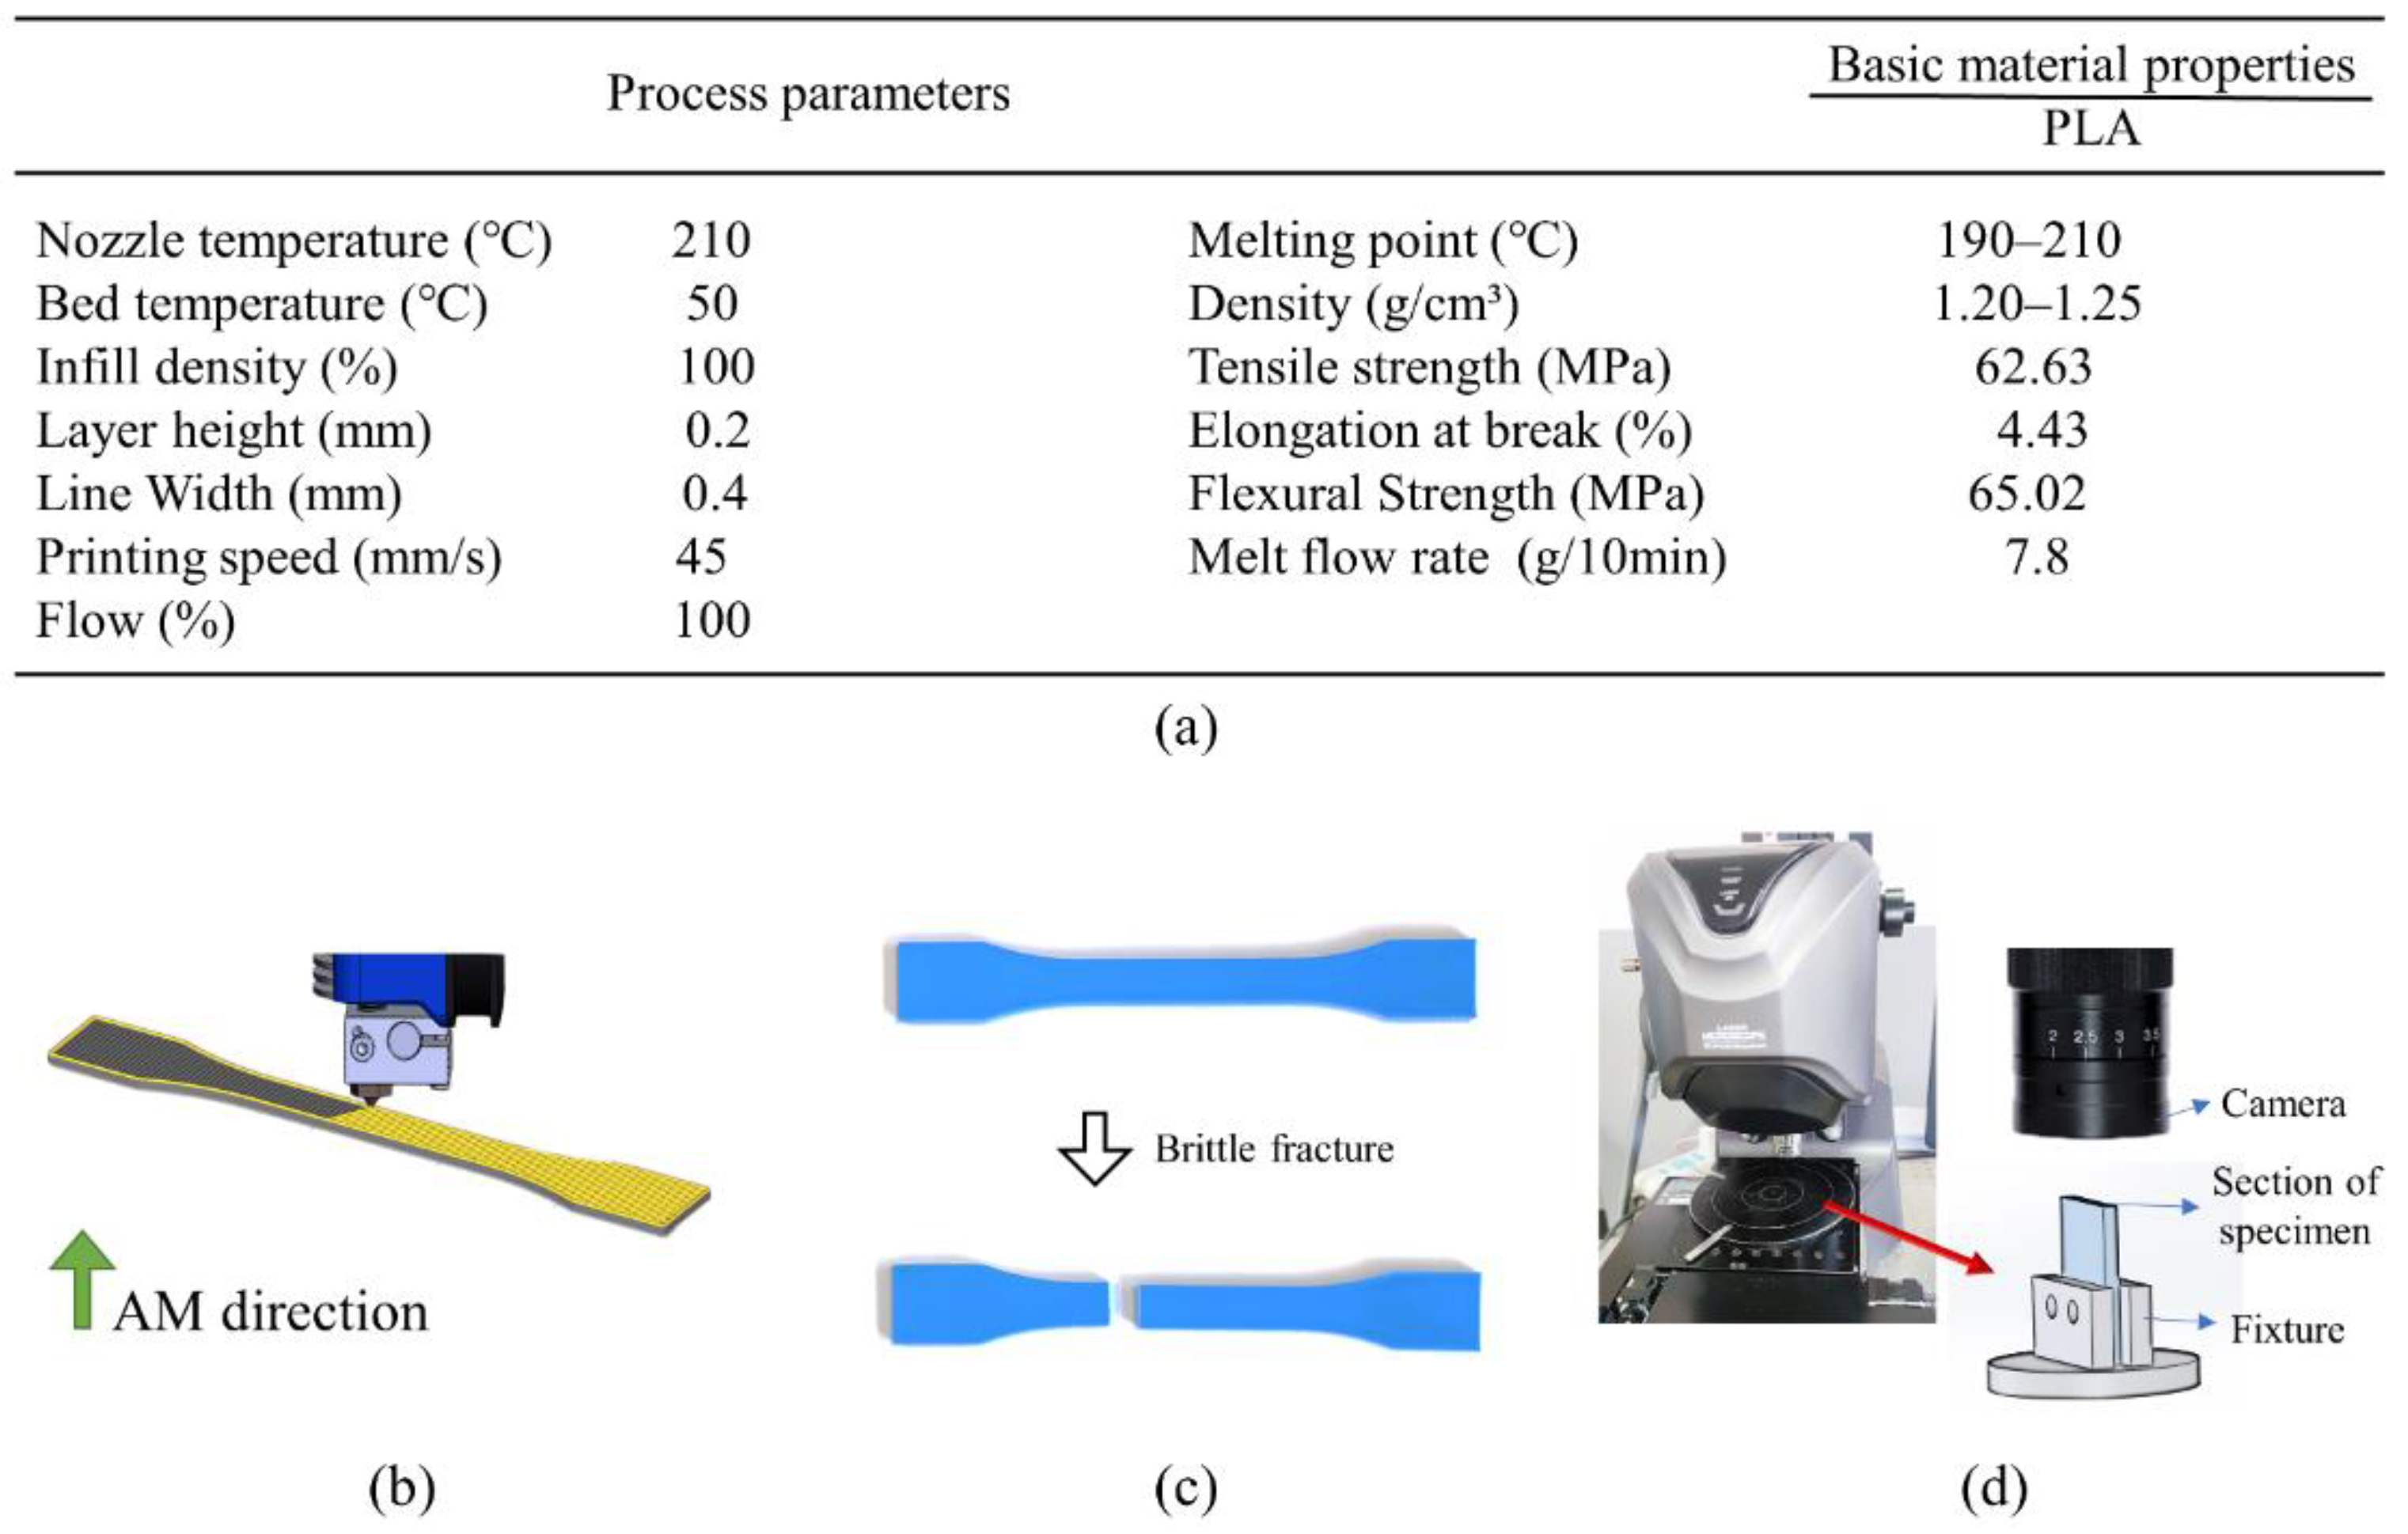
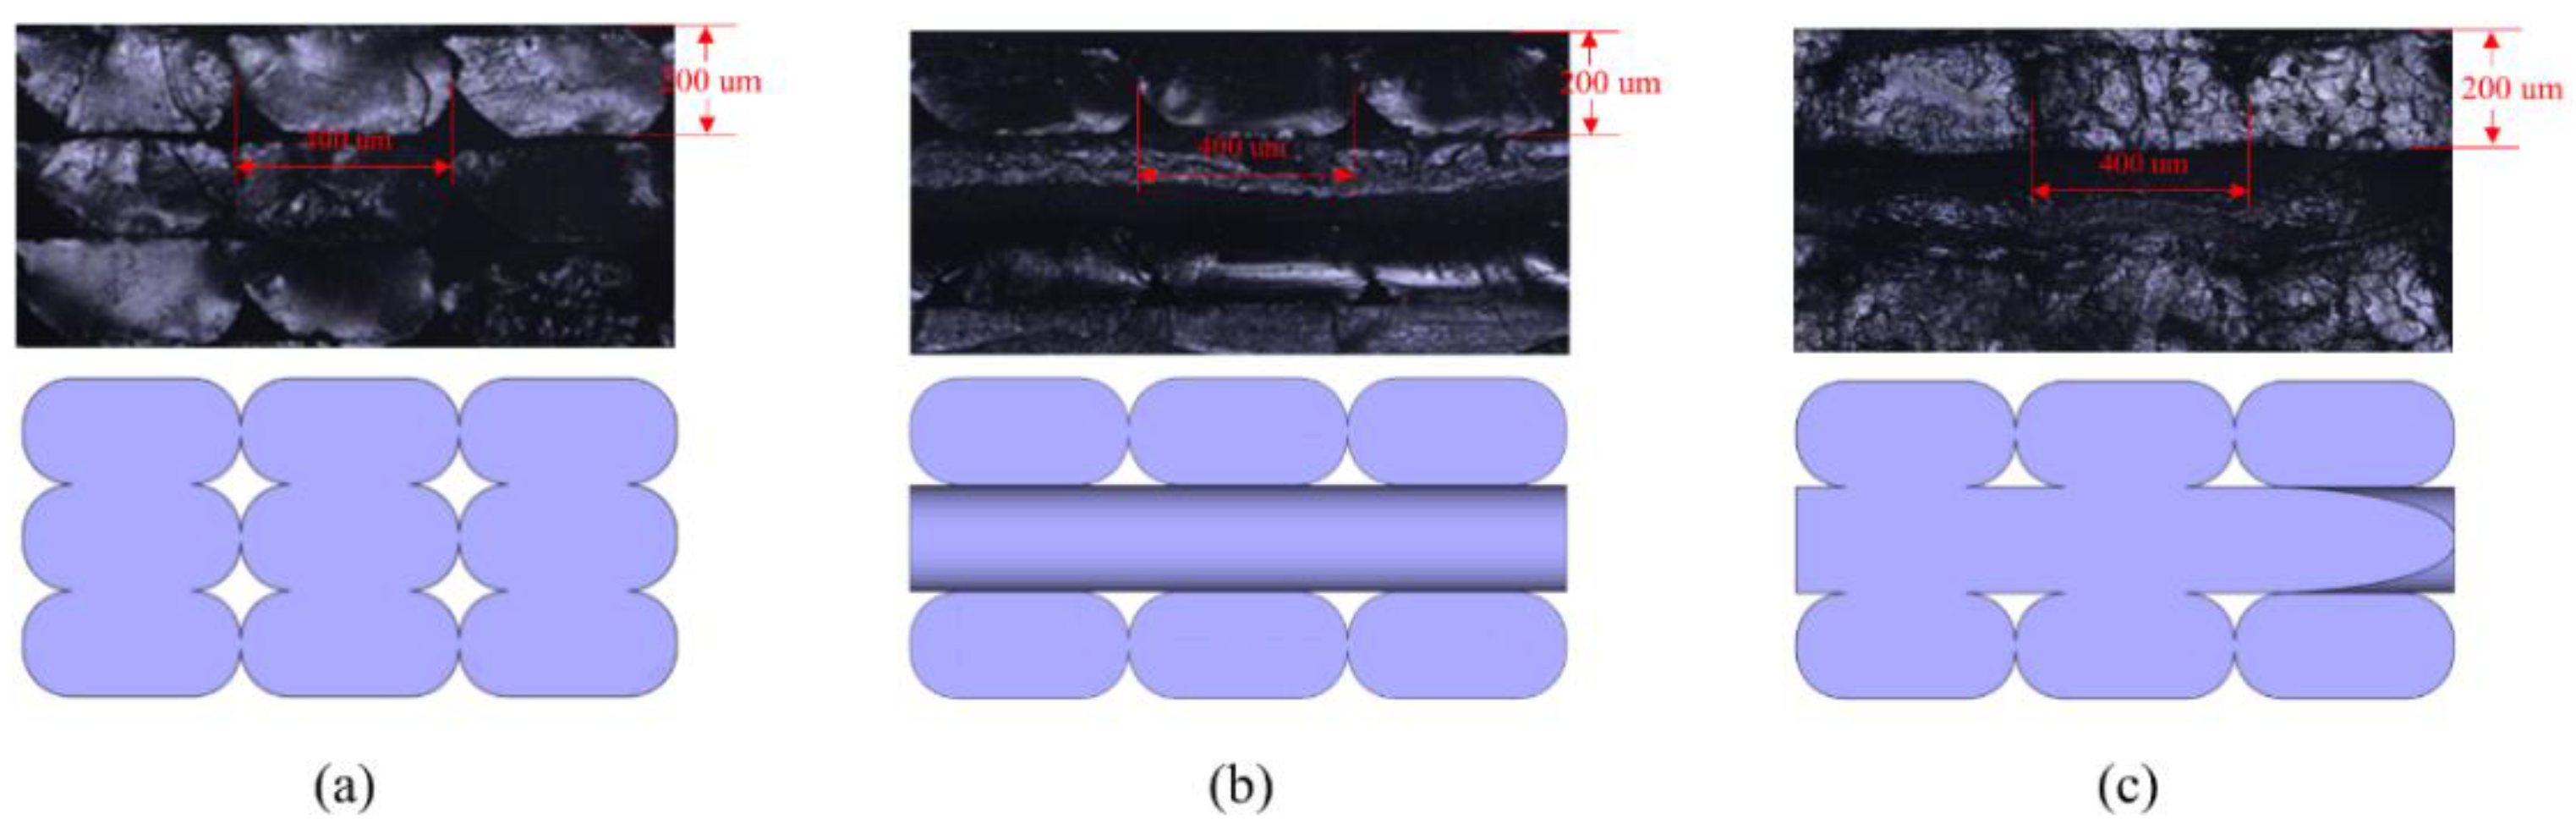
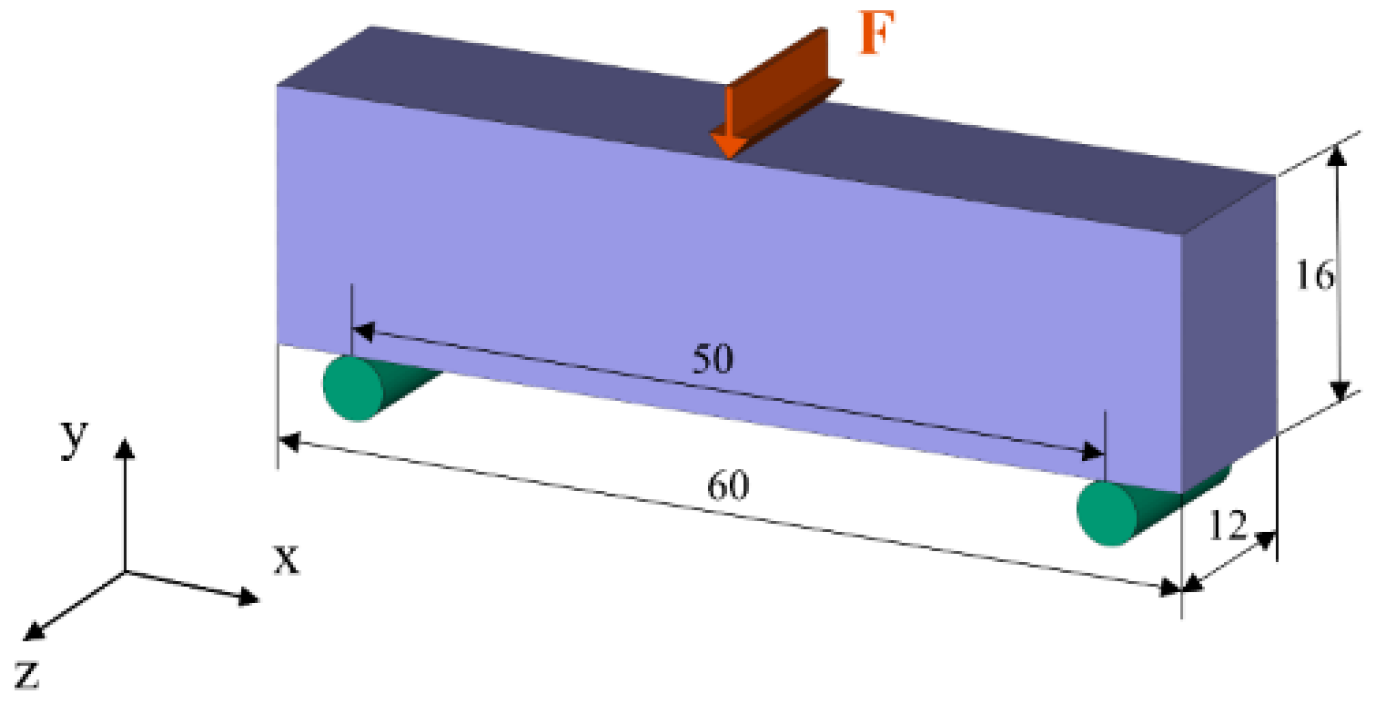
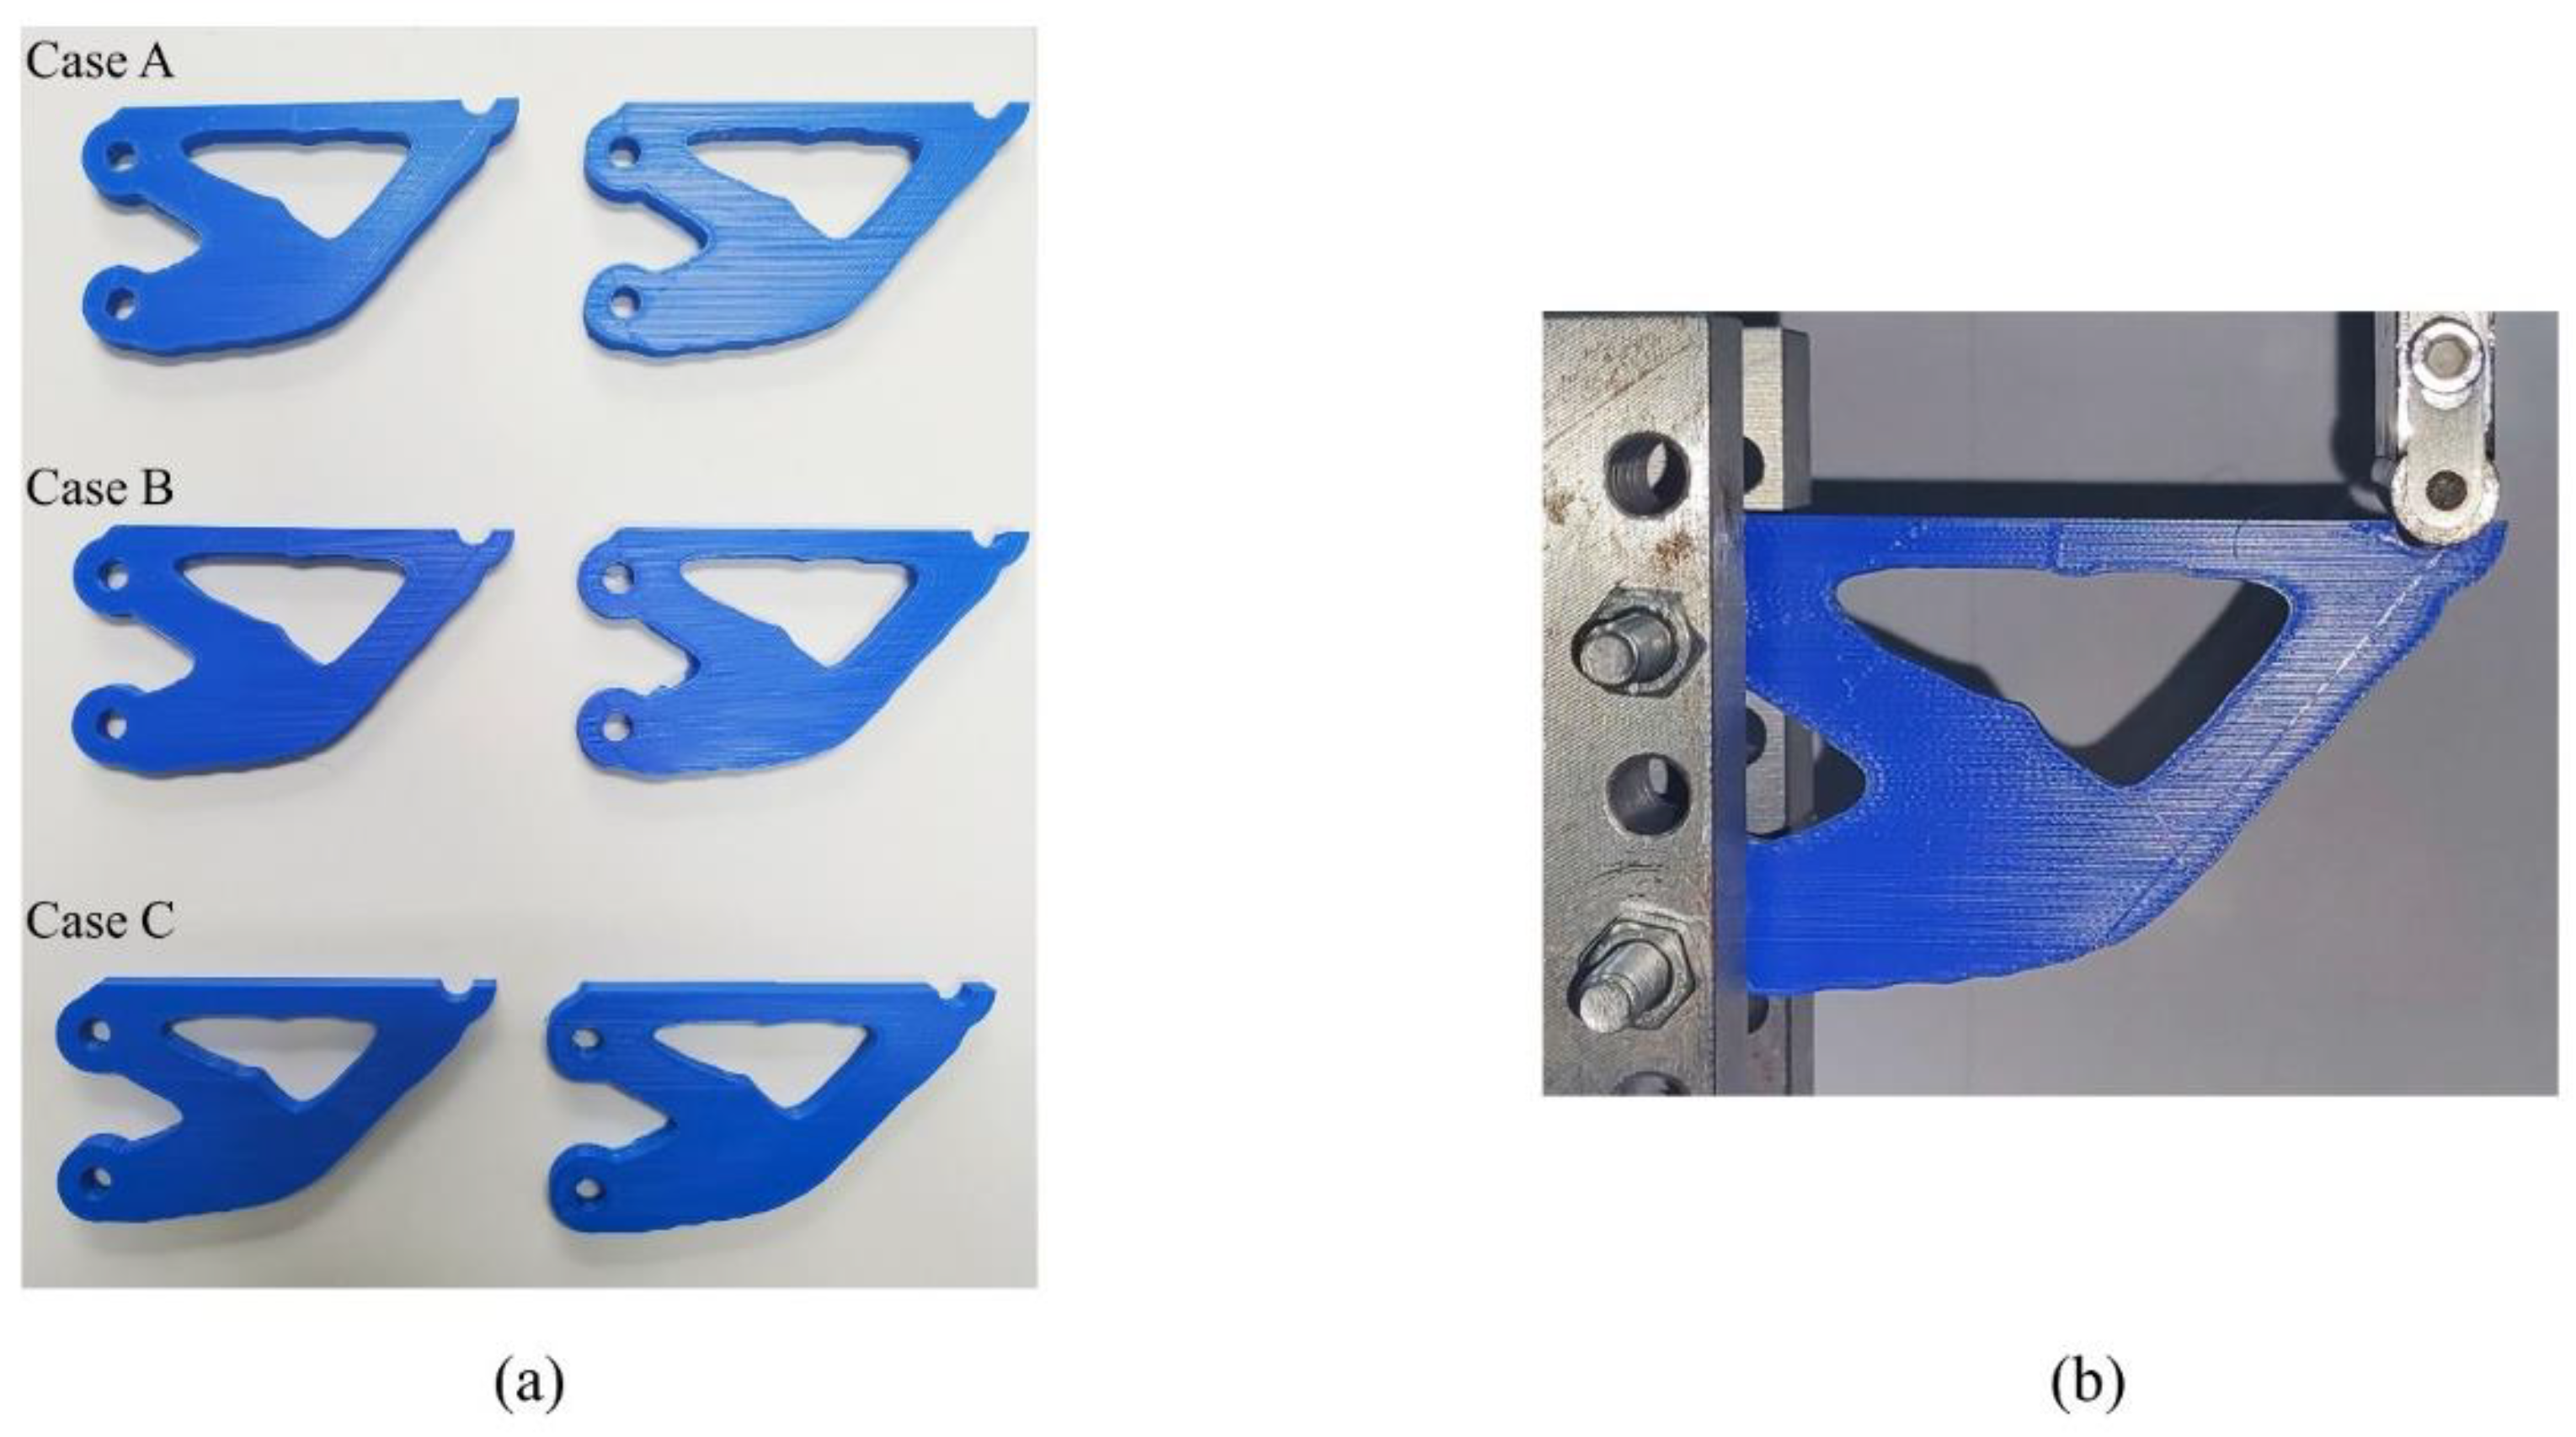
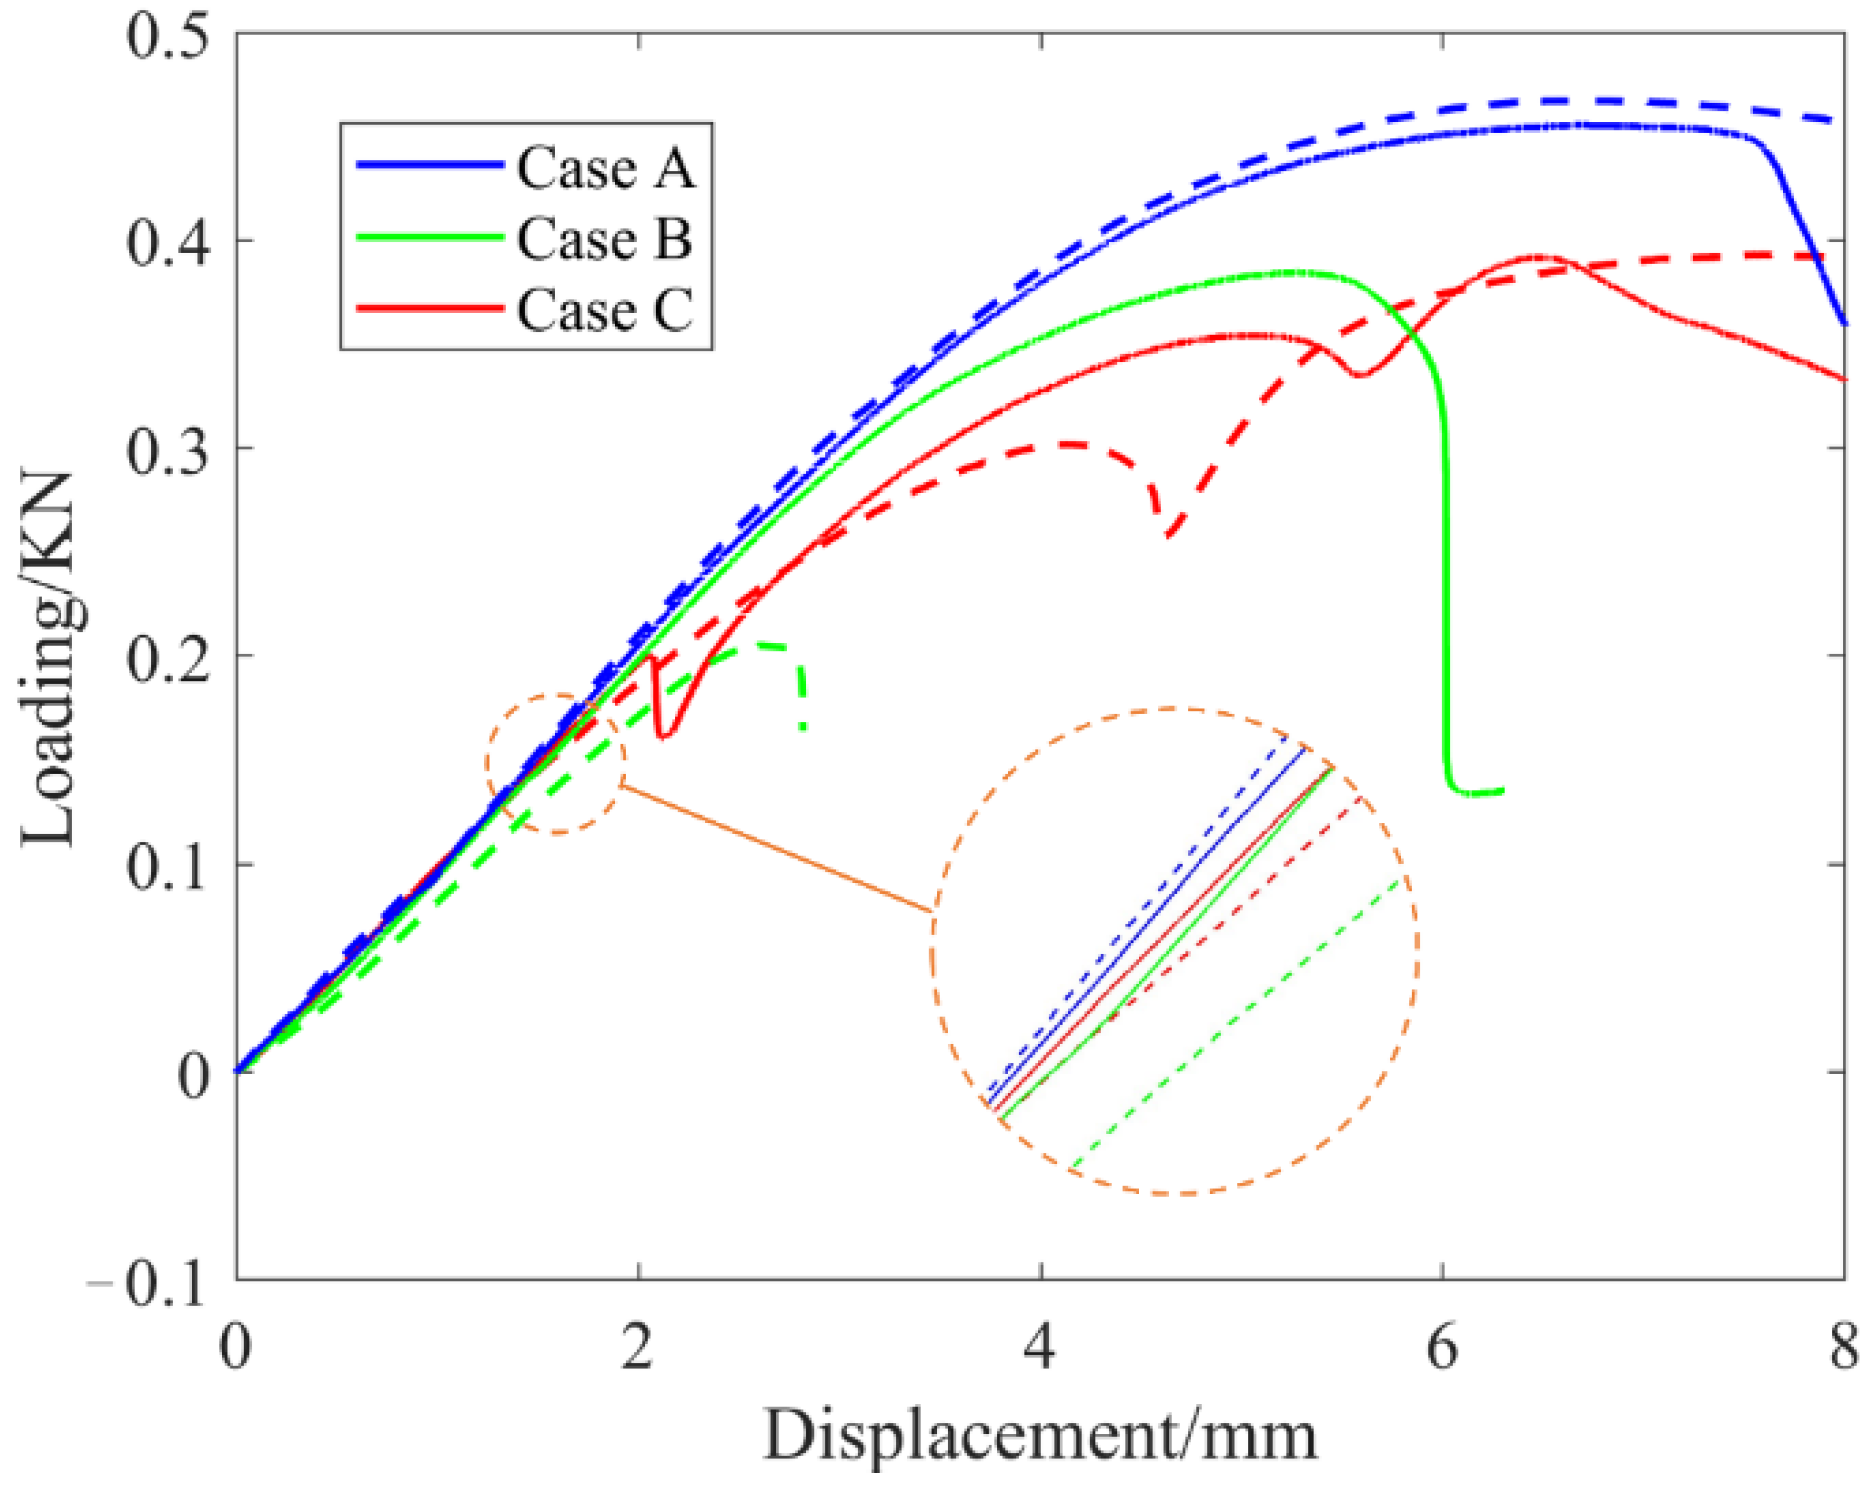
2.2. Experimental Validation
2.3. Formulation and Sensitivity Analysis of the Optimization Problem
2.3.1. Angle Optimization Considering Cross-Infill
2.3.2. Concurrent Optimization for Cross-Infill Angles and Structural Topology
3. Case Studies
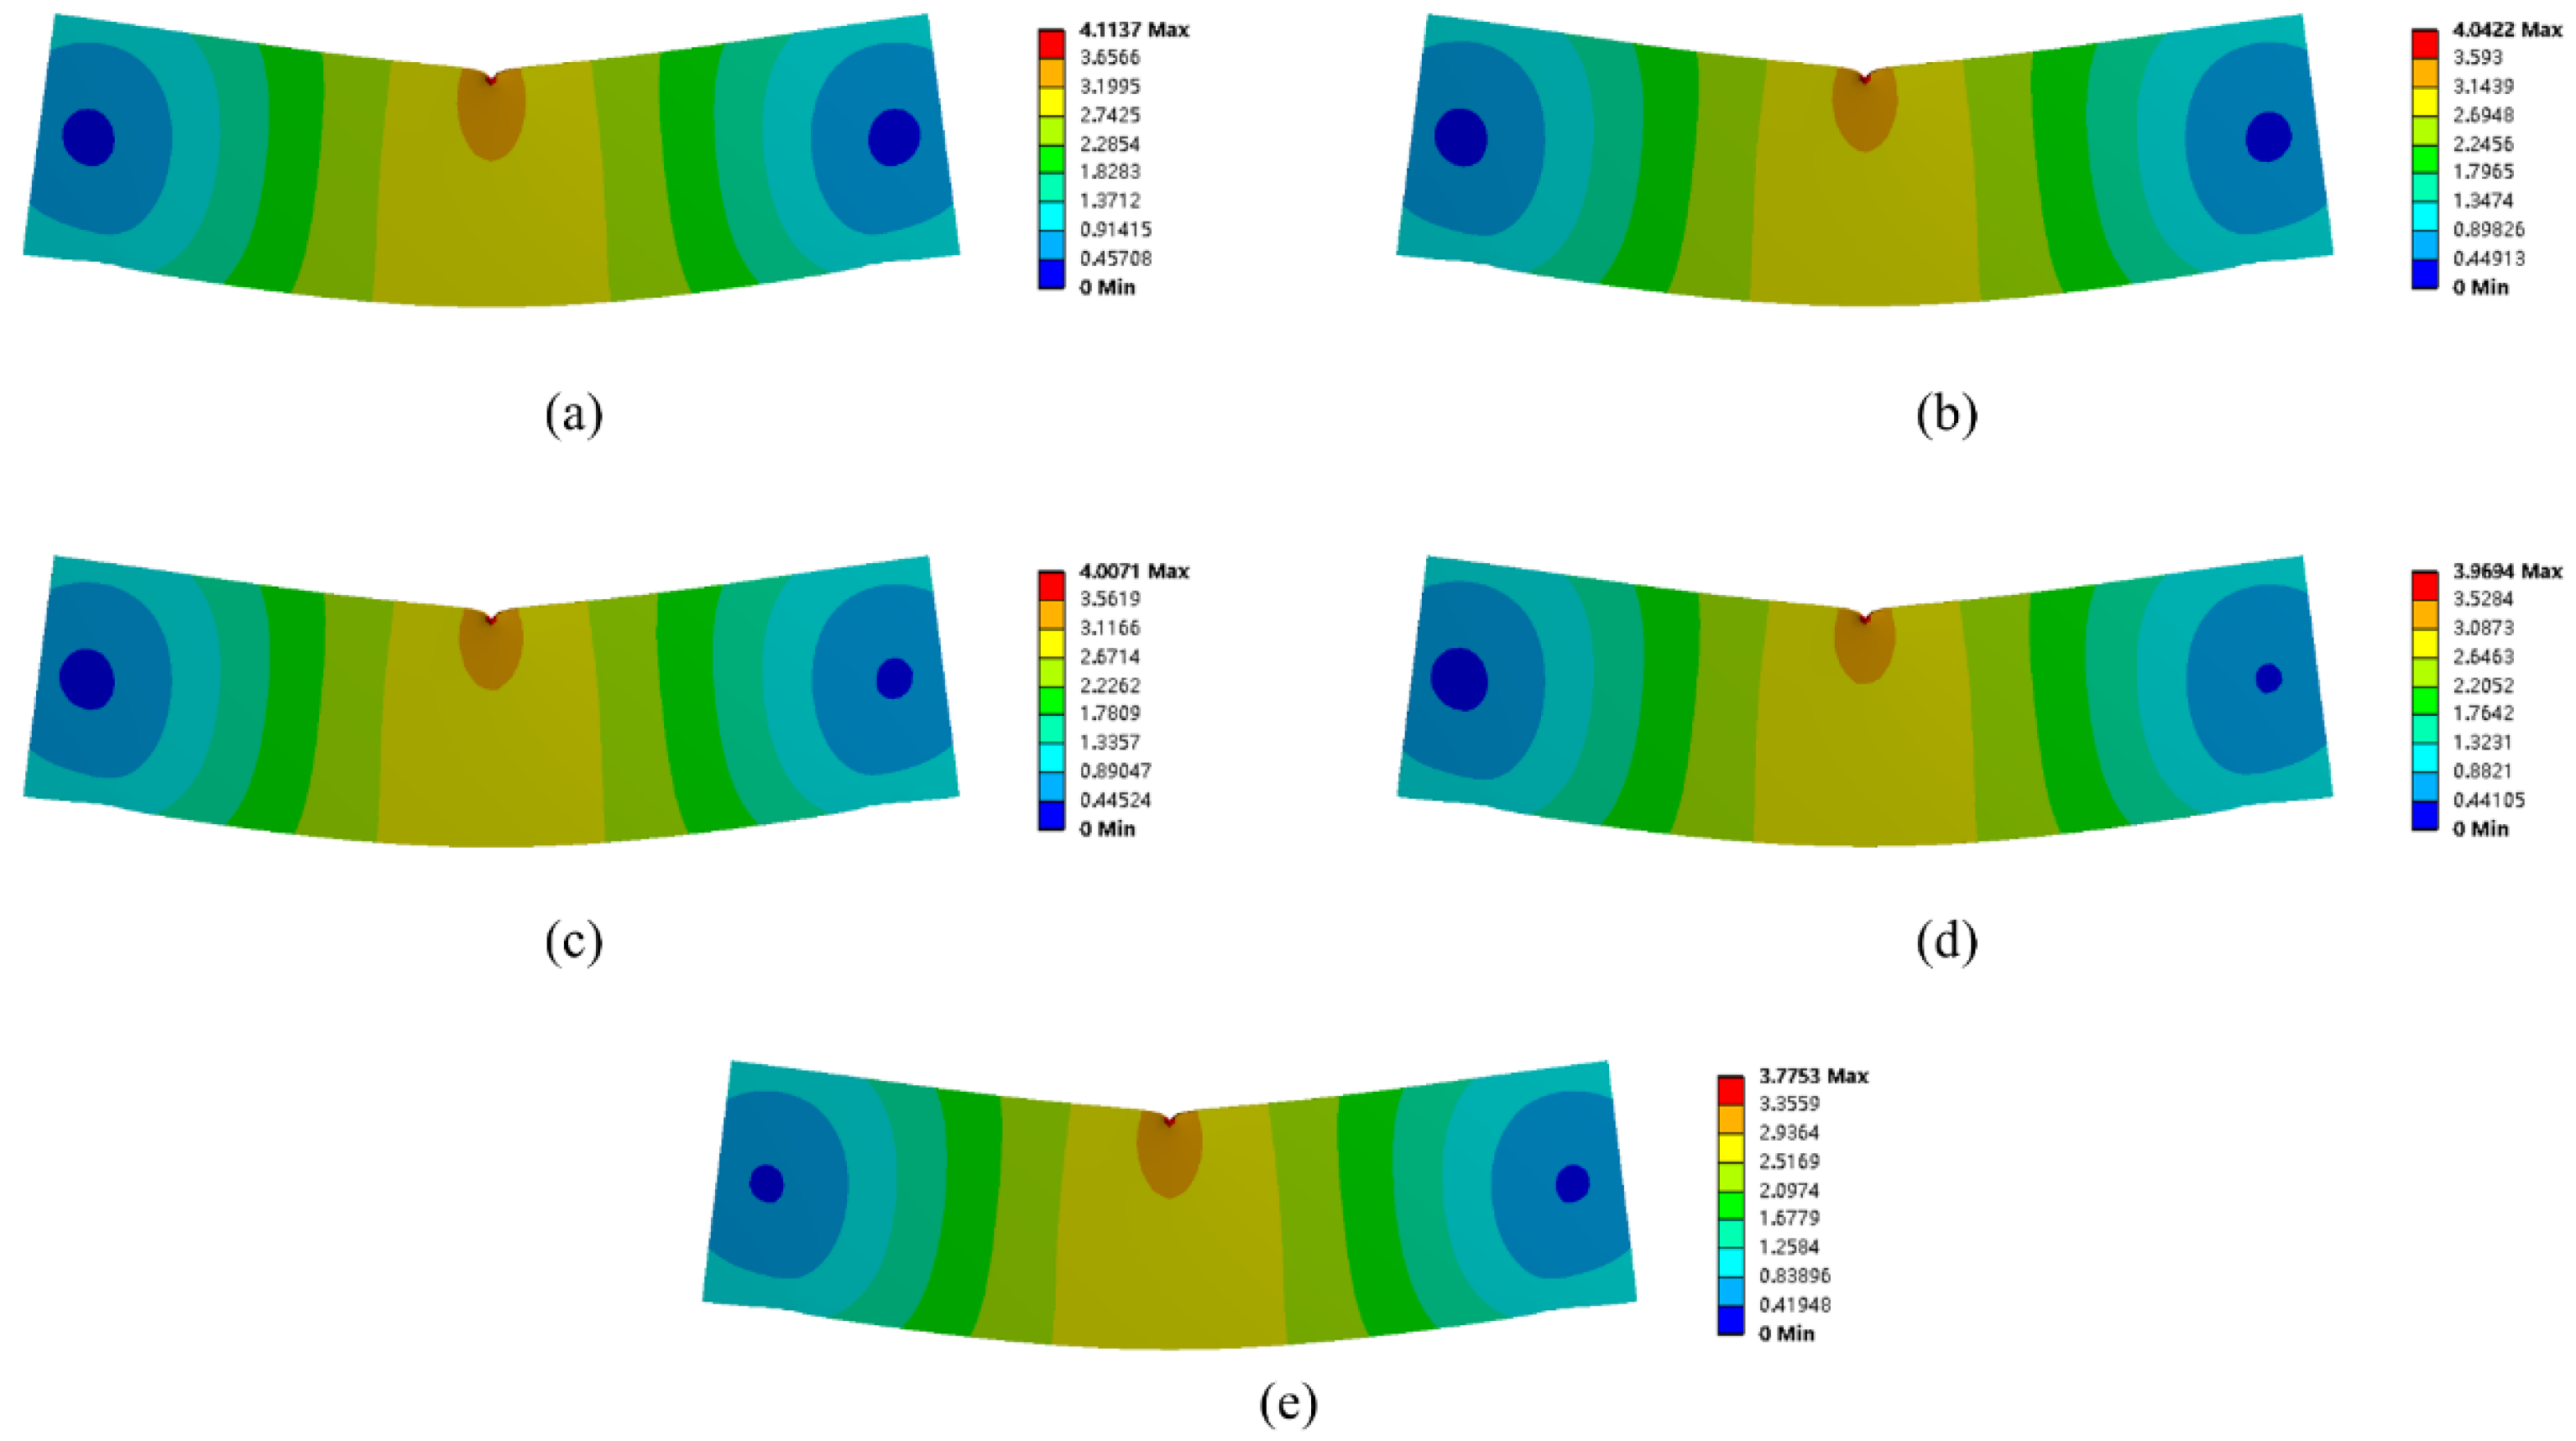
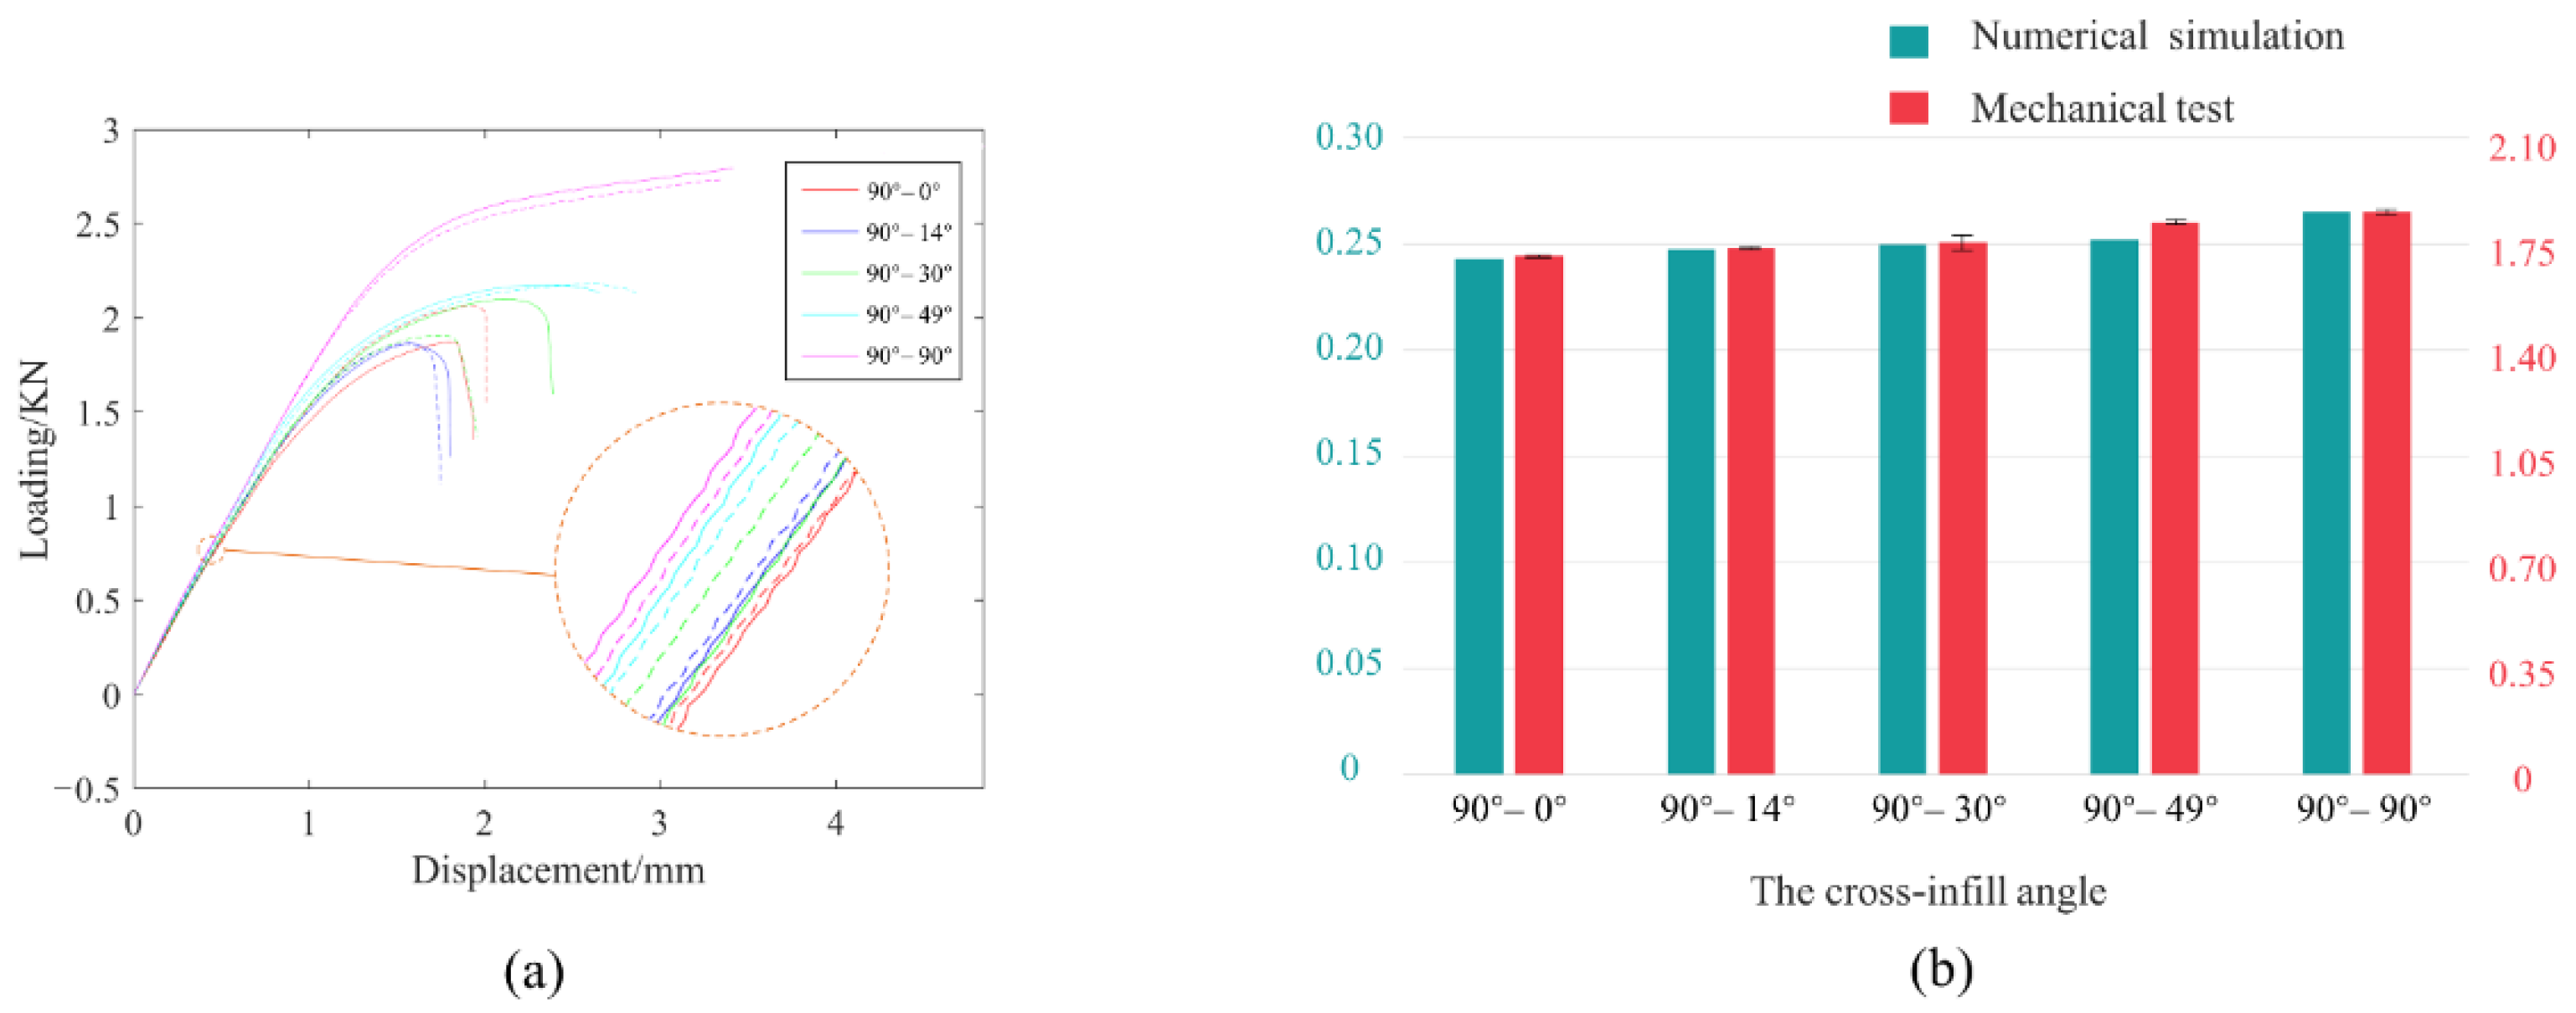
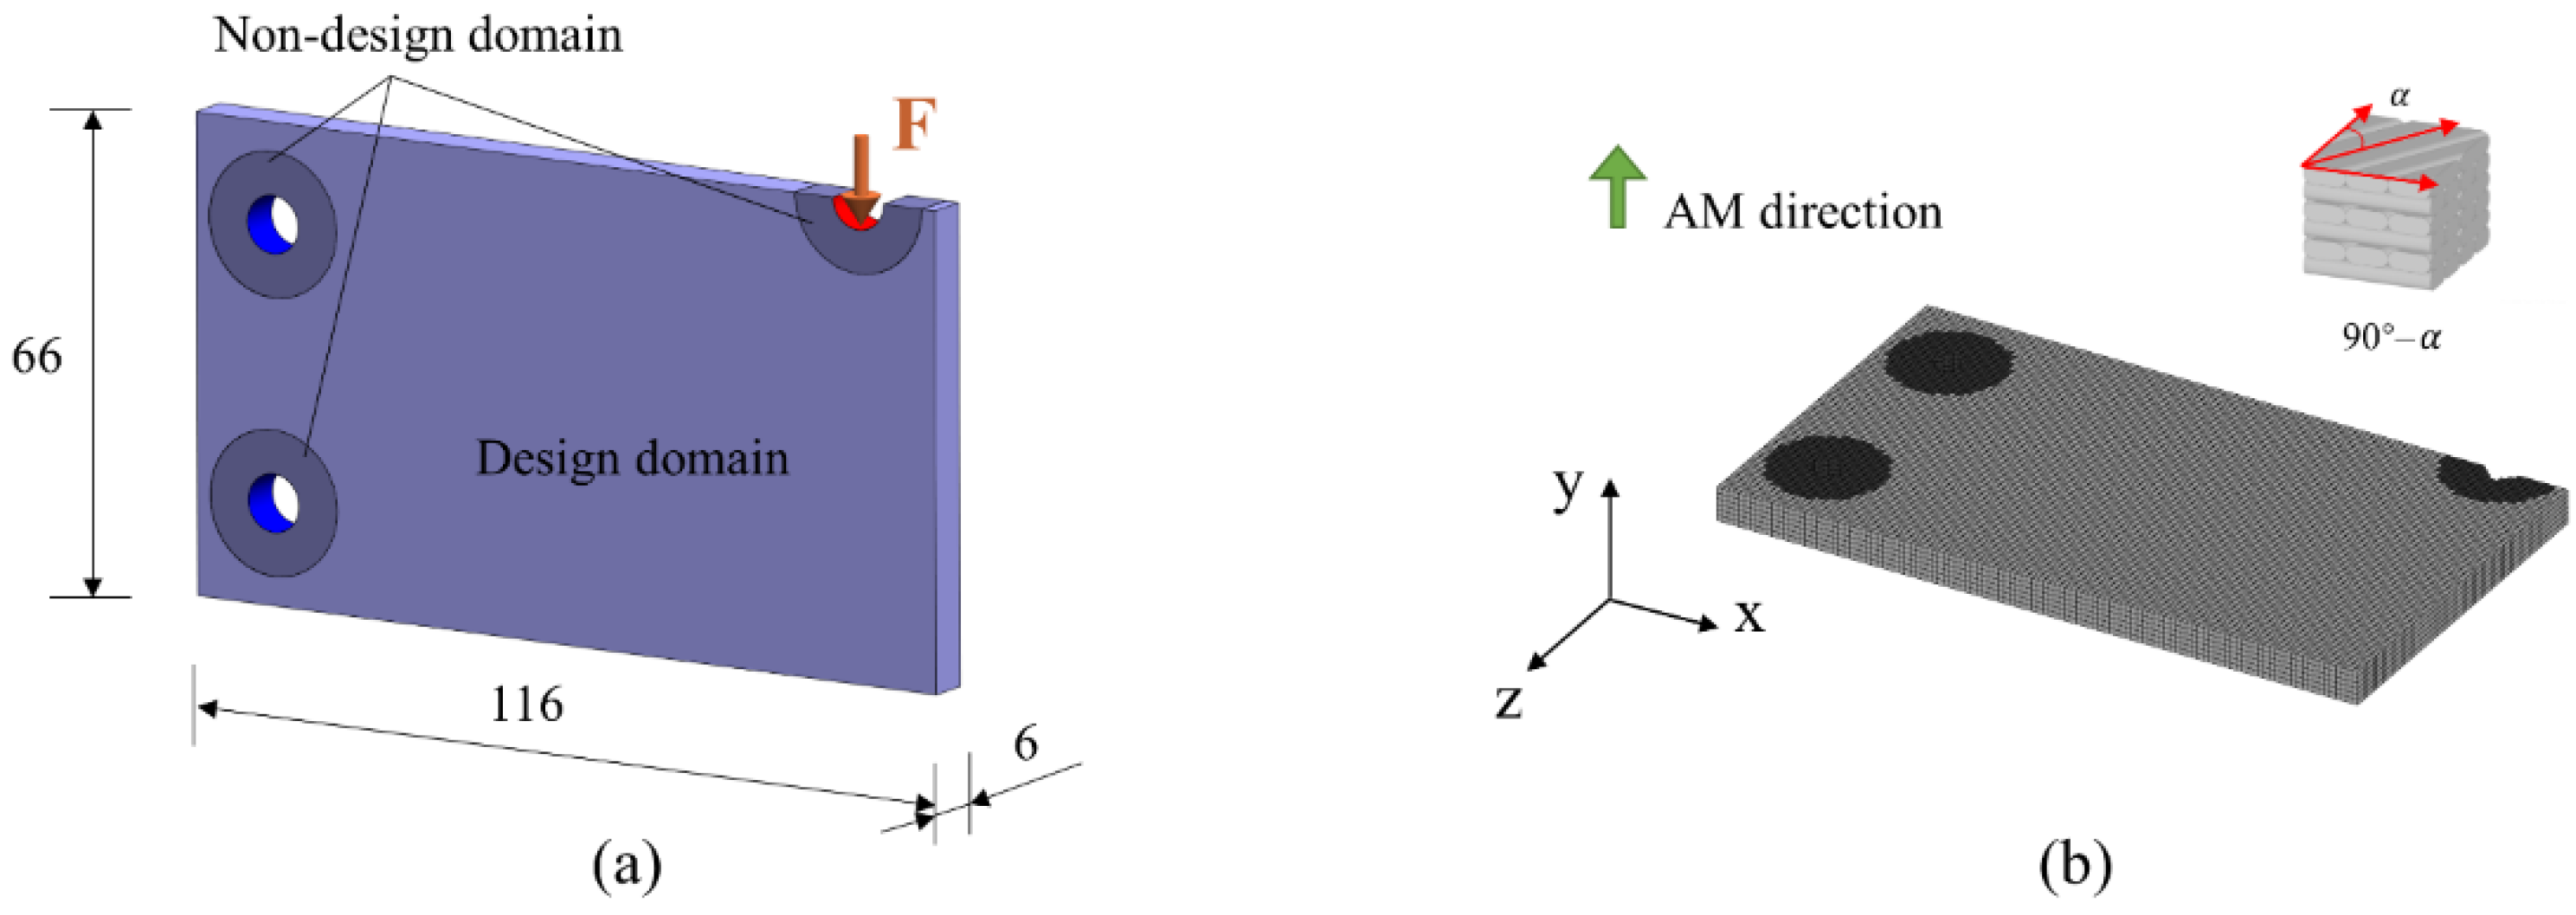
3.1. Example 1
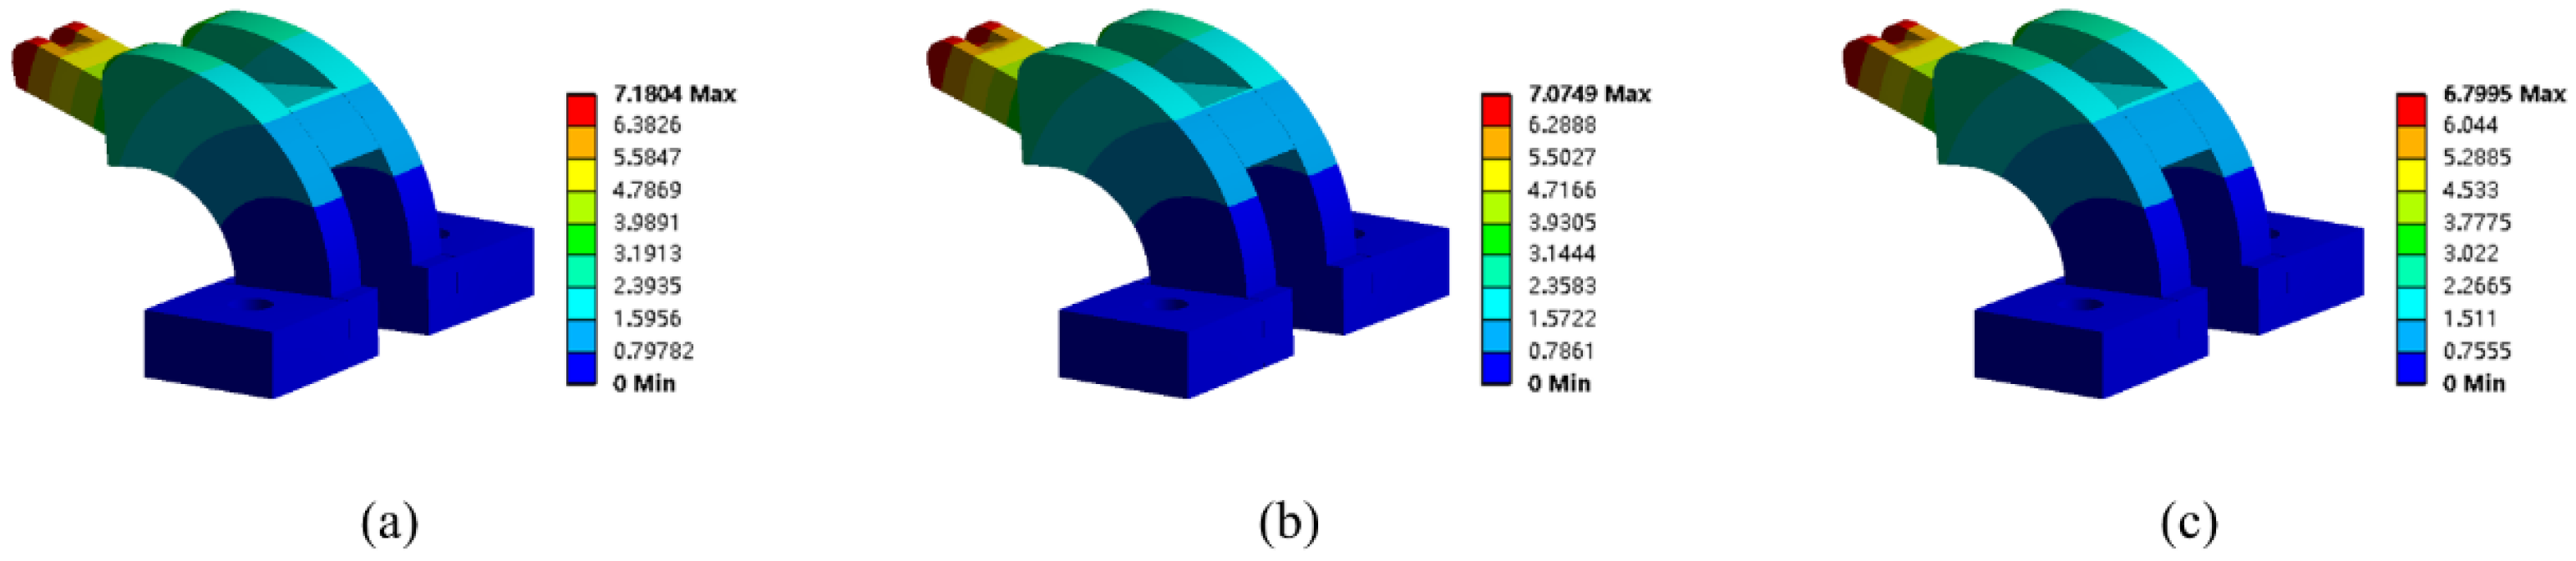
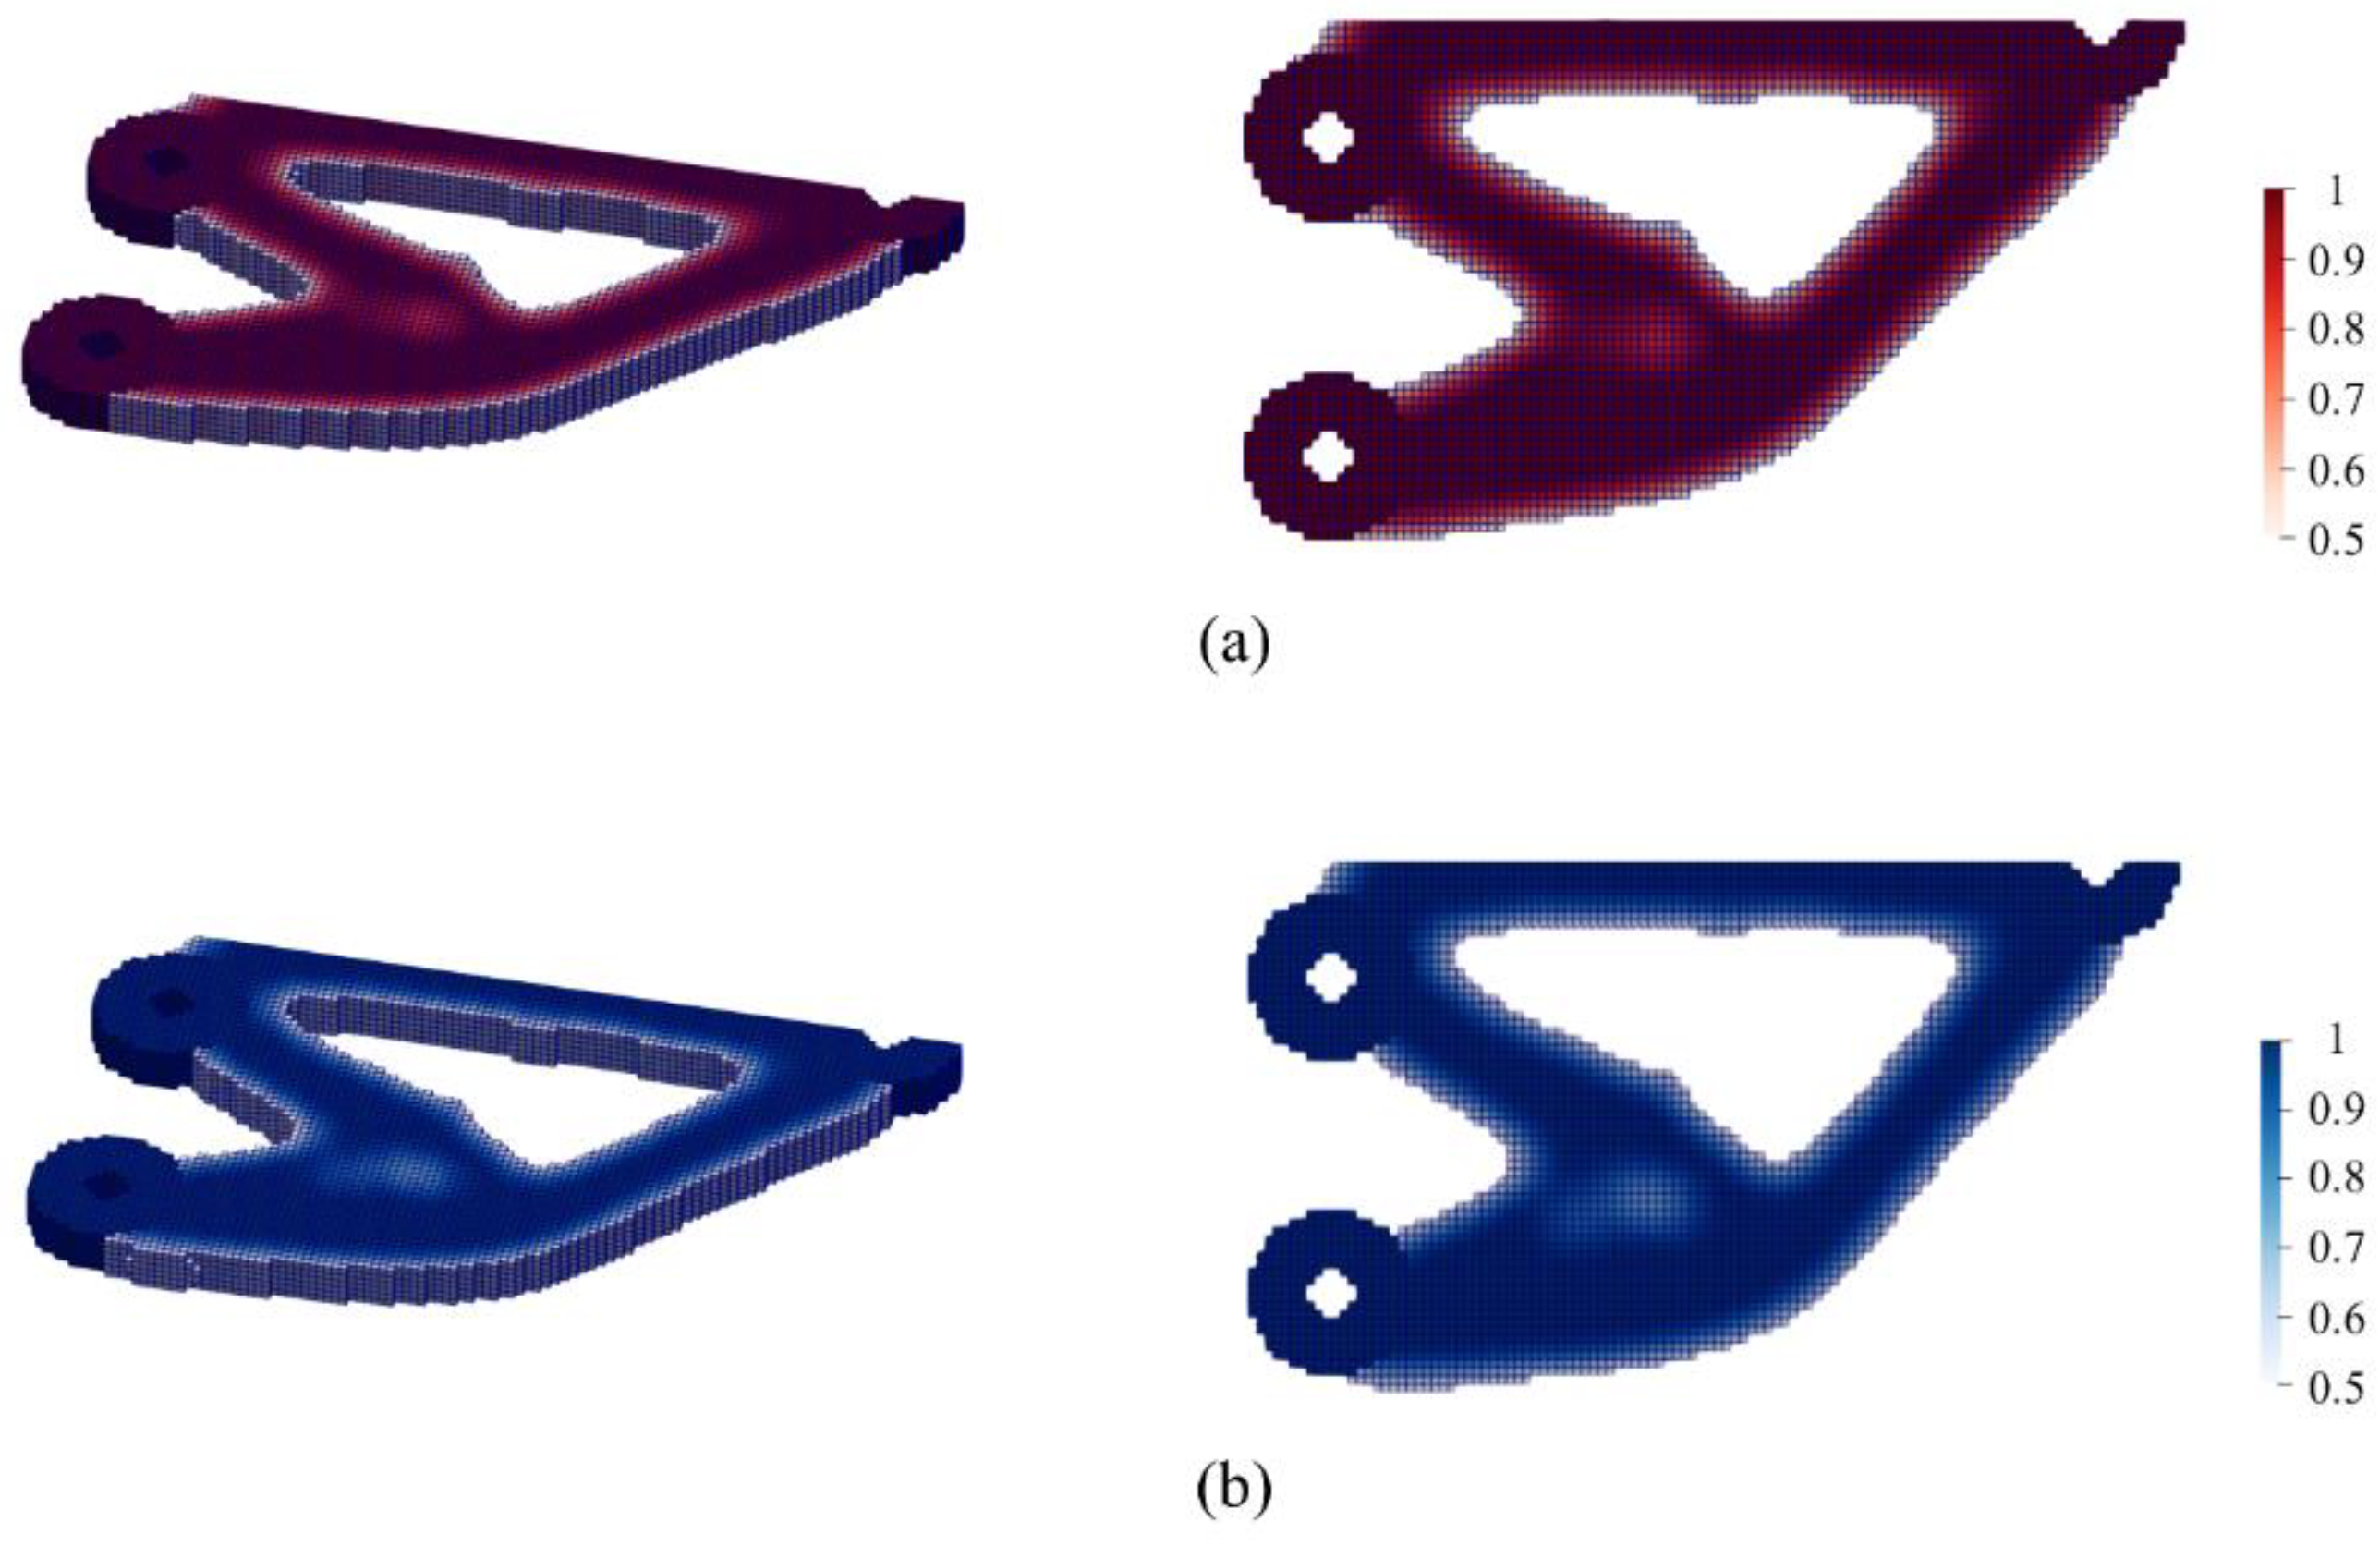
3.2. Example 2
4. Conclusions
Author Contributions
Funding
Acknowledgments
Conflicts of Interest
References
- Liu, J.; Gaynor, A.T.; Chen, S.; Kang, Z.; Suresh, K.; Takezawa, A.; Li, L.; Kato, J.; Tang, J.; Wang, C.C.L.; et al. Current and Future Trends in Topology Optimization for Additive Manufacturing. Struct. Multidisc. Optim. 2018, 57, 2457–2483. [Google Scholar] [CrossRef] [Green Version]
- Zhu, J.; Zhou, H.; Wang, C.; Zhou, L.; Yuan, S.; Zhang, W. A Review of Topology Optimization for Additive Manufacturing: Status and Challenges. Chin. J. Aeronaut. 2021, 34, 91–110. [Google Scholar] [CrossRef]
- Zhang, X.; Zhang, K.; Zhang, L.; Wang, W.; Li, Y.; He, R. Additive Manufacturing of Cellular Ceramic Structures: From Structure to Structure–Function Integration. Mater. Des. 2022, 215, 110470. [Google Scholar] [CrossRef]
- Liu, J.; Yu, H. Concurrent Deposition Path Planning and Structural Topology Optimization for Additive Manufacturing. Rapid Prototyp. J. 2017, 23, 930–942. [Google Scholar] [CrossRef]
- Dapogny, C.; Estevez, R.; Faure, A.; Michailidis, G. Shape and Topology Optimization Considering Anisotropic Features Induced by Additive Manufacturing Processes. Comput. Methods Appl. Mech. Eng. 2019, 344, 626–665. [Google Scholar] [CrossRef] [Green Version]
- Gaynor, A.T.; Guest, J.K. Topology Optimization Considering Overhang Constraints: Eliminating Sacrificial Support Material in Additive Manufacturing through Design. Struct. Multidisc. Optim. 2016, 54, 1157–1172. [Google Scholar] [CrossRef]
- Zhou, L.; Sigmund, O.; Zhang, W. Self-Supporting Structure Design with Feature-Driven Optimization Approach for Additive Manufacturing. Comput. Methods Appl. Mech. Eng. 2021, 386, 114110. [Google Scholar] [CrossRef]
- Chen, Q.; Taylor, H.; Takezawa, A.; Liang, X.; Jimenez, X.; Wicker, R.; To, A.C. Island Scanning Pattern Optimization for Residual Deformation Mitigation in Laser Powder Bed Fusion via Sequential Inherent Strain Method and Sensitivity Analysis. Addit. Manuf. 2021, 46, 102116. [Google Scholar] [CrossRef]
- Xu, S.; Liu, J.; Ma, Y. Residual Stress Constrained Self-Support Topology Optimization for Metal Additive Manufacturing. Comput. Methods Appl. Mech. Eng. 2022, 389, 114380. [Google Scholar] [CrossRef]
- Wu, J.; Aage, N.; Westermann, R.; Sigmund, O. Infill Optimization for Additive Manufacturing—Approaching Bone-Like Porous Structures. IEEE Trans. Visual. Comput. Graph. 2018, 24, 1127–1140. [Google Scholar] [CrossRef] [Green Version]
- Huang, J.; Xu, S.; Ma, Y.; Liu, J. A Topology Optimization Method for Hyperelastic Porous Structures Subject to Large Deformation. Int. J. Mech. Mater. Des. 2022, 18, 289–308. [Google Scholar] [CrossRef]
- Xia, L.; Breitkopf, P. Multiscale Structural Topology Optimization with an Approximate Constitutive Model for Local Material Microstructure. Comput. Methods Appl. Mech. Eng. 2015, 286, 147–167. [Google Scholar] [CrossRef]
- Wang, Y.; Chen, F.; Wang, M.Y. Concurrent Design with Connectable Graded Microstructures. Comput. Methods Appl. Mech. Eng. 2017, 317, 84–101. [Google Scholar] [CrossRef]
- Zhang, C.; Xu, S.; Liu, J.; Ma, Y. Comprehensive Clustering-Based Topology Optimization for Connectable Multi-Scale Additive Manufacturing Structures. Addit. Manuf. 2022, 54, 102786. [Google Scholar] [CrossRef]
- Zhang, P.; Liu, J.; To, A.C. Role of Anisotropic Properties on Topology Optimization of Additive Manufactured Load Bearing Structures. Scr. Mater. 2017, 135, 148–152. [Google Scholar] [CrossRef]
- Wang, P.; Zou, B.; Ding, S.; Zhuang, Y.; Liu, J.; Li, L. Functionally Graded Polyetheretherketone-Based Composites Additively Manufactured by Material Extrusion Using a Transition Interface Design Method. Compos. Part A Appl. Sci. Manuf. 2022, 158, 106977. [Google Scholar] [CrossRef]
- Zhang, K.; Wang, K.; Chen, J.; Wei, K.; Liang, B.; He, R. Design and Additive Manufacturing of 3D-Architected Ceramic Metamaterials with Programmable Thermal Expansion. Addit. Manuf. 2021, 47, 102338. [Google Scholar] [CrossRef]
- Ahn, S.; Montero, M.; Odell, D.; Roundy, S.; Wright, P.P.K. Anisotropic Material Properties of Fused Deposition Modeling ABS. Rapid Prototyp. J. 2002, 8, 248–257. [Google Scholar] [CrossRef] [Green Version]
- Umetani, N.; Schmidt, R. Cross-Sectional Structural Analysis for 3D Printing Optimization. In Proceedings of the SIGGRAPH Asia 2013 Technical Briefs on—SA ’13, Hong Kong, China, 19–22 November 2013; ACM Press: Hong Kong, China, 2013; pp. 1–4. [Google Scholar]
- Ulu, E.; Korkmaz, E.; Yay, K.; Burak Ozdoganlar, O.; Burak Kara, L. Enhancing the Structural Performance of Additively Manufactured Objects Through Build Orientation Optimization. J. Mech. Des. 2015, 137, 111410. [Google Scholar] [CrossRef]
- Bendsøe, M.P.; Sigmund, O. Topology Optimization: Theory, Methods and Applications; Springer: Berlin/Heidelberg, Germany, 2004; ISBN 978-3-642-07698-5. [Google Scholar]
- Nguyen, C.H.P.; Choi, Y. Concurrent Density Distribution and Build Orientation Optimization of Additively Manufactured Functionally Graded Lattice Structures. Comput.-Aided Des. 2020, 127, 102884. [Google Scholar] [CrossRef]
- Li, S.; Yuan, S.; Zhu, J.; Wang, C.; Li, J.; Zhang, W. Additive Manufacturing-Driven Design Optimization: Building Direction and Structural Topology. Addit. Manuf. 2020, 36, 101406. [Google Scholar] [CrossRef]
- Mirzendehdel, A.M.; Rankouhi, B.; Suresh, K. Strength-Based Topology Optimization for Anisotropic Parts. Addit. Manuf. 2018, 19, 104–113. [Google Scholar] [CrossRef]
- Wang, P.; Zou, B.; Ding, S.; Huang, C.; Shi, Z.; Ma, Y.; Yao, P. Preparation of Short CF/GF Reinforced PEEK Composite Filaments and Their Comprehensive Properties Evaluation for FDM-3D Printing. Compos. Part B Eng. 2020, 198, 108175. [Google Scholar] [CrossRef]
- Bruggi, M.; Taliercio, A. Topology Optimization of the Fiber-Reinforcement Retrofitting Existing Structures. Int. J. Solids Struct. 2013, 50, 121–136. [Google Scholar] [CrossRef] [Green Version]
- Yu, H.; Hong, H.; Cao, S.; Ahmad, R. Topology Optimization for Multipatch Fused Deposition Modeling 3D Printing. Appl. Sci. 2020, 10, 943. [Google Scholar] [CrossRef] [Green Version]
- Xia, Q.; Shi, T. Optimization of Composite Structures with Continuous Spatial Variation of Fiber Angle through Shepard Interpolation. Compos. Struct. 2017, 182, 273–282. [Google Scholar] [CrossRef]
- Xu, S.; Huang, J.; Liu, J.; Ma, Y. Topology Optimization for FDM Parts Considering the Hybrid Deposition Path Pattern. Micromachines 2020, 11, 709. [Google Scholar] [CrossRef]
- Sugiyama, K.; Matsuzaki, R.; Malakhov, A.V.; Polilov, A.N.; Ueda, M.; Todoroki, A.; Hirano, Y. 3D Printing of Optimized Composites with Variable Fiber Volume Fraction and Stiffness Using Continuous Fiber. Compos. Sci. Technol. 2020, 186, 107905. [Google Scholar] [CrossRef]
- Liu, J.; Huang, J.; Yan, J.; Li, L.; Li, S. Full Sensitivity-Driven Gap/Overlap Free Design of Carbon Fiber-Reinforced Composites for 3D Printing. Appl. Math. Model. 2022, 103, 308–326. [Google Scholar] [CrossRef]
- Syrlybayev, D.; Zharylkassyn, B.; Seisekulova, A.; Akhmetov, M.; Perveen, A.; Talamona, D. Optimisation of Strength Properties of FDM Printed Parts—A Critical Review. Polymers 2021, 13, 1587. [Google Scholar] [CrossRef]
- Aloyaydi, B.; Sivasankaran, S.; Mustafa, A. Investigation of Infill-Patterns on Mechanical Response of 3D Printed Poly-Lactic-Acid. Polym. Test. 2020, 87, 106557. [Google Scholar] [CrossRef]
- Mohan, N.; Senthil, P.; Vinodh, S.; Jayanth, N. A Review on Composite Materials and Process Parameters Optimisation for the Fused Deposition Modelling Process. Virtual Phys. Prototyp. 2017, 12, 47–59. [Google Scholar] [CrossRef]
- Akhoundi, B.; Behravesh, A.H. Effect of Filling Pattern on the Tensile and Flexural Mechanical Properties of FDM 3D Printed Products. Exp. Mech. 2019, 59, 883–897. [Google Scholar] [CrossRef]
- Gao, J.; Li, H.; Gao, L.; Xiao, M. Topological Shape Optimization of 3D Micro-Structured Materials Using Energy-Based Homogenization Method. Adv. Eng. Softw. 2018, 116, 89–102. [Google Scholar] [CrossRef]
- Svanberg, K. The Method of Moving Asymptotes—a New Method for Structural Optimization. Int. J. Numer. Meth. Engng. 1987, 24, 359–373. [Google Scholar] [CrossRef]
- Sigmund, O. Morphology-Based Black and White Filters for Topology Optimization. Struct. Multidisc. Optim. 2007, 33, 401–424. [Google Scholar] [CrossRef] [Green Version]
- Bourdin, B. Filters in Topology Optimization. Int. J. Numer. Meth. Eng. 2001, 50, 2143–2158. [Google Scholar] [CrossRef]


| 105.90 | 24.99 | −50.49 | 56.80 | −20.37 | |
| 34.66 | 0.94 | 21.40 | −55.04 | 37.76 | |
| 38.16 | 11.05 | −32.69 | 52.00 | −31.25 | |
| 0.00 | −4.39 | 12.60 | −28.05 | 19.84 | |
| 87.89 | −15.89 | 101.10 | −20.14 | 12.57 | |
| 34.54 | −2.09 | 17.08 | −35.63 | 21.12 | |
| 0.00 | −1.43 | 3.13 | −5.33 | 3.63 | |
| 104.80 | 10.32 | −71.51 | 134.10 | −88.53 | |
| 0.00 | −6.07 | 8.95 | −12.05 | 9.17 | |
| 29.35 | −1.02 | 17.06 | −38.45 | 25.28 | |
| 0.00 | −0.87 | 1.93 | −3.41 | 2.35 | |
| 29.36 | −2.69 | 14.13 | −27.04 | 15.89 | |
| 31.96 | 6.45 | −22.31 | 40.53 | −25.81 |
Publisher’s Note: MDPI stays neutral with regard to jurisdictional claims in published maps and institutional affiliations. |
© 2022 by the authors. Licensee MDPI, Basel, Switzerland. This article is an open access article distributed under the terms and conditions of the Creative Commons Attribution (CC BY) license (https://creativecommons.org/licenses/by/4.0/).
Share and Cite
Tang, R.; Zhang, C.; Liu, J. Concurrent Topological Structure and Cross-Infill Angle Optimization for Material Extrusion Polymer Additive Manufacturing with Microstructure Modeling. Micromachines 2022, 13, 852. https://doi.org/10.3390/mi13060852
Tang R, Zhang C, Liu J. Concurrent Topological Structure and Cross-Infill Angle Optimization for Material Extrusion Polymer Additive Manufacturing with Microstructure Modeling. Micromachines. 2022; 13(6):852. https://doi.org/10.3390/mi13060852
Chicago/Turabian StyleTang, Ruixiao, Chenghu Zhang, and Jikai Liu. 2022. "Concurrent Topological Structure and Cross-Infill Angle Optimization for Material Extrusion Polymer Additive Manufacturing with Microstructure Modeling" Micromachines 13, no. 6: 852. https://doi.org/10.3390/mi13060852
APA StyleTang, R., Zhang, C., & Liu, J. (2022). Concurrent Topological Structure and Cross-Infill Angle Optimization for Material Extrusion Polymer Additive Manufacturing with Microstructure Modeling. Micromachines, 13(6), 852. https://doi.org/10.3390/mi13060852