
Humidity Sensor Based on rGO-SDS Composite Film


 ,
,
Abstract
1. Introduction
2. Experimental and Computational Section
2.1. Design of Sensor
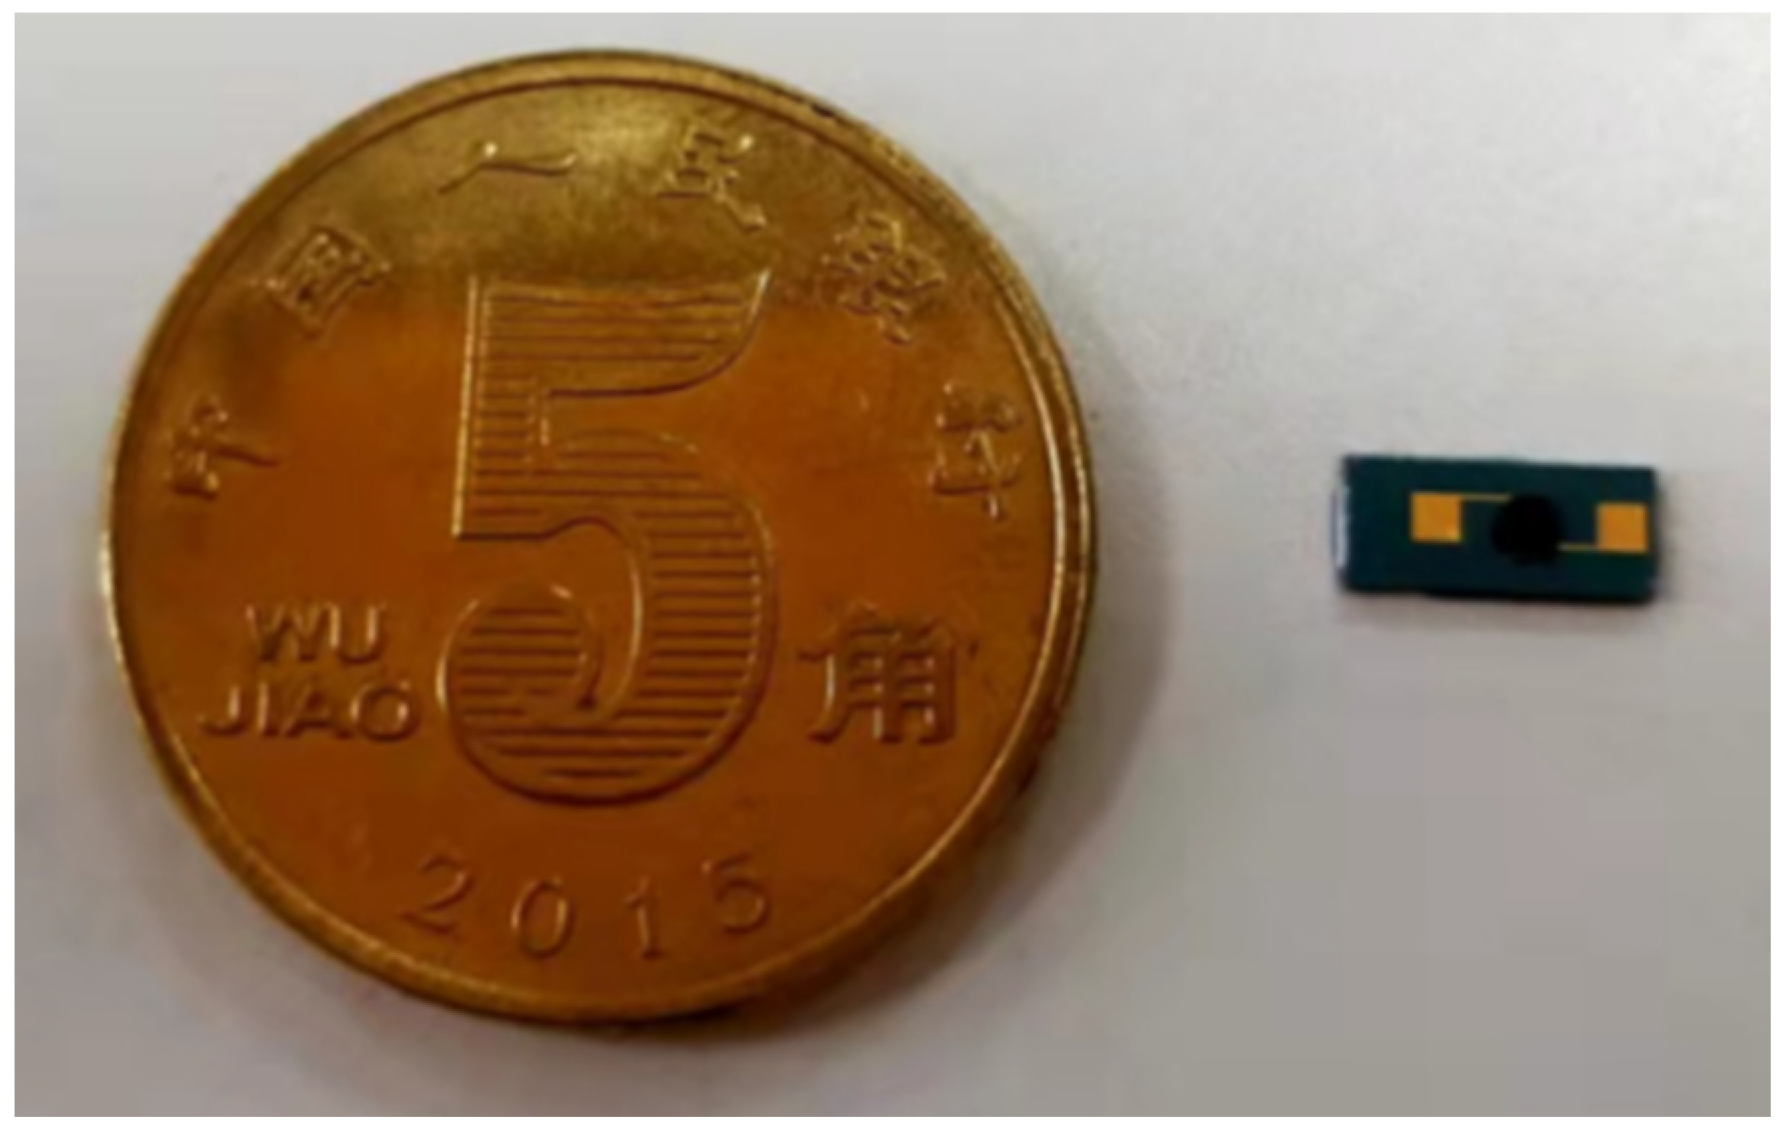
2.1.1. Sensor Size Design
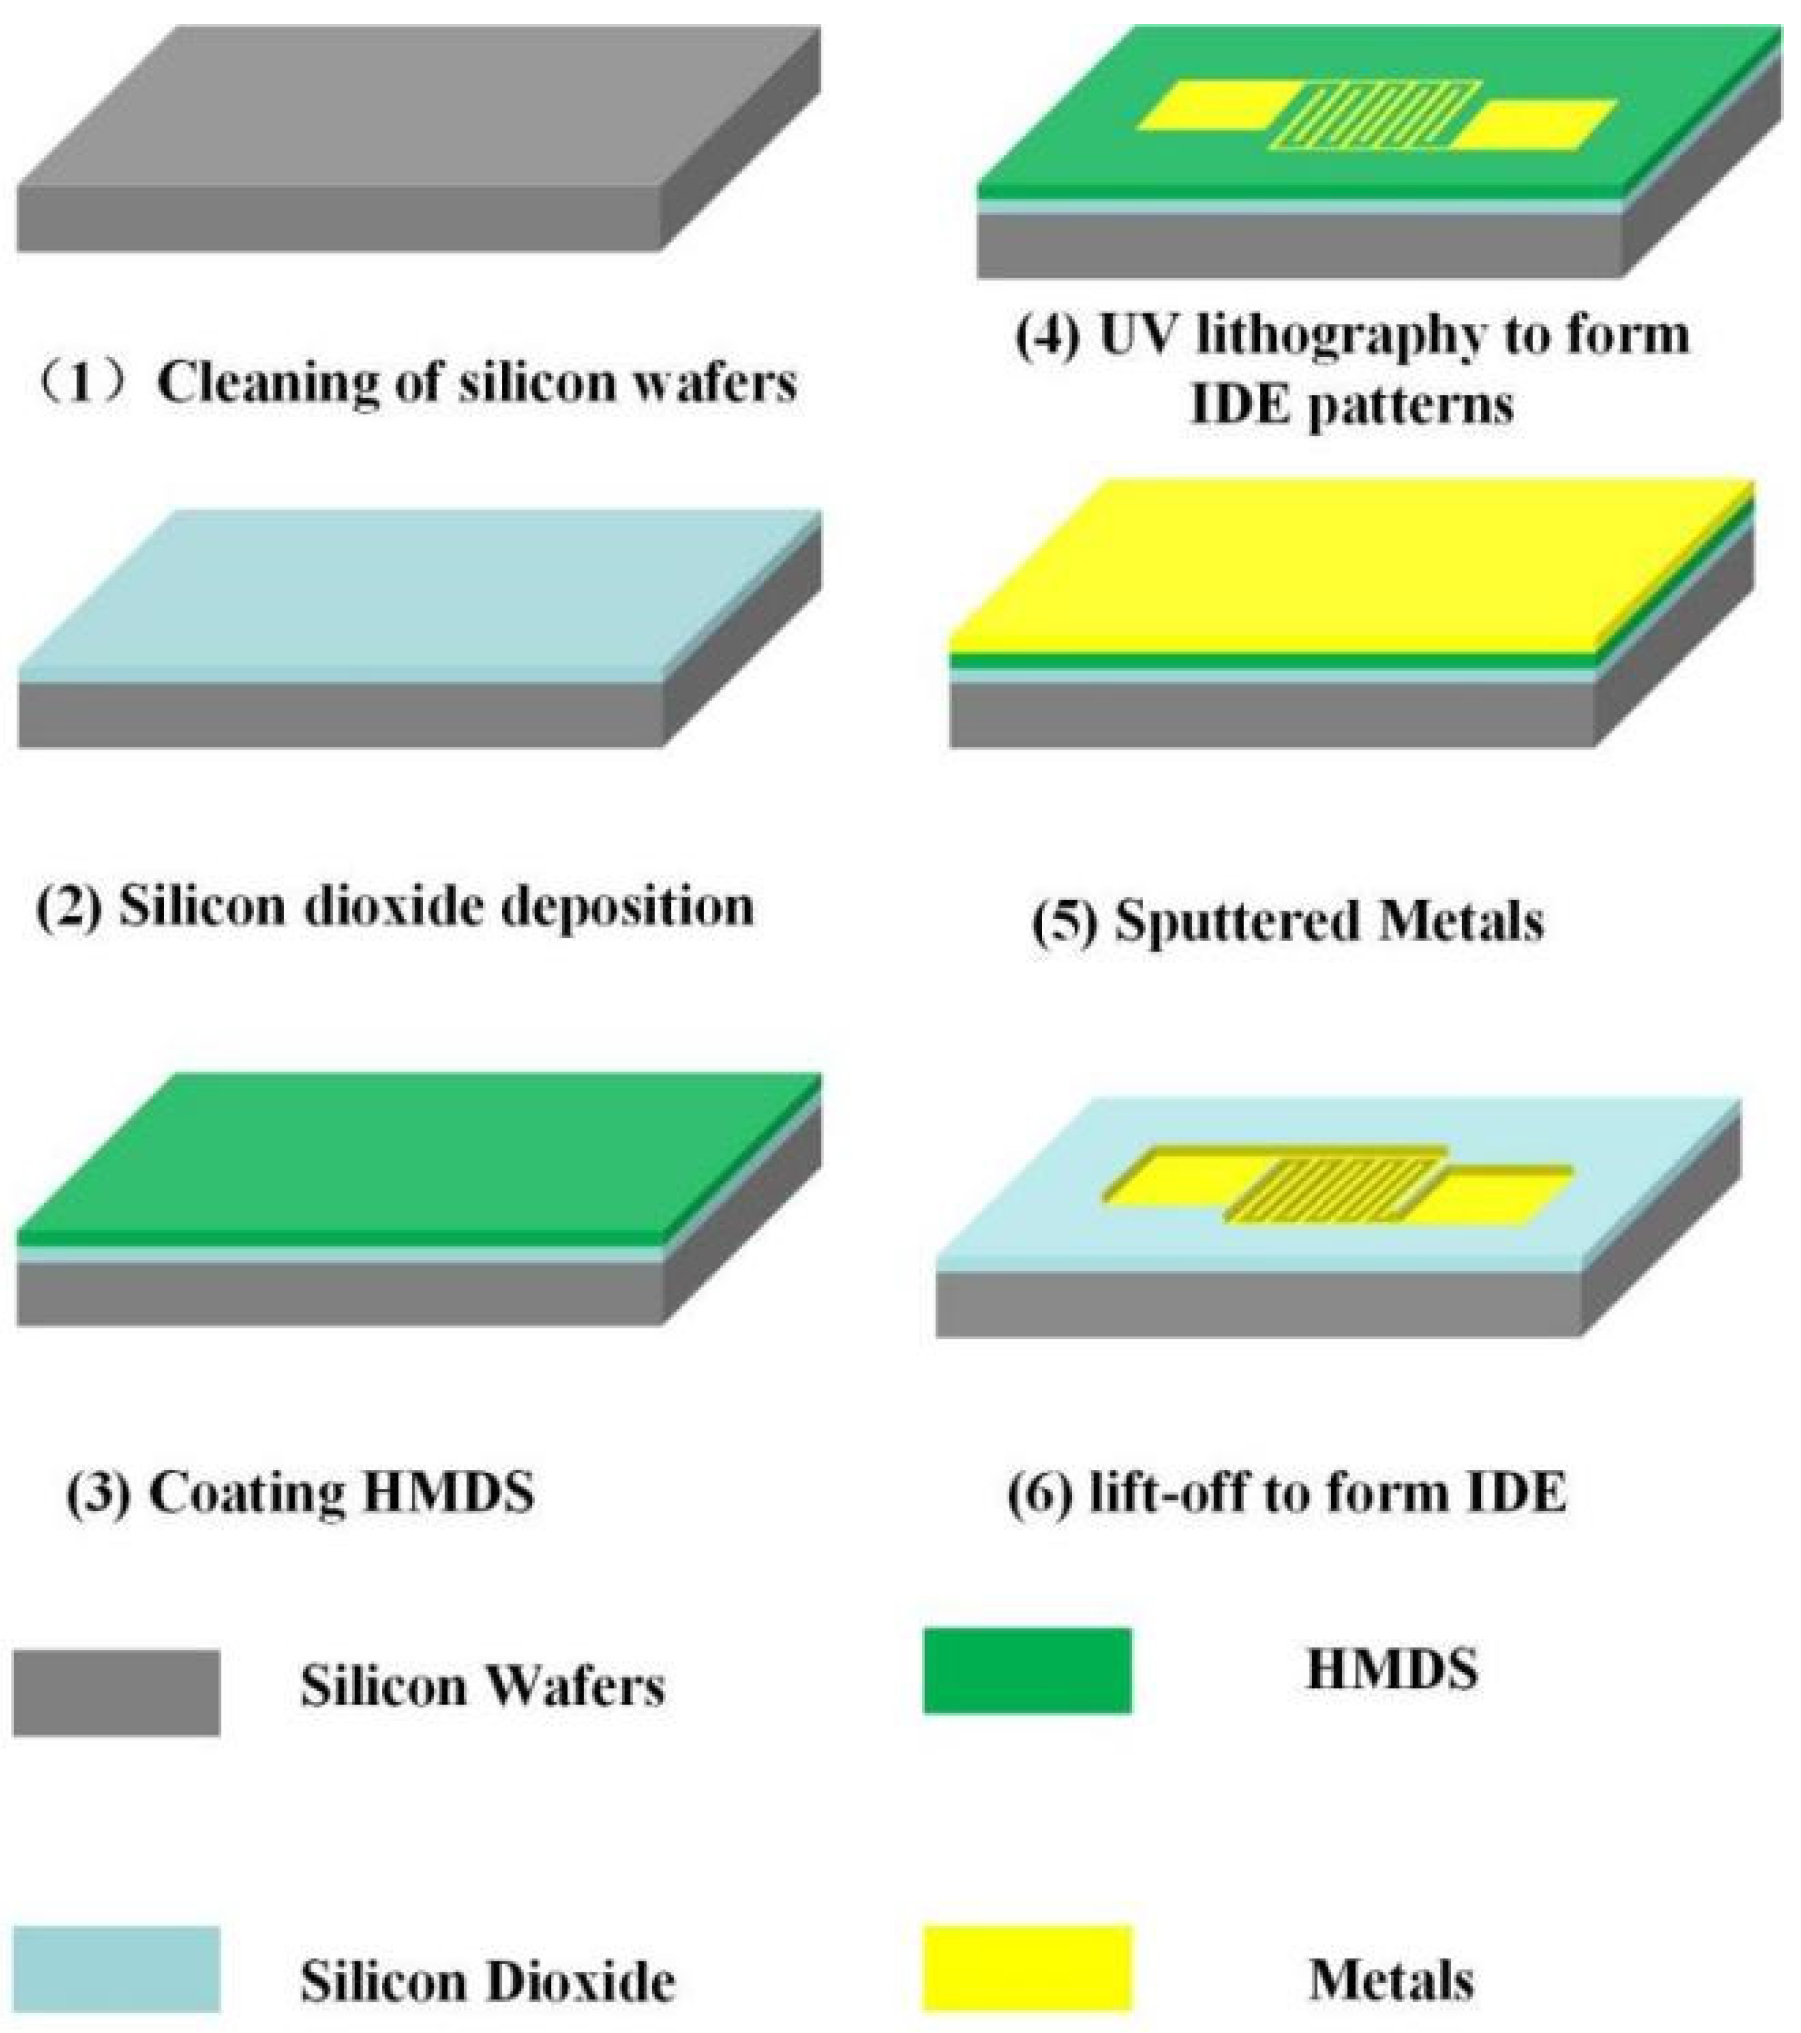
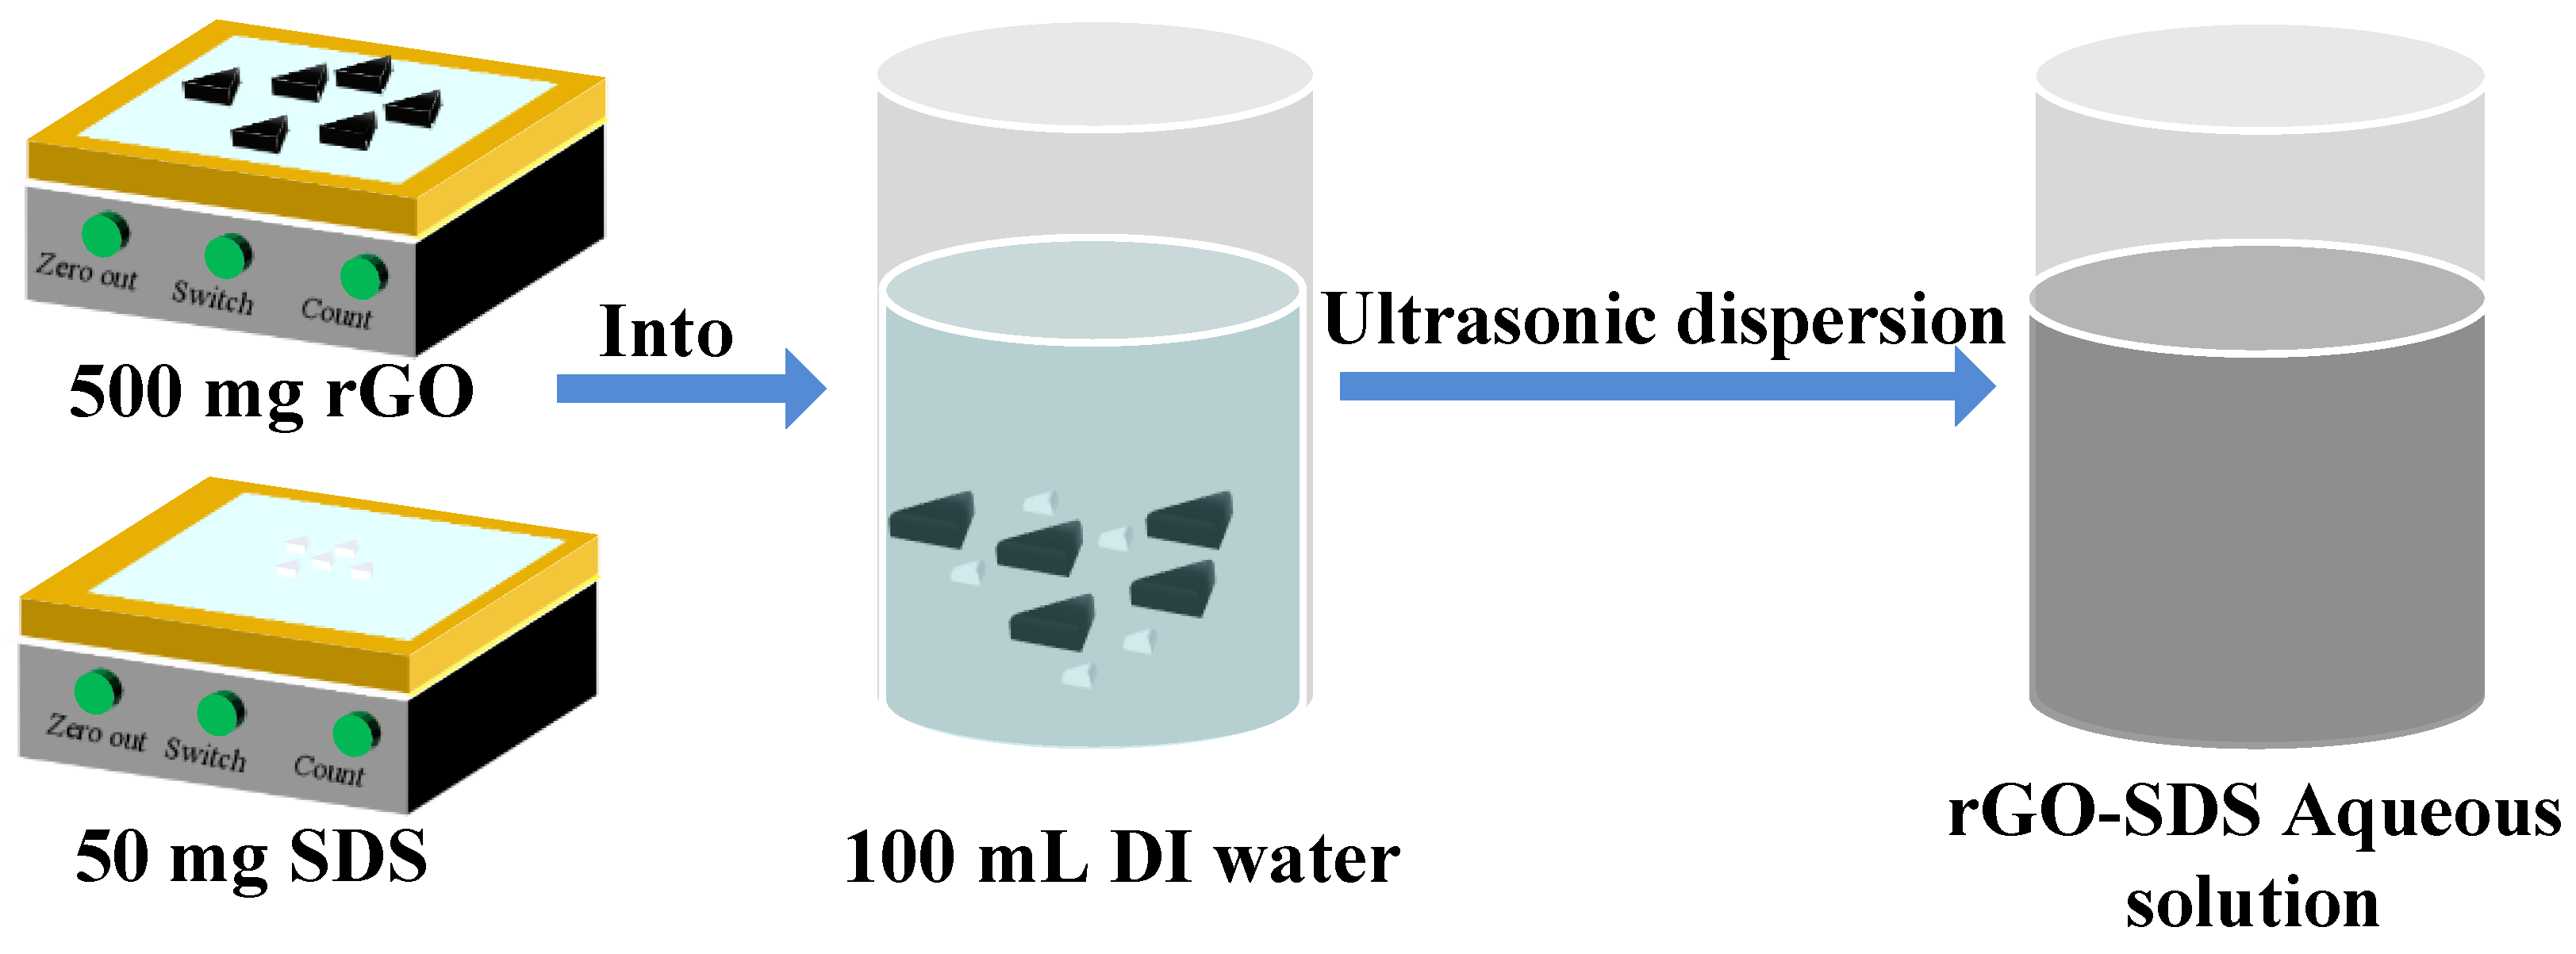
2.1.2. The Preparation of the Sensor
2.1.3. Characterization of Moisture Sensitive Material
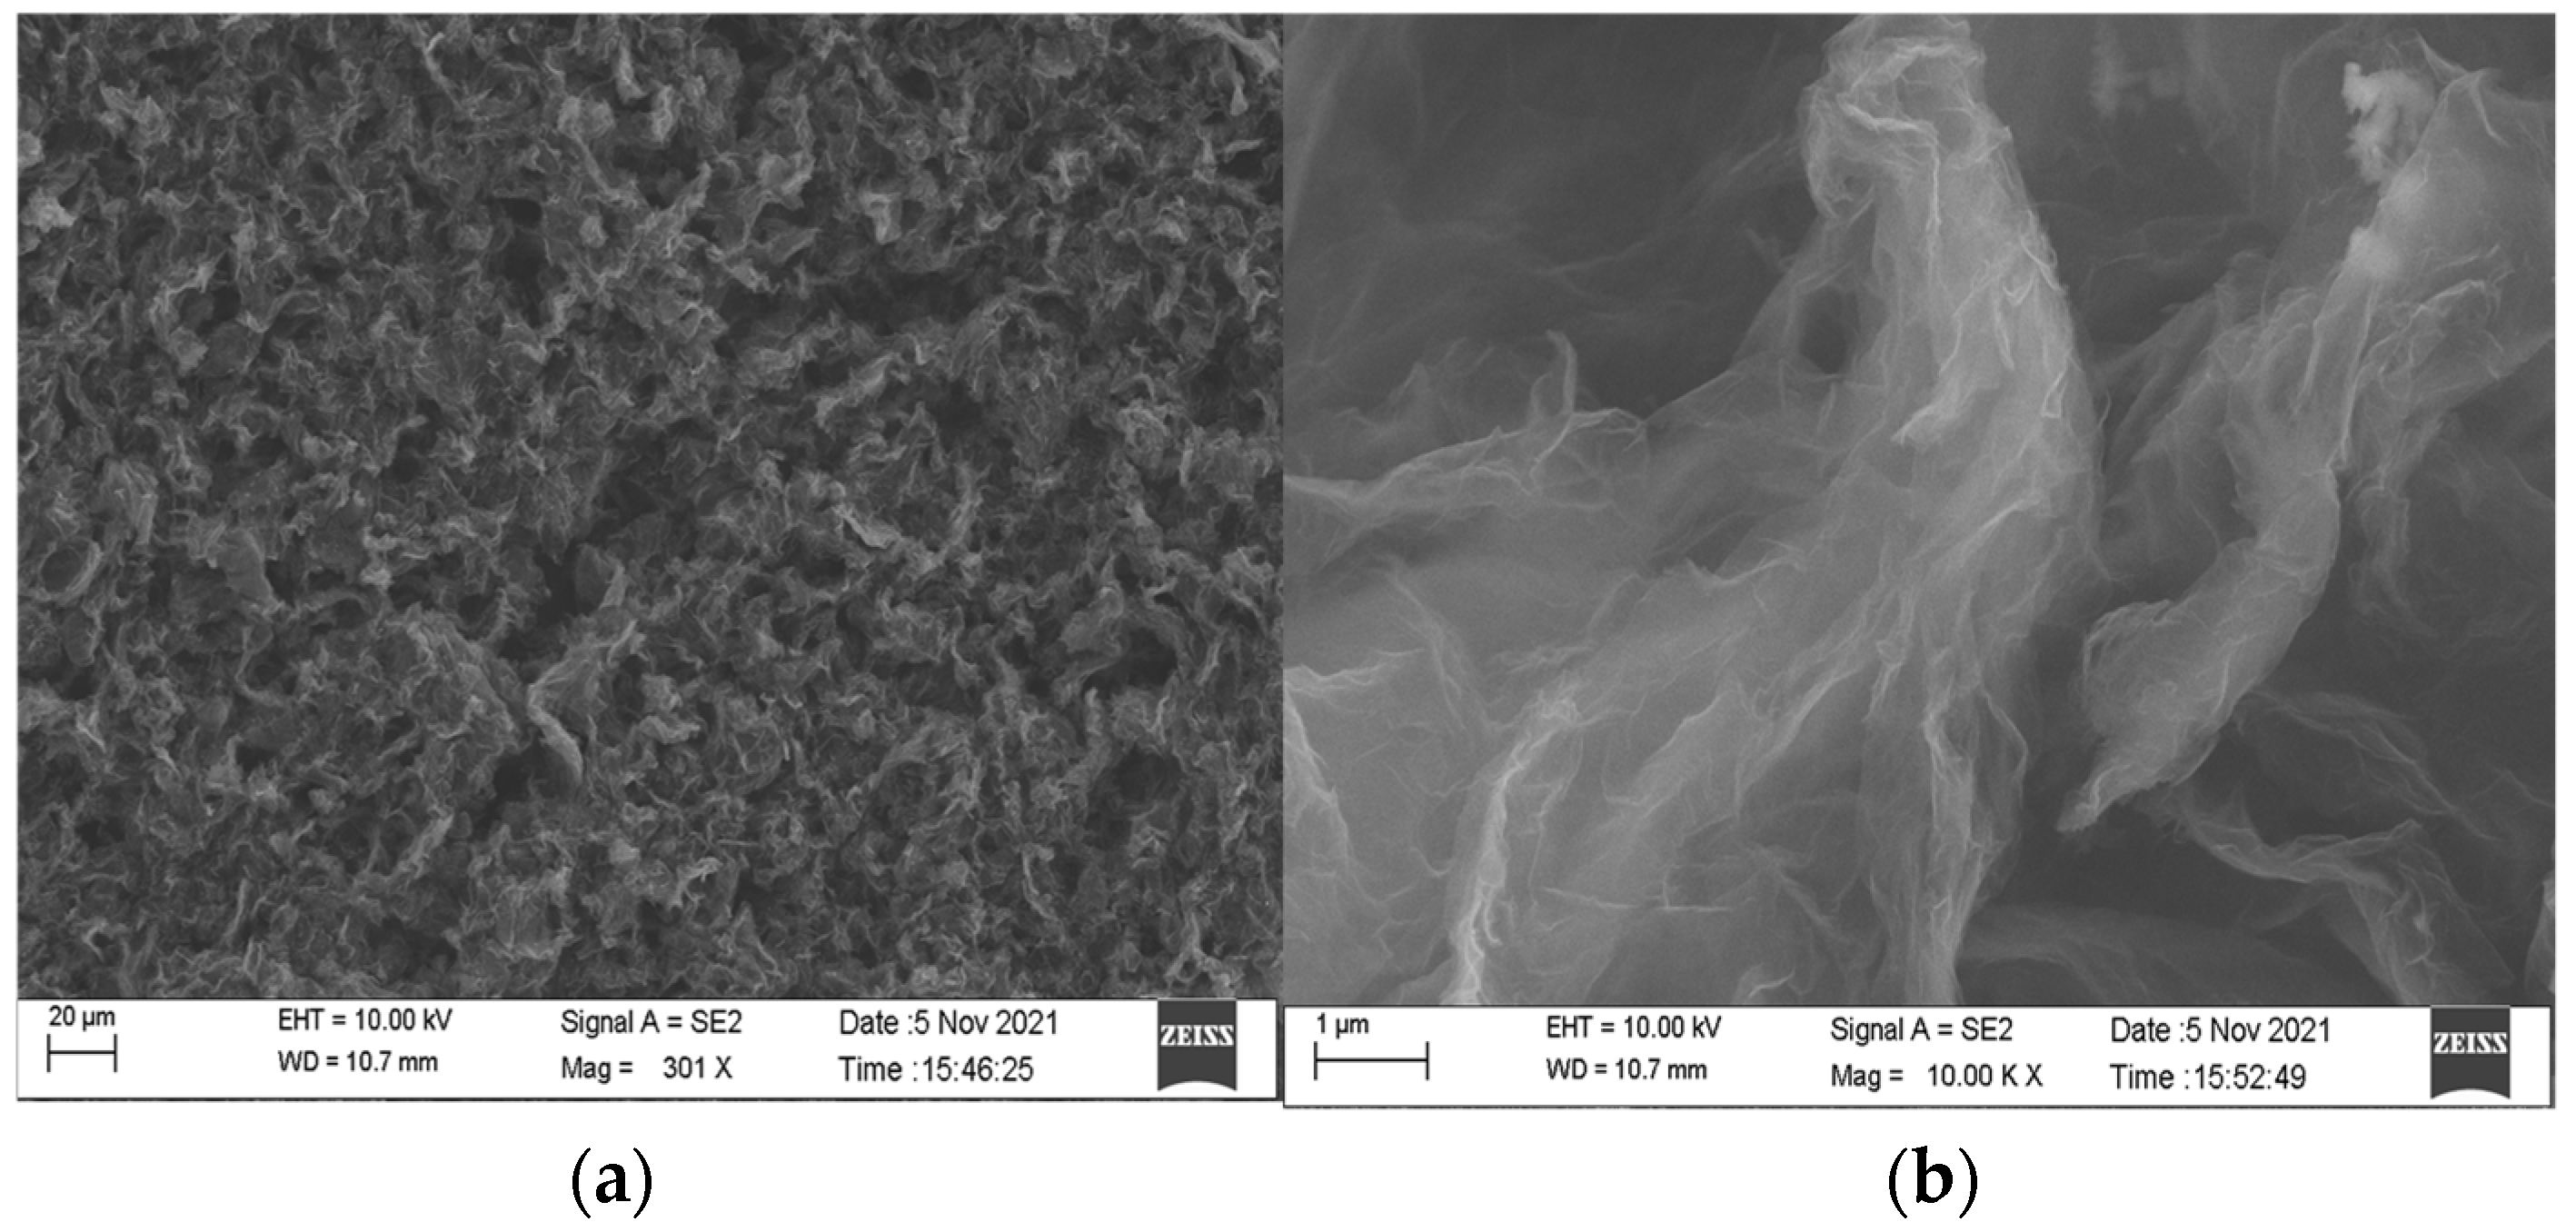
Scanning Electron Microscope Characterization
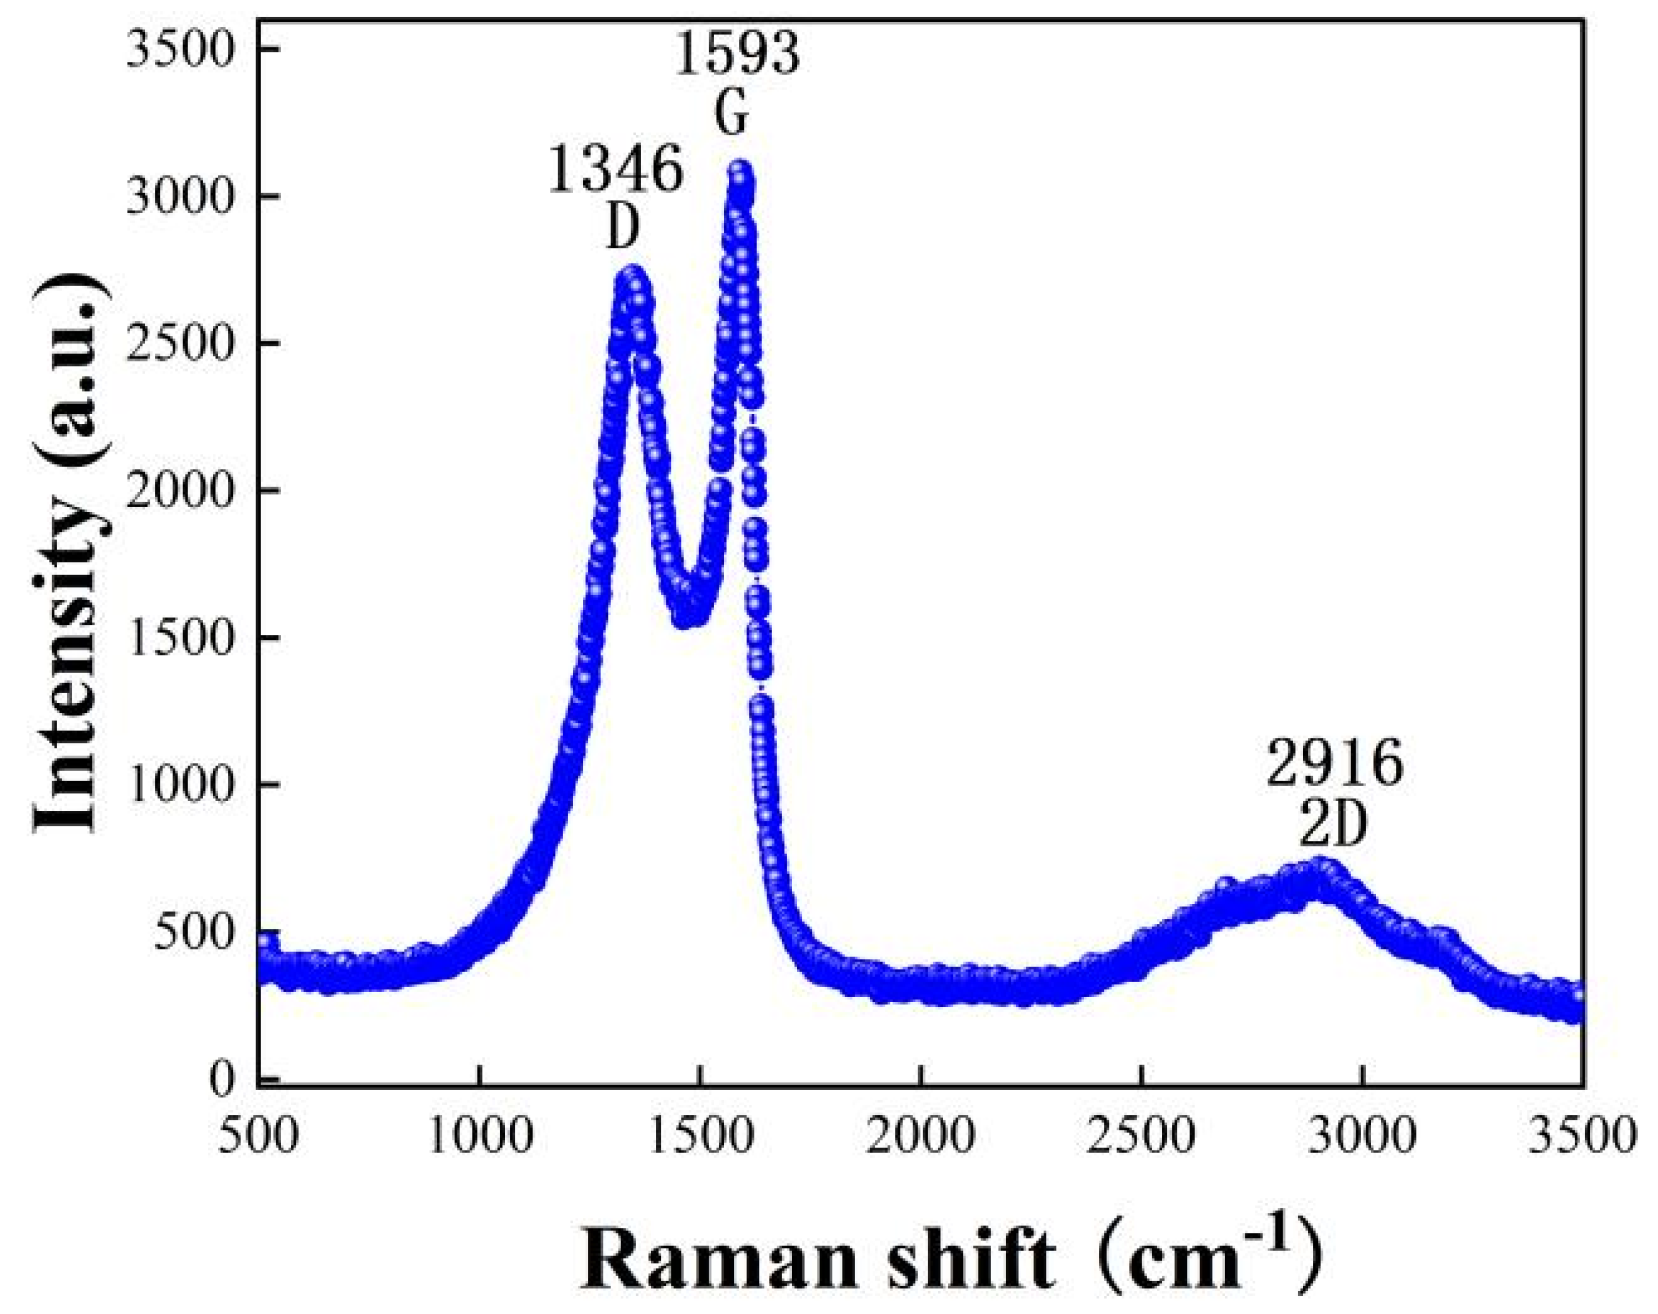
Raman Spectroscopy Characterization
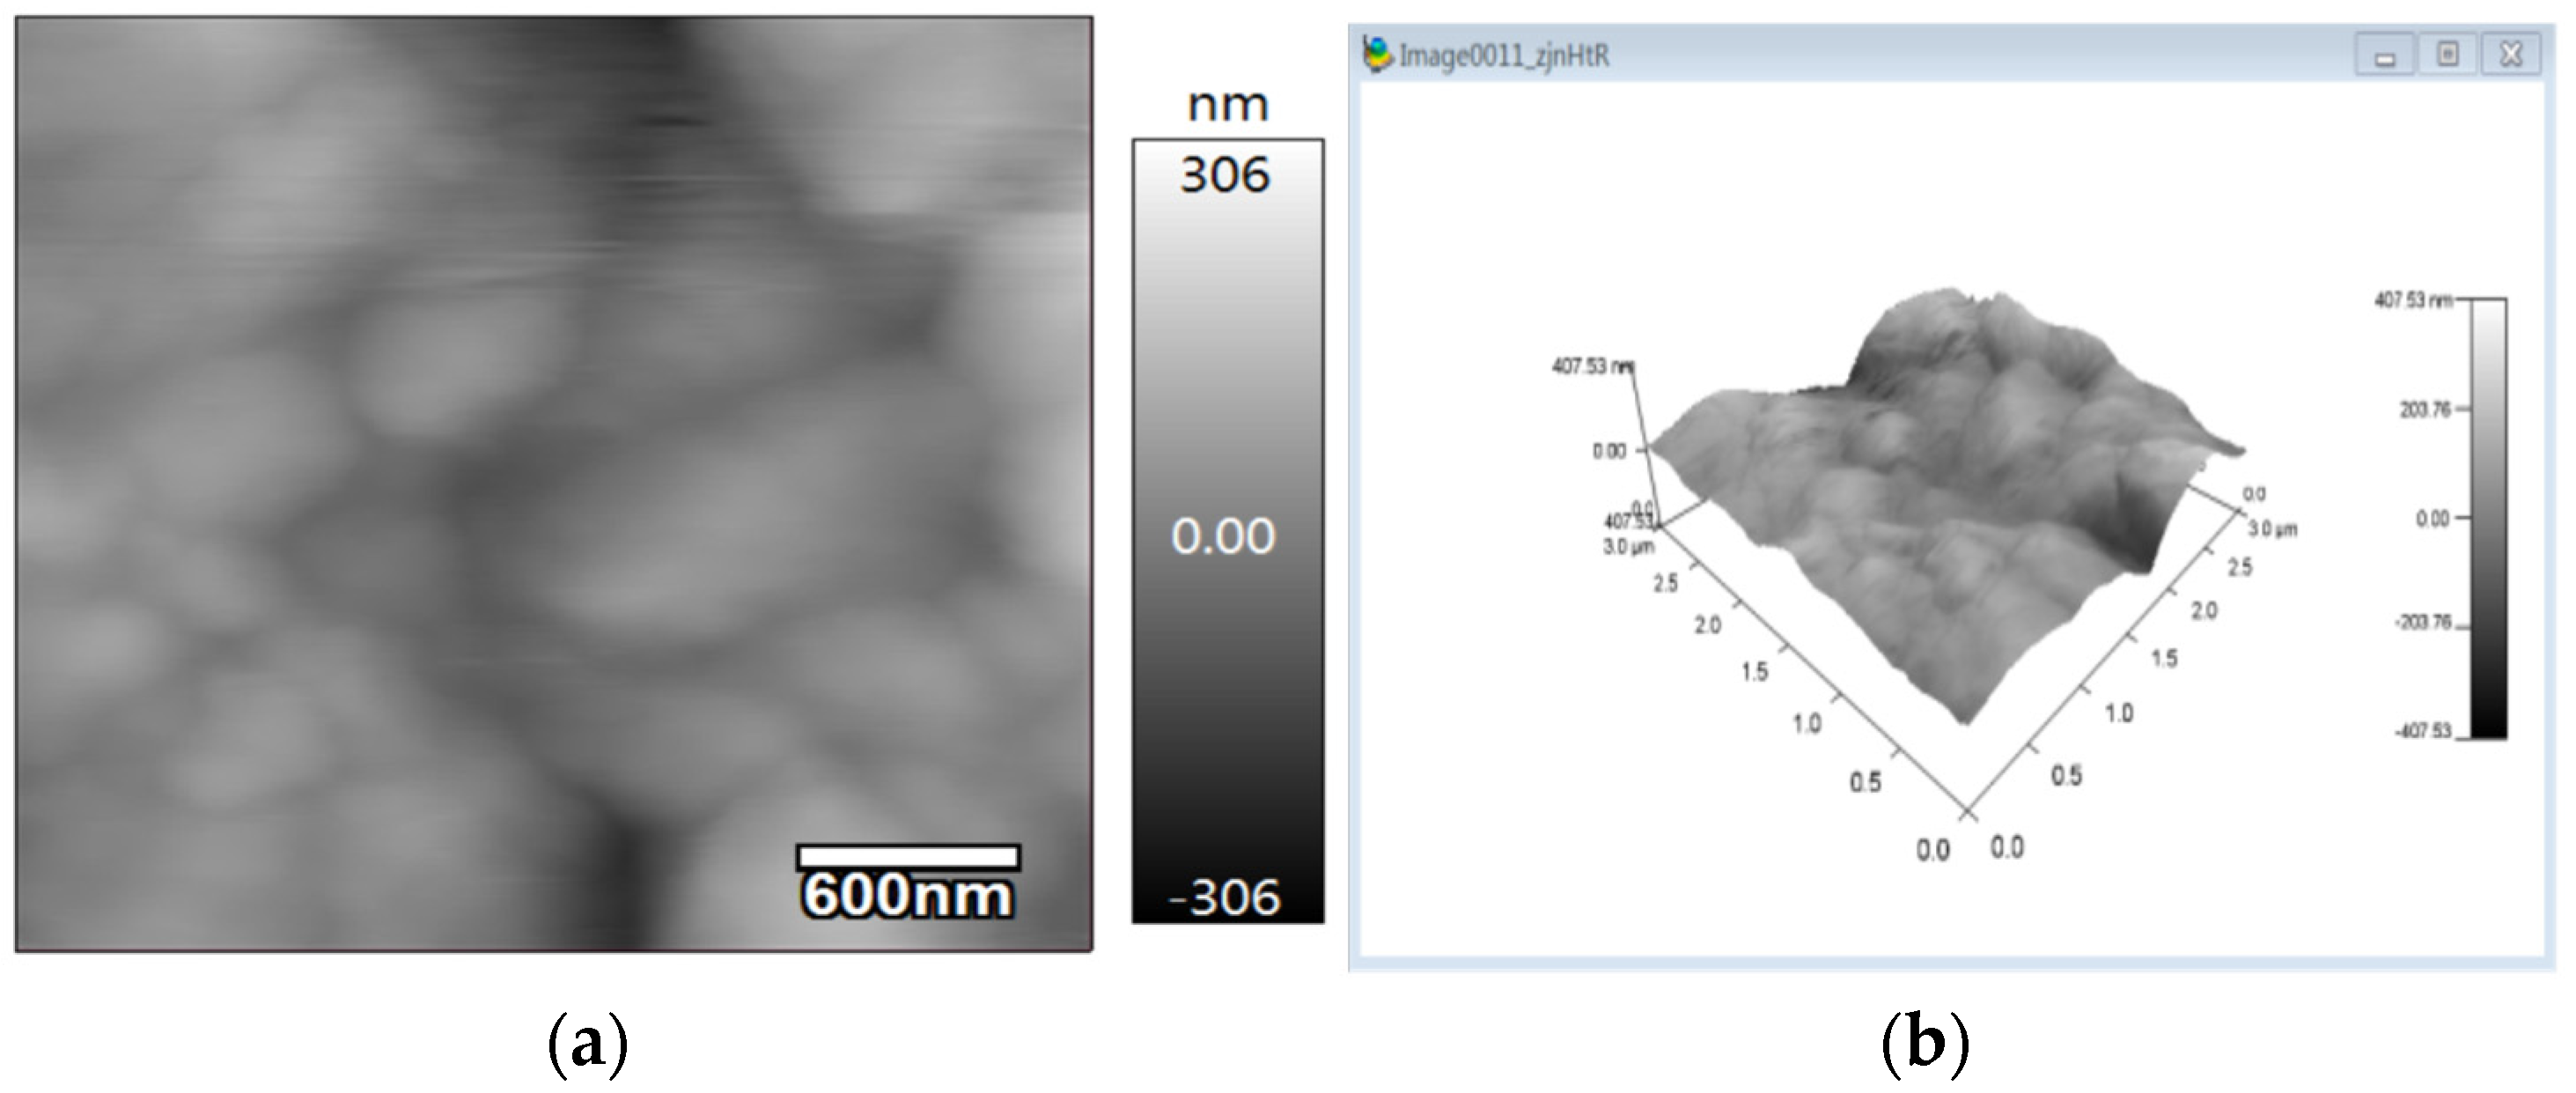
Atomic Force Microscopy Characterization
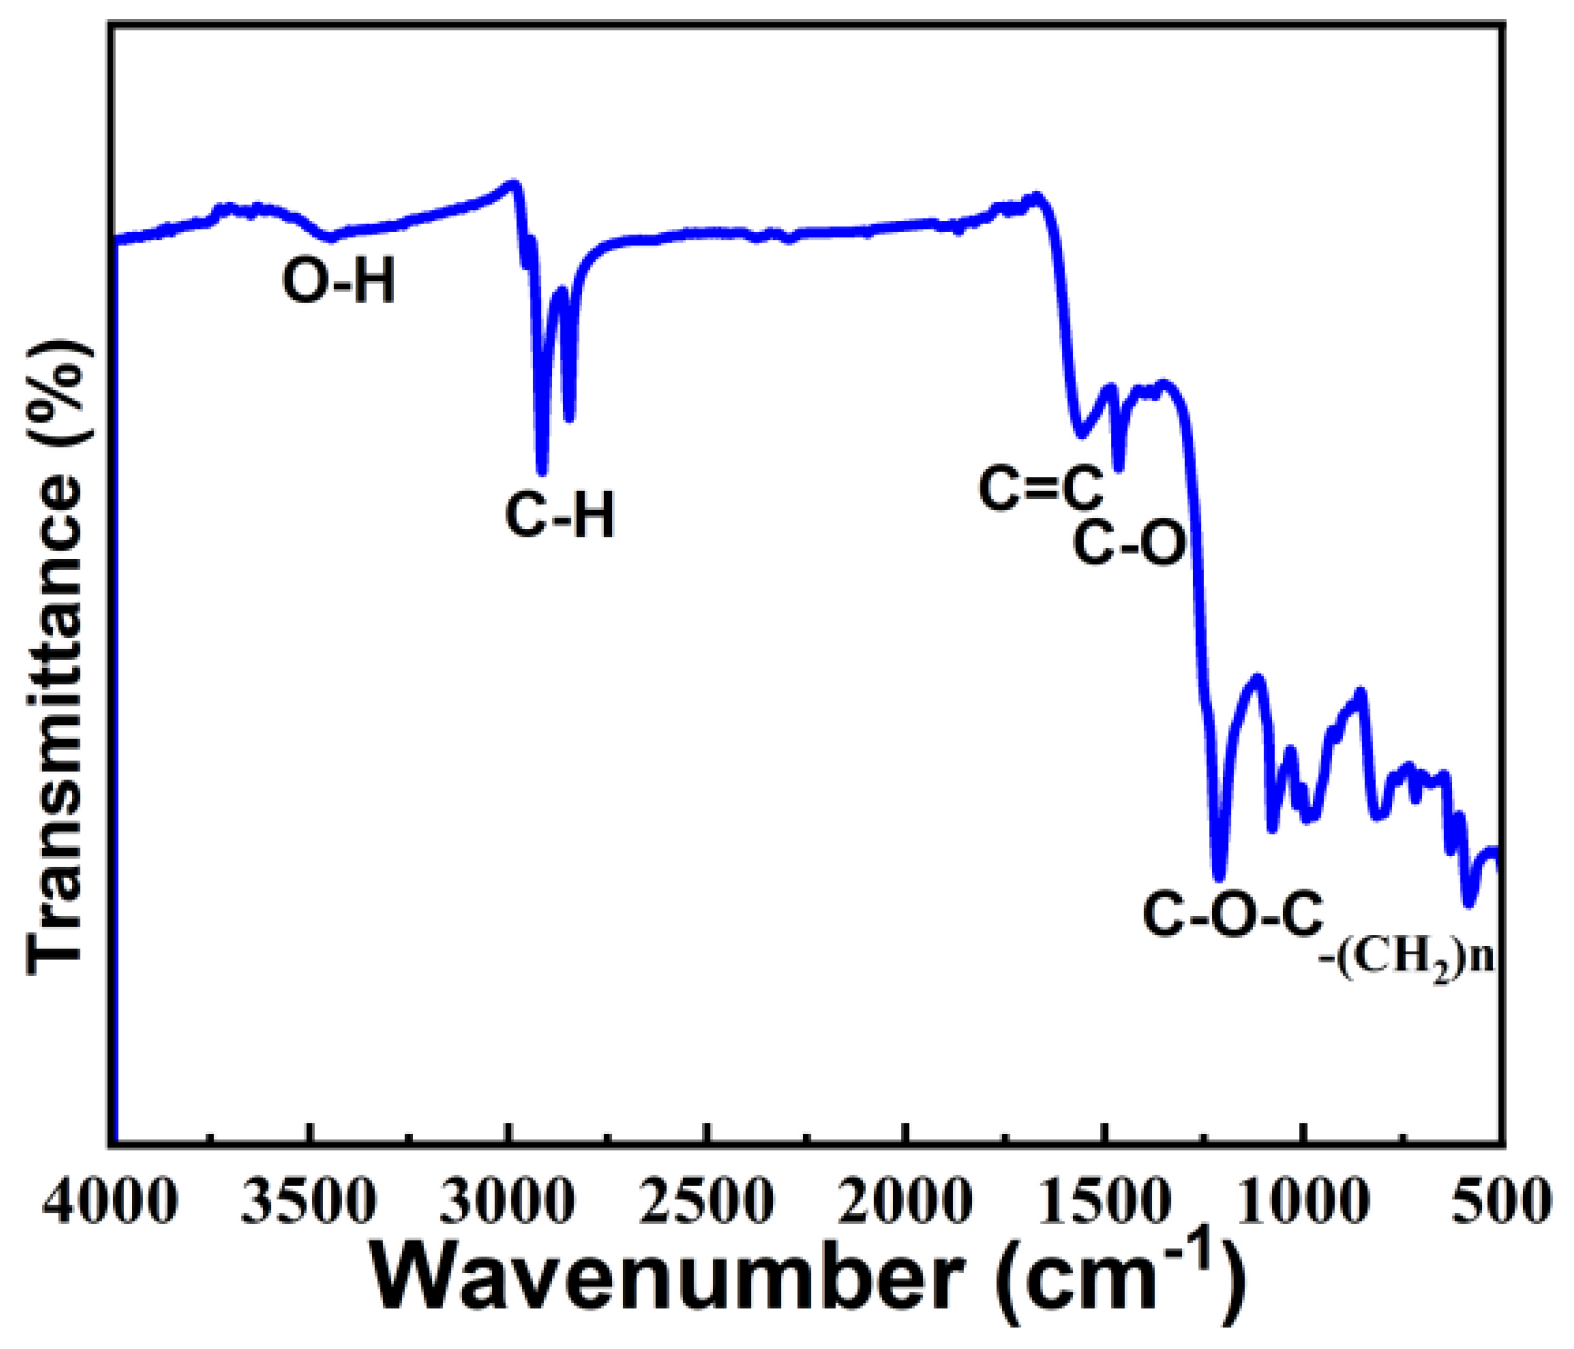
Infrared Spectroscopy
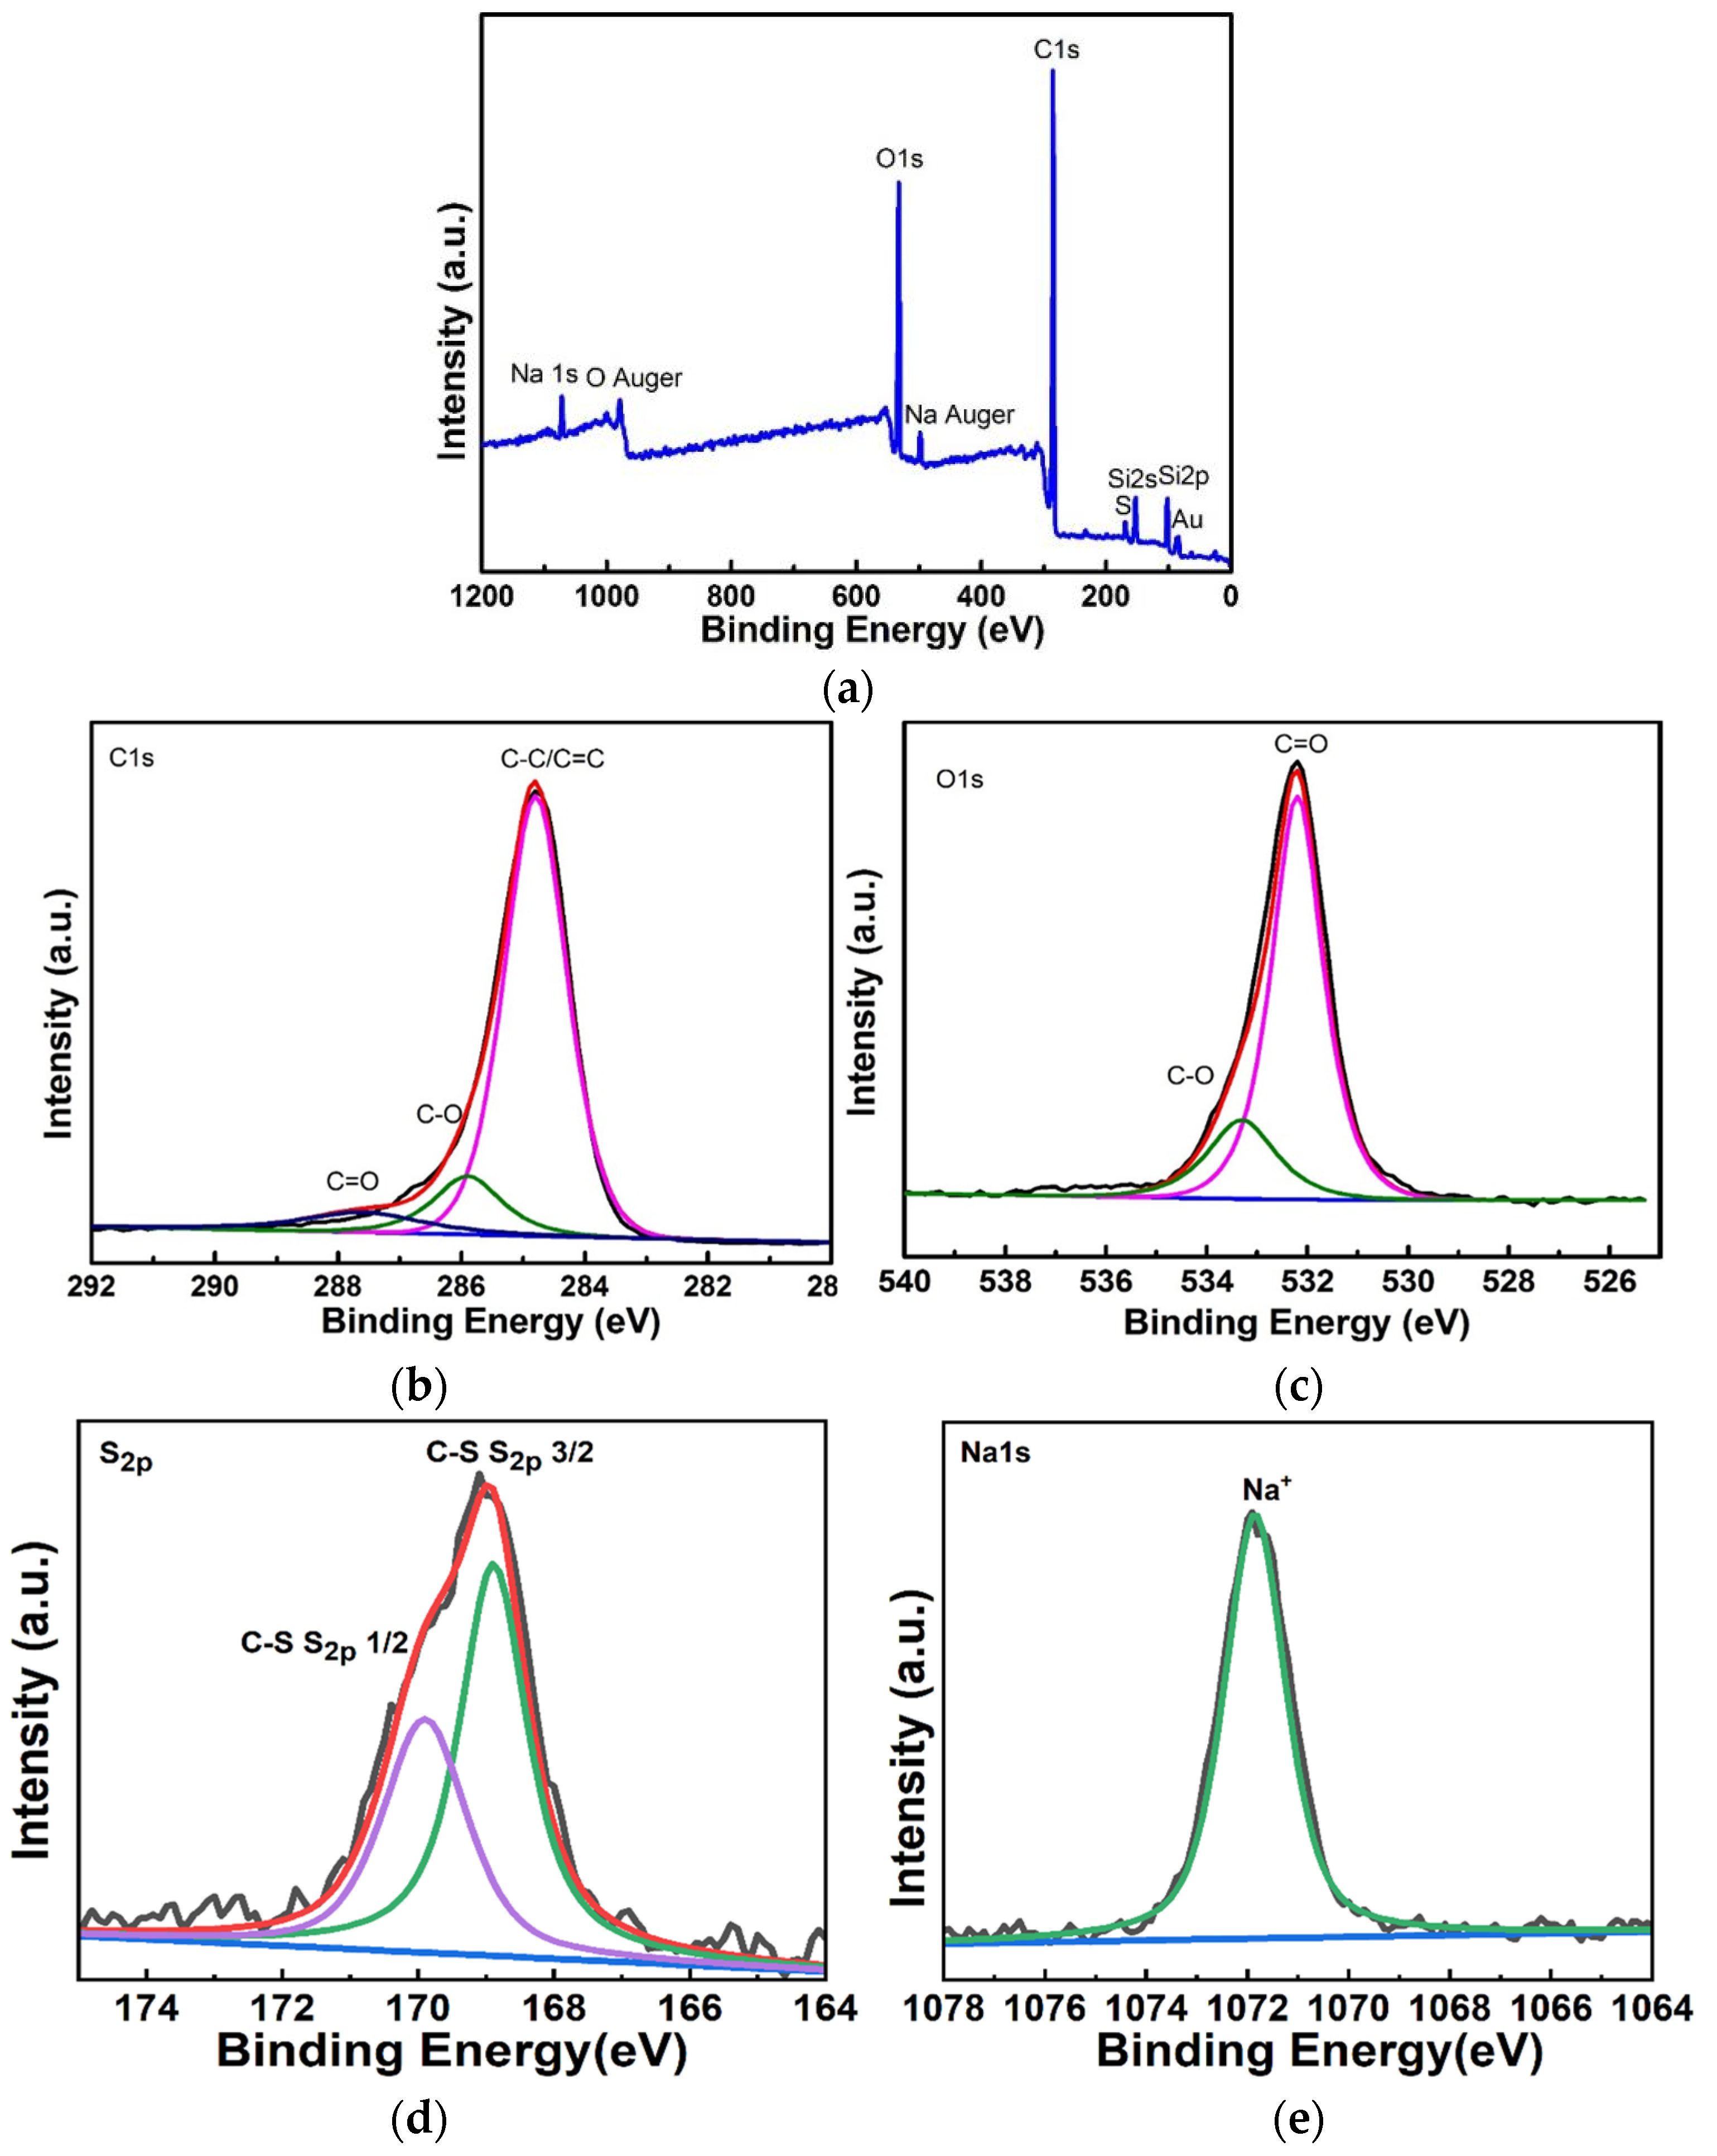
X-ray Photoelectron Spectroscopy
3. Results and Discussion
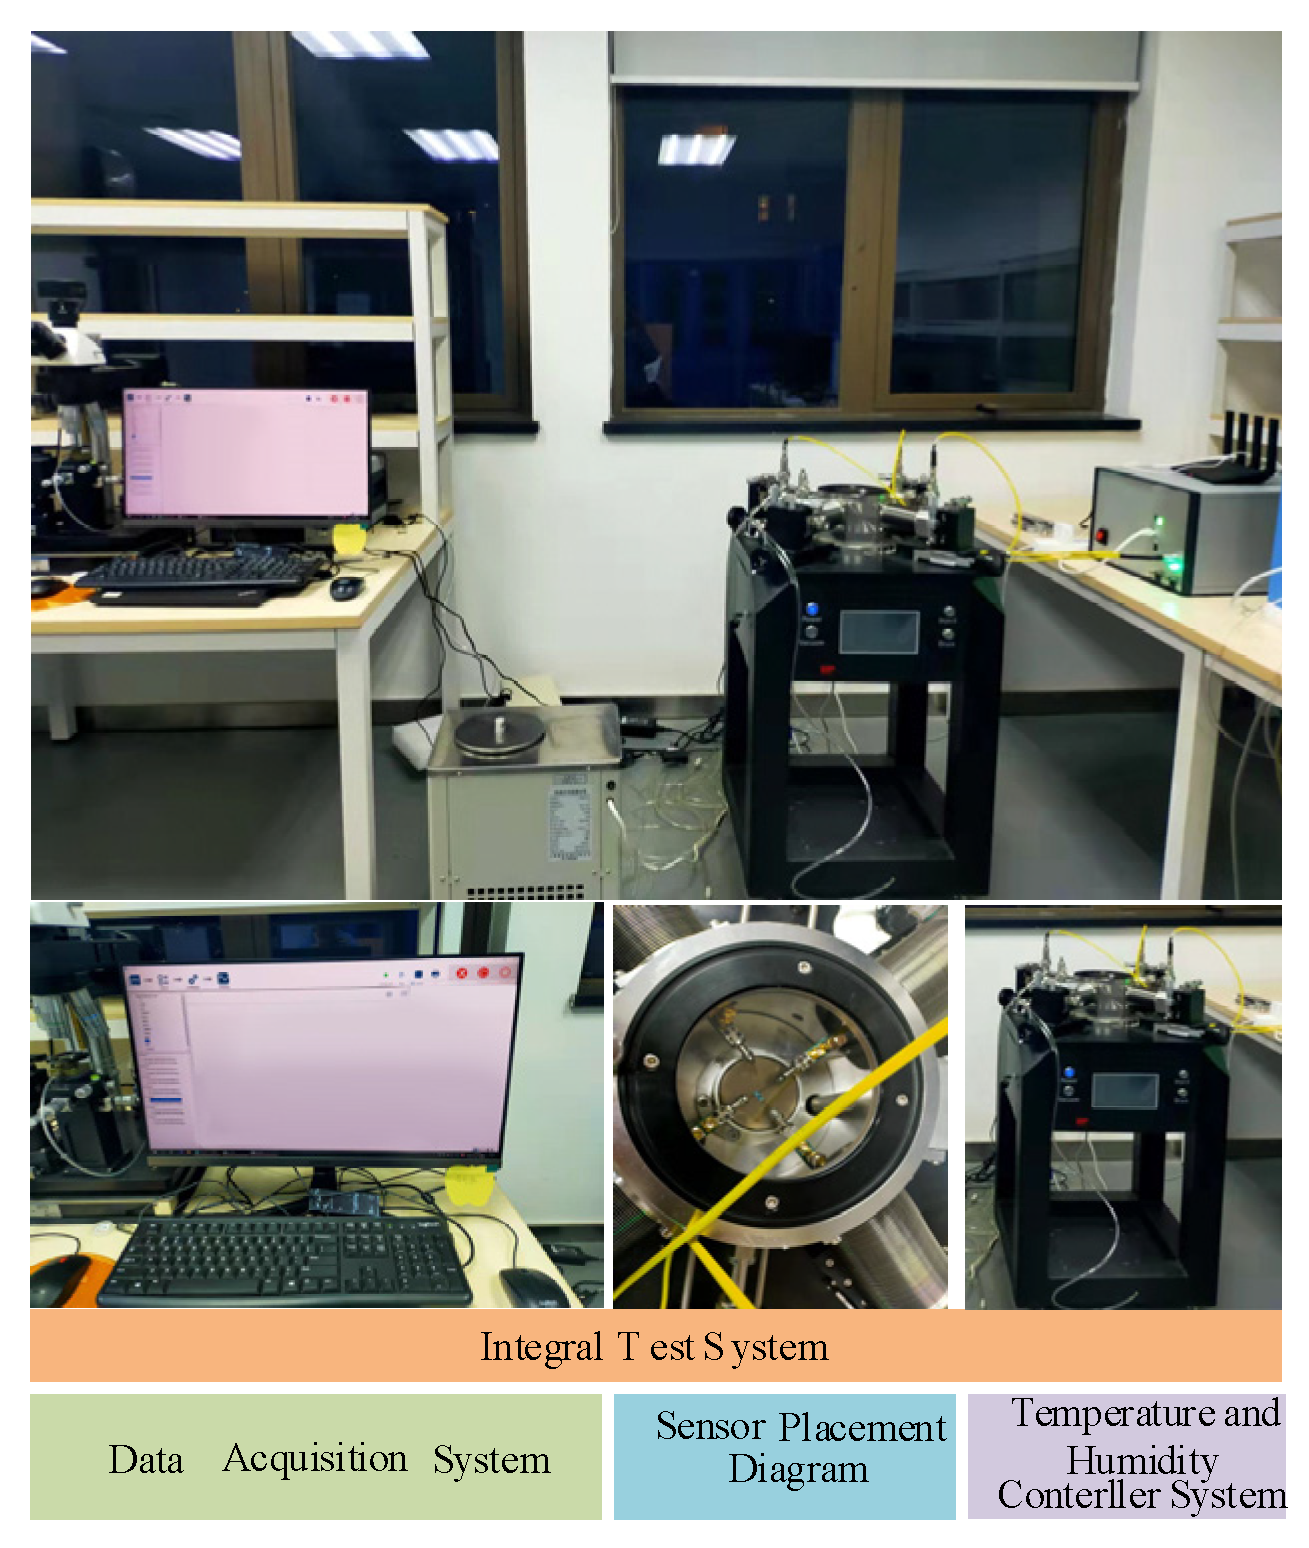
3.1. Test Systems
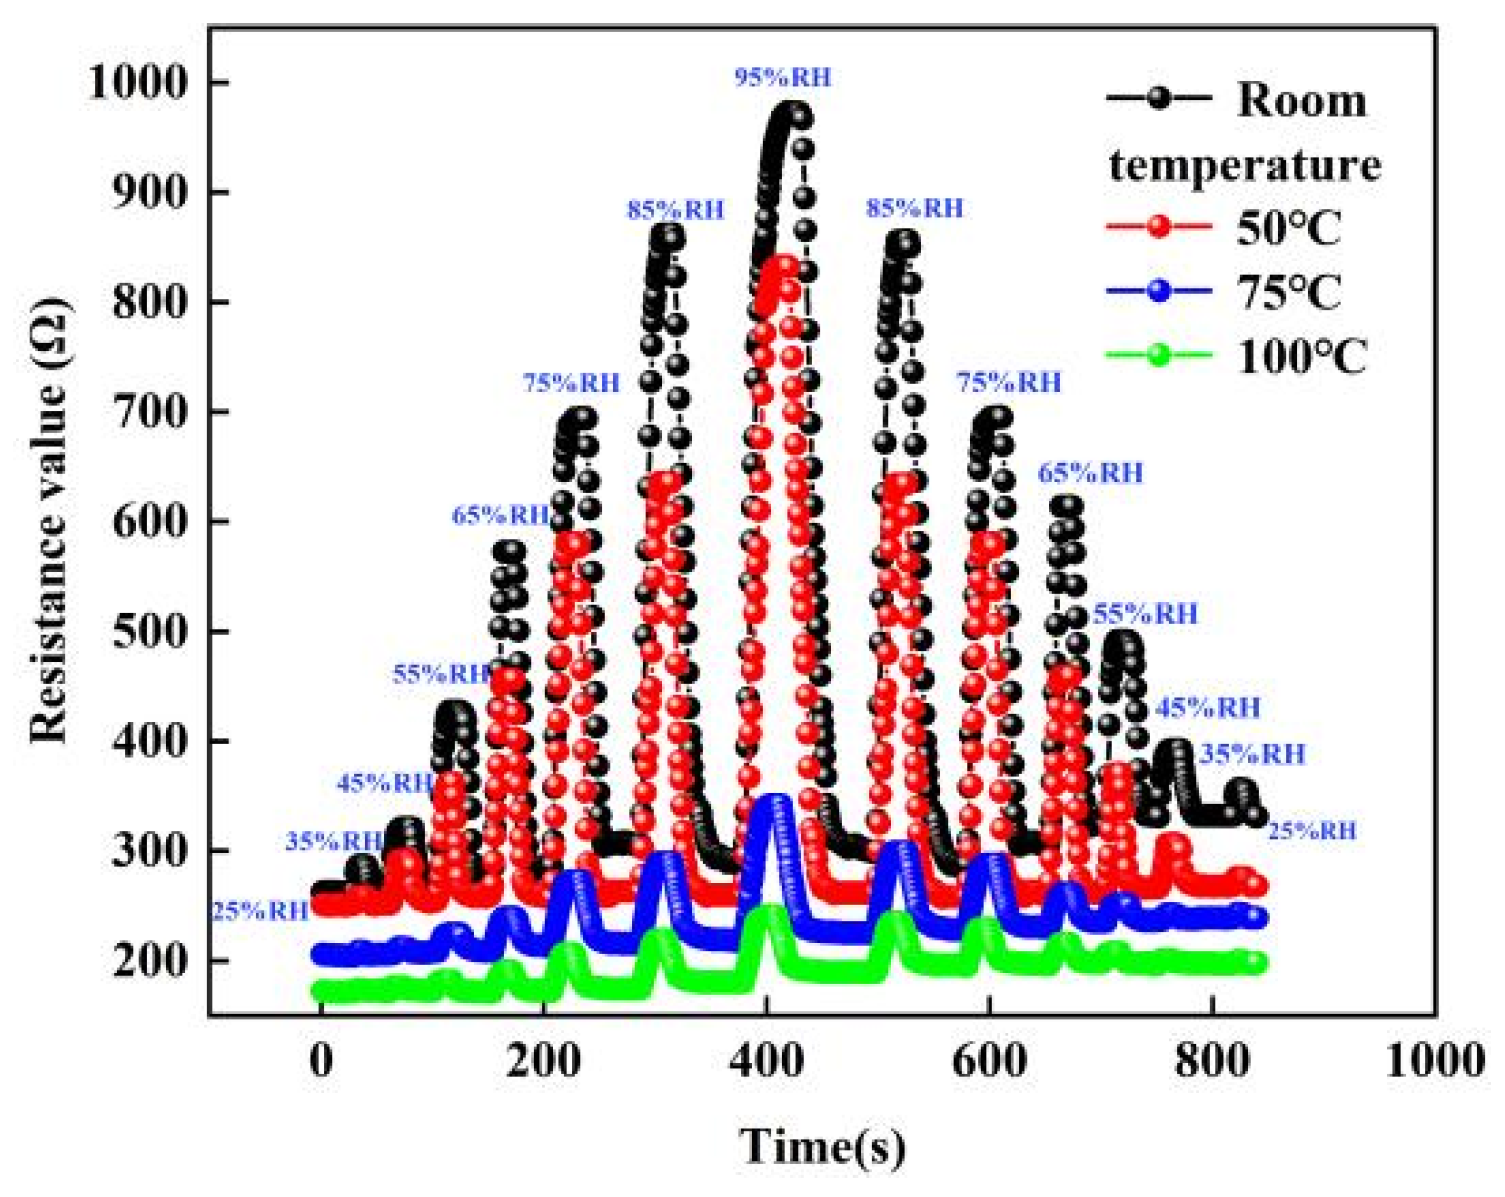
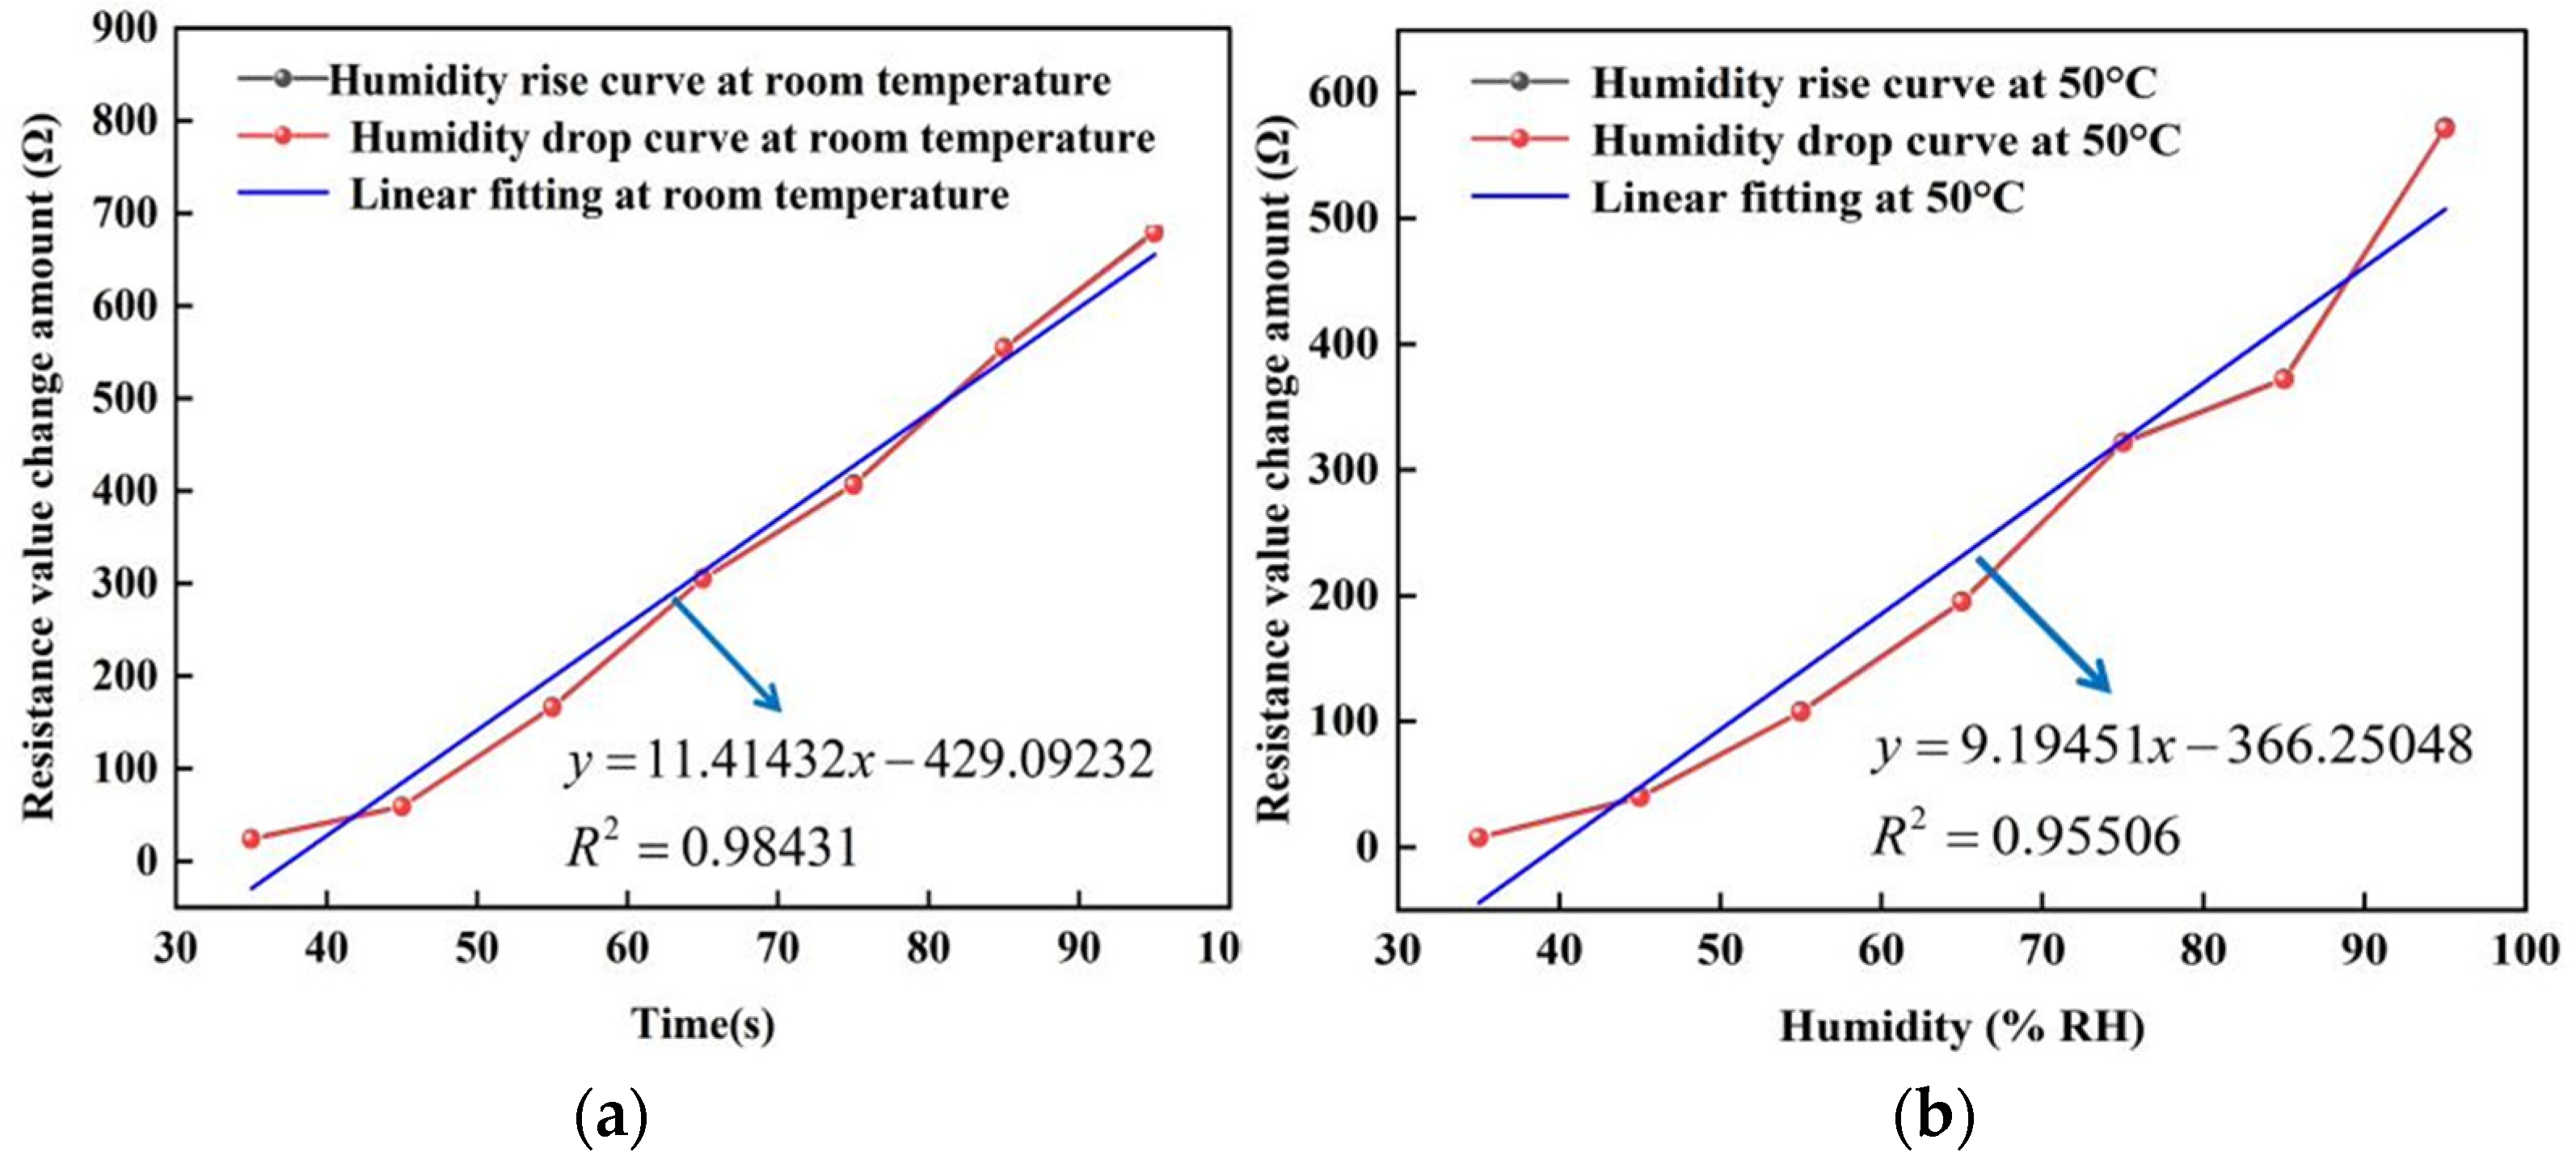
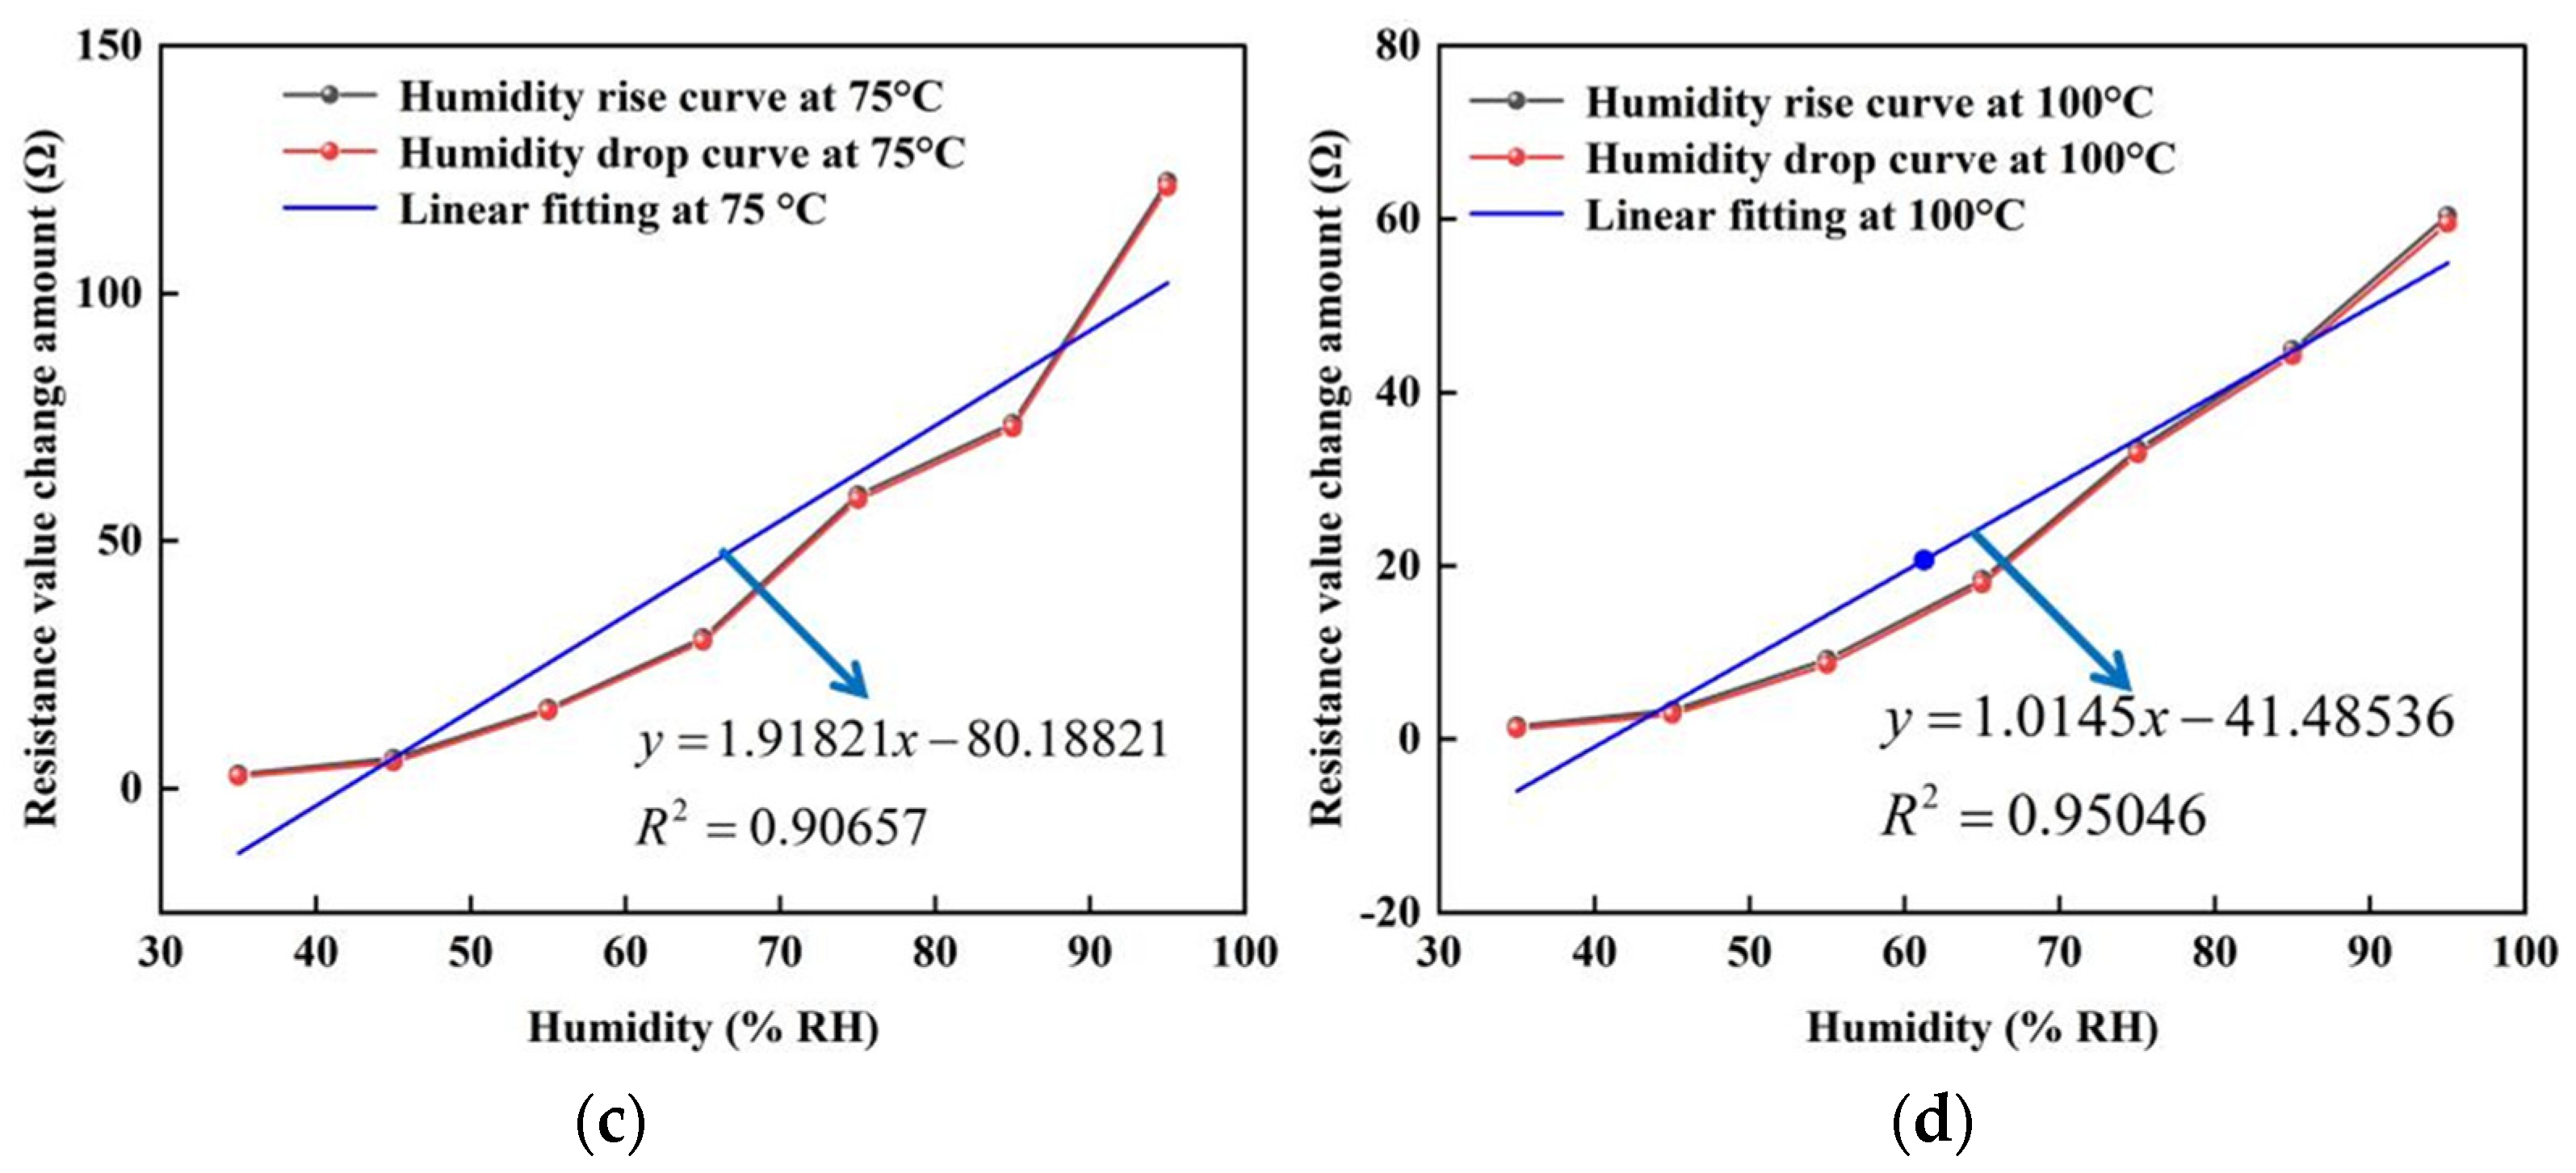
3.2. The Sensitivity Test
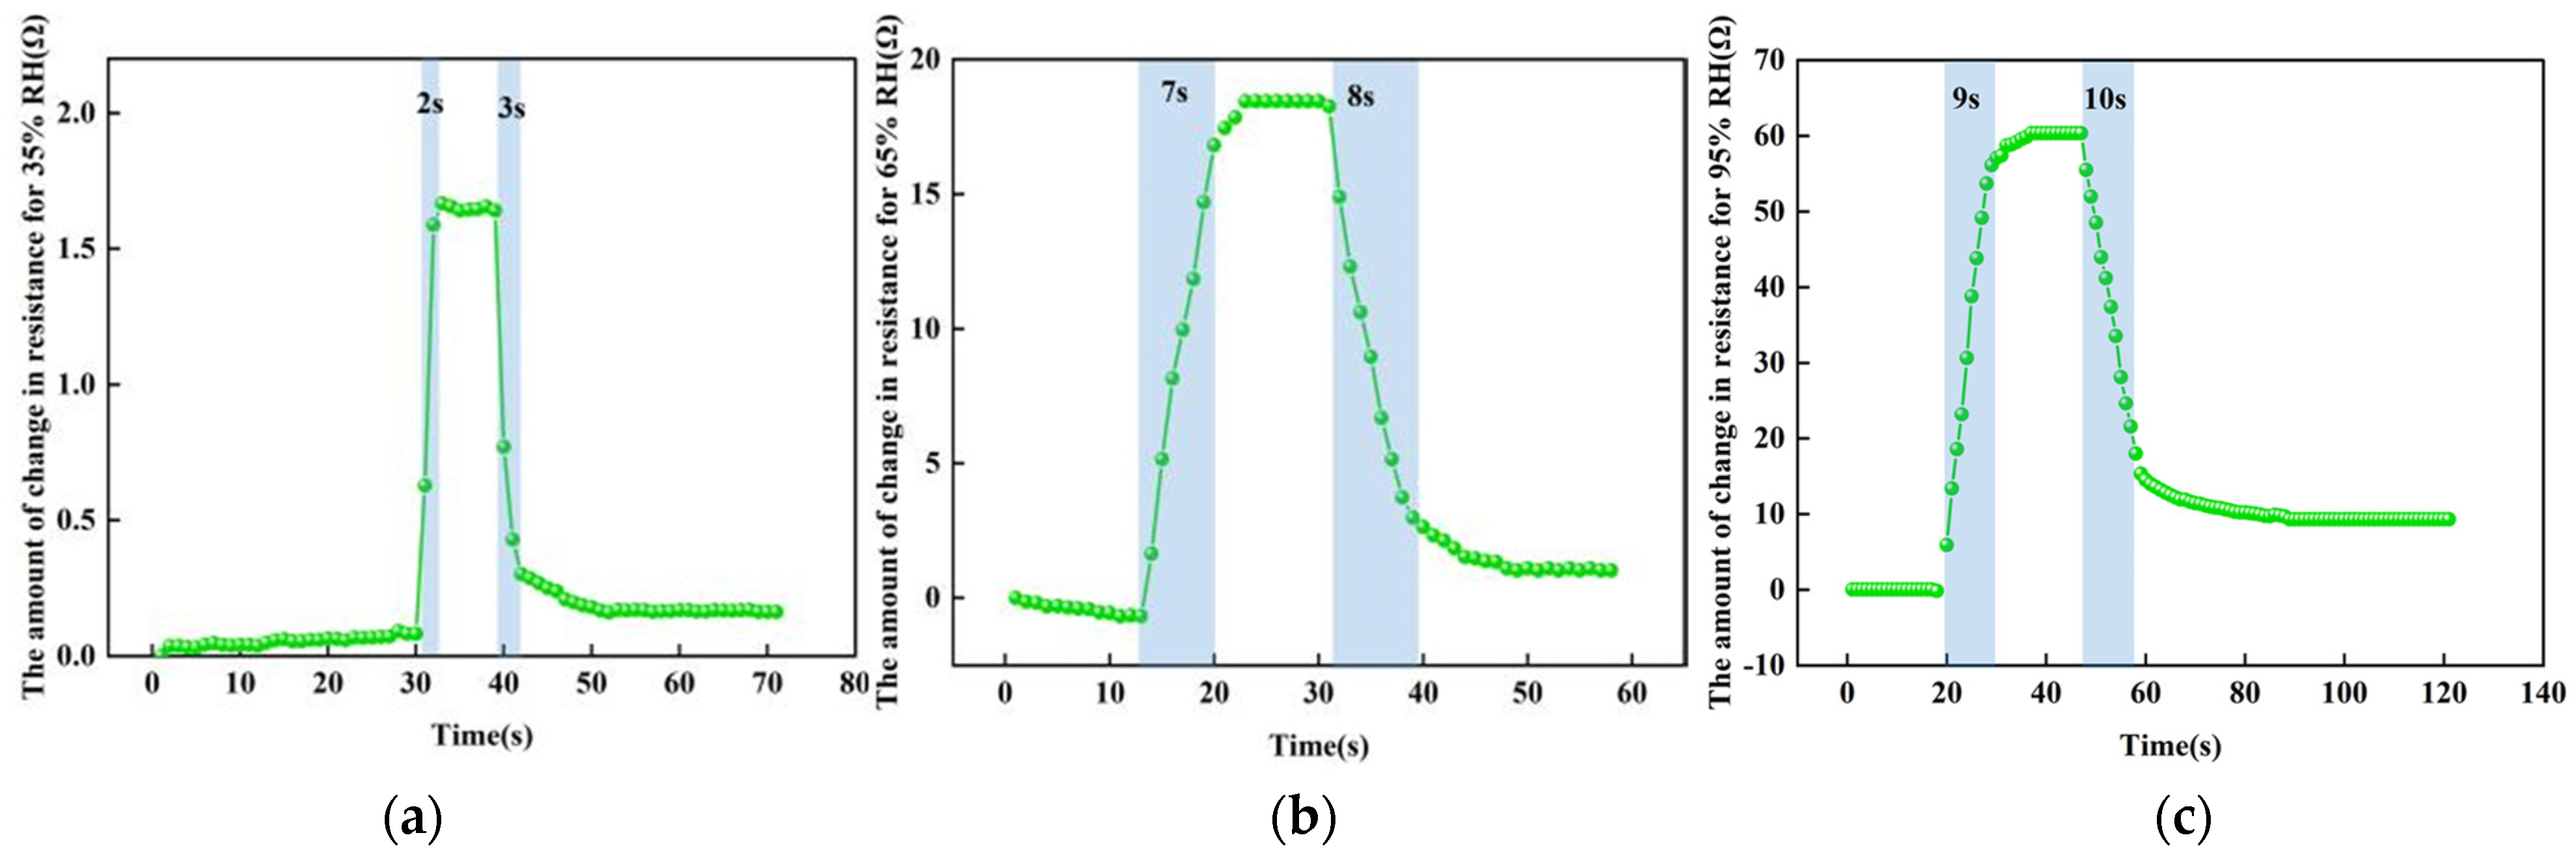
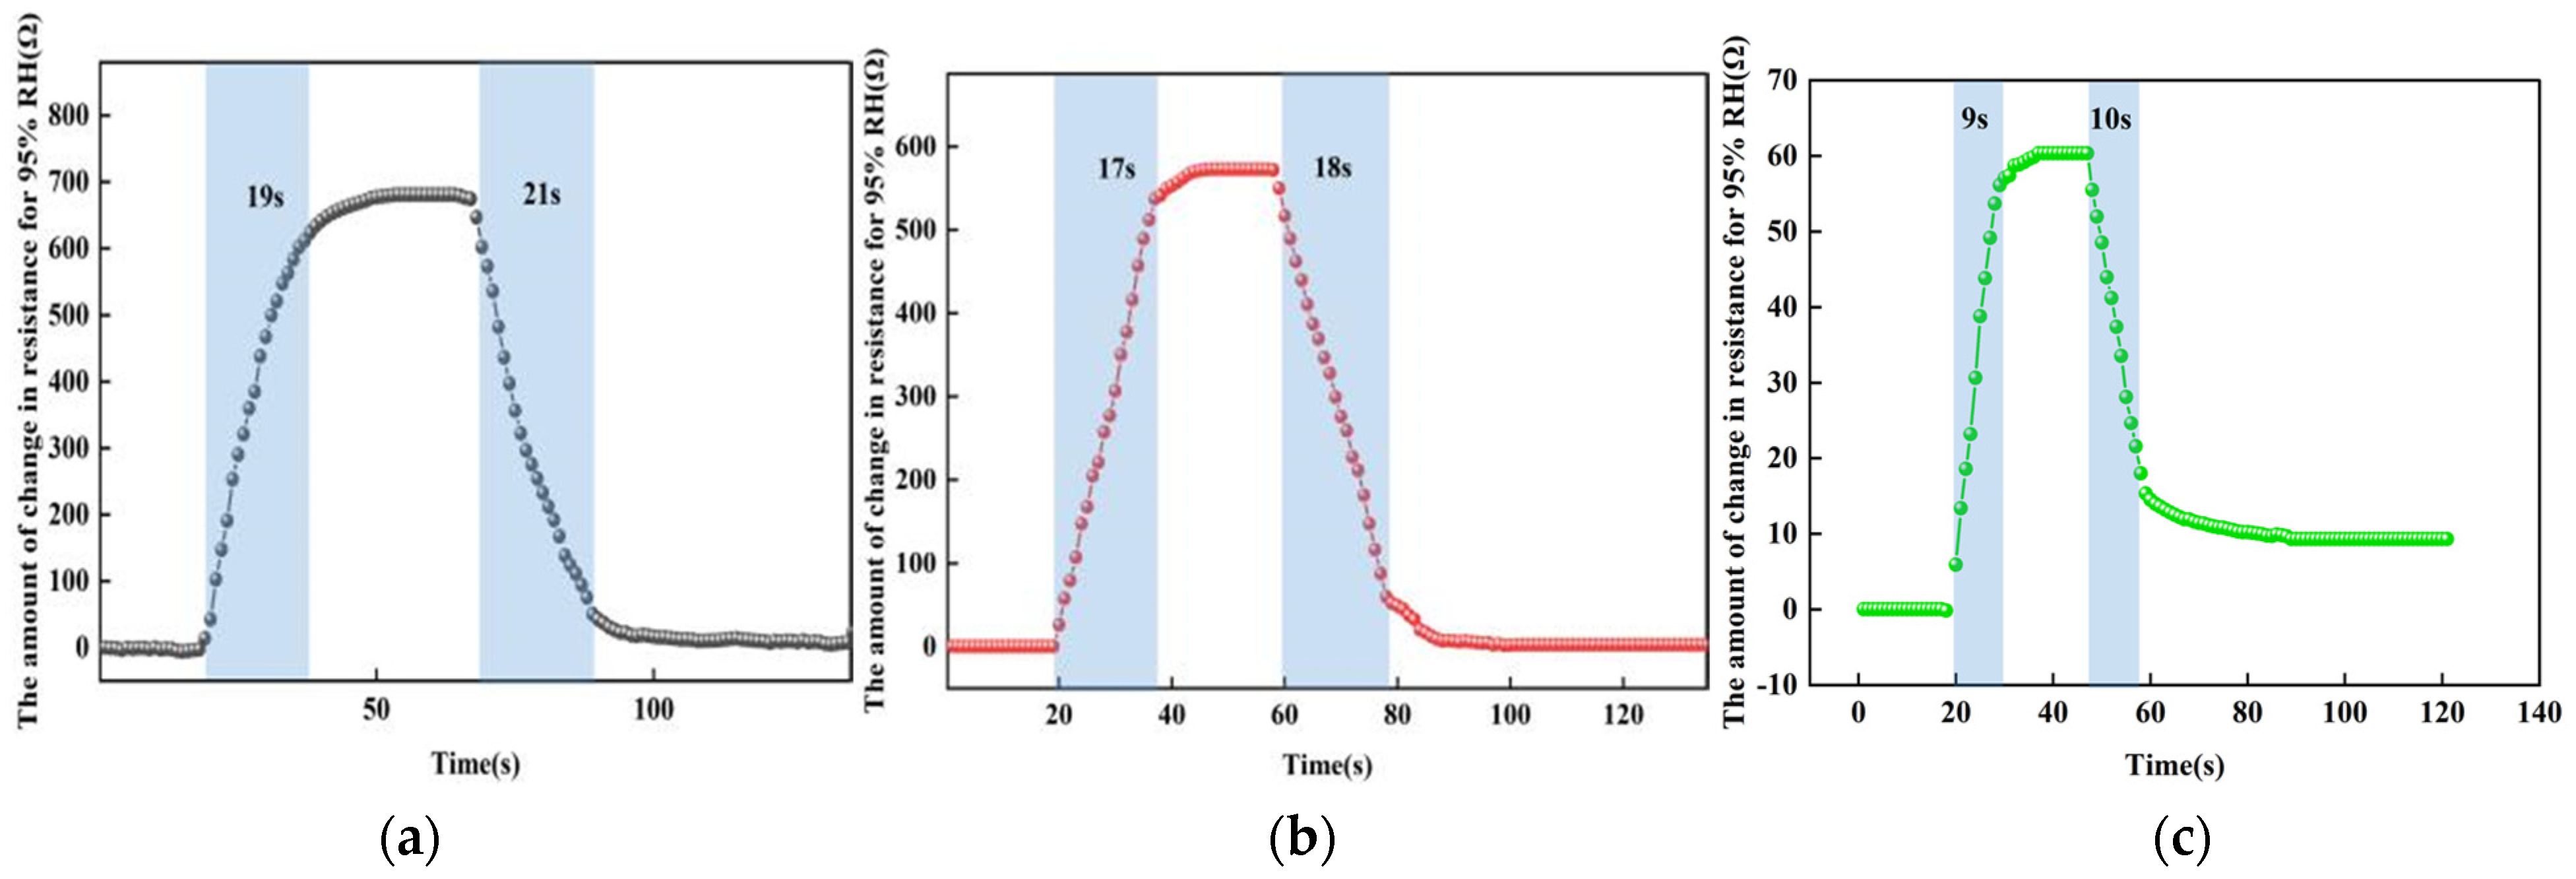
3.3. The Response-Recovery Time Test
3.3.1. The Response-Recovery Test at Different Humidity
3.3.2. The Response-Recovery Time Test at Different Humidities
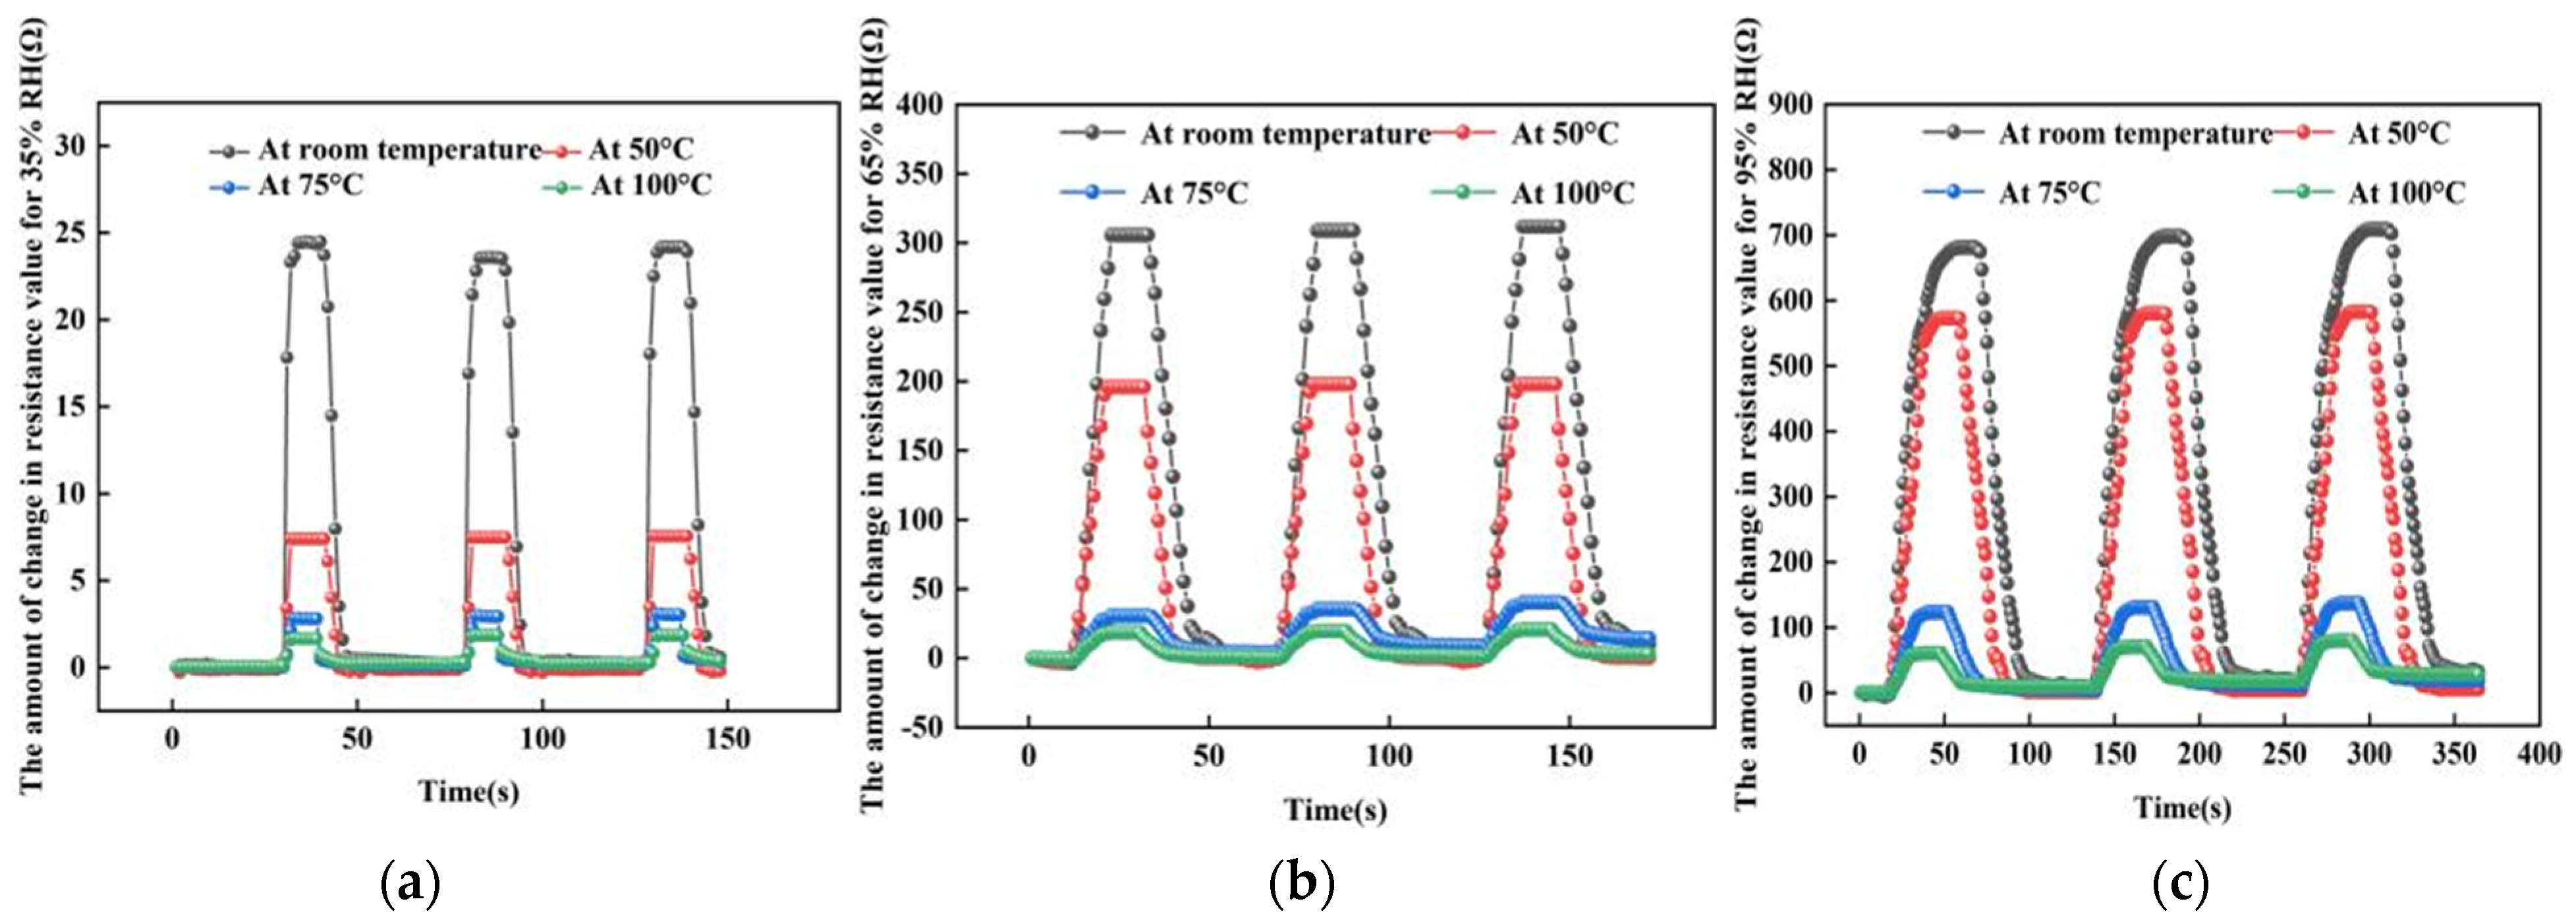
3.3.3. The Response-Recovery Time Test at Different Temperature
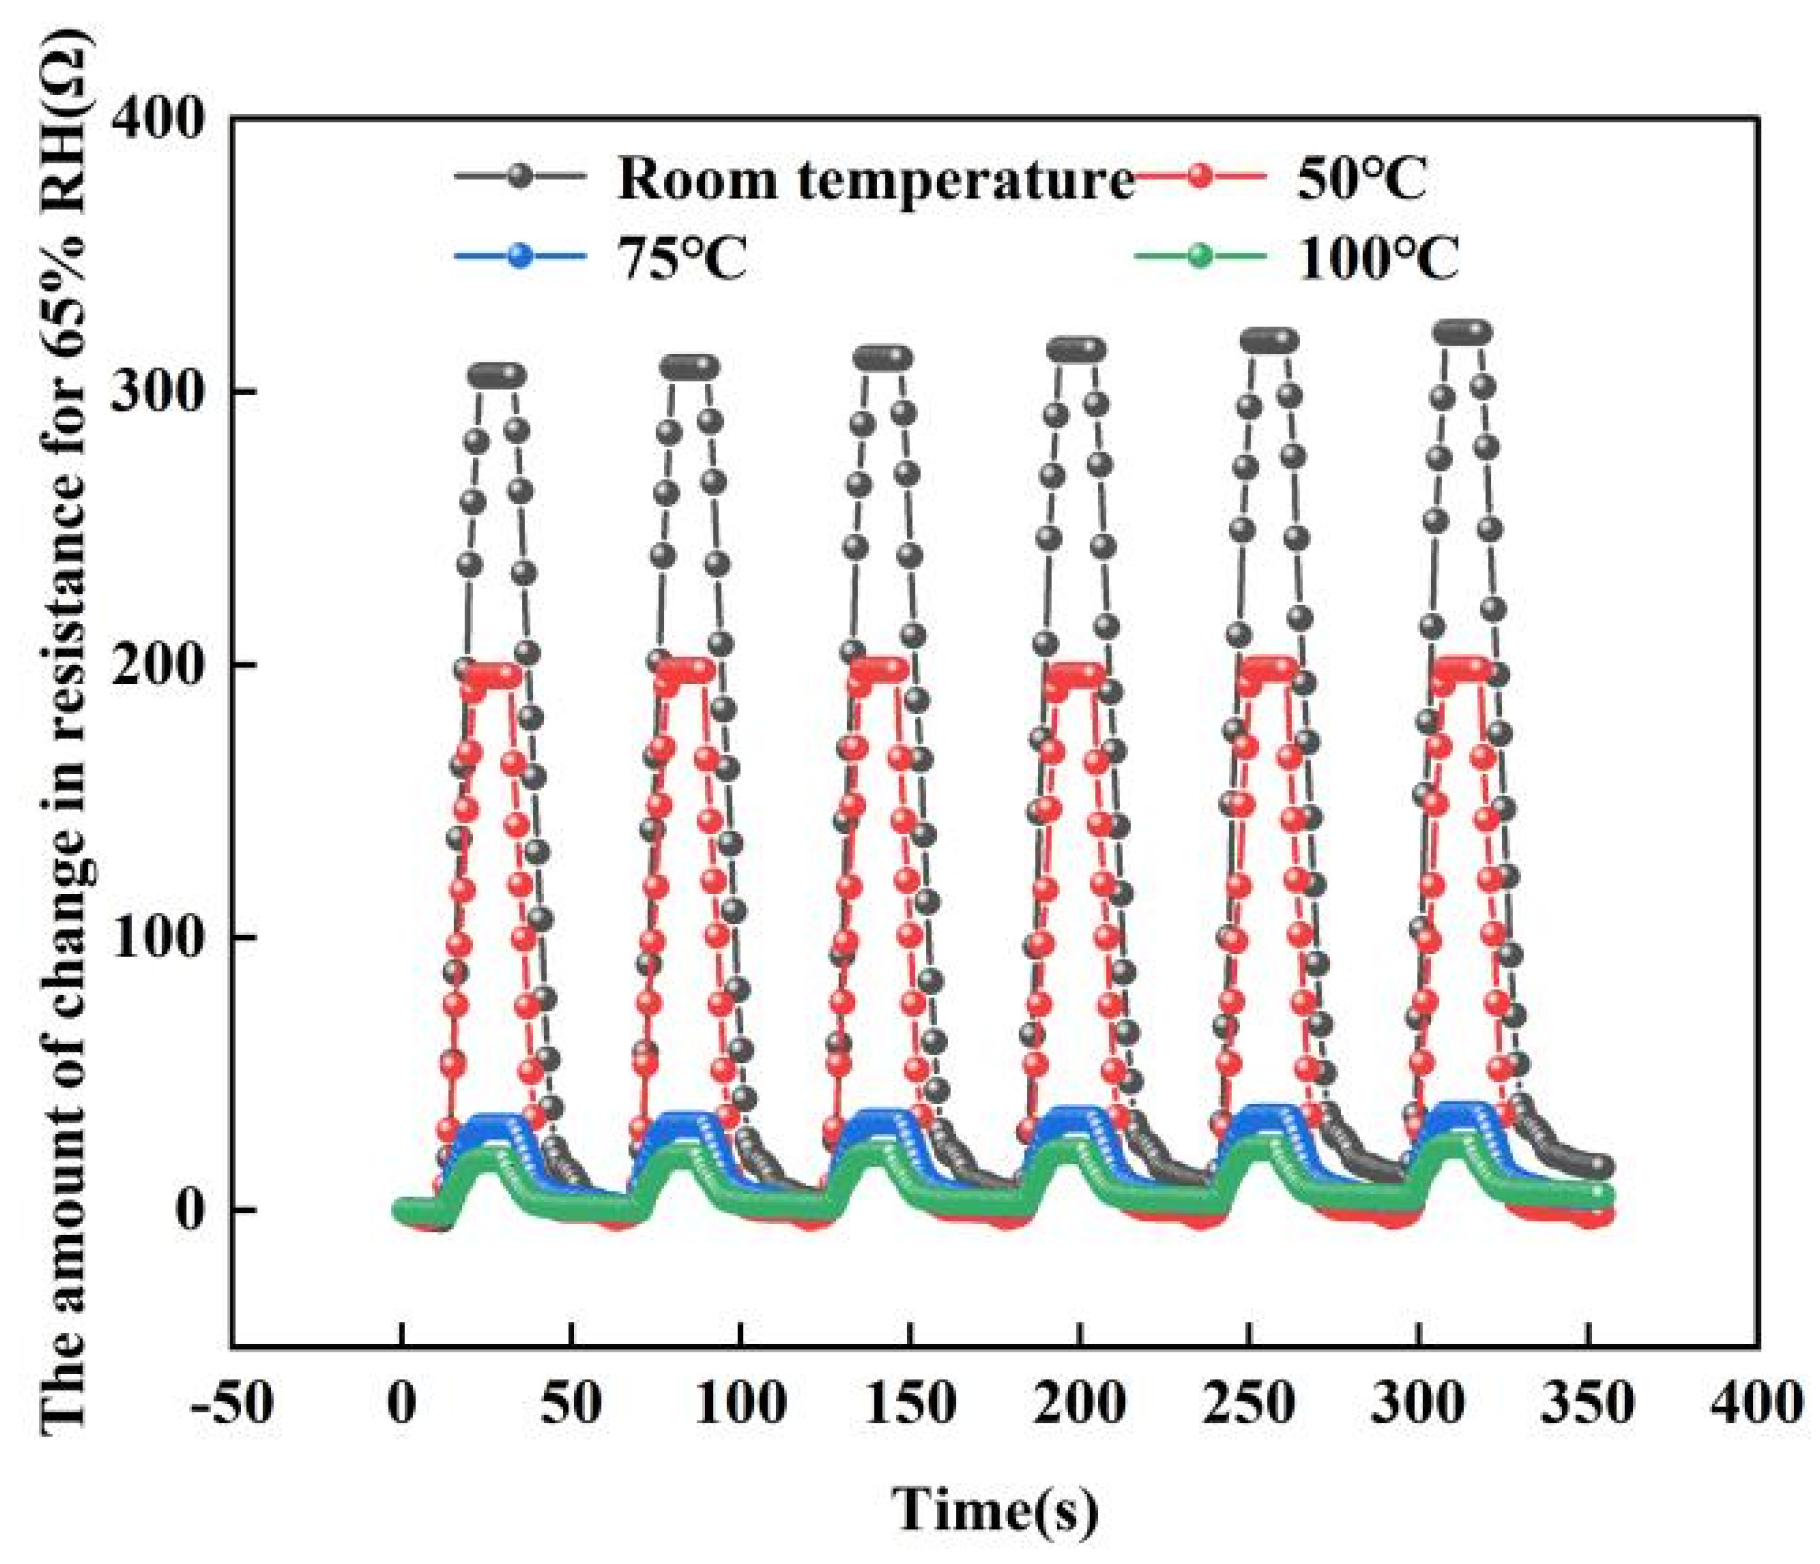
3.4. The Repeatability Test
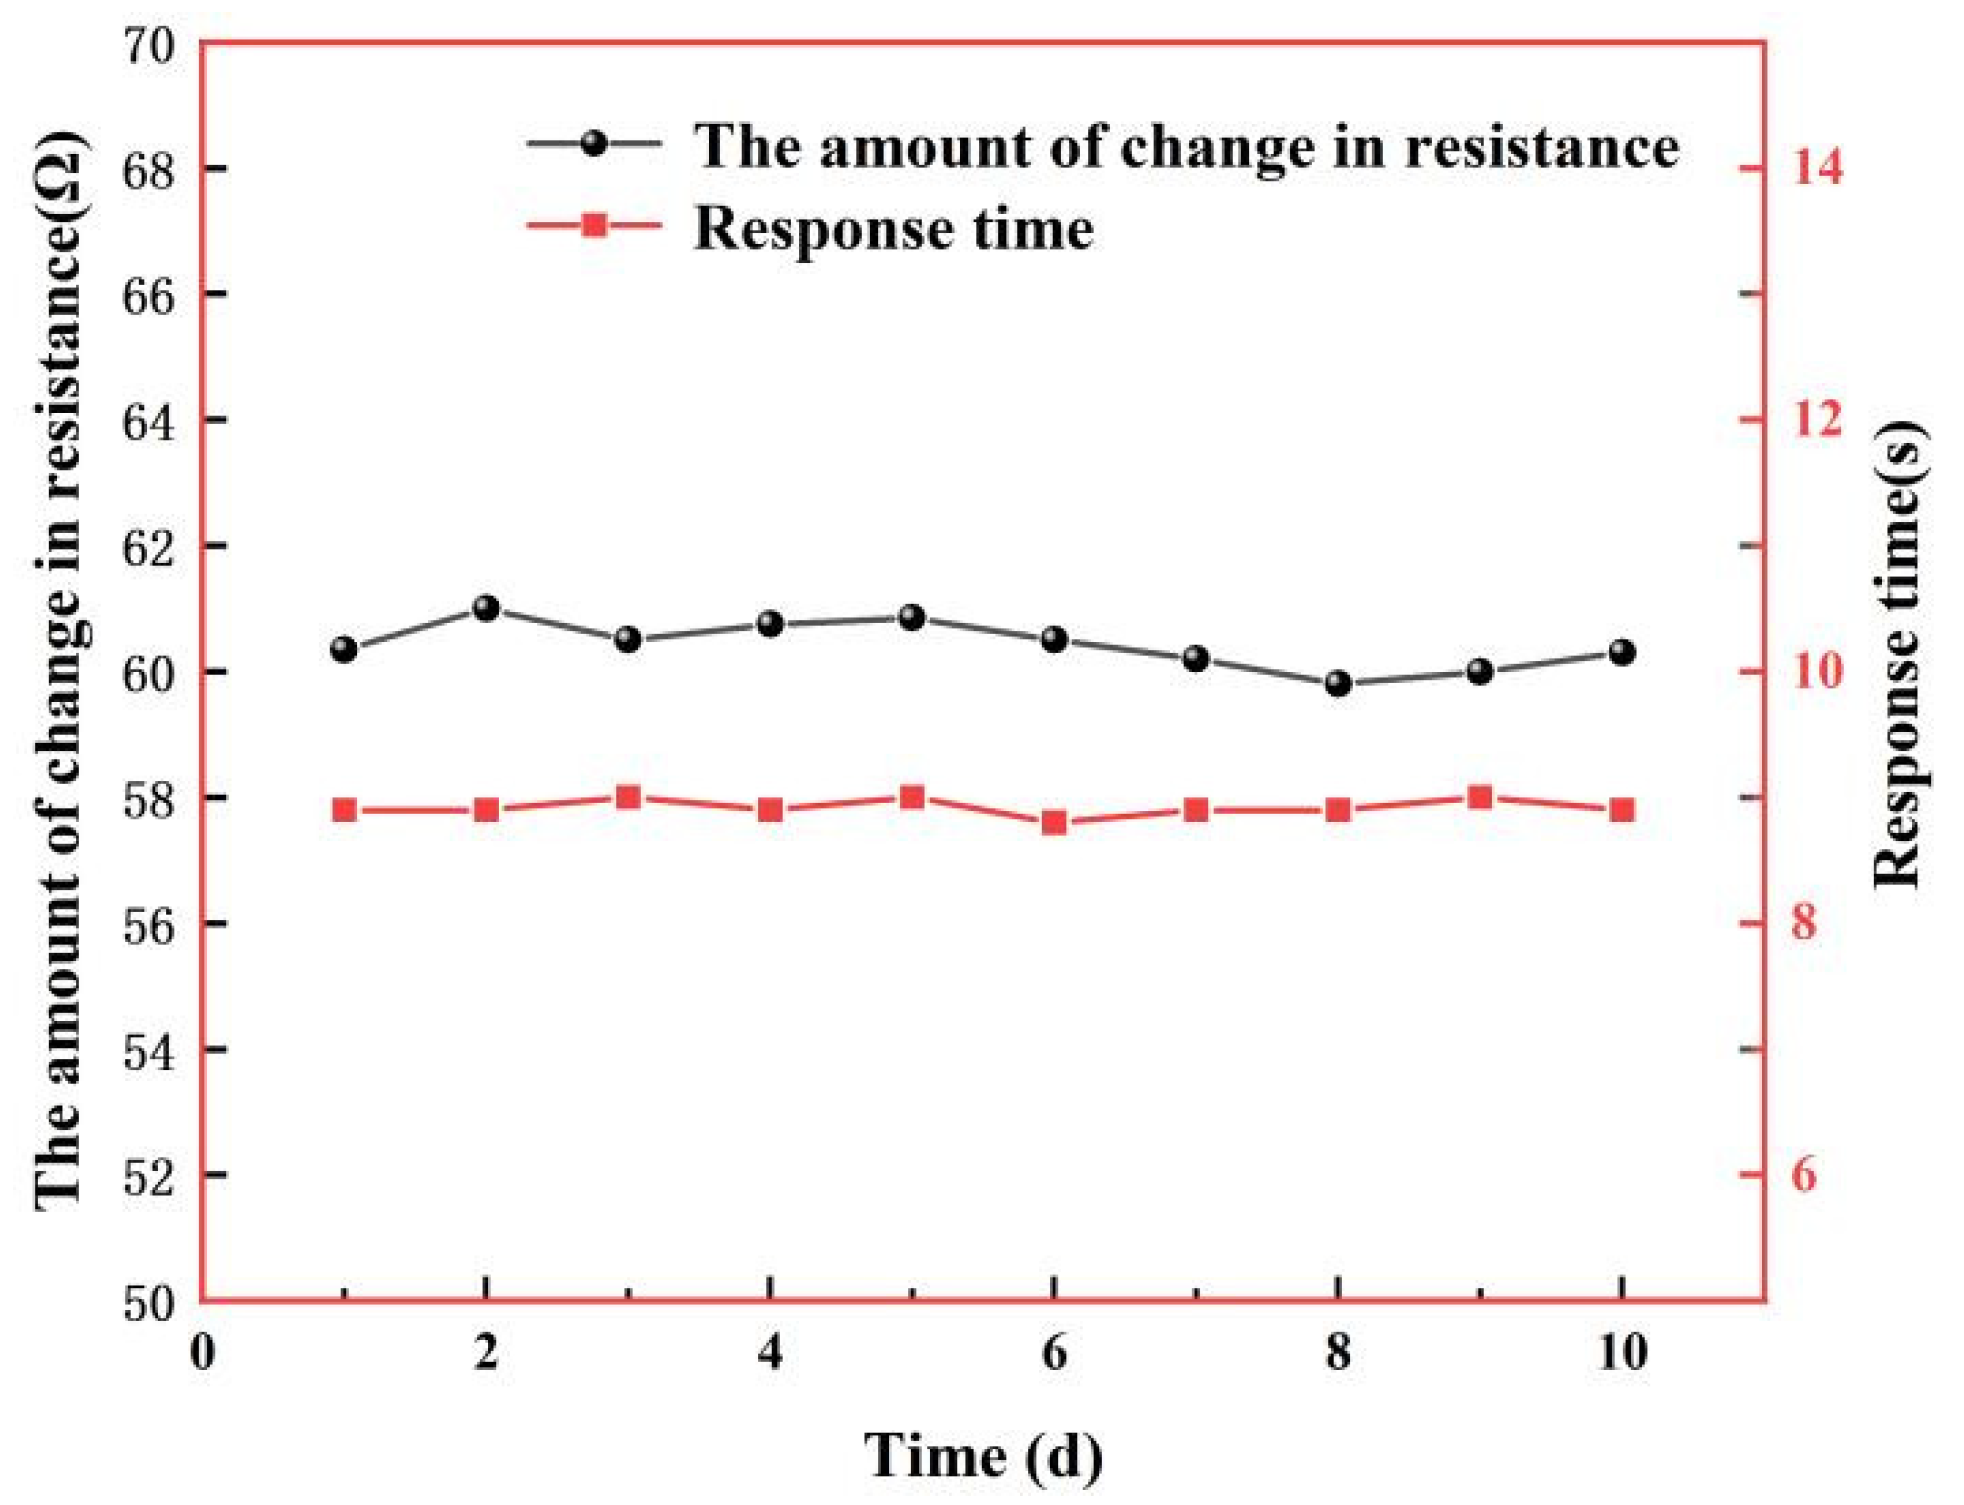
3.5. The Stability Test
3.6. Comparted with the Recently Published Papers on Humidity Sensors
4. Summary
Author Contributions
Funding
Conflicts of Interest
References
- Farahani, H.; Wagiran, R.; Hamidon, M.N. Humidity sensors principle, mechanism, and fabrication technologies: A comprehensive review. Sensors 2014, 14, 7881–7939. [Google Scholar] [PubMed]
- Tellis, J.C.; Strulson, C.A.; Myers, M.M.; Kneas, K.A. Relative humidity sensors based on an environment-sensitive fluorophore in hydrogel films. Anal. Chem. 2011, 83, 928–932. [Google Scholar] [PubMed]
- Dubey, C.; Kumar, B. Organic humidity sensors with different materials and its application in environment monitoring. In Proceedings of the 2018 5th IEEE Uttar Pradesh Section International Conference on Electrical, Electronics and Computer Engineering (UPCON), Gorakhpur, India, 2–4 November 2018; pp. 1–6. [Google Scholar]
- Traversa, E. Ceramic sensors for humidity detection: The state-of-the-art and future developments. Sens. Actuators B Chem. 1995, 23, 135–156. [Google Scholar] [CrossRef]
- Laville, C.; Deletage, J.Y.; Pellet, C. Humidity sensors for a pulmonary function diagnostic microsystem. Sens. Actuators B Chem. 2001, 76, 304–309. [Google Scholar] [CrossRef]
- Buvailo, A.; Xing, Y.; Hines, J.; Borguet, E. Thin polymer film based rapid surface acoustic wave humidity sensors. Sens. Actuators B Chem. 2011, 156, 444–449. [Google Scholar] [CrossRef]
- Caliendo, C.; Verona, E.; Anisimkin, V.I. Surface acoustic wave humidity sensors: A comparison between different types of sensitive membrane. Smart Mater. Struct. 1997, 6, 707. [Google Scholar] [CrossRef]
- Hu, W.; Chen, S.; Zhou, B.; Liu, L.; Ding, B.; Wang, H. Highly stable and sensitive humidity sensors based on quartz crystal microbalance coated with bacterial cellulose membrane. Sens. Actuators B Chem. 2011, 159, 301–306. [Google Scholar] [CrossRef]
- Consales, M.; Buosciolo, A.; Cutolo, A.; Breglio, G.; Irace, A.; Buontempo, S.; Petagna, P.; Giordano, M.; Cusano, A. Fiber optic humidity sensors for high-energy physics applications at CERN. Sens. Actuators B Chem. 2011, 159, 66–74. [Google Scholar] [CrossRef]
- Reverter, F.; Casas, O. Direct interface circuit for capacitive humidity sensors. Sens. Actuators A Phys. 2008, 143, 315–322. [Google Scholar] [CrossRef]
- Harrey, P.M.; Ramsey, B.J.; Evans, P.S.A.; Harrison, D.J. Capacitive-type humidity sensors fabricated using the offset lithographic printing process. Sens. Actuators B Chem. 2002, 87, 226–232. [Google Scholar] [CrossRef]
- Rittersma, Z.M. Recent achievements in miniaturised humidity sensors—A review of transduction techniques. Sens. Actuators A Phys. 2002, 96, 196–210. [Google Scholar] [CrossRef]
- Popov, V.I.; Nikolaev, D.V.; Timofeev, V.B.; Smagulova, S.A.; Antonova, I.V. Graphene-based humidity sensors: The origin of alternating resistance change. Nanotechnology 2017, 28, 355501. [Google Scholar] [CrossRef] [PubMed]
- Lou, C.; Hou, K.; Zhu, W.; Wang, X.; Yang, X.; Dong, R.; Chen, H.; Guo, L.; Liu, X. Human respiratory monitoring based on Schottky resistance humidity sensors. Materials 2020, 13, 430. [Google Scholar] [CrossRef] [PubMed]
- Zhang, Y.; Pan, X.; Wang, Z.; Hu, Y.; Zhou, X.; Hu, Z.; Gu, H. Fast and highly sensitive humidity sensors based on NaNbO3 nanofibers. RSC Adv. 2015, 5, 20453–20458. [Google Scholar] [CrossRef]
- Chen, G.; Shi, M.; Mao, H. Capacitive humidity sensor based on nano-forest. Micro-Nano Electron. Technol. 2020, 57, 462–467. [Google Scholar]
- Fratoddi, I.; Bearzotti, A.; Venditti, I.; Cametti, C.; Russo, M. Role of nanostructured polymers on the improvement of electrical response-based relative humidity sensors. Sens. Actuators B Chem. 2016, 225, 96–108. [Google Scholar] [CrossRef]
- Blank, T.A.; Eksperiandova, L.P.; Belikov, K.N. Recent trends of ceramic humidity sensors development: A review. Sens. Actuators B Chem. 2016, 228, 416–442. [Google Scholar] [CrossRef]
- Velumani, M.; Meher, S.R.; Alex, Z.C. Composite metal oxide thin film based impedometric humidity sensors. Sens. Actuators B Chem. 2019, 301, 127084. [Google Scholar] [CrossRef]
- Bannov, A.G.; Popov, M.V.; Brester, A.E.; Kurmashov, P.B. Recent advances in ammonia gas sensors based on carbon nanomaterials. Micromachines 2021, 12, 186. [Google Scholar] [CrossRef] [PubMed]
- Pang, Y.; Jian, J.; Tu, T.; Yang, Z.; Ling, J.; Li, Y.; Wang, X.; Qiao, Y.; Tian, H.; Yang, Y.; et al. Wearable humidity sensor based on porous graphene network for respiration monitoring. Biosens. Bioelectron. 2018, 116, 123–129. [Google Scholar] [CrossRef]
- Zhang, D.; Chang, H.; Li, P.; Liu, R.; Xue, Q. Fabrication and characterization of an ultrasensitive humidity sensor based on metal oxide/graphene hybrid nanocomposite. Sens. Actuators B Chem. 2016, 225, 233–240. [Google Scholar] [CrossRef]
- Borini, S.; White, R.; Wei, D.; Astley, M.; Haque, S.; Spigone, E.; Harris, N.; Kivioja, J.; Ryhänen, T. Ultrafast graphene oxide humidity sensors. ACS Nano 2013, 7, 11166–11173. [Google Scholar] [CrossRef] [PubMed]
- Kim, Y.H.; Kim, S.J.; Kim, Y.-J.; Shim, Y.-S.; Kim, S.Y.; Hong, B.H.; Jang, H.W. Self-activated transparent all-graphene gas sensor with endurance to humidity and mechanical bending. ACS Nano 2015, 9, 10453–10460. [Google Scholar] [CrossRef] [PubMed]
- Bagri, A.; Mattevi, C.; Acik, M.; Chabal, Y.J.; Chhowalla, M.; Shenoy, V.B. Structural evolution during the reduction of chemically derived graphene oxide. Nat. Chem. 2010, 2, 581–587. [Google Scholar] [CrossRef] [PubMed]
- Novoselov, K.S.; Geim, A.K.; Morozov, S.V.; Jiang, D.; Zhang, Y.; Dubonos, S.V.; Grigorieva, I.V.; Firsov, A.A. Electric field effect in atomically thin carbon films. Science 2004, 306, 666–669. [Google Scholar] [CrossRef]
- Lv, C.; Hu, C.; Luo, J.; Liu, S.; Qiao, Y.; Zhang, Z.; Song, J.; Shi, Y.; Cai, J.; Watanabe, A. Recent advances in graphene-based humidity sensors. Nanomaterials 2019, 9, 422. [Google Scholar] [CrossRef] [PubMed]
- Hu, H.; Yang, X.; Guo, X.; Khaliji, K.; Biswas, S.R.; De Abajo, F.J.G.; Low, T.; Sun, Z.; Dai, Q. Gas identification with graphene plasmons. Nat. Commun. 2019, 10, 1131. [Google Scholar] [CrossRef] [PubMed]
- Los, J.H.; Zakharchenko, K.V.; Katsnelson, M.I.; Fasolino, A. Melting temperature of graphene. Phys. Rev. B 2015, 91, 045415. [Google Scholar] [CrossRef]
- Toloman, D.; Popa, A.; Stan, M.; Socaci, C.; Biris, A.; Katona, G.; Tudorache, F.; Petrila, I.; Iacomi, F. Reduced graphene oxide decorated with Fe doped SnO2 nanoparticles for humidity sensor. Appl. Surf. Sci. 2017, 402, 410–417. [Google Scholar] [CrossRef]
- Shojaee, M.; Nasresfahani, S.; Dordane, M.K.; Sheikhi, M.H. Fully integrated wearable humidity sensor based on hydrothermally synthesized partially reduced graphene oxide. Sens. Actuators A Phys. 2018, 279, 448–456. [Google Scholar] [CrossRef]
- Xing, Z.; Zheng, Y.; Yan, Z.; Feng, Y.; Xiao, Y.; Yu, J.; Guan, H.; Luo, Y.; Wang, Z.; Zhong, Y.; et al. High-sensitivity humidity sensing of microfiber coated with three-dimensional graphene network. Sens. Actuators B Chem. 2019, 281, 953–959. [Google Scholar] [CrossRef]
- Wu, J.; Xu, H.; Zhang, J. Application of Raman Spectroscopy in Characterization of Graphene Structure. Chin. J. Chem. 2014, 72, 301–318. [Google Scholar]
- Havener, R.W.; Ju, S.Y.; Brown, L.; Wang, Z.; Wojcik, M.; Ruiz-Vargas, C.S.; Park, J. High-throughput graphene imaging on arbitrary substrates with widefield Raman spectroscopy. ACS Nano 2012, 6, 373–380. [Google Scholar] [CrossRef] [PubMed]
- Wiederkehr, M.; Bousquet, R.; Ziemann, M.A.; Berger, A.; Schmid, S.M. 3-D assessment of peak-metamorphic conditions by Raman spectroscopy of carbonaceous material: An example from the margin of the Lepontine dome (Swiss Central Alps). Int. J. Earth Sci. 2011, 100, 1029–1063. [Google Scholar] [CrossRef][Green Version]
- Chen, H.; Mu, X.; Li, J.; Qin, Y.; Yan, L. A cationic fluorescent probe for highly selective detection of sodium dodecyl sulfate (SDS) by electrostatic and hydrophobic self-assembly. Anal. Methods 2021, 13, 3292–3296. [Google Scholar] [CrossRef]
- Tu, N.D.K.; Choi, J.; Park, C.R.; Kim, H. Remarkable Conversion Between n- and p-Type Reduced Graphene Oxide on Varying the Thermal Annealing Temperature. Chem. Mater. 2015, 27, 7362–7369. [Google Scholar] [CrossRef]
- Lu, G.; Ocola, L.E.; Chen, J. Gas detection using low-temperature reduced graphene oxide sheets. Appl. Phys. Lett. 2009, 94, 083111. [Google Scholar] [CrossRef]
- Ghosh, R.; Midya, A.; Santra, S.; Ray, S.K.; Guha, P.K. Humidity Sensing by Chemically Reduced Graphene Oxide; Springer International Publishing: Cham, Switzerland, 2014; pp. 699–701. [Google Scholar]
- Wang, S.; Chen, Z.; Umar, A.; Wang, Y.; Tian, T.; Shang, Y.; Fan, Y.; Qi, Q.; Xu, D. Supramolecularly modified graphene for ultrafast responsive and highly stable humidity sensor. J. Phys. Chem. C 2015, 119, 28640–28647. [Google Scholar] [CrossRef]
- Chen, C.; Wang, X.; Li, M.; Fan, Y.; Sun, R. Humidity sensor based on reduced graphene oxide/lignosulfonate composite thin-film. Sens. Actuators B Chem. 2018, 255, 1569–1576. [Google Scholar] [CrossRef]
- Haque, A.; Mamun, A.A.; Taufique, M.F.N.; Karnati, P.; Ghosh, K. Temperature Dependent Electrical Transport Properties of High Carrier Mobility Reduced Graphene Oxide Thin Film Devices. IEEE Trans. Semicond. Manuf. 2018, 31, 535–544. [Google Scholar] [CrossRef]
- Sehrawat, P.; Abid Islam, S.S.; Mishra, P. Reduced graphene oxide based temperature sensor: Extraordinary performance governed by lattice dynamics assisted carrier transport. Sens. Actuators 2018, 258, 424–435. [Google Scholar] [CrossRef]
- Kaiser, A.B.; Gómez-Navarro, C.; Sundaram, R.S.; Burghard, M.; Kern, K. Electrical Conduction Mechanism in Chemically Derived Graphene Monolayers. Nano Lett. 2009, 9, 1787–1792. [Google Scholar] [CrossRef] [PubMed]
- Saqib, M.; Khan, S.A.; Rehman, H.M.M.U.; Yang, Y.; Kim, S.; Rehman, M.M.; Kim, W.-Y. High-Performance Humidity Sensor Based on the Graphene Flower/Zinc Oxide Composite. Nanomaterials 2021, 11, 242. [Google Scholar] [CrossRef] [PubMed]
- Cai, C.; Zhao, W.; Yang, J.; Zhang, L. Sensitive and flexible humidity sensor based on sodium hyaluronate/MWCNTs composite film. Cellulose 2021, 28, 6361–6371. [Google Scholar] [CrossRef]
- Khan, S.A.; Saqib, M.; Rehman, M.M.; Rehman, H.M.M.U.; Rahman, S.A.; Yang, Y.; Kim, S.; Kim, W.-Y. A Full-Range Flexible and Printed Humidity Sensor Based on a Solution-Processed P(VDF-TrFE)/Graphene-Flower Composite. Nanomaterials 2021, 11, 1915. [Google Scholar] [CrossRef]
- Rehman, H.M.M.U.; Rehman, M.M.; Saqib, M.; Khan, S.A.; Khan, M.; Yang, Y.; Kim, S.; Rahman, S.A.; Kim, W.-Y. Highly Efficient and Wide Range Humidity Response of Biocompatible Egg White Thin Film. Nanomaterials 2021, 11, 1815. [Google Scholar] [CrossRef]
- Tang, K.; Chen, X.; Ding, X.; Yu, X.; Yu, X. MoS2/Graphene Oxide/C60-OH Nanostructures Deposited on a Quartz Crystal Microbalance Transducer for Humidity Sensing. ACS Appl. Nano Mater. 2021, 4, 10810–10818. [Google Scholar] [CrossRef]


| The Amount of IDE | The Length of IDE | The Width of IDE | The Distance between Interdigital |
|---|---|---|---|
| 5 | 520 μm | 30 μm | 30 μm |
| Active Material | Response Time (s) | Recovery Time (s) | Range | Average Sensitivity (X/% RH) | Reference |
|---|---|---|---|---|---|
| rGO-SDS | 9 | 10 | 25–95% | 1.0145 Ω/% RH | This Work |
| GrF/ZnO | 0.4 | 4 | 15–86% | 7.77 µA/% RH | [45] |
| sodium hyaluronate (SH)/multi-walled car-bon nanotubes | 0.32 | 0.27 | 11–98% | / | [46] |
| P(VDF-T rFE)/Graphene-Flower | 0.8 | 2.5 | 8–98% | 0.0558 pF/% RH | [47] |
| Biocompatible Egg White Thin Film | 1.2 | 1.7 | 10–85% | 50 kΩ/% RH | [48] |
| MoS2/Graphene Oxide/C60-OH Nanostructures | / | / | 11–97% | / | [49] |
Publisher’s Note: MDPI stays neutral with regard to jurisdictional claims in published maps and institutional affiliations. |
© 2022 by the authors. Licensee MDPI, Basel, Switzerland. This article is an open access article distributed under the terms and conditions of the Creative Commons Attribution (CC BY) license (https://creativecommons.org/licenses/by/4.0/).
Share and Cite
Lei, C.; Zhang, J.; Liang, T.; Liu, R.; Zhao, Z.; Xiong, J.; Yin, K. Humidity Sensor Based on rGO-SDS Composite Film. Micromachines 2022, 13, 504. https://doi.org/10.3390/mi13040504
Lei C, Zhang J, Liang T, Liu R, Zhao Z, Xiong J, Yin K. Humidity Sensor Based on rGO-SDS Composite Film. Micromachines. 2022; 13(4):504. https://doi.org/10.3390/mi13040504
Chicago/Turabian StyleLei, Cheng, Junna Zhang, Ting Liang, Ruifang Liu, Zhujie Zhao, Jijun Xiong, and Kai Yin. 2022. "Humidity Sensor Based on rGO-SDS Composite Film" Micromachines 13, no. 4: 504. https://doi.org/10.3390/mi13040504
APA StyleLei, C., Zhang, J., Liang, T., Liu, R., Zhao, Z., Xiong, J., & Yin, K. (2022). Humidity Sensor Based on rGO-SDS Composite Film. Micromachines, 13(4), 504. https://doi.org/10.3390/mi13040504