
Oocyte Penetration Speed Optimization Based on Intracellular Strain

 ,
,
Abstract
:1. Introduction
2. Materials and Methods
2.1. Oocyte Preparations
2.2. Activation of Oocytes
2.3. Intracellular Strain Calculation
2.4. Real-Time PCR
2.5. Statistical Analysis
3. Results
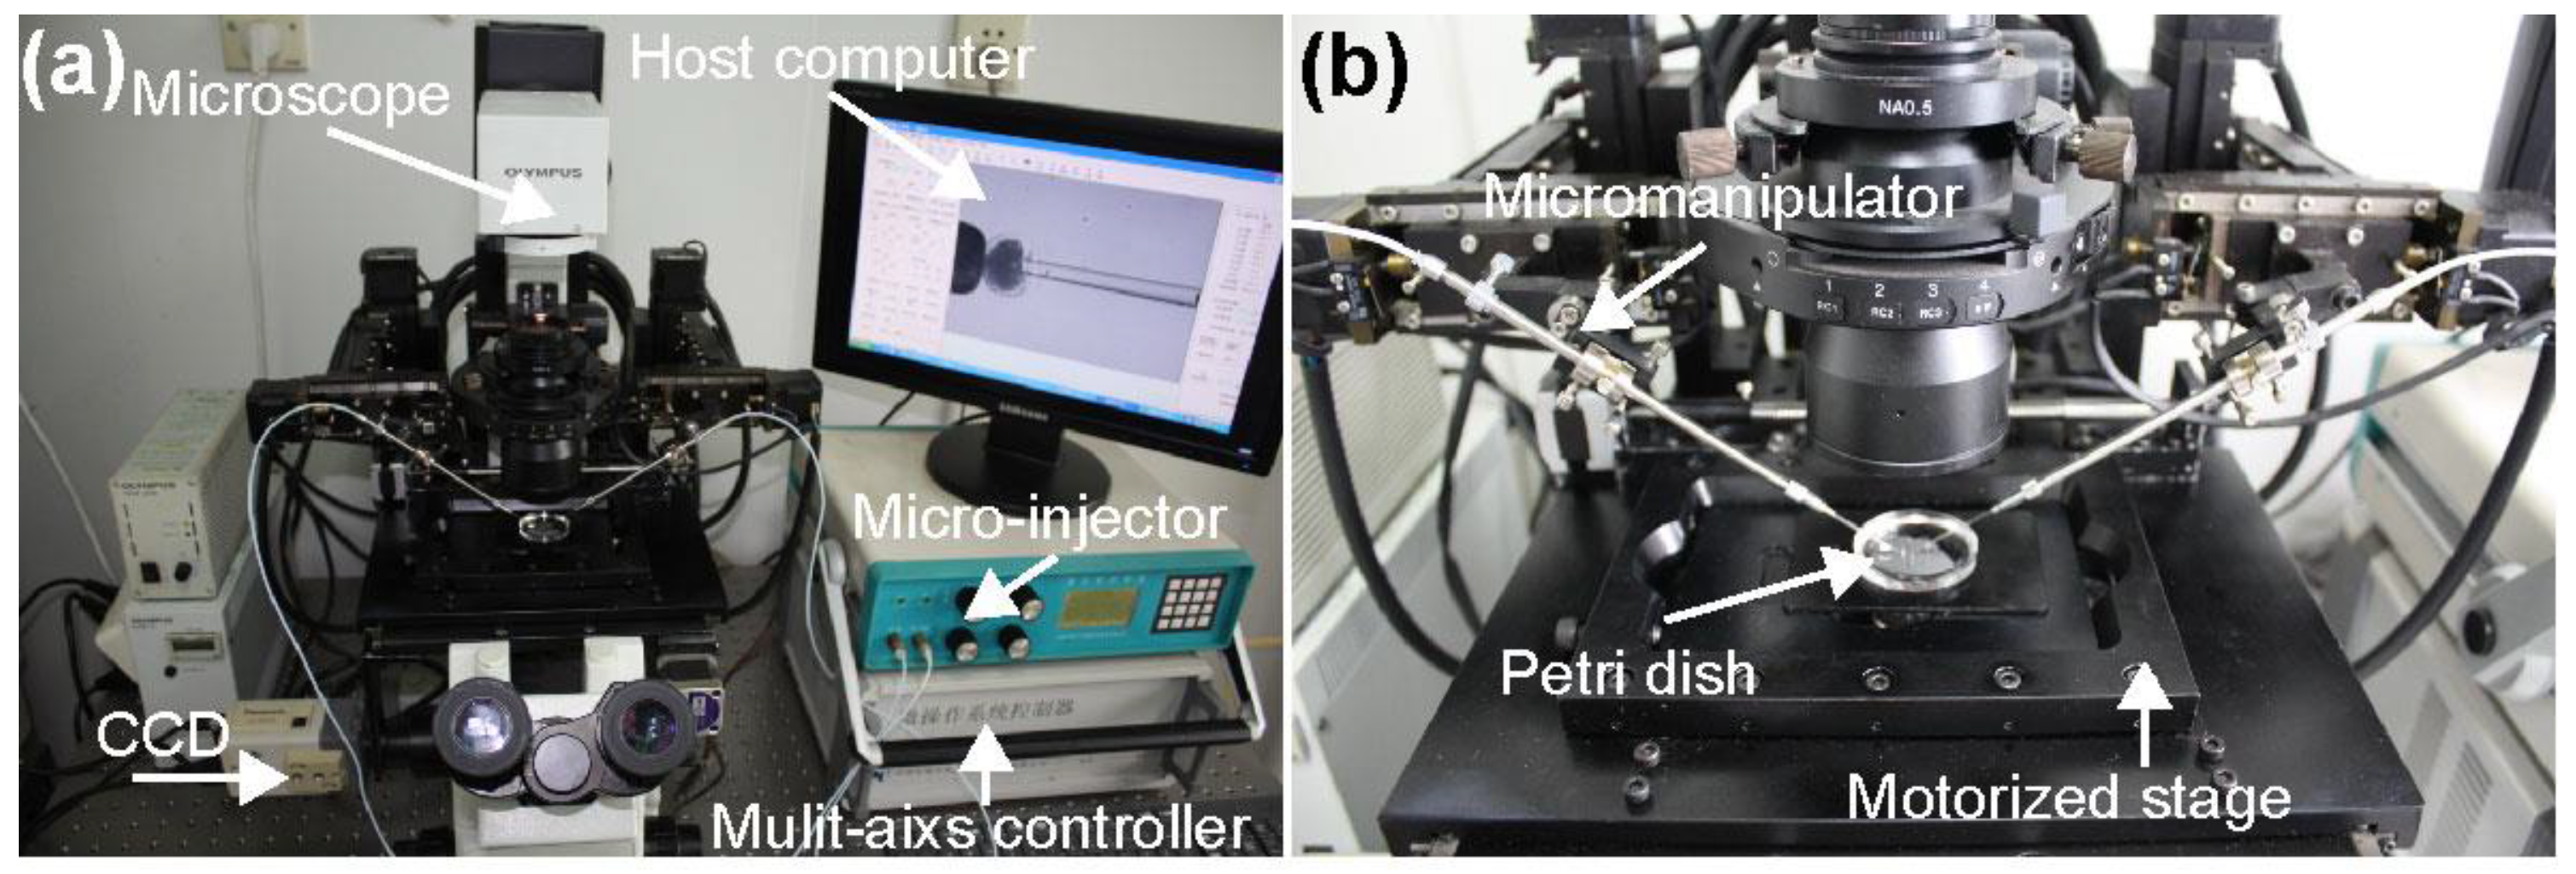
3.1. System Setup
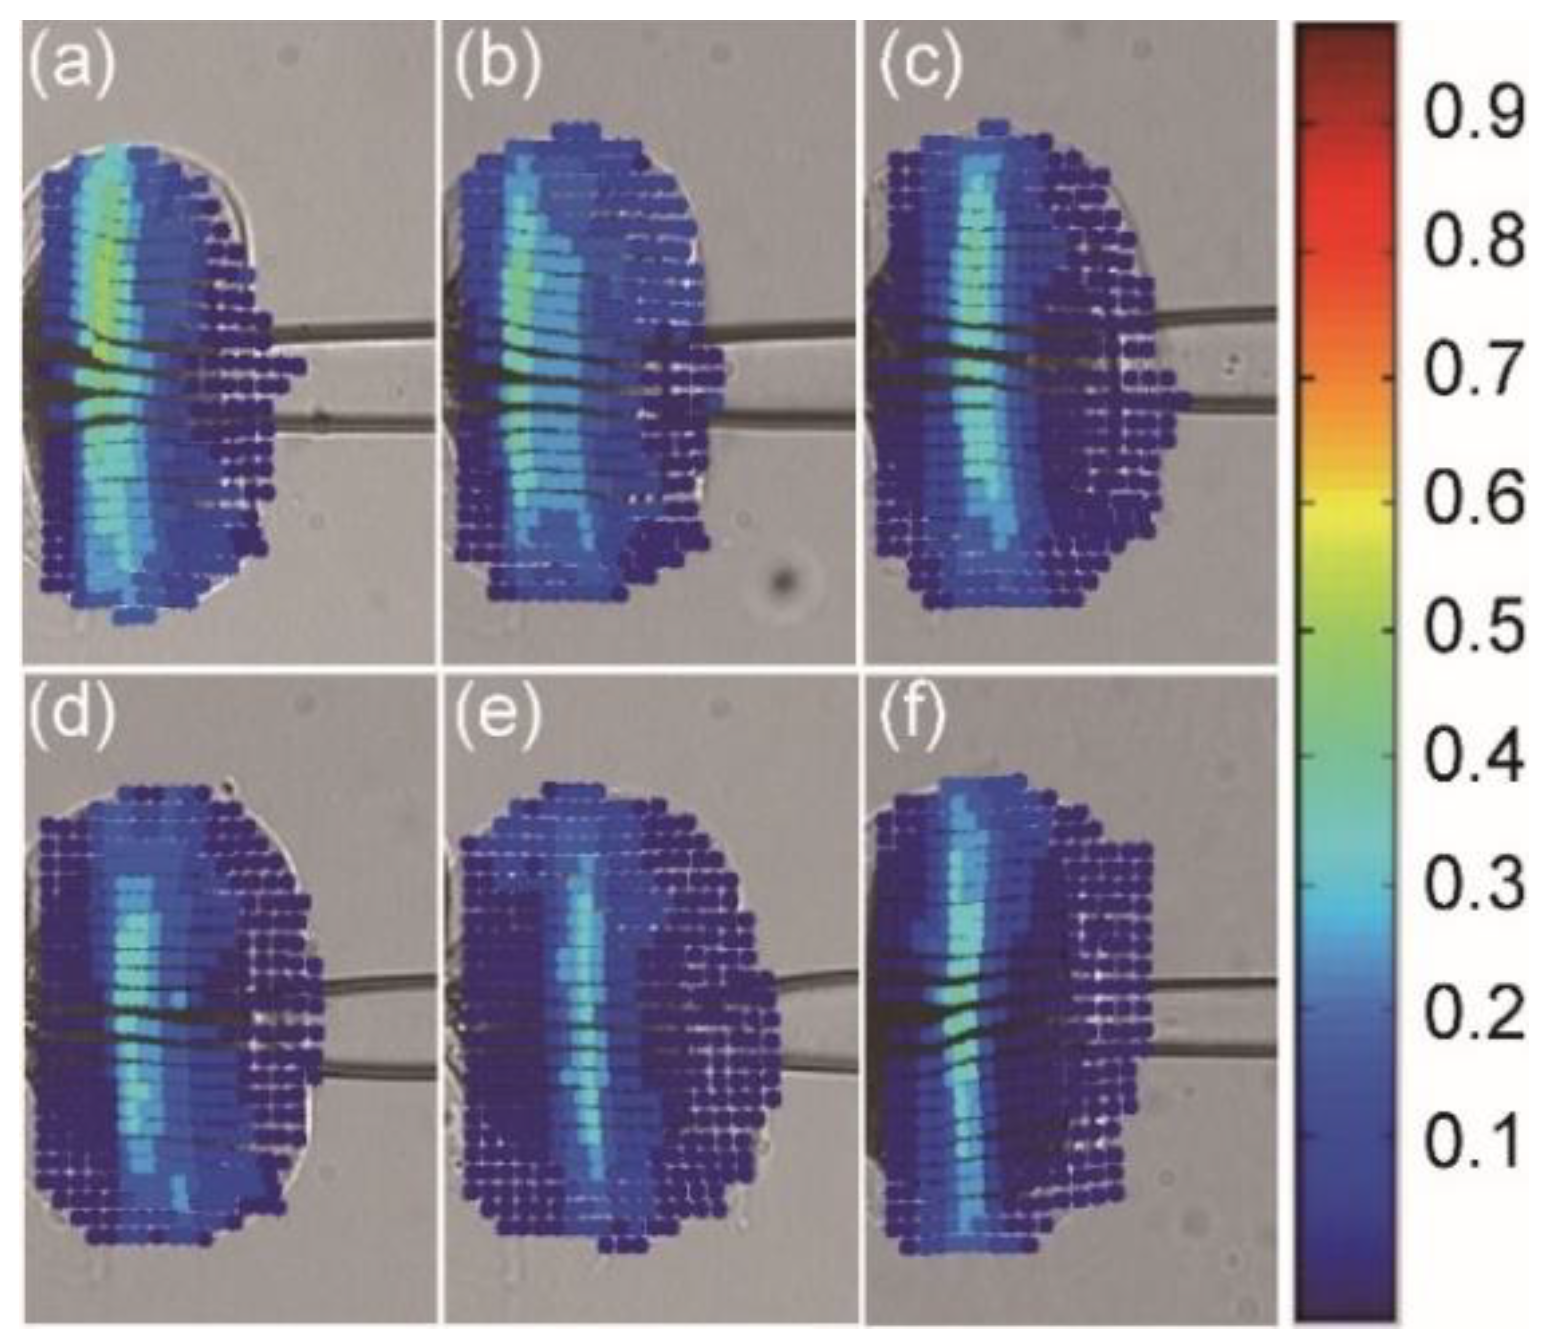
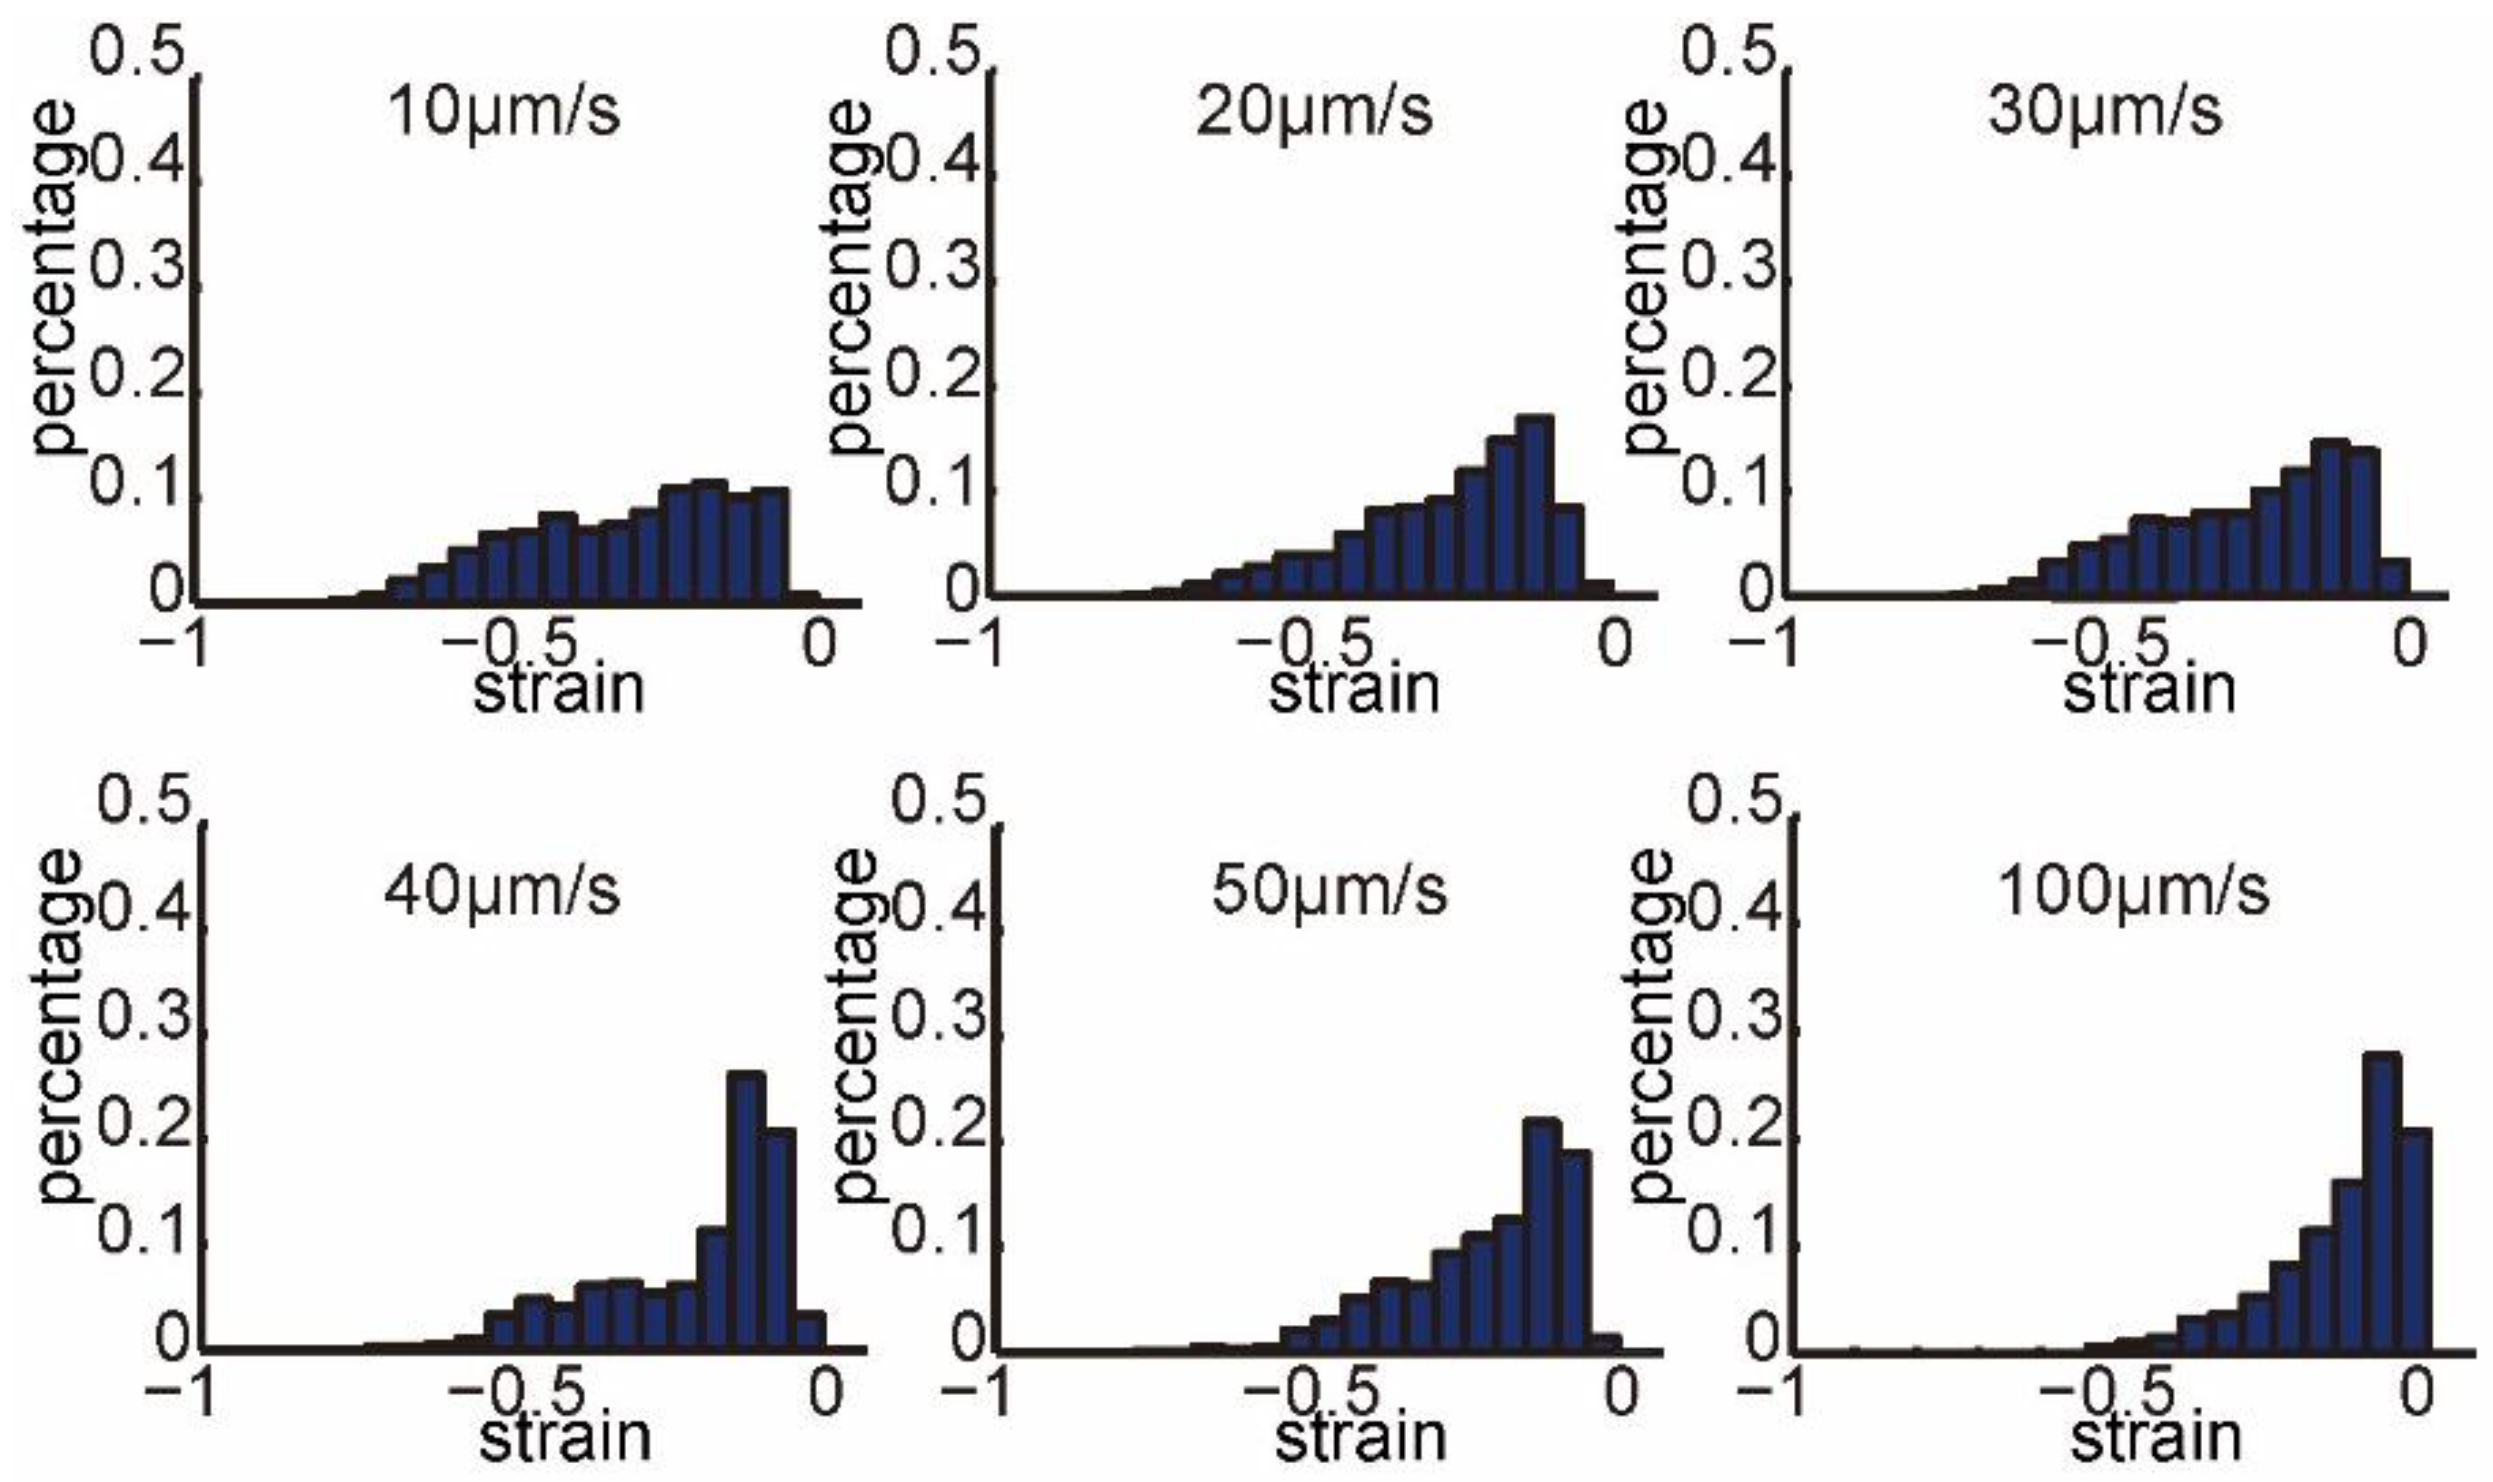
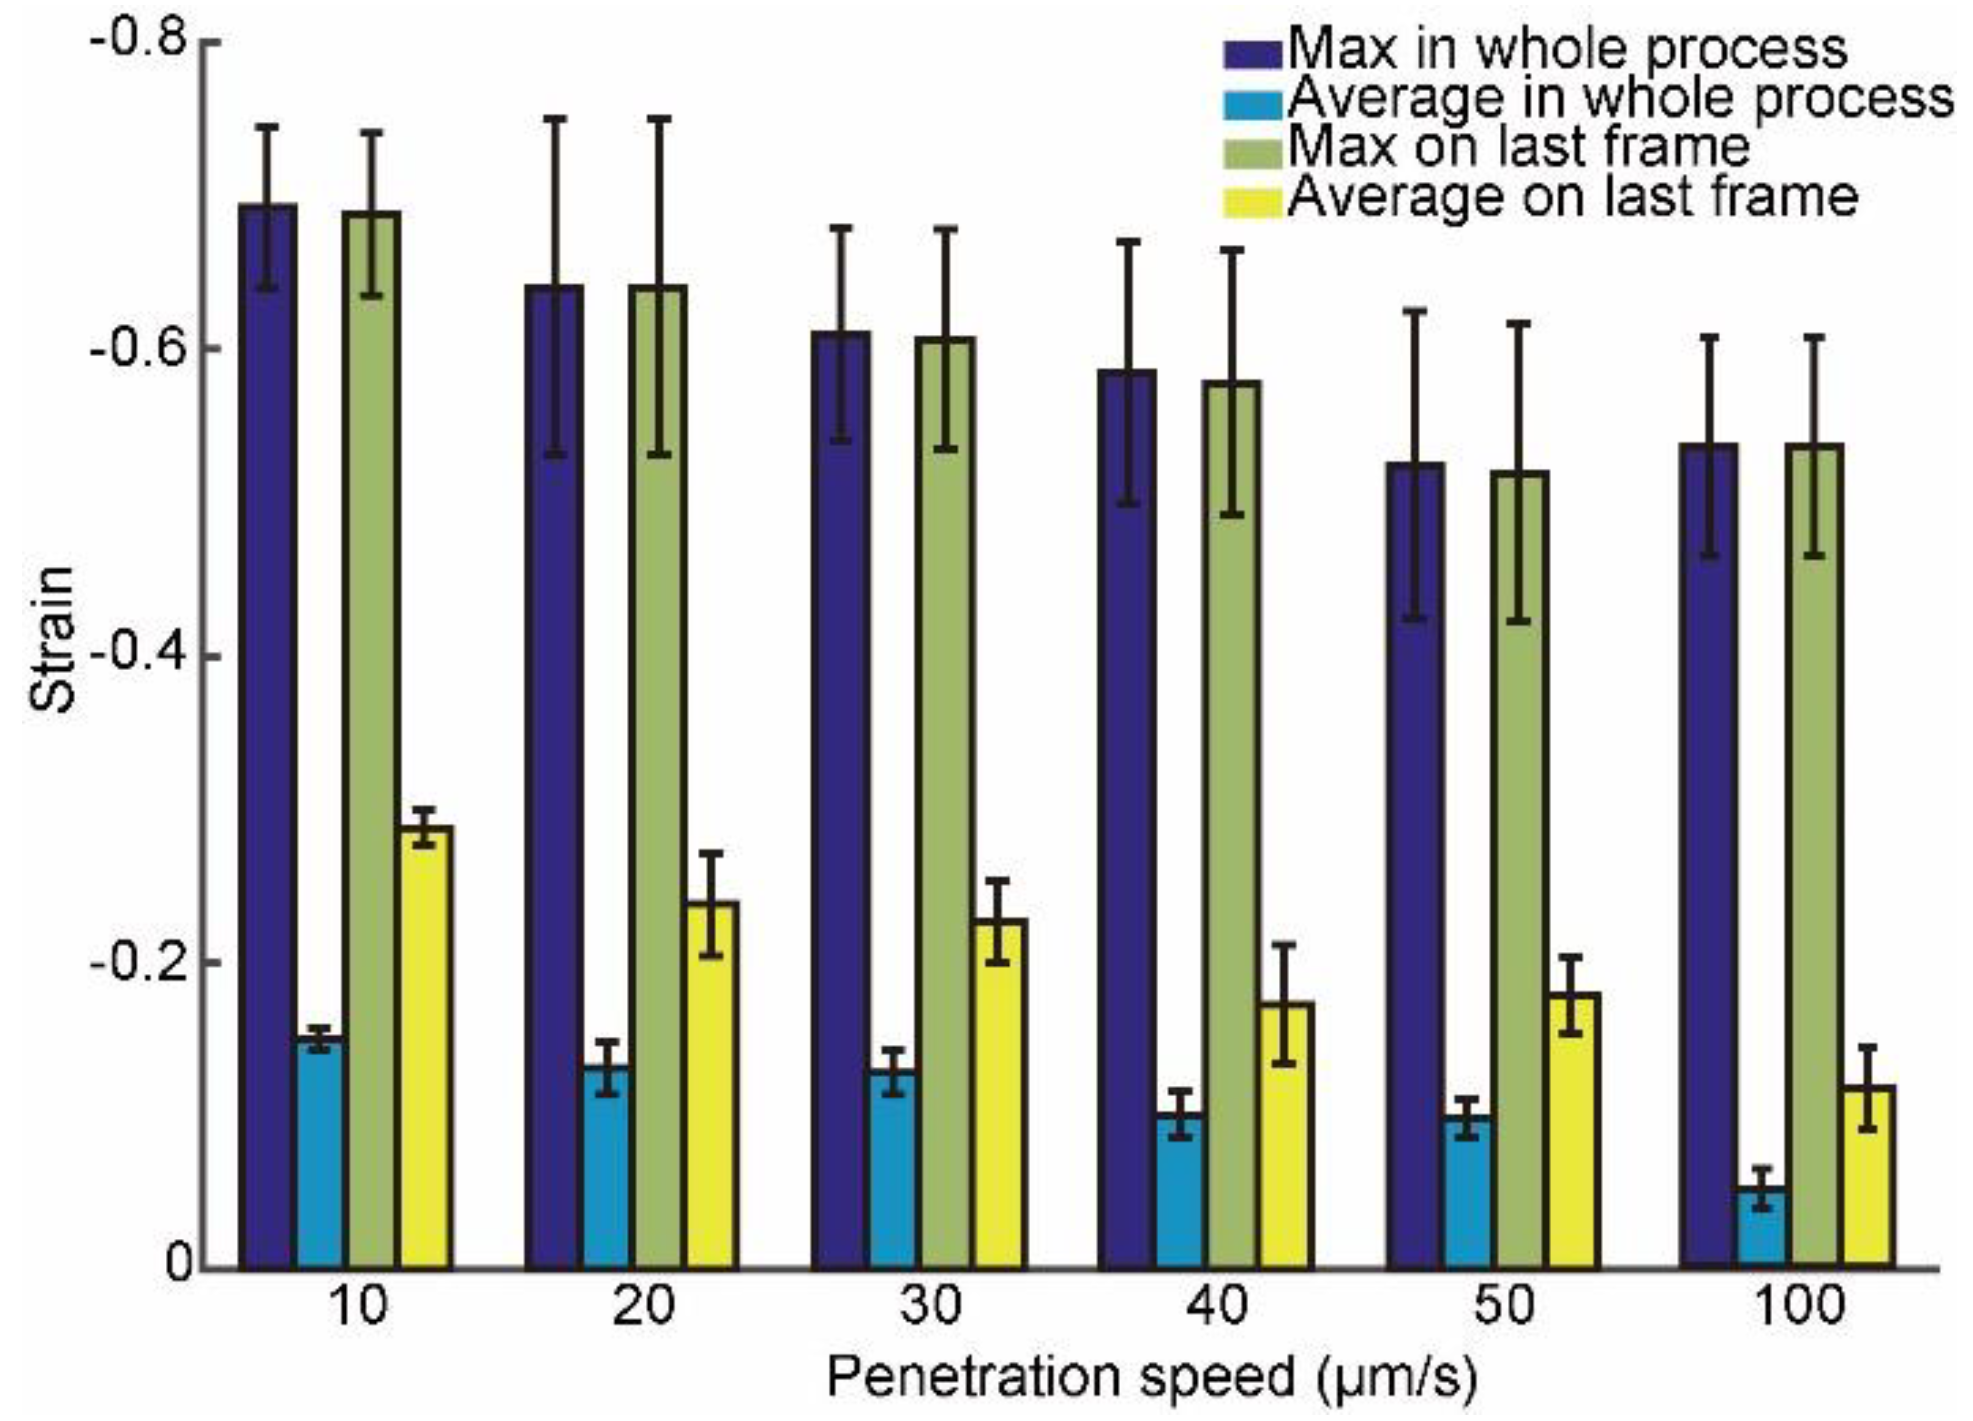
3.2. Intracellular Strain under Different Penetration Speeds
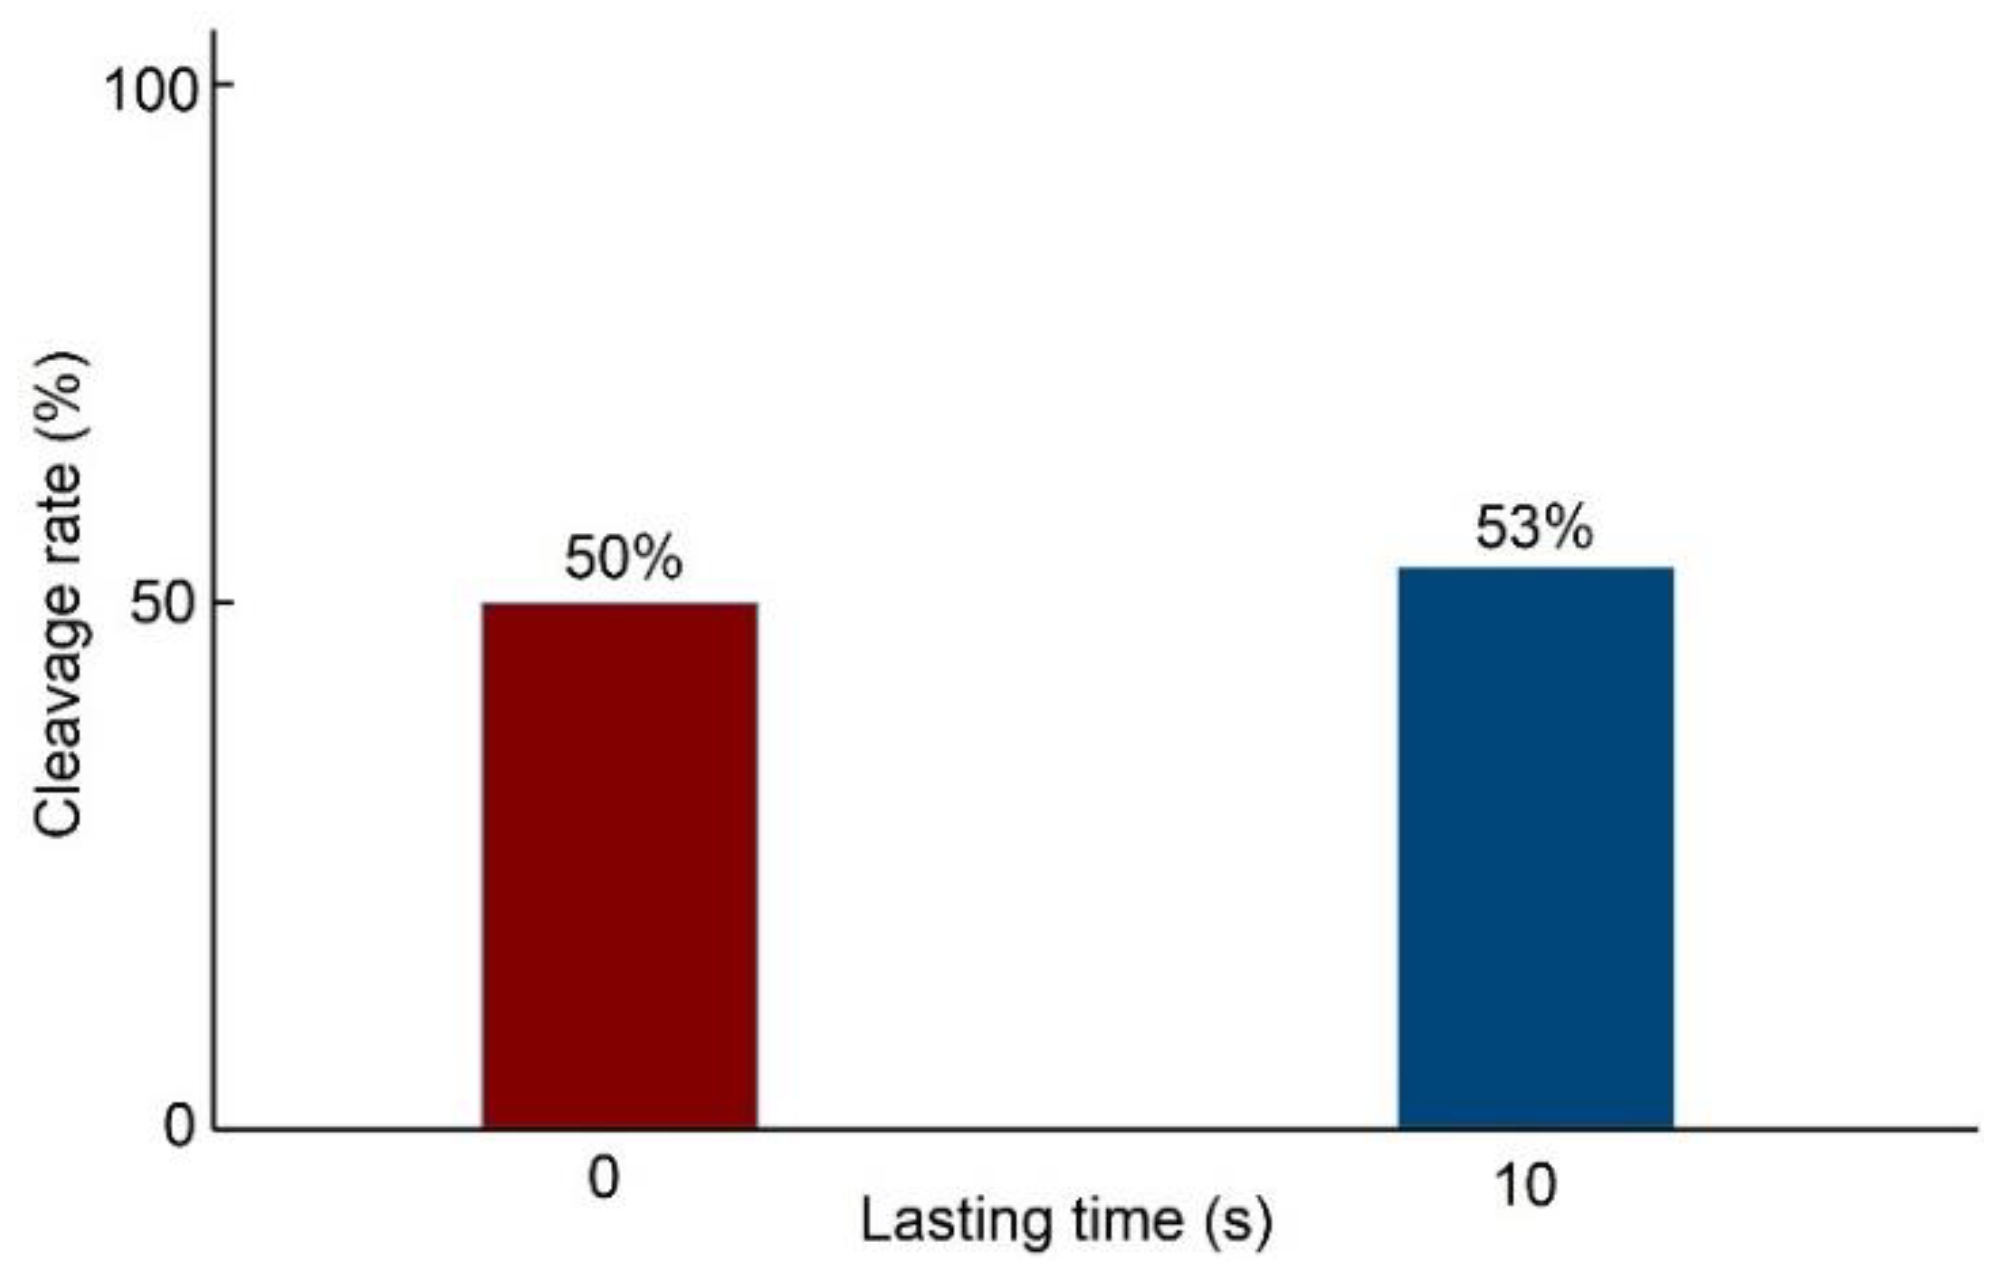
3.3. Cell Development Potential at Different Penetration Speeds
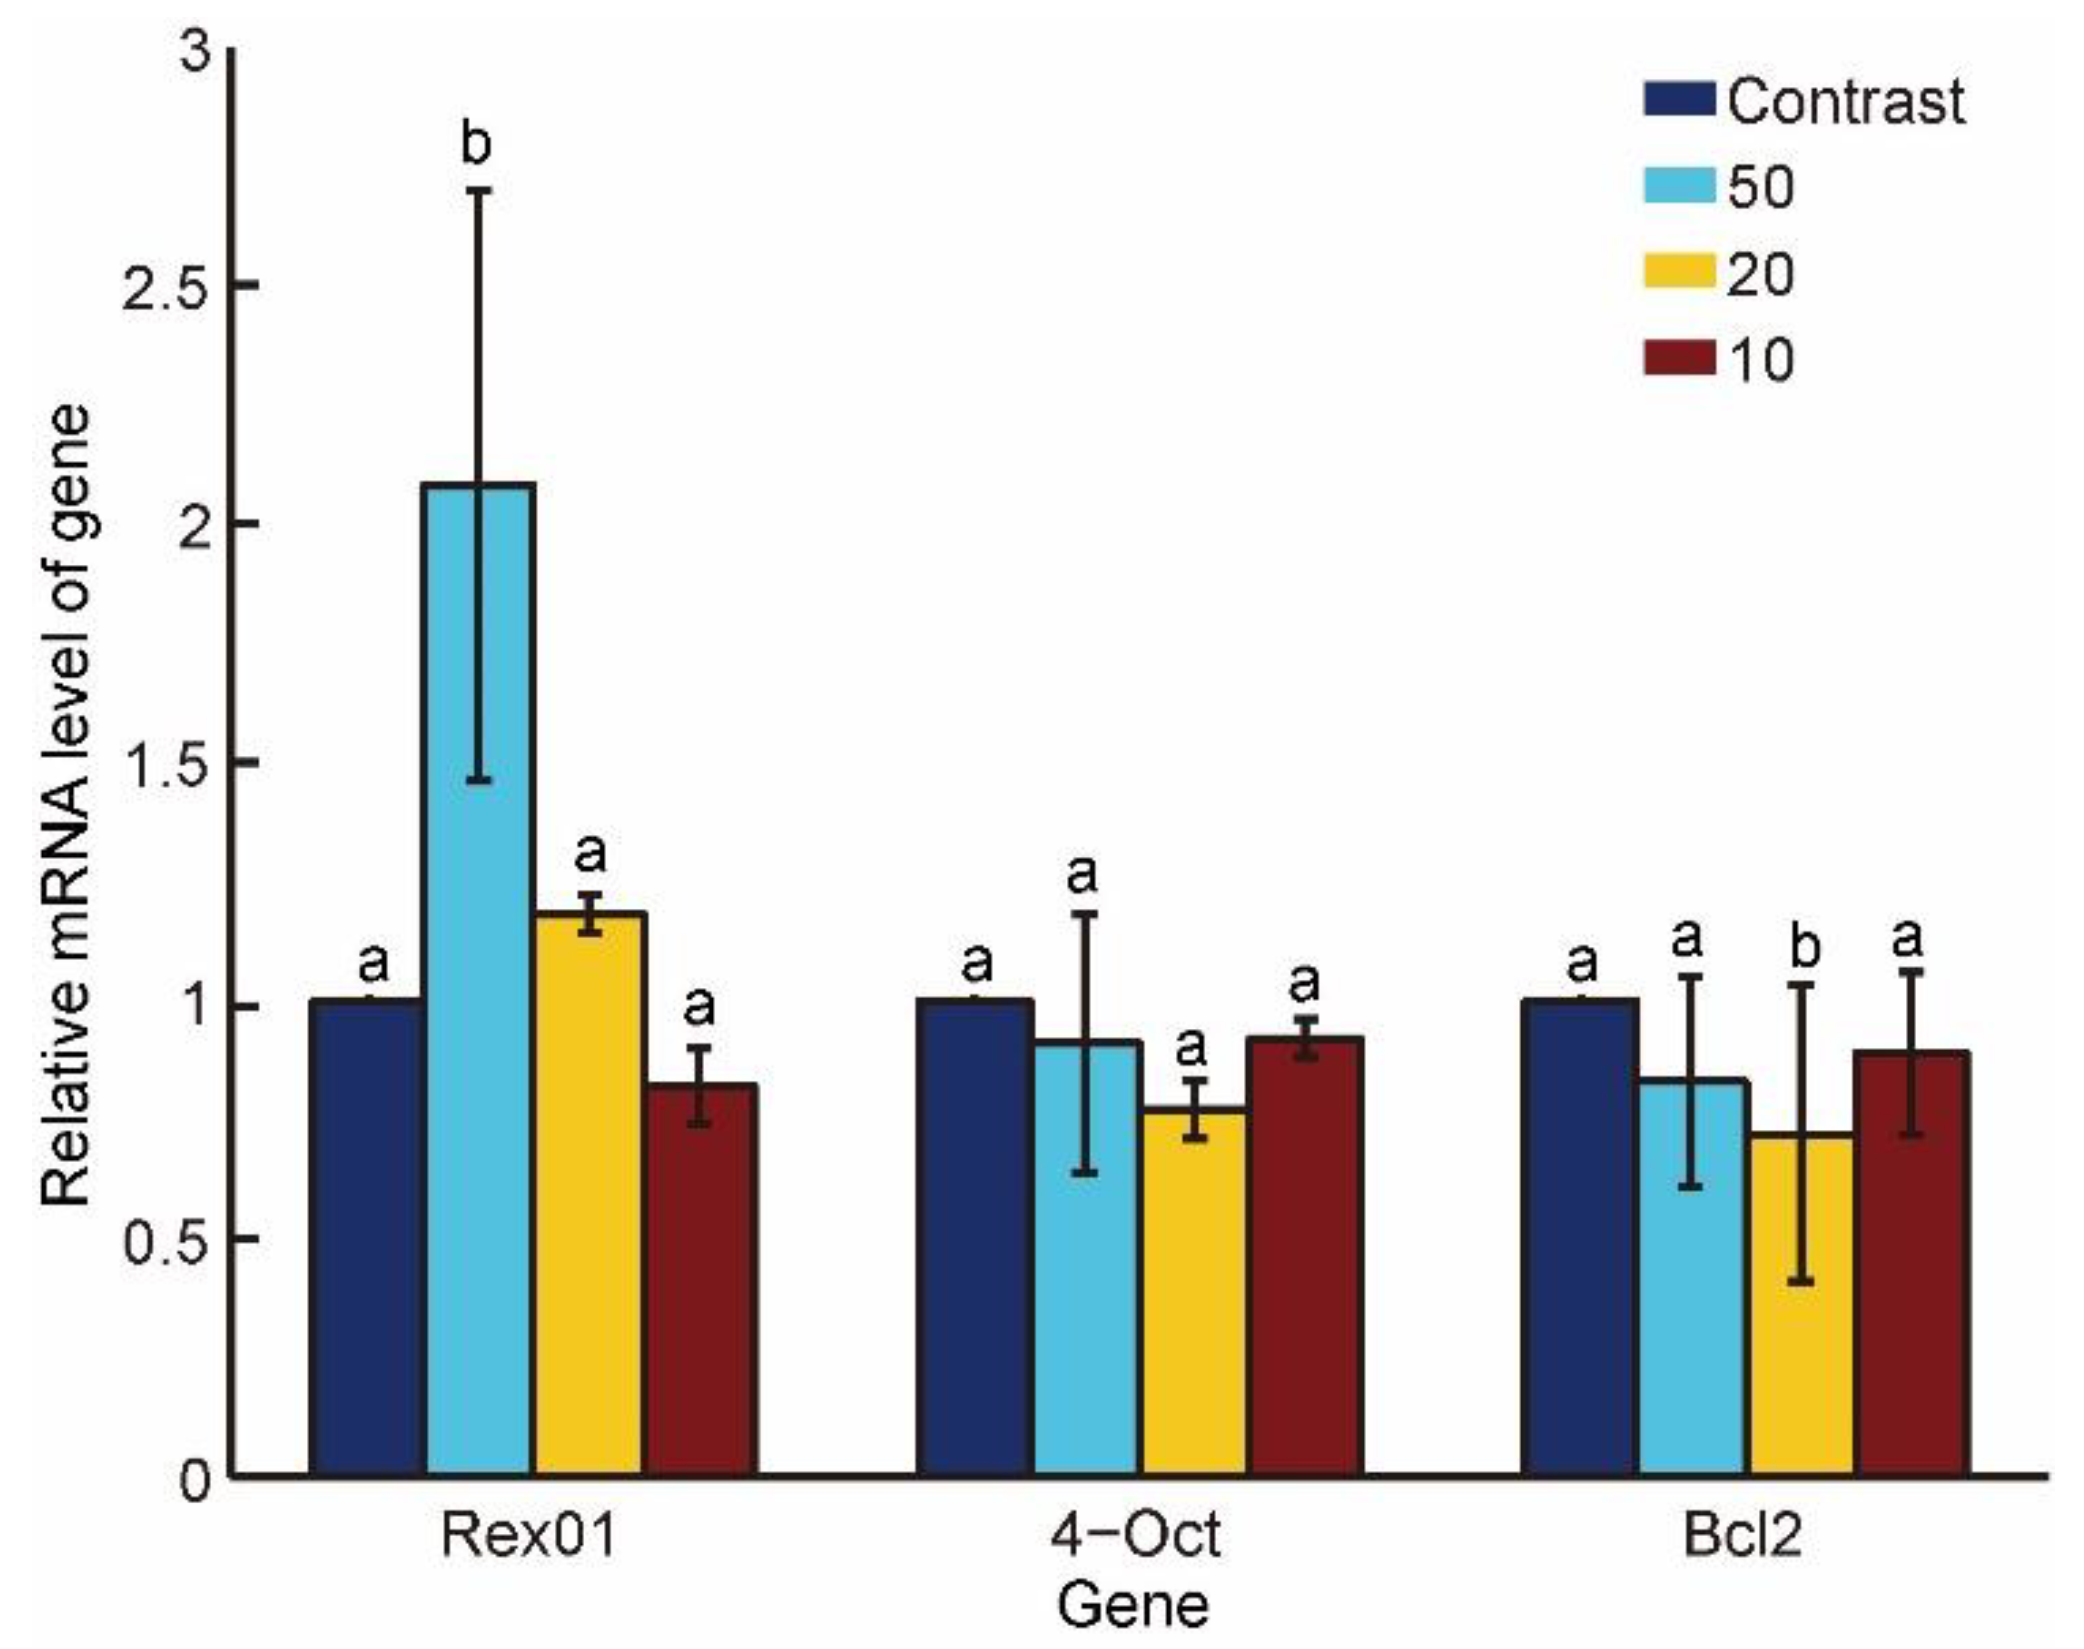
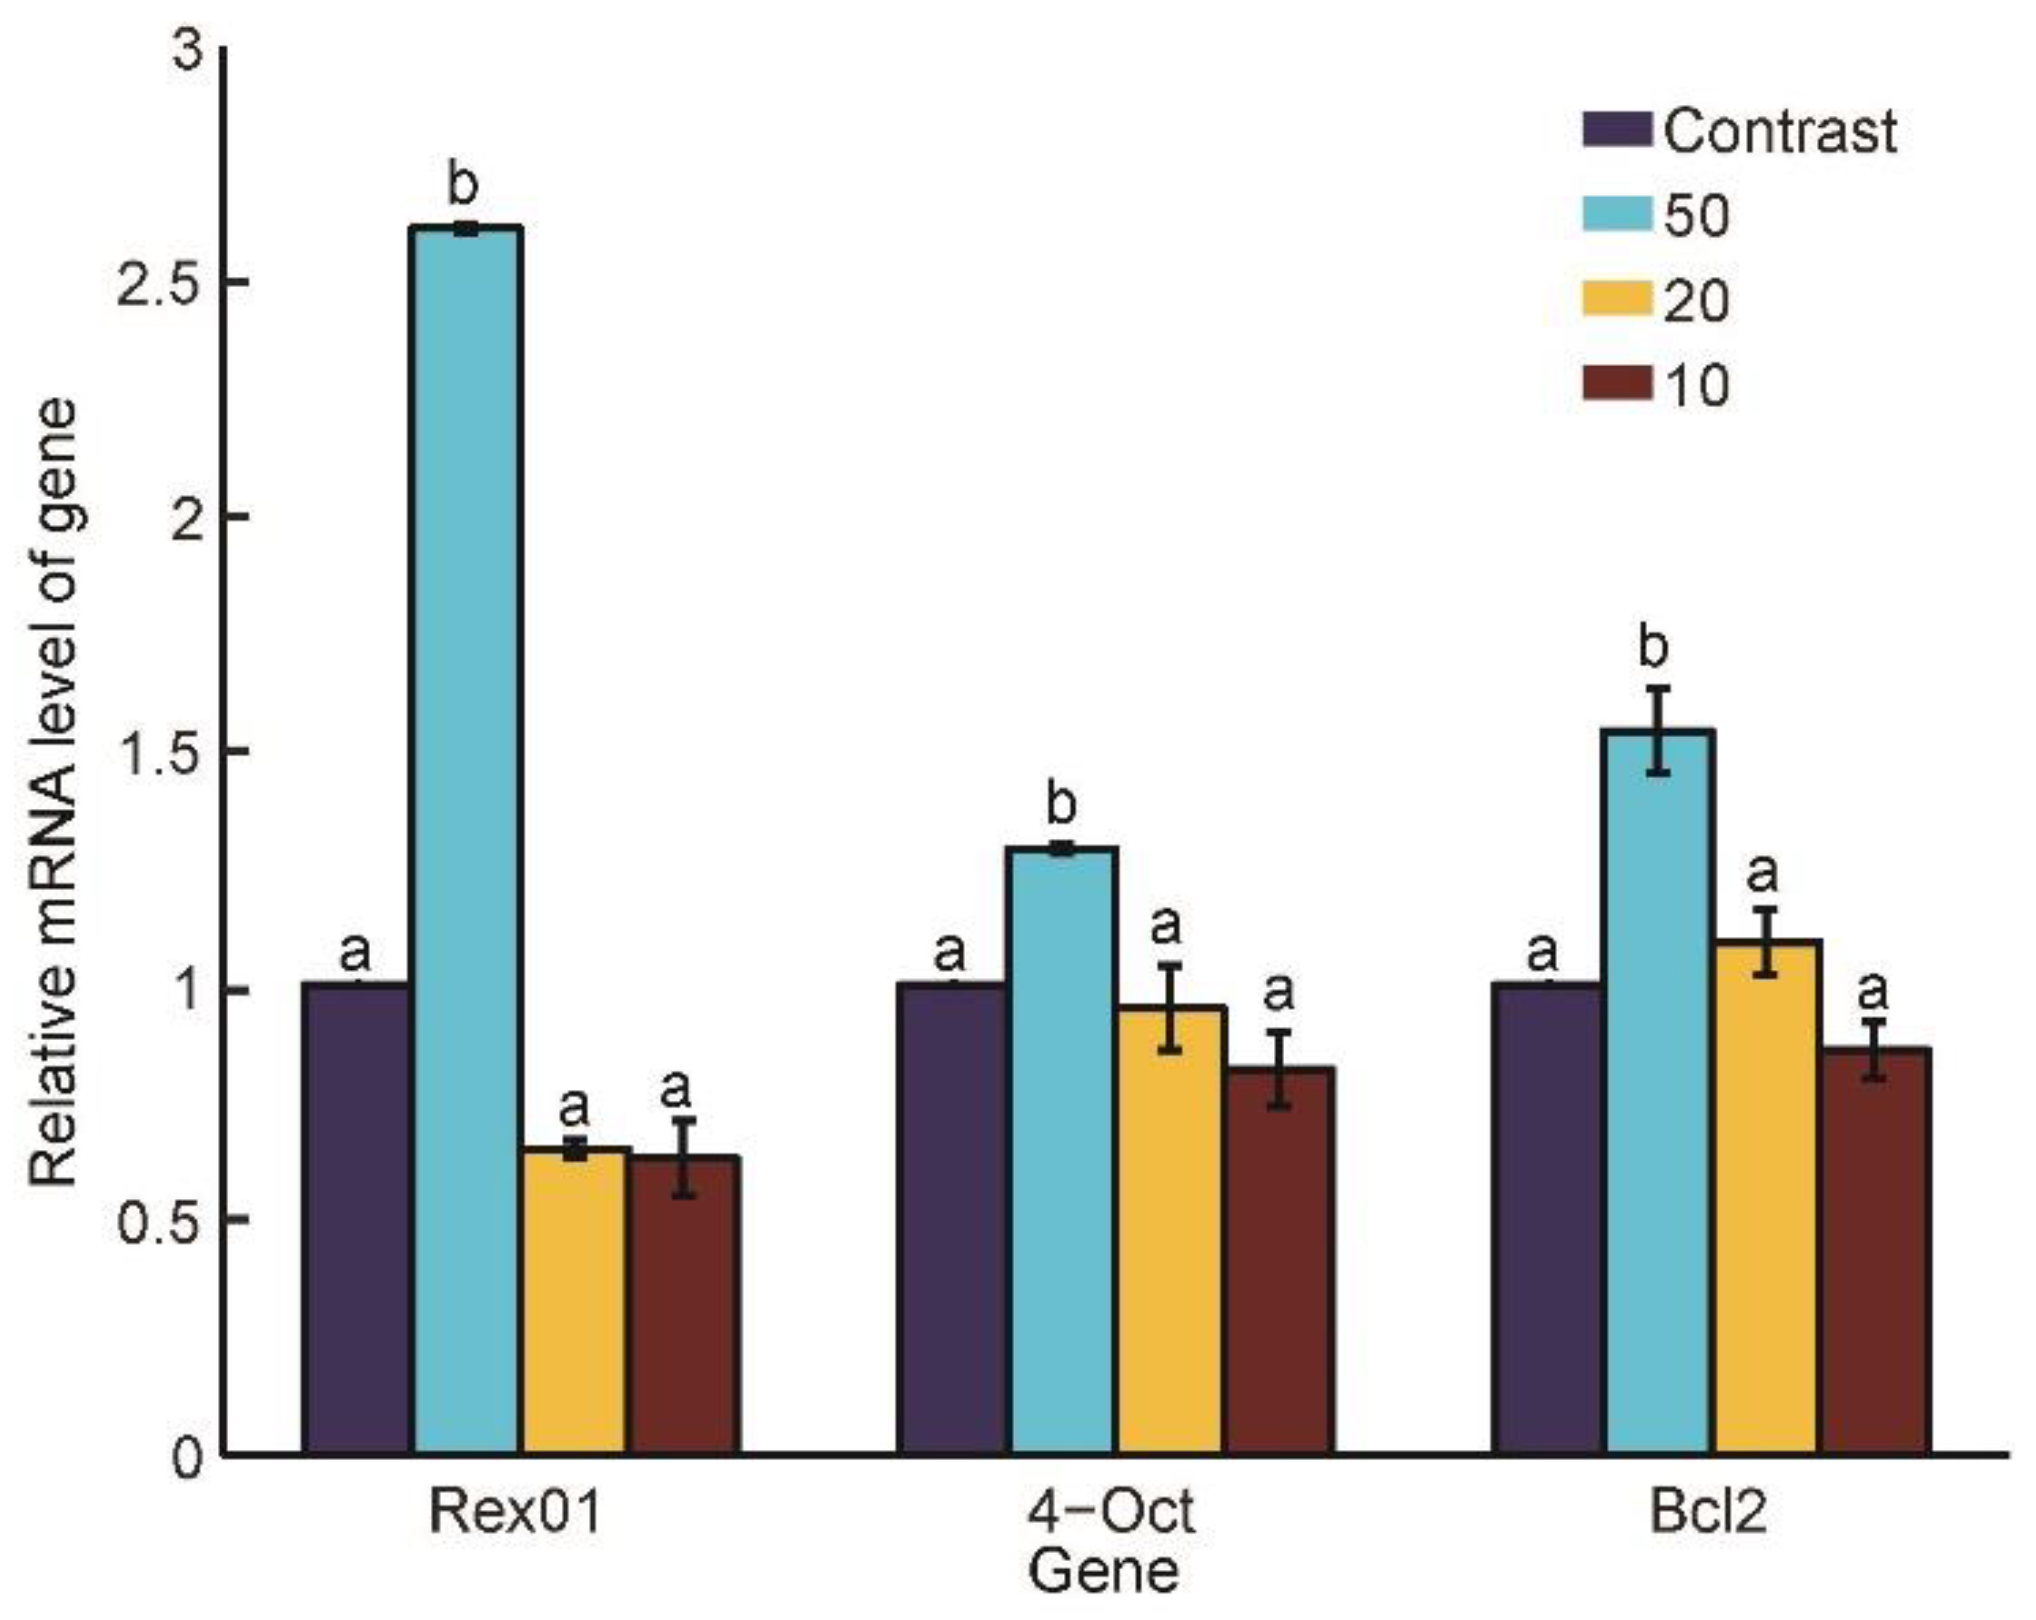
3.4. Gene Expressions under Different Penetration Speeds
4. Discussion
5. Conclusions
Supplementary Materials
Author Contributions
Funding
Institutional Review Board Statement
Informed Consent Statement
Data Availability Statement
Acknowledgments
Conflicts of Interest
Appendix A. Statistical Analysis of the Penetration Process

| i ∈ 1, 2, 3, 4, 5, 6, 7, 8, 9, 10 | Oocyte Number in One Group. |
| j ∈ 10, 20, 30, 40, 50, 100 | Group that represents the oocytes were penetrated at the speeds of 10, 20, 30, 40, 50, and 100 μm/s. |
| n = 10 | Number of the oocytes in one group. |
| N | Number of the points in each oocyte. |
| Strain_penei,j | Strain distribution of oocyte i in group j in penetration process. |
| Maxp_strain_penei,j | Max value of Strain_penei,j in each oocyte. |
| Avgi_maxp_strain_penej | Average value of Maxp_strain_penei,j. |
| STDi_maxp_strain_penej | STD value of Maxp_strain_penei,j. |
| Avgp_strain_penei,j | Average value of Strain_penei,j in each oocyte. |
| Avgi_avgp_strain_penej | Average value of Avgp_strain_penei,j. |
| STDi_avgp_strain_penej | STD value of Avgp_strain_penei,j. |
| Strain_penei,j,t | Strain distribution of oocyte i in group j in frame t in penetration process. |
| Maxp_strain_penei,j,t | Max value of Strain_penei,j in each oocyte in each frame. |
| Maxt_maxp_strain_penei,j | Max value of Maxp_strain_penei,j,t in all frames in each oocyte. |
| Avgi_maxt_maxp_strain_penej | Average value of Maxt_maxp_strain_penei,j in each group. |
| Avgp_strain_penei,j,t | Average value of Strain_penei,j in each oocyte in each frame. |
| Avgt_avgp_strain_penei,j | Average value of Avgp_strain_penei,j,t in all frames in each oocyte. |
| Avgi_avgt_avgp_strain_penej | Average value of Avgt_avgp_strain_penei,j in each group. |
- (1)
- Obtain the strain distribution in the last frame before the oocyte penetrated. The strain distribution of oocyte i in group j was defined as Strain_penei,j.
- (2)
- Obtain the max value of Strain_penei,j in each oocyte:where (x, y) represents the position in the oocyte.
- (3)
- Obtain the average value and standard deviation (STD) of Maxp_strain_penei,j in each group:where n represents the number of oocytes in one group.
- (1)
- Obtain the average value of Strain_penei,j in each oocyte:where N represents the number of the points in the oocyte.
- (2)
- Obtain the average value and STD of Avgp_strain_penei,j in each group:
- (1)
- Obtain the strain distribution in each frame of the penetration process. The strain distribution of oocyte i in group j in frame t was defined as strain_penei,j,t.
- (2)
- Obtain the max value of strain_penei,j,t in each oocyte in each frame:where (x, y) represents the position in the oocyte.
- (3)
- Obtain the max value of Maxp_strain_penei,j,t in all frames in each oocyte:
- (4)
- Obtain the average value and STD of Maxp_strain_penei,j in each group:where n represents the number of oocytes in one group.
- (1)
- Obtain the average value of strain_penei,j,t in each oocyte in each frame:
- (2)
- Obtain the average value of Avgp_strain_penei,j,t in all frames in each oocyte:where T represents the number of the frames in the penetration process.
- (3)
- Obtain the average value and STD of Avgp_strain_penei,j in each group:
References
- Campbell, K.H.S.; McWhir, J.; Ritchie, W.A.; Wilmut, I. Sheep cloned by nuclear transfer from a cultured cell line. Nature 1996, 380, 64–66. [Google Scholar] [CrossRef] [PubMed]
- Baguisi, A.; Behboodi, E.; Melican, D.T.; Pollock, J.S.; Destrempes, M.M.; Cammuso, C.; Williams, J.L.; Nims, S.D.; Porter, C.A.; Midura, P.; et al. Production of goats by somatic cell nuclear transfer. Nat. Biotechnol. 1999, 17, 456–461. [Google Scholar] [CrossRef] [PubMed]
- Polejaeva, I.A.; Chen, S.-H.; Vaught, T.D.; Page, R.L.; Mullins, J.; Ball, S.; Dai, Y.; Boone, J.; Walker, S.; Ayares, D.L.; et al. Cloned pigs produced by nuclear transfer from adult somatic cells. Nature 2000, 407, 86–90. [Google Scholar] [CrossRef] [PubMed]
- Lee, B.C.; Kim, M.K.; Jang, G.; Oh, H.J.; Yuda, F.; Kim, H.J.; Shamin, M.H.; Kim, J.J.; Kang, S.K.; Schatten, G.; et al. Dogs cloned from adult somatic cells (vol 436, pg 641, 2005). Nature 2005, 436, 1102. [Google Scholar] [CrossRef] [PubMed]
- Liu, Z.; Cai, Y.; Wang, Y.; Nie, Y.; Zhang, C.; Xu, Y.; Zhang, X.; Lu, Y.; Wang, Z.; Poo, M.; et al. Cloning of Macaque Mon-keys by Somatic Cell Nuclear Transfer. Cell 2018, 172, 881–887.e7. [Google Scholar] [CrossRef] [Green Version]
- Moro, L.N.; Viale, D.L.; Bastón, J.I.; Arnold, V.; Suvá, M.; Wiedenmann, E.; Olguín, M.; Miriuka, S.; Vichera, G. Generation of myostatin edited horse embryos using CRISPR/Cas9 technology and somatic cell nuclear transfer. Sci. Rep. 2020, 10, 15587. [Google Scholar] [CrossRef]
- Iqbal, A.; Ping, J.; Ali, S.; Zhen, G.; Kang, J.Z.; Yi, P.Z.; Huixian, L.; Zhihui, Z. Conservation of endangered species through somatic cell nuclear transfer (SCNT). Conserv. Genet. Resour. 2021, 13, 349–357. [Google Scholar] [CrossRef]
- Ammi, M.; Ferreira, A. Realistic Visual and Haptic Rendering for Biological-Cell Injection. In Proceedings of the 2005 IEEE International Conference on Robotics and Automation, Barcelona, Spain, 18–22 April 2005. [Google Scholar] [CrossRef]
- Park, J.; Jung, S.-H.; Kim, Y.-H.; Kim, B.; Lee, S.-K.; Park, J.-O. Design and fabrication of an integrated cell processor for single embryo cell manipulation. Lab Chip 2004, 5, 91–96. [Google Scholar] [CrossRef]
- Wang, W.; Liu, X.; Gelinas, D.; Ciruna, B.; Sun, Y. A fully automated robotic system for microinjection of zebrafish embryos. PLoS ONE 2007, 2, e862. [Google Scholar] [CrossRef] [Green Version]
- Stein, P.; Schultz, R.M. Chapter 14—Icsi in the Mouse. In Guide to Techniques in Mouse Development, Pt A: Mice, Embryos, and Cells, 2nd ed.; Methods in Enzymology; Academic Press: Cambridge, MA, USA, 2010; Volume 476, pp. 251–262. [Google Scholar]
- Lu, Z.; Zhang, X.; Leung, C.; Esfandiari, N.; Casper, R.F.; Sun, Y. Robotic ICSI (Intracytoplasmic Sperm Injection). IEEE Trans. Biomed. Eng. 2011, 58, 2102–2108. [Google Scholar] [CrossRef] [Green Version]
- Pérez-Cerezales, S.; Laguna-Barraza, R.; De Castro, A.C.; Sánchez-Calabuig, M.-J.; Cano-Oliva, E.; De Castro-Pita, F.J.; Montoro-Buils, L.; Pericuesta, E.; Fernández-González, R.; Gutiérrez-Adán, A. Sperm selection by thermotaxis improves ICSI outcome in mice. Sci. Rep. 2018, 8, 2902. [Google Scholar] [CrossRef] [PubMed]
- Tabbalat, A.M.; Pereira, N.; Klauck, D.; Melhem, C.; Elias, R.T.; Rosenwaks, Z. Arabian Peninsula ethnicity is associated with lower ovarian reserve and ovarian response in women undergoing fresh ICSI cycles. J. Assist. Reprod. Genet. 2017, 35, 331–337. [Google Scholar] [CrossRef] [PubMed]
- Mattos, L.S.; Grant, E.; Thresher, R.; Kluckman, K. Blastocyst Microinjection Automation. IEEE Trans. Inf. Technol. Biomed. 2009, 13, 822–831. [Google Scholar] [CrossRef] [PubMed]
- Scott, A.; Khan, K.M.; Heer, J.; Cook, J.L.; Lian, O.; Duronio, V. High strain mechanical loading rapidly induces tendon apoptosis: An ex vivo rat tibialis anterior model. Br. J. Sports Med. 2005, 39, e25. [Google Scholar] [CrossRef] [PubMed] [Green Version]
- Gladman, S.; Ward, R.; Michael-Titus, A.; Knight, M.; Priestley, J. The effect of mechanical strain or hypoxia on cell death in subpopulations of rat dorsal root ganglion neurons in vitro. Neuroscience 2010, 171, 577–587. [Google Scholar] [CrossRef]
- Liu, Y.; Cui, M.; Sun, Y.; Feng, Z.; Bai, Y.; Sun, M.; Zhao, Q.; Zhao, X. Oocyte orientation selection method based on the minimum strain position in the penetration process. J. Appl. Phys. 2019, 125, 154701. [Google Scholar] [CrossRef]
- Liu, F.; Wu, D.; Wu, X.; Chen, K. Analyses of the cell mechanical damage during microinjection. Soft Matter 2014, 11, 1434–1442. [Google Scholar] [CrossRef]
- Bolton, V.N.; Hawes, S.M.; Taylor, C.T.; Parsons, J.H. Development of spare human preimplantation embryos in vitro: An analysis of the correlations among gross morphology, cleavage rates, and development to the blastocyst. J. In Vitro Fert. Embryo Transf. 1989, 6, 30–35. [Google Scholar] [CrossRef]
- Pathak, J.; Kharche, S.D.; Goel, A. Effects of different activation protocols on cleavage rate and blastocyst production of caprine oocytes. Iran J. Vet. Res. 2017, 18, 243–248. [Google Scholar]
- Liu, Y.; Cui, M.; Huang, J.; Sun, M.; Zhao, X.; Zhao, Q. Robotic Micropipette Aspiration for Multiple Cells. Micromachines 2019, 10, 348. [Google Scholar] [CrossRef] [Green Version]
- Liu, Y.W.; Wang, X.F.; Zhao, Q.L.; Zhao, X.; Sun, M.Z. Robotic Batch Somatic Cell Nuclear Transfer Based on Microflu-idic Groove. IEEE Trans. Autom. Sci. Eng. 2020, 17, 2097–2106. [Google Scholar] [CrossRef]
- Zhao, X.; Cui, M.; Zhang, Y.; Liu, Y.; Zhao, X. Robotic Precisely Oocyte Blind Enucleation Method. Appl. Sci. 2021, 11, 1850. [Google Scholar] [CrossRef]
- Samiec, M.; Skrzyszowska, M. Preimplantation Developmental Capability of Cloned Pig Embryos Derived from Dif-ferent Types of Nuclear Donor Somatic Cells. Ann. Anim. Sci. 2010, 10, 385–398. [Google Scholar]
- Tsakmakidis, I.A.; Tsantarliotou, M.; Michos, I.A.; Basioura, A.G.; Tsousis, G.; Boscos, C.M. Selected steps of swine ICSI method to overcome seasonal effect and achieve acceptable early em-bryonic development, a preliminary study. Pol. J. Vet. Sci. 2017, 20, 607–609. [Google Scholar] [CrossRef] [PubMed] [Green Version]
- Petelak, A.; Krylov, V. Surface sperm cell ubiquitination directly impaired blastocyst formation rate after intracyto-plasmic sperm injection in pig. Theriogenology 2019, 135, 115–120. [Google Scholar] [CrossRef] [PubMed]
- Gambini, A.; Rodríguez, M.D.; Rodríguez, M.B.; Briski, O.; Bragulat, A.P.F.; Demergassi, N.; Losinno, L.; Salamone, D.F. Horse ooplasm supports in vitro preimplantation development of zebra ICSI and SCNT embryos without compromising YAP1 and SOX2 expression pattern. PLoS ONE 2020, 15, e0238948. [Google Scholar] [CrossRef] [PubMed]
- Skrzyszowska, M.; Samiec, M. Generating Cloned Goats by Somatic Cell Nuclear Transfer—Molecular Determinants and Application to Transgenics and Biomedicine. Int. J. Mol. Sci. 2021, 22, 7490. [Google Scholar] [CrossRef]
- Wiater, J.; Samiec, M.; Wartalski, K.; Smorąg, Z.; Jura, J.; Słomski, R.; Skrzyszowska, M.; Romek, M. Characterization of Mono- and Bi-Transgenic Pig-Derived Epidermal Keratinocytes Expressing Human FUT2 and GLA Genes—In Vitro Studies. Int. J. Mol. Sci. 2021, 22, 9683. [Google Scholar] [CrossRef]
- Lee, Y.-J.; Lin, W.; Peng, S.-Y.; Lee, J.-W.; Lin, Y.-H.; Yu, C.; Shen, P.-C. Effects of intracytoplasmic sperm injection timing and fertilization methods on the development of bovine spindle transferred embryos. Theriogenology 2021, 180, 63–71. [Google Scholar] [CrossRef]


| Genes Primer | Sequences (5–3) | Size of PCR Products (bp) | Tm (°C) |
|---|---|---|---|
| Oct4 | GCTCACTTTGGGGGTTCTCT TGAAACTGAGCTGCAAAGCC | 80 | 59 |
| Rex01 | CTTCAAGGAGAGCGCAAAAC TGTCCCCAATCAAAAATGCT | 299 | 52 |
| Bcl-2 | GCAACCCATCCTGGCACCT AACTCATCGCCCGCCTCCCT | 133 | 60 |
Publisher’s Note: MDPI stays neutral with regard to jurisdictional claims in published maps and institutional affiliations. |
© 2022 by the authors. Licensee MDPI, Basel, Switzerland. This article is an open access article distributed under the terms and conditions of the Creative Commons Attribution (CC BY) license (https://creativecommons.org/licenses/by/4.0/).
Share and Cite
Liu, Y.; Cui, M.; Zhang, Y.; Zhao, X.; Sun, M.; Zhao, X. Oocyte Penetration Speed Optimization Based on Intracellular Strain. Micromachines 2022, 13, 309. https://doi.org/10.3390/mi13020309
Liu Y, Cui M, Zhang Y, Zhao X, Sun M, Zhao X. Oocyte Penetration Speed Optimization Based on Intracellular Strain. Micromachines. 2022; 13(2):309. https://doi.org/10.3390/mi13020309
Chicago/Turabian StyleLiu, Yaowei, Maosheng Cui, Yidi Zhang, Xiangfei Zhao, Mingzhu Sun, and Xin Zhao. 2022. "Oocyte Penetration Speed Optimization Based on Intracellular Strain" Micromachines 13, no. 2: 309. https://doi.org/10.3390/mi13020309
APA StyleLiu, Y., Cui, M., Zhang, Y., Zhao, X., Sun, M., & Zhao, X. (2022). Oocyte Penetration Speed Optimization Based on Intracellular Strain. Micromachines, 13(2), 309. https://doi.org/10.3390/mi13020309