
A Privacy-Preserved Internet-of-Medical-Things Scheme for Eradication and Control of Dengue Using UAV

 ,
,  , ,
, ,
Abstract
1. Introduction
2. Related Work
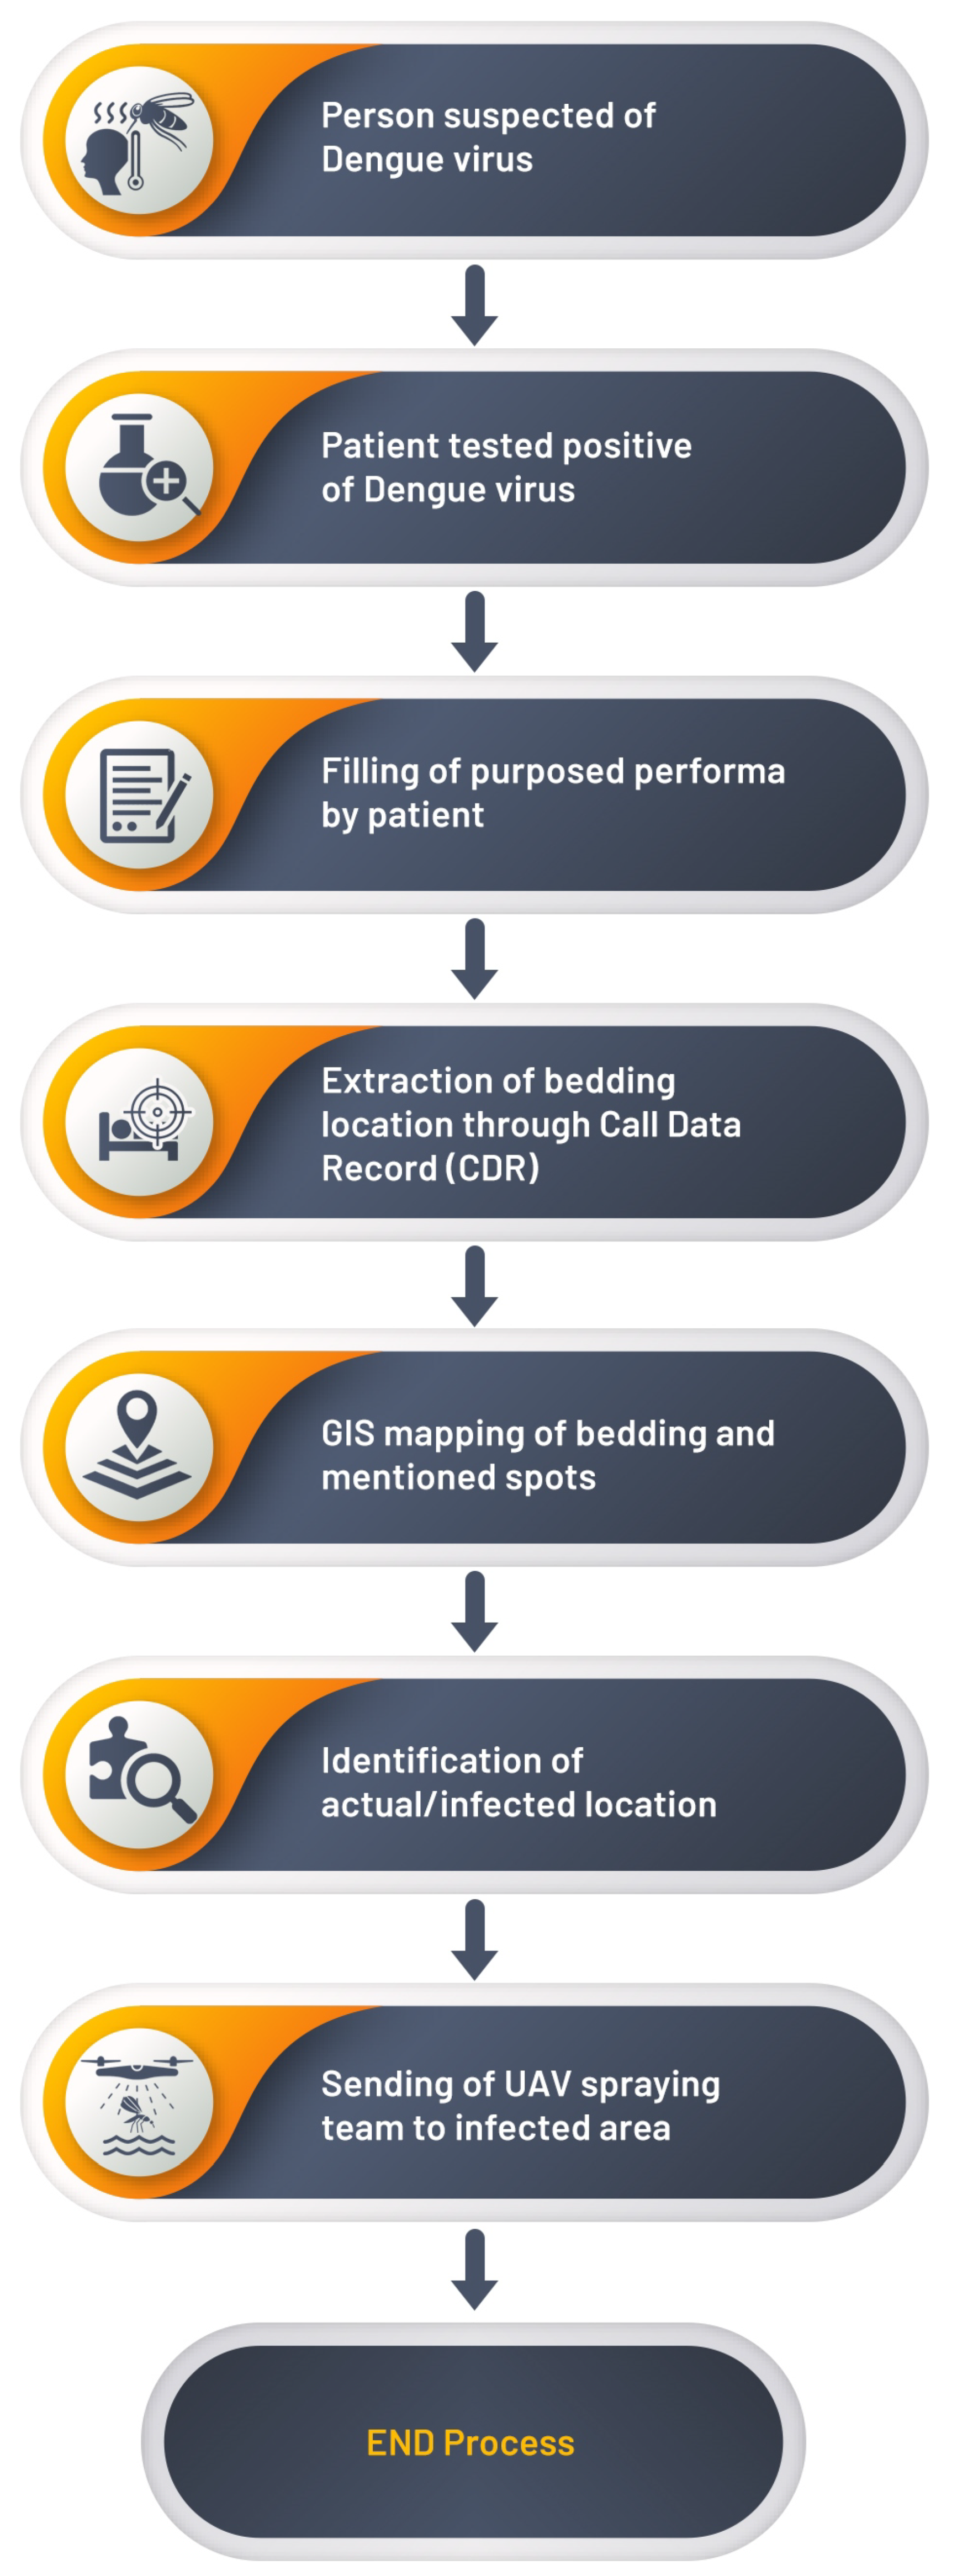
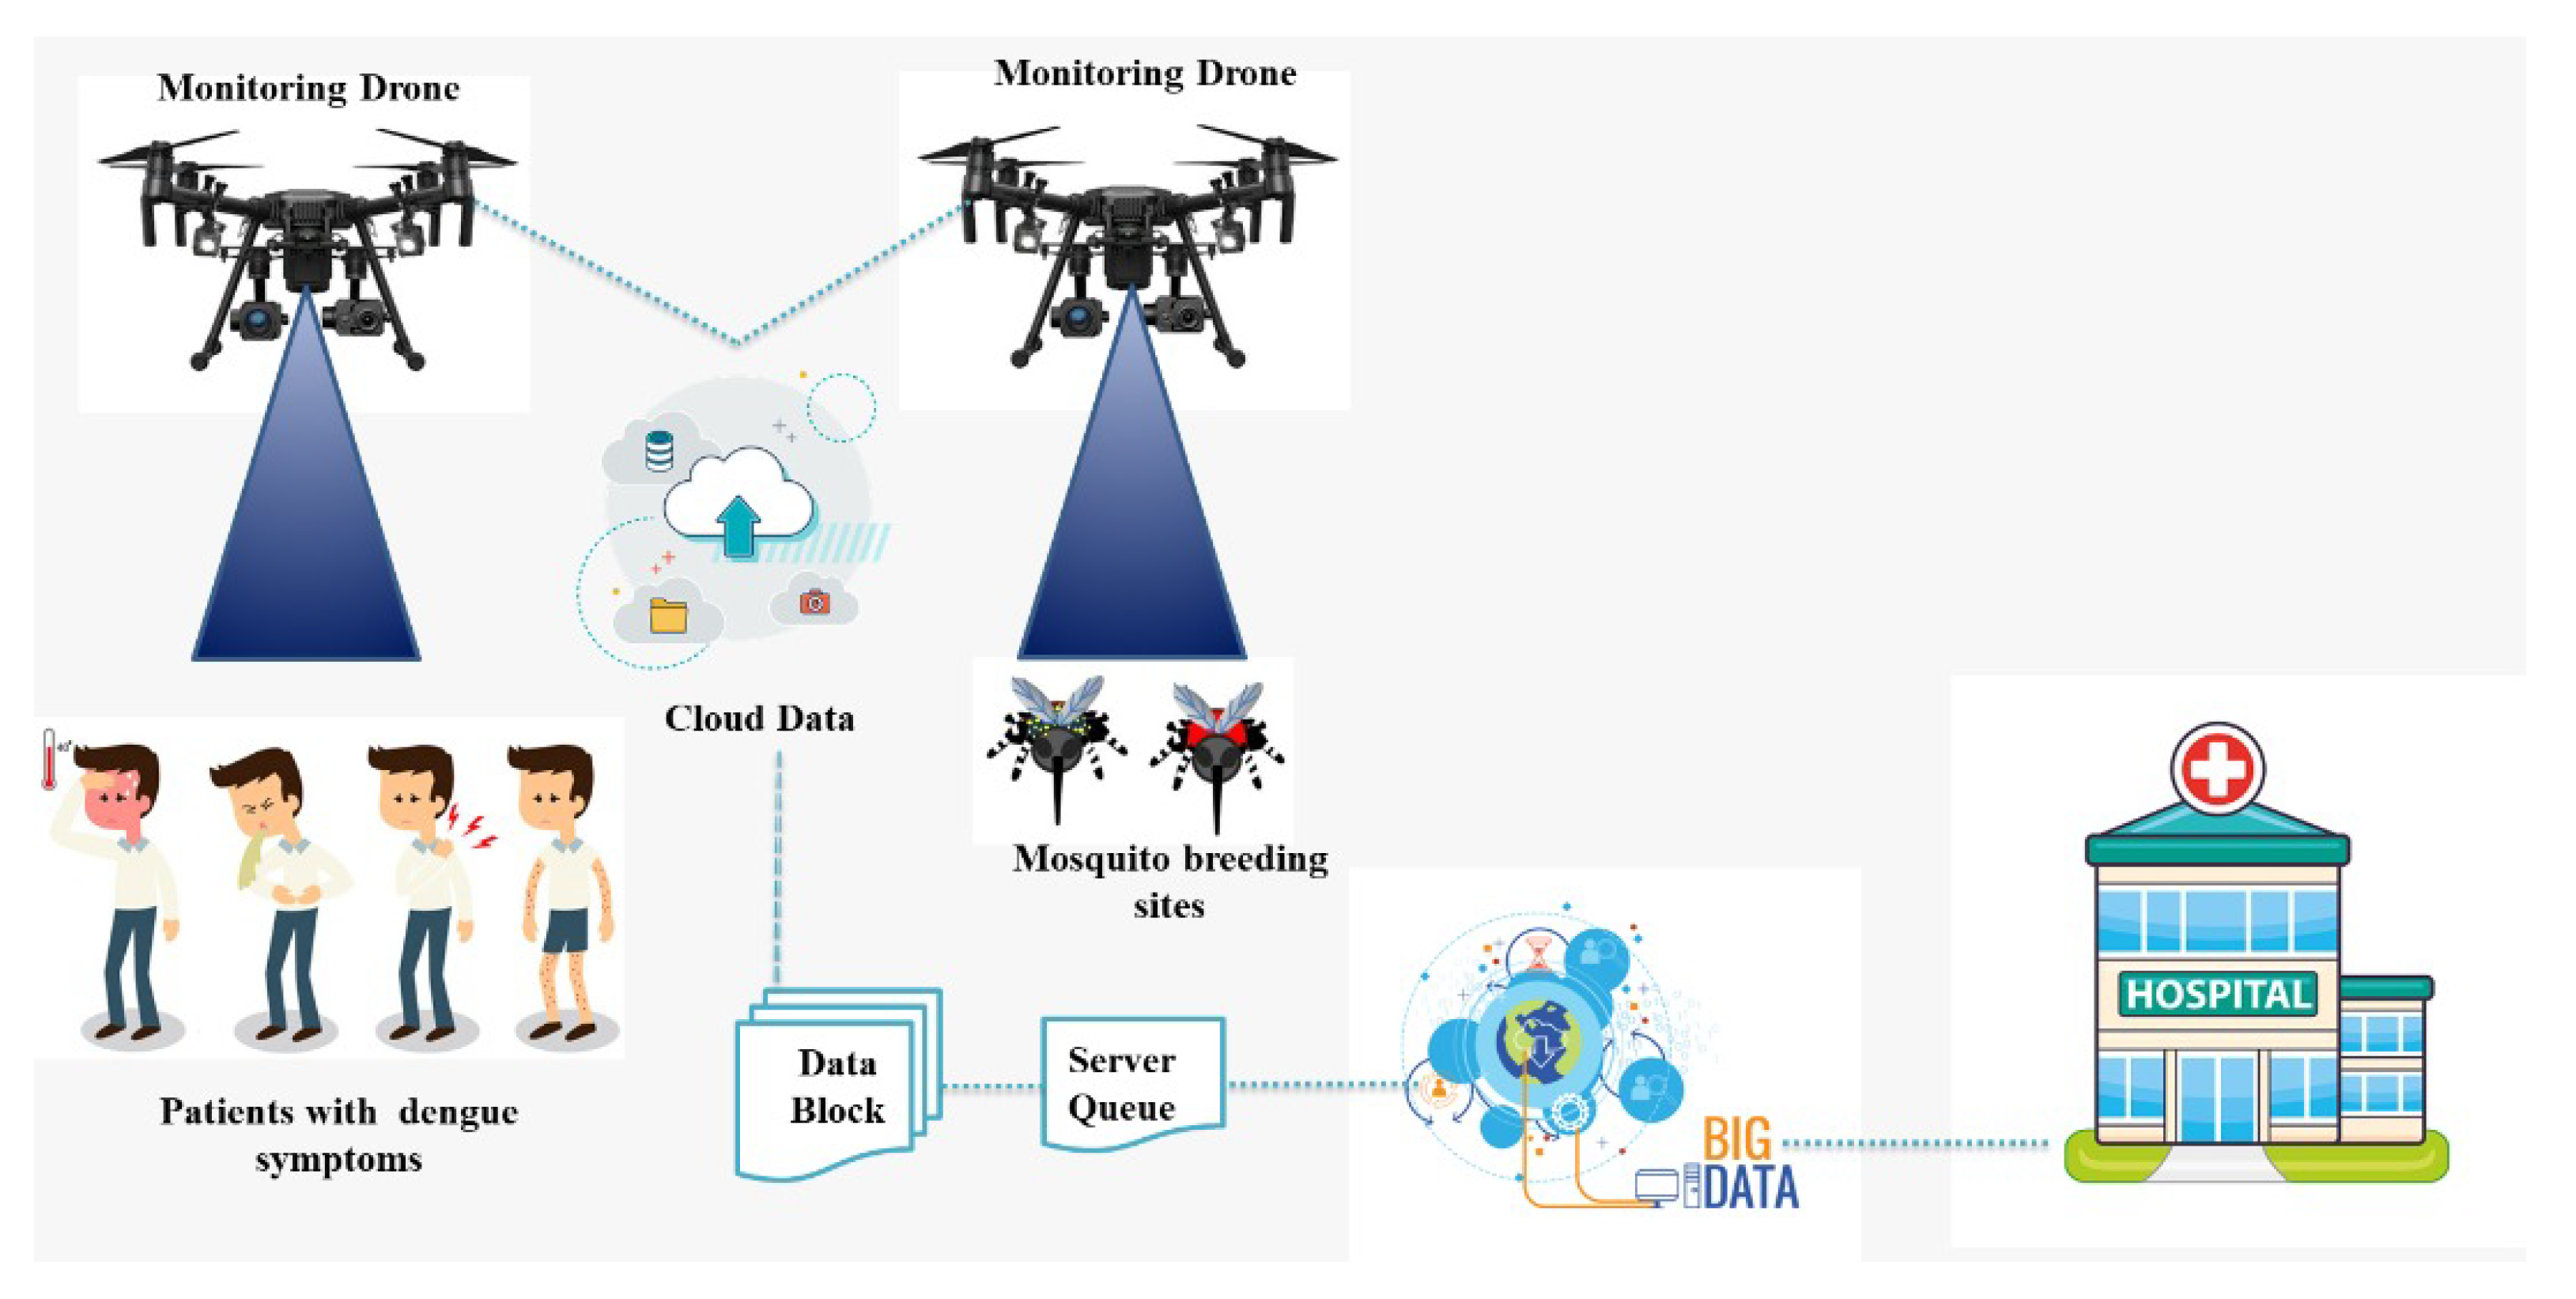
3. Proposed Model
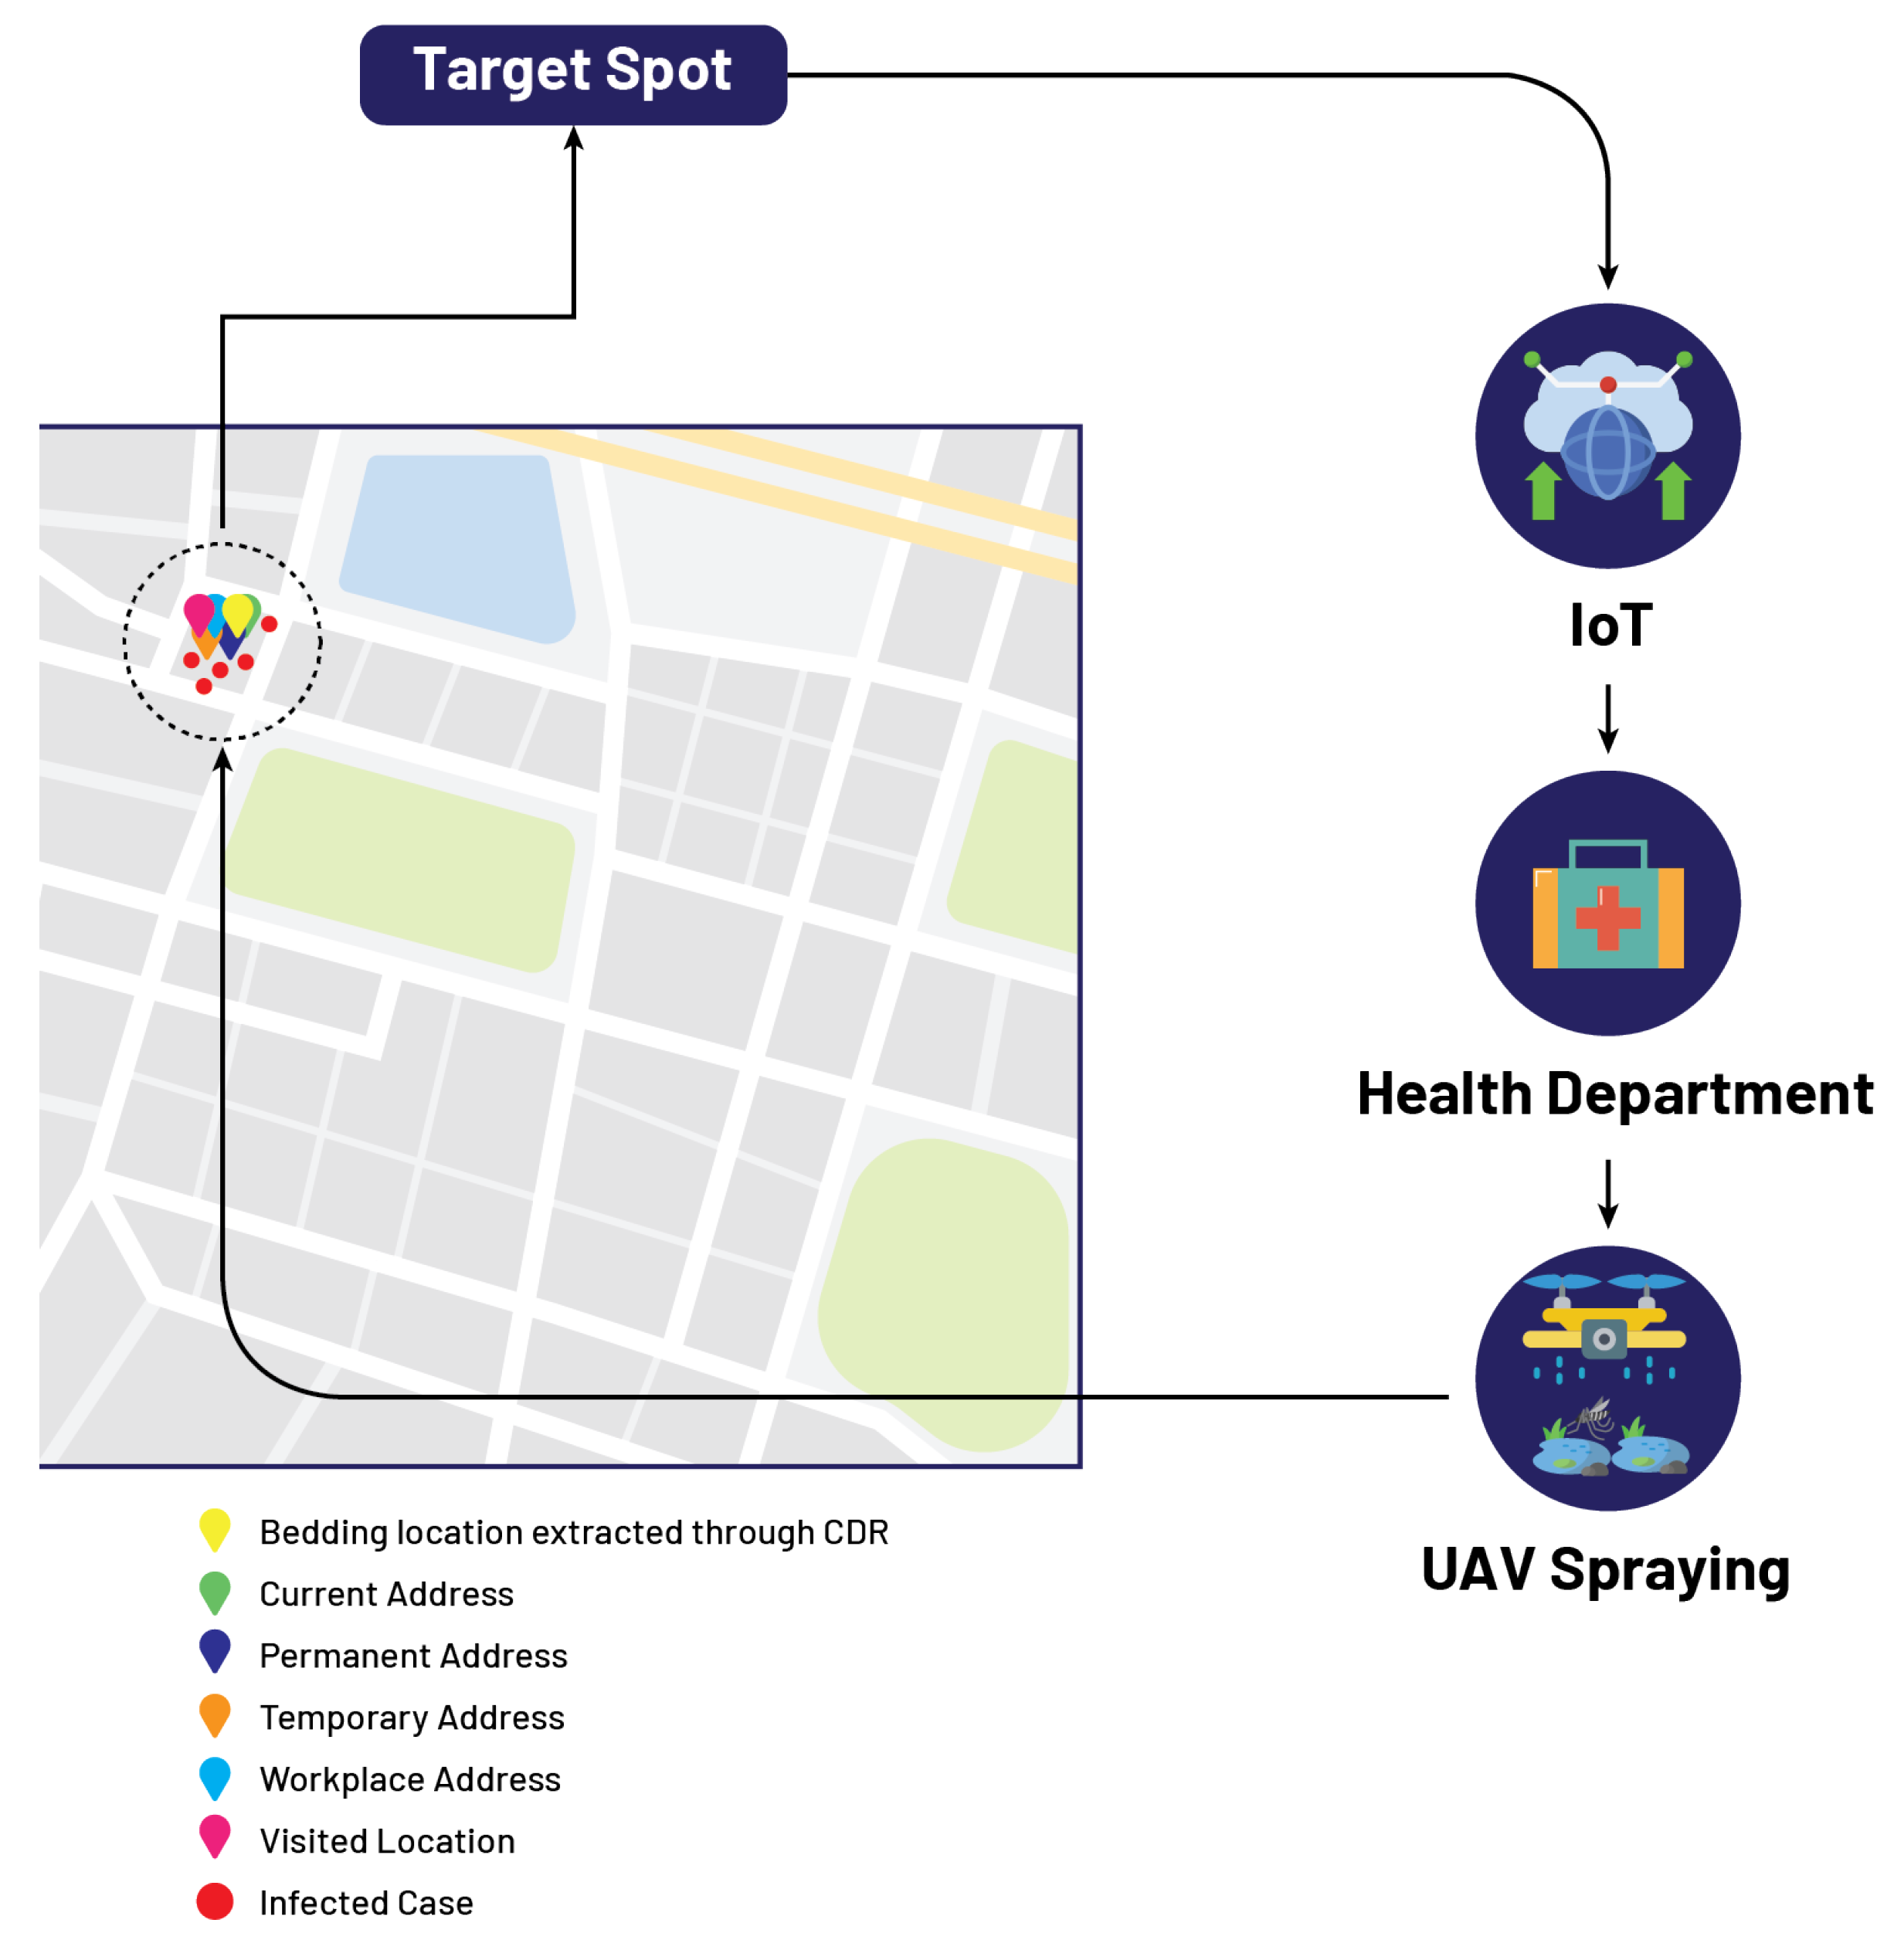
4. CDRA Framework
| Algorithm 1 Proposed model. |
Require:
|
5. Case Study
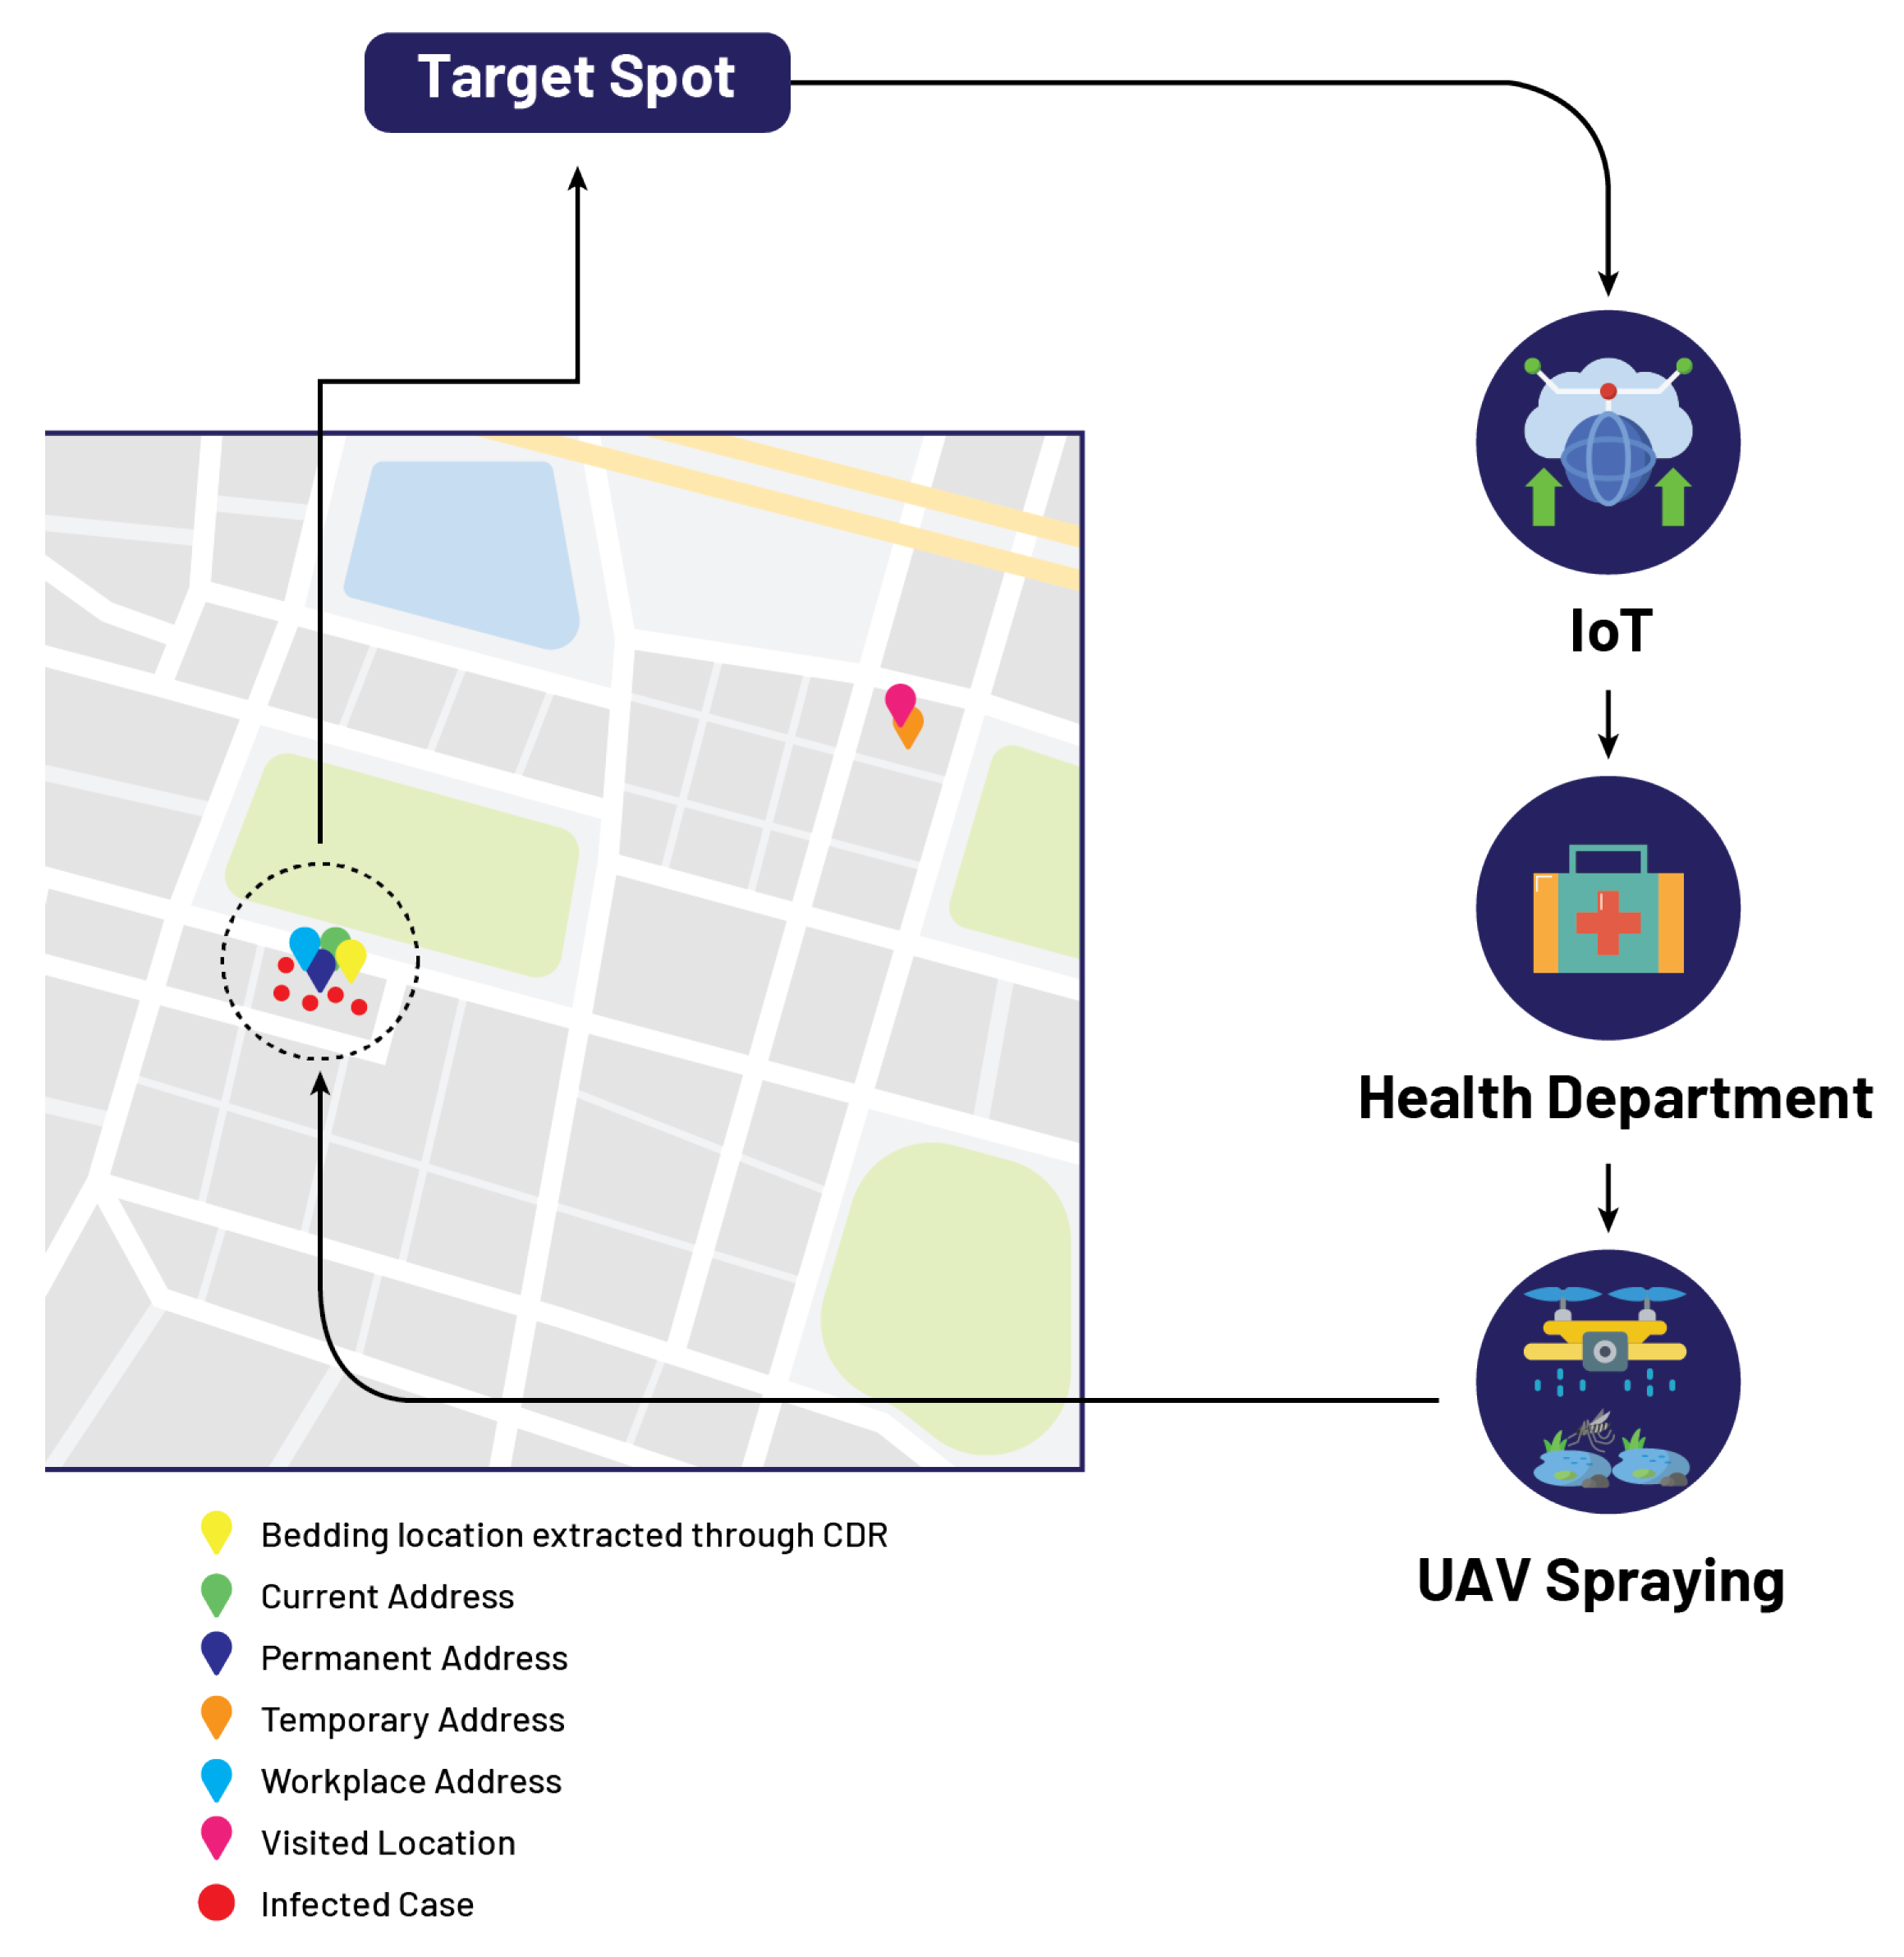
5.1. Mr. A
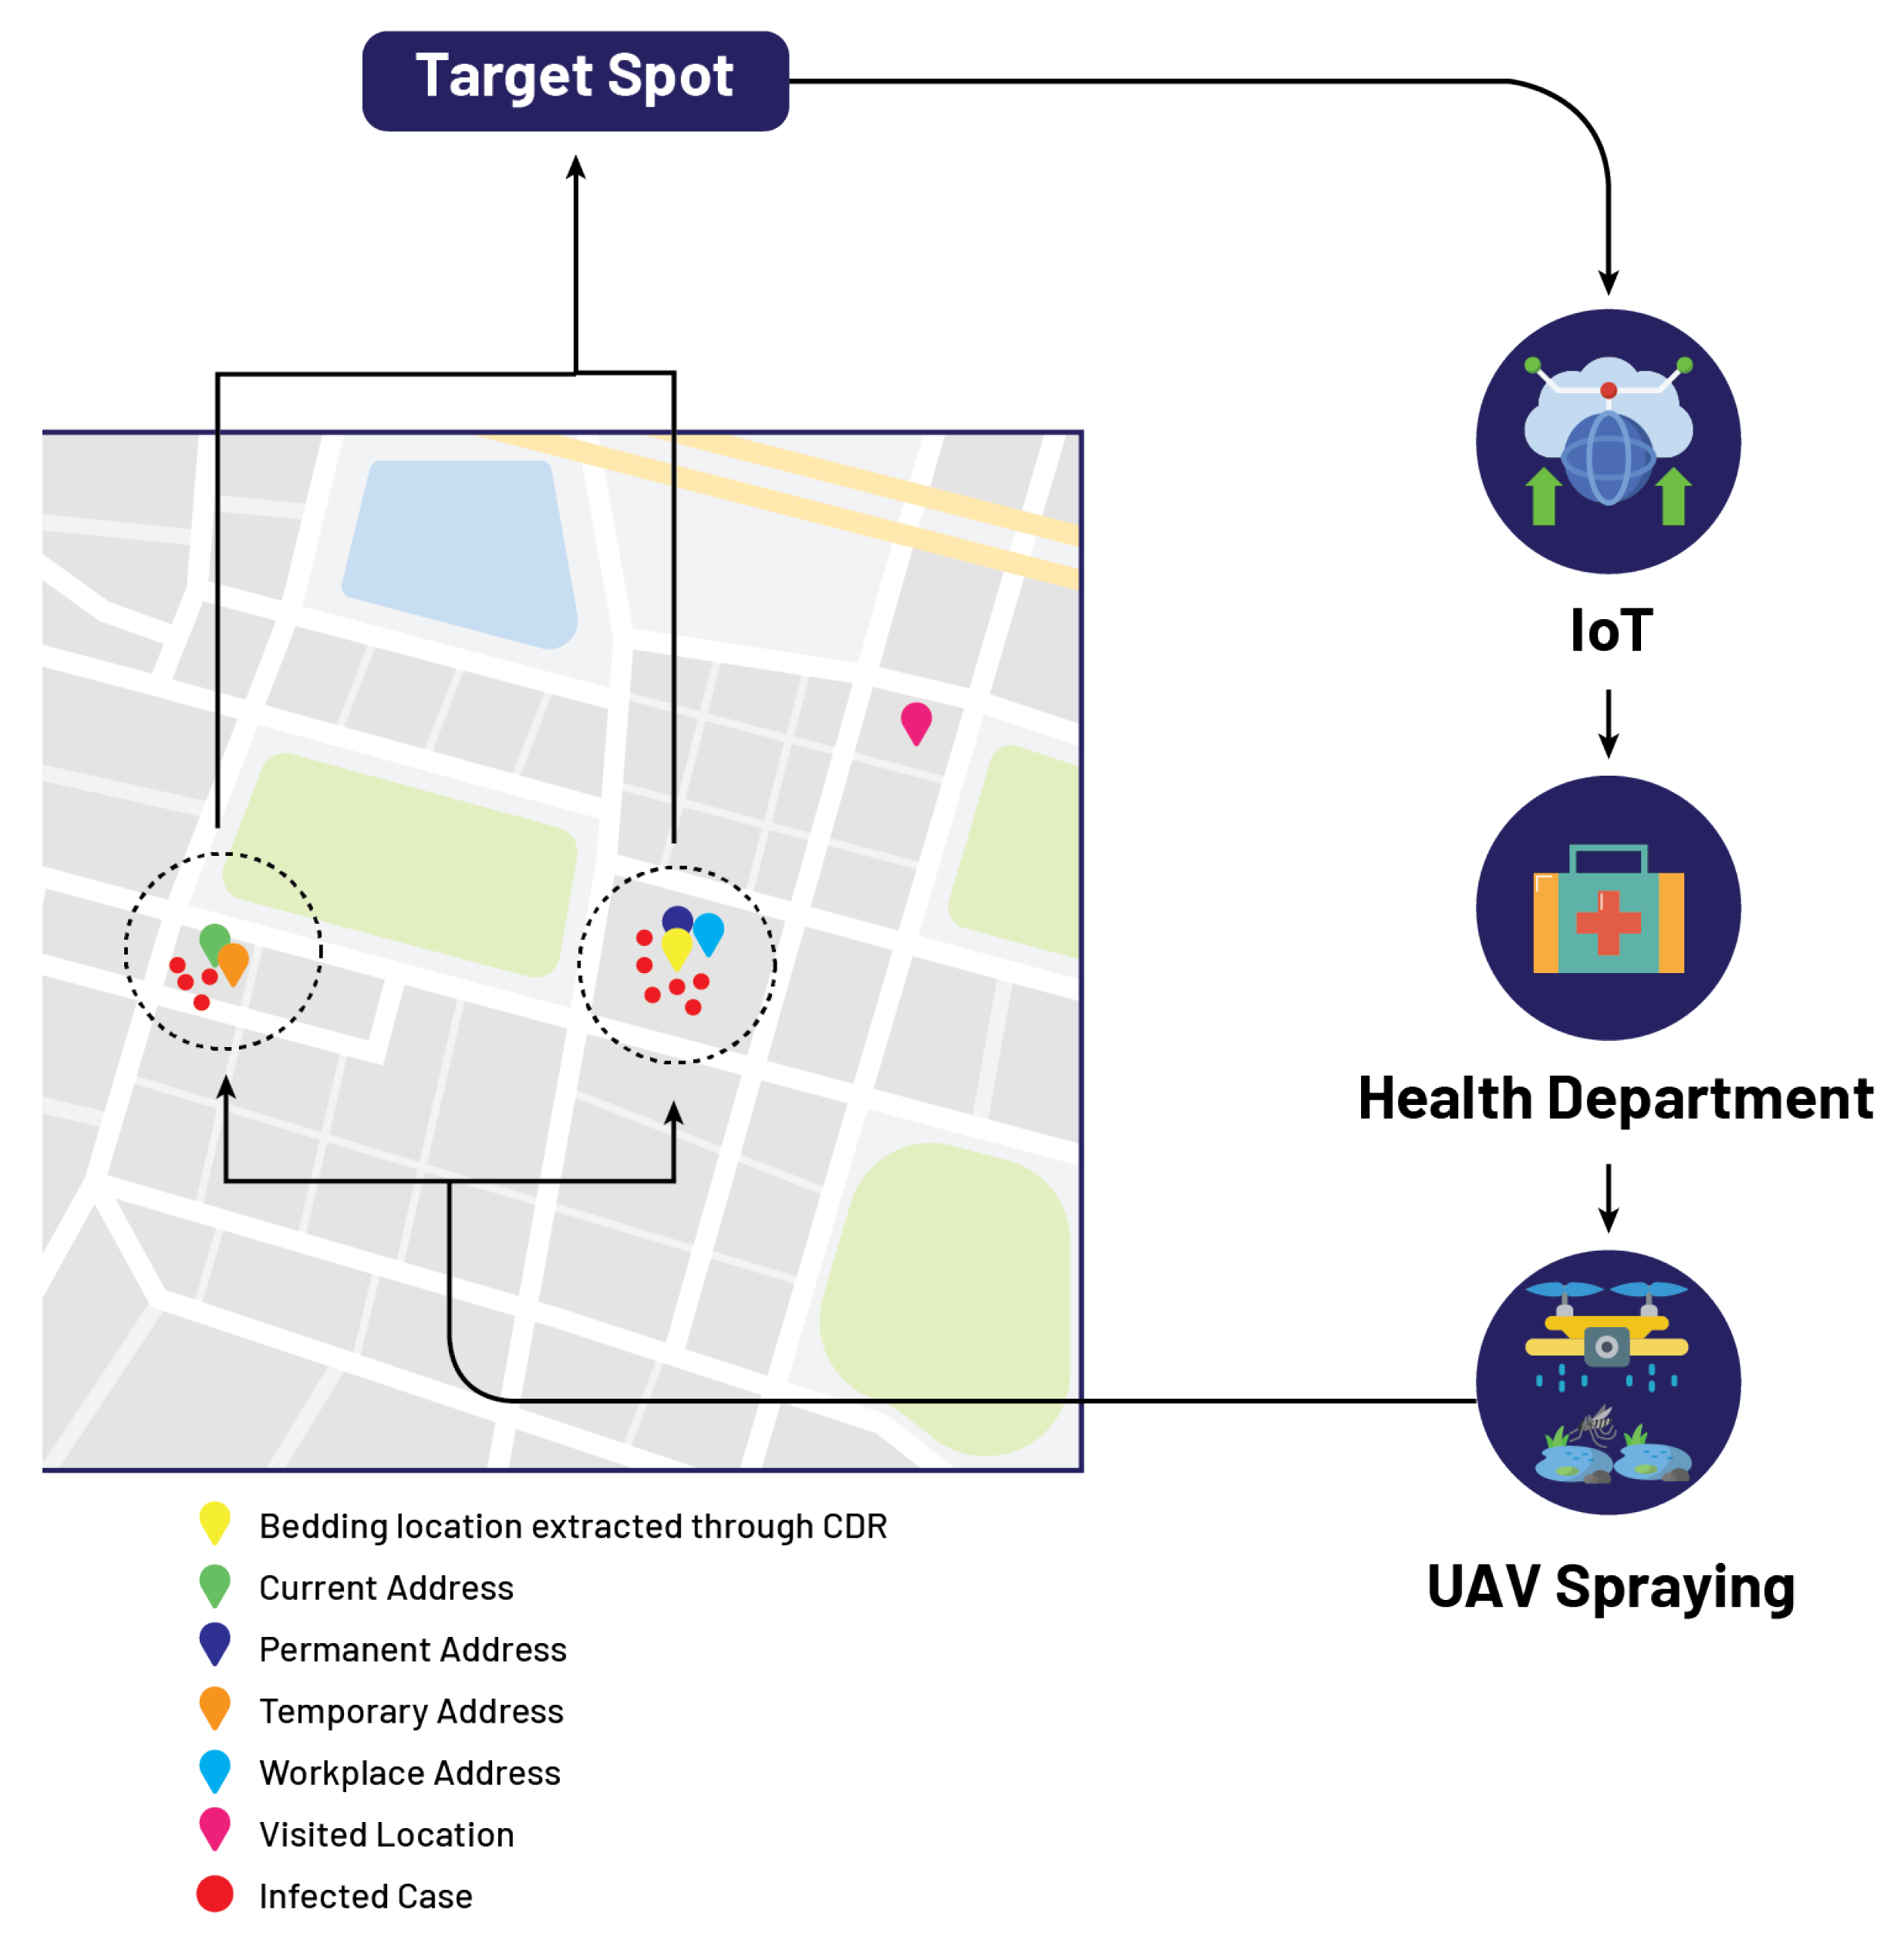
5.2. Mr. B
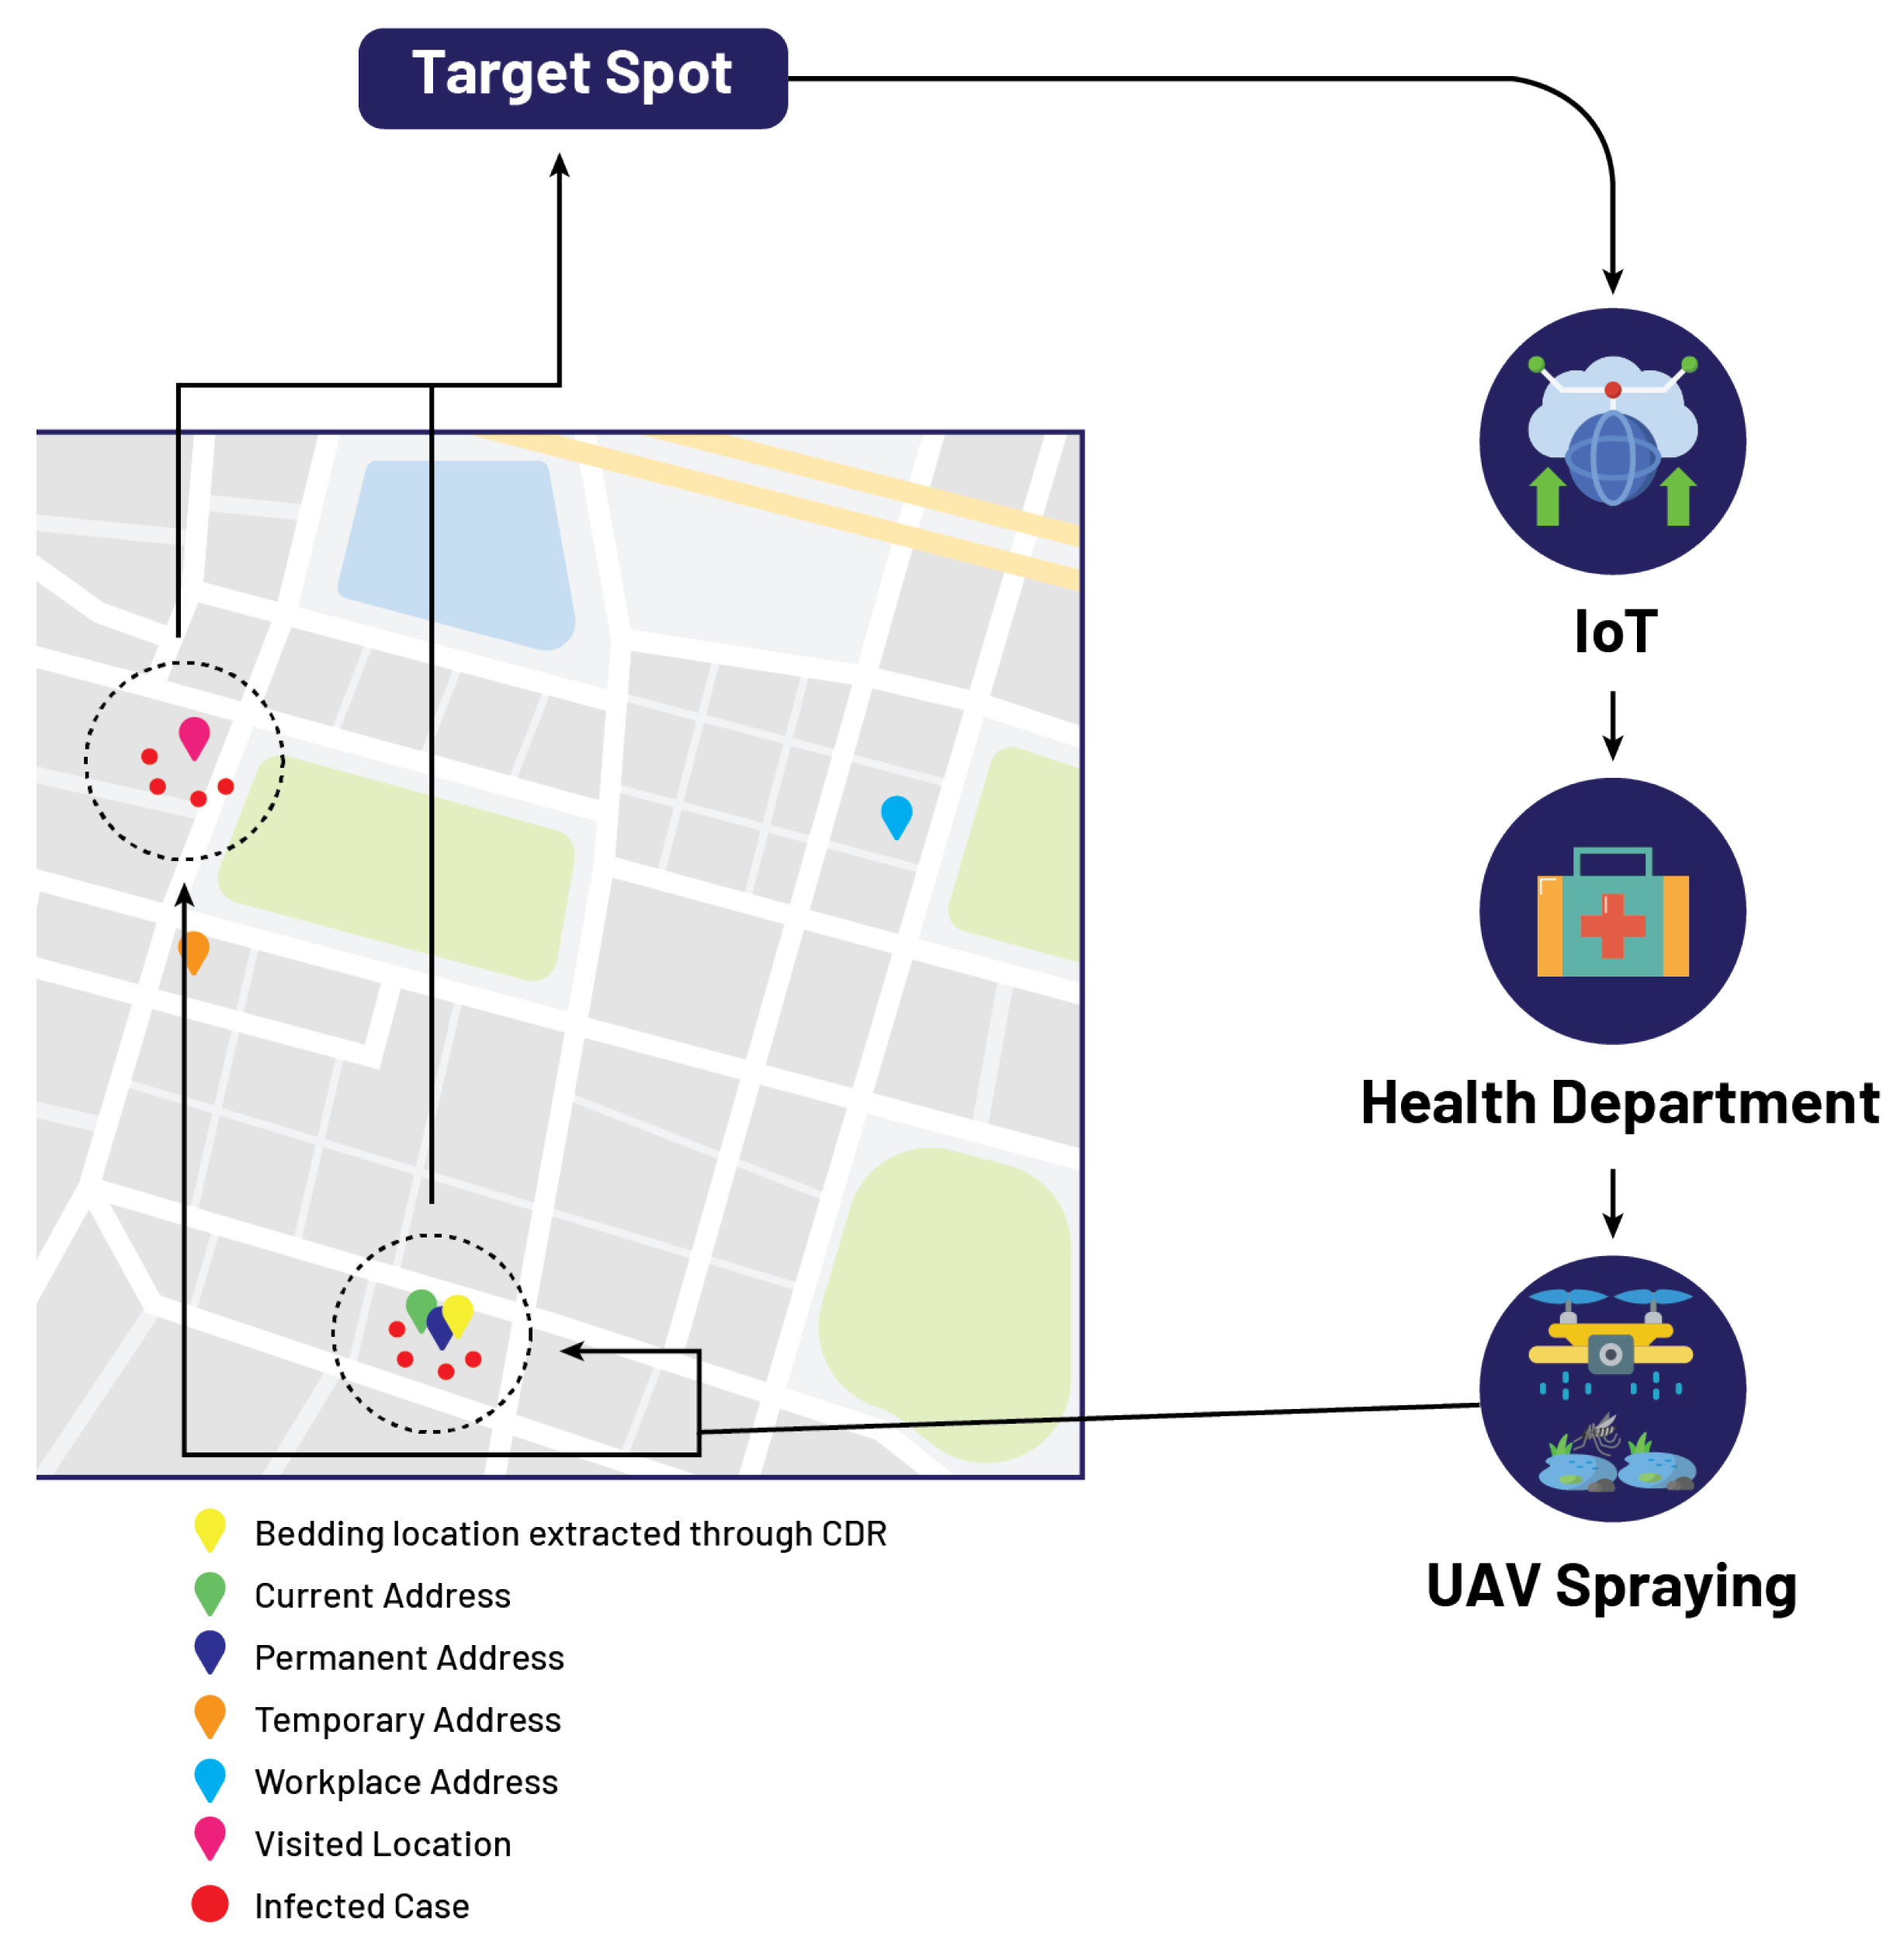
5.3. Mr. C
5.4. Mr. D
5.5. Mr. E
6. Conclusions
Author Contributions
Funding
Institutional Review Board Statement
Informed Consent Statement
Data Availability Statement
Acknowledgments
Conflicts of Interest
References
- Mukhopadhyay, S.; Kuhn, R.J.; Rossmann, M.G. A structural perspective of the flavivirus life cycle. Nat. Rev. Microbiol. 2005, 3, 13–22. [Google Scholar] [CrossRef] [PubMed]
- Gubler, D.J. Dengue and dengue hemorrhagic fever. Clin. Microbiol. Rev. 1998, 11, 480–496. [Google Scholar] [CrossRef] [PubMed]
- Holmes, E.C.; Twiddy, S.S. The origin, emergence and evolutionary genetics of dengue virus. Infect. Genet. Evol. 2003, 3, 19–28. [Google Scholar] [CrossRef]
- World Health Organization. Dengue and Severe Dengue; World Health Organization: Geneva, Switzerland.
- Araujo, R.V.; Albertini, M.R.; Costa-da Silva, A.L.; Suesdek, L.; Franceschi, N.C.S.; Bastos, N.M.; Katz, G.; Cardoso, V.A.; Castro, B.C.; Capurro, M.L.; et al. São Paulo urban heat islands have a higher incidence of dengue than other urban areas. Braz. J. Infect. Dis. 2015, 19, 146–155. [Google Scholar] [CrossRef] [PubMed]
- Centers for Disease Control and Prevention. Life Cycle: The Mosquito. Available online: https://www.cdc.gov/dengue/resources/factsheets/mosquitolifecyclefinal.pdf (accessed on 30 September 2022).
- Liyanage, P.; Tissera, H.; Sewe, M.; Quam, M.; Amarasinghe, A.; Palihawadana, P.; Wilder-Smith, A.; Louis, V.R.; Tozan, Y.; Rocklöv, J. A spatial hierarchical analysis of the temporal influences of the El Nino-southern oscillation and weather on dengue in Kalutara District, Sri Lanka. Int. J. Environ. Res. Public Health 2016, 13, 1087. [Google Scholar] [CrossRef] [PubMed]
- Hasan, S.; Jamdar, S.F.; Alalowi, M.; Al Beaiji, S.M.A.A. Dengue virus: A global human threat: Review of literature. J. Int. Soc. Prev. Community Dent. 2016, 6, 1. [Google Scholar] [CrossRef] [PubMed]
- Sabir, M.; Ali, Y.; Muhammad, N. Forecasting incidence of dengue and selecting best method for prevention. J. Pak. Med. Assoc. 2018, 68, 1383–1386. [Google Scholar]
- Word Food Programme. Pakistan Flood Impact Assessment. Available online: https://documents.wfp.org/stellent/groups/public/documents/ena/wfp225987.pdf (accessed on 30 September 2022).
- Rasheed, S.; Butlin, R.; Boots, M. A review of dengue as an emerging disease in Pakistan. Public Health 2013, 127, 11–17. [Google Scholar] [CrossRef] [PubMed]
- Chanprasopchai, P.; Pongsumpun, P.; Tang, I.M. Effect of rainfall for the dynamical transmission model of the dengue disease in Thailand. Comput. Math. Methods Med. 2017, 2017, 2541862. [Google Scholar] [CrossRef] [PubMed]
- Idrees, S.; Ashfaq, U.A. A brief review on dengue molecular virology, diagnosis, treatment and prevalence in Pakistan. Genet. Vaccines Ther. 2012, 10, 6. [Google Scholar] [CrossRef] [PubMed]
- Chan, Y.; Tan, H.; Seah, C.; Li, J.; Chow, V.; Salahuddin, N.; Khan, J. Dengue haemorrhagic fever outbreak in Karachi, Pakistan, 1994. Trans. R. Soc. Trop. Med. Hyg. 1995, 89, 619–620. [Google Scholar] [CrossRef]
- Akram, D.S.; Igarashi, A.; Takasu, T. Dengue virus infection among children with undifferentiated fever in Karachi. Indian J. Pediatr. 1998, 65, 735–740. [Google Scholar] [CrossRef] [PubMed]
- Jamil, B.; Hasan, R.; Zafar, A.; Bewley, K.; Chamberlain, J.; Mioulet, V.; Rowlands, M.; Hewson, R. Dengue virus serotype 3, Karachi, Pakistan. Emerg. Infect. Dis. 2007, 13, 182. [Google Scholar] [CrossRef] [PubMed]
- Khan, E.; Hasan, R.; Mehraj, V.; Nasir, A.; Siddiqui, J.; Hewson, R. Co-circulations of two genotypes of dengue virus in 2006 out-break of dengue hemorrhagic fever in Karachi, Pakistan. J. Clin. Virol. 2008, 43, 176–179. [Google Scholar] [CrossRef] [PubMed]
- Fatima, Z.; Idrees, M.; Bajwa, M.A.; Tahir, Z.; Ullah, O.; Zia, M.Q.; Hussain, A.; Akram, M.; Khubaib, B.; Afzal, S.; et al. Serotype and genotype analysis of dengue virus by sequencing followed by phylogenetic analysis using samples from three mini outbreaks-2007-2009 in Pakistan. BMC Microbiol. 2011, 11, 200. [Google Scholar] [CrossRef]
- Alexander, R.; Alexander, M. An ICT-based real-time surveillance system for controlling dengue in Sri Lanka. arXiv 2014, arXiv:1405.4092. [Google Scholar]
- Isere, E.E.; Fatiregun, A.A.; Ajayi, I.O. An overview of disease surveillance and notification system in Nigeria and the roles of clinicians in disease outbreak prevention and control. Niger. Med. J. J. Niger. Med. Assoc. 2015, 56, 161. [Google Scholar] [CrossRef]
- Ibrahim, N.; Quan, T.W. The development of multi-platforms application for dengue-entomological surveillance system. In Proceedings of the 2017 6th ICT International Student Project Conference (ICT-ISPC), Johor, Malaysia, 23–24 May 2017; pp. 1–4. [Google Scholar]
- Minhas, K.; Tabassam, M.; Rasheed, R.; Abbas, A.; Khattak, H.A.; Khan, S.U. A framework for dengue surveillance and data collection in pakistan. In Proceedings of the 2019 IEEE 43rd Annual Computer Software and Applications Conference (COMPSAC), Milwaukee, WI, USA, 15–19 July 2019; Volume 2, pp. 275–280. [Google Scholar]
- Coelho, G.E.; Leal, P.L.; Cerroni, M.d.P.; Simplicio, A.C.R.; Siqueira, J.B., Jr. Sensitivity of the dengue surveillance system in Brazil for detecting hospitalized cases. PLoS Negl. Trop. Dis. 2016, 10, e0004705. [Google Scholar] [CrossRef]
- Richard Chen, M. Radiology data mining applications using imaging informatics. Data Min. Med. Biol. Res. 2008, 6, 107–118. [Google Scholar]
- Yuksel, M.; Dogac, A. Interoperability of medical device information and the clinical applications: An HL7 RMIM based on the ISO/IEEE 11073 DIM. IEEE Trans. Inf. Technol. Biomed. 2011, 15, 557–566. [Google Scholar] [CrossRef]
- Eggebraaten, T.J.; Tenner, J.W.; Dubbels, J.C. A health-care data model based on the HL7 Reference Information Model. IBM Syst. J. 2007, 46, 5–18. [Google Scholar] [CrossRef]
- Calamai, R.; Giarre, L. Enabling primary and specialist care interoperability through HL7 CDA release 2 and the Chronic Care Model: An Italian case Study. IEEE Trans. Syst. Man Cybern.-Part Syst. Humans 2012, 42, 1364–1384. [Google Scholar] [CrossRef]
- Johnson, G.; Ishikawa, C.; Zwickl, R.; Minami, M.; Kass-Hout, T.; Streichert, L. Electronic Syndromic Surveillance Using Hospital Inpatient and Ambulatory Clinical Care Electronic Health Record Data: Recommendations From the ISDS Meaningful Use Workgroup. Online J. Public Health Inform. 2013, 5, e53. [Google Scholar] [CrossRef]
- National Syndromic Surveillance Program. Final Recommendation: Core Processes and Ehr Requirements for Public Health Syndromic Surveillance, Knowledge Repository. 2011. Available online: https://knowledgerepository.syndromicsurveillance.org/author/isds (accessed on 17 October 2017).
- Angula, N.; Dlodlo, N. A standard approach to enabling the semantic interoperability of disease surveillance data in health information systems: A case of namibia. In Proceedings of the 2018 International Conference on Advances in Big Data, Computing and Data Communication Systems (icABCD), Durban, South Africa, 6–7 August 2018; pp. 1–8. [Google Scholar]
- Bellandi, V.; Ceravolo, P.; Damiani, E.; Siccardi, S. Smart Healthcare, IoT and Machine Learning: A Complete Survey. In Handbook of Artificial Intelligence in Healthcare; Springer: Berlin/Heidelberg, Germany, 2022; pp. 307–330. [Google Scholar]
- Ardagna, C.A.; Bellandi, V.; Damiani, E.; Bezzi, M.; Hebert, C. Big Data Analytics-as-a-Service: Bridging the gap between security experts and data scientists. Comput. Electr. Eng. 2021, 93, 107215. [Google Scholar] [CrossRef]
- Caroline, B.; Christian, B.; Stephan, B.; Luis, B.; Giuseppe, D.; Damiani, E.; Sven, H.; Caroline, L.; Jochen, M.; Nguyen, D.C.; et al. Artificial Intelligence Cybersecurity Challenges. Threat Landscape for Artificial Intelligence. 2020. Available online: https://www.enisa.europa.eu/publications/artificial-intelligence-cybersecurity-challenges (accessed on 30 September 2022).
- Hoffman, R.A.; Wu, H.; Venugopalan, J.; Braun, P.; Wang, M.D. Intelligent mortality reporting with FHIR. IEEE J. Biomed. Health Inform. 2018, 22, 1583–1588. [Google Scholar] [CrossRef] [PubMed]
- Rajeev, D.; Staes, C.; Evans, R.S.; Price, A.; Hill, M.; Mottice, S.; Risk, I.; Rolfs, R. Evaluation of HL7 v2. 5.1 electronic case reports transmitted from a healthcare enterprise to public health. AMIA Annu. Symp. Proc. 2011, 2011, 1144. [Google Scholar]
- Huang, E.W.; Liou, D.M. Performance analysis of a medical record exchanges model. IEEE Trans. Inf. Technol. Biomed. 2007, 11, 153–160. [Google Scholar] [CrossRef] [PubMed]
- Runge-Ranzinger, S.; McCall, P.J.; Kroeger, A.; Horstick, O. Dengue disease surveillance: An updated systematic literature review. Trop. Med. Int. Health 2014, 19, 1116–1160. [Google Scholar] [CrossRef]
- Racloz, V.; Ramsey, R.; Tong, S.; Hu, W. Surveillance of dengue fever virus: A review of epidemiological models and early warning systems. PLoS Negl. Trop. Dis. 2012, 6, e1648. [Google Scholar] [CrossRef]
- Chang, A.Y.; Fuller, D.O.; Carrasquillo, O.; Beier, J.C. Social justice, climate change, and dengue. Health Hum. Rights J. 2014, 16, 93. [Google Scholar]
- Rabaa, M.; Klungthong, C.; Yoon, I.K.; Holmes, E.; Chinnawirotpisan, P.; Thaisomboonsuk, B.; Rothman, A.; Tannitisupawong, D.; Aldstadt, J.; Nisalak, A.; et al. Frequent in-migration and highly focal transmission of dengue viruses among children in Kamphaeng Phet, Thailand. Int. J. Infect. Dis. 2012, 16, e90–e91. [Google Scholar] [CrossRef][Green Version]
- Roslan, N.S.; Abd Latif, Z.; Dom, N.C. Dengue cases distribution based on land surface temperature and elevation. In Proceedings of the 2016 7th IEEE Control and System Graduate Research Colloquium (ICSGRC), Shah Alam, Malaysia, 8 August 2016; pp. 87–91. [Google Scholar]
- Massaro, E.; Kondor, D.; Ratti, C. Assessing the interplay between human mobility and mosquito borne diseases in urban environments. Sci. Rep. 2019, 9, 16911. [Google Scholar] [CrossRef] [PubMed]
- Nevai, A.L.; Soewono, E. A model for the spatial transmission of dengue with daily movement between villages and a city. Math. Med. Biol. J. IMA 2014, 31, 150–178. [Google Scholar] [CrossRef] [PubMed]
- Wesolowski, A.; Qureshi, T.; Boni, M.F.; Sundsøy, P.R.; Johansson, M.A.; Rasheed, S.B.; Engø-Monsen, K.; Buckee, C.O. Impact of human mobility on the emergence of dengue epidemics in Pakistan. Proc. Natl. Acad. Sci. USA 2015, 112, 11887–11892. [Google Scholar] [CrossRef]
- Morin, C.W.; Comrie, A.C.; Ernst, K. Climate and dengue transmission: Evidence and implications. Environ. Health Perspect. 2013, 121, 1264–1272. [Google Scholar] [CrossRef]
- Lai, Y.H. The climatic factors affecting dengue fever outbreaks in southern Taiwan: An application of symbolic data analysis. Biomed. Eng. Online 2018, 17, 148. [Google Scholar] [CrossRef]
- Choi, Y.; Tang, C.S.; McIver, L.; Hashizume, M.; Chan, V.; Abeyasinghe, R.R.; Iddings, S.; Huy, R. Effects of weather factors on dengue fever incidence and implications for interventions in Cambodia. BMC Public Health 2016, 16, 241. [Google Scholar] [CrossRef]
- Ehelepola, N.; Ariyaratne, K.; Buddhadasa, W.; Ratnayake, S.; Wickramasinghe, M. A study of the correlation between dengue and weather in Kandy City, Sri Lanka (2003–2012) and lessons learned. Infect. Dis. Poverty 2015, 4, 42. [Google Scholar] [CrossRef]
- Hashizume, M.; Dewan, A.M.; Sunahara, T.; Rahman, M.Z.; Yamamoto, T. Hydroclimatological variability and dengue transmission in Dhaka, Bangladesh: A time-series study. BMC Infect. Dis. 2012, 12, 98. [Google Scholar] [CrossRef]
- Karthik, L.; Kumar, G.; Keswani, T.; Bhattacharyya, A.; Chandar, S.S.; Bhaskara Rao, K. Protease inhibitors from marine actinobacteria as a potential source for antimalarial compound. PLoS ONE 2014, 9, e90972. [Google Scholar] [CrossRef]
- Yuan, H.Y.; Liang, J.; Lin, P.S.; Sucipto, K.; Tsegaye, M.M.; Wen, T.H.; Pfeiffer, S.; Pfeiffer, D. The effects of seasonal climate variability on dengue annual incidence in Hong Kong: A modelling study. Sci. Rep. 2020, 10, 4297. [Google Scholar] [CrossRef] [PubMed]
- Kakarla, S.G.; Caminade, C.; Mutheneni, S.R.; Morse, A.P.; Upadhyayula, S.M.; Kadiri, M.R.; Kumaraswamy, S. Lag effect of climatic variables on dengue burden in India. Epidemiol. Infect. 2019, 147, e170. [Google Scholar] [CrossRef] [PubMed]
- Polwiang, S. The correlation of climate factors on dengue transmission in urban area: Bangkok and Singapore cases. PeerJ 2016, 4, e2322v1. [Google Scholar]
- Atique, S.; Abdul, S.S.; Hsu, C.Y.; Chuang, T.W. Meteorological influences on dengue transmission in Pakistan. Asian Pac. J. Trop. Med. 2016, 9, 954–961. [Google Scholar] [CrossRef] [PubMed]
- Hernández-Ávila, J.E.; Rodríguez, M.H.; Santos-Luna, R.; Sánchez-Castañeda, V.; Román-Pérez, S.; Ríos-Salgado, V.H.; Salas-Sarmiento, J.A. Nation-wide, web-based, geographic information system for the integrated surveillance and control of dengue fever in Mexico. PLoS ONE 2013, 8, e70231. [Google Scholar] [CrossRef]
- Ahmad, S.; Asif, M.; Talib, R.; Adeel, M.; Yasir, M.; Chaudary, M.H. Surveillance of intensity level and geographical spreading of dengue outbreak among males and females in Punjab, Pakistan: A case study of 2011. J. Infect. Public Health 2018, 11, 472–485. [Google Scholar] [CrossRef]
- Chang, A.Y.; Parrales, M.E.; Jimenez, J.; Sobieszczyk, M.E.; Hammer, S.M.; Copenhaver, D.J.; Kulkarni, R.P. Combining Google Earth and GIS mapping technologies in a dengue surveillance system for developing countries. Int. J. Health Geogr. 2009, 8, 49. [Google Scholar] [CrossRef]
- Davi, C.; Pastor, A.; Oliveira, T.; de Lima Neto, F.B.; Braga-Neto, U.; Bigham, A.W.; Bamshad, M.; Marques, E.T.; Acioli-Santos, B. Severe dengue prognosis using human genome data and machine learning. IEEE Trans. Biomed. Eng. 2019, 66, 2861–2868. [Google Scholar] [CrossRef]
- Siriyasatien, P.; Chadsuthi, S.; Jampachaisri, K.; Kesorn, K. Dengue epidemics prediction: A survey of the state-of-the-art based on data science processes. IEEE Access 2018, 6, 53757–53795. [Google Scholar] [CrossRef]
- Appice, A.; Gel, Y.R.; Iliev, I.; Lyubchich, V.; Malerba, D. A multi-stage machine learning approach to predict dengue incidence: A case study in Mexico. IEEE Access 2020, 8, 52713–52725. [Google Scholar] [CrossRef]
- Mudele, O.; Bayer, F.M.; Zanandrez, L.F.; Eiras, A.E.; Gamba, P. Modeling the Temporal Population Distribution of Ae. aegypti Mosquito Using Big Earth Observation Data. IEEE Access 2020, 8, 14182–14194. [Google Scholar] [CrossRef]
- Sasongko, P.S.; Wibawa, H.A.; Maulana, F.; Bahtiar, N. Performance comparison of artificial neural network models for dengue fever disease detection. In Proceedings of the 2017 1st International Conference on Informatics and Computational Sciences (ICICoS), Semarang, Indonesia, 15–16 November 2017; pp. 183–188. [Google Scholar]
- Liu, C.; Liu, Q.; Lin, H.; Xin, B.; Nie, J. Spatial analysis of dengue fever in Guangdong Province, China, 2001–2006. Asia Pac. J. Public Health 2014, 26, 58–66. [Google Scholar] [CrossRef] [PubMed]
- Yajid, M.Z.M.; Che Dom, N.; Camalxaman, S.N.; Nasir, R.A. Spatial-temporal analysis for identification of dengue risk area in Melaka Tengah district. Geocarto Int. 2020, 35, 1570–1579. [Google Scholar] [CrossRef]
- Sanna, M.; Hsieh, Y.H. Temporal patterns of dengue epidemics: The case of recent outbreaks in Kaohsiung. Asian Pac. J. Trop. Med. 2017, 10, 292–298. [Google Scholar] [CrossRef]
- Sharma, K.D.; Mahabir, R.S.; Curtin, K.M.; Sutherland, J.M.; Agard, J.B.; Chadee, D.D. Exploratory space-time analysis of dengue incidence in Trinidad: A retrospective study using travel hubs as dispersal points, 1998–2004. Parasites Vectors 2014, 7, 341. [Google Scholar] [CrossRef] [PubMed]
- Hamer, D.; Lichtveld, M. Spatial distribution of epidemiological cases of dengue fever in Suriname, 2001–2012. West Indian Med. J. 2015, 64, 344. [Google Scholar] [PubMed]
- Lee, G.O.; Vasco, L.; Márquez, S.; Zuniga-Moya, J.C.; Van Engen, A.; Uruchima, J.; Ponce, P.; Cevallos, W.; Trueba, G.; Trostle, J.; et al. A dengue outbreak in a rural community in Northern Coastal Ecuador: An analysis using unmanned aerial vehicle mapping. PLoS Negl. Trop. Dis. 2021, 15, e0009679. [Google Scholar] [CrossRef] [PubMed]
- AragÃ, F.V.; Zola, F.C.; Marinho, L.H.N.; de Genaro Chiroli, D.M.; Junior, A.B. Choice of unmanned aerial vehicles for identification of mosquito breeding sites. Geospat. Health 2020. [Google Scholar] [CrossRef]
- Cunha, H.S.; Sclauser, B.S.; Wildemberg, P.F.; Fernandes, E.A.M.; Dos Santos, J.A.; Lage, M.d.O.; Lorenz, C.; Barbosa, G.L.; Quintanilha, J.A.; Chiaravalloti-Neto, F. Water tank and swimming pool detection based on remote sensing and deep learning: Relationship with socioeconomic level and applications in dengue control. PLoS ONE 2021, 16, e0258681. [Google Scholar] [CrossRef] [PubMed]
- Amarasinghe, A.; Suduwella, C.; Niroshan, L.; Elvitigala, C.; De Zoysa, K.; Keppetiyagama, C. Suppressing dengue via a drone system. In Proceedings of the 2017 Seventeenth International Conference on Advances in ICT for Emerging Regions (ICTer), Colombo, Sri Lanka, 6–9 September 2017; pp. 1–7. [Google Scholar]
- Amarasinghe, A.; Wijesuriya, V.B. Drones vs Dengue: A Drone-Based Mosquito Control System for Preventing Dengue. In Proceedings of the 2020 RIVF International Conference on Computing and Communication Technologies (RIVF), Ho Chi Minh City, Vietnam, 14–15 October 2020; pp. 1–6. [Google Scholar]
- Dias, T.; Alves, V.; Alves, H.; Pinheiro, L.; Pontes, R.; Araujo, G.; Lima, A.; Prego, T. Autonomous detection of mosquito-breeding habitats using an unmanned aerial vehicle. In Proceedings of the 2018 Latin American Robotic Symposium, 2018 Brazilian Symposium on Robotics (SBR) and 2018 Workshop on Robotics in Education (WRE), Joao Pessoa, Brazil, 6–10 November 2018; pp. 351–356. [Google Scholar]
- Bravo, D.T.; Lima, G.A.; Alves, W.A.L.; Colombo, V.P.; Djogbenou, L.; Pamboukian, S.V.D.; Quaresma, C.C.; de Araujo, S.A. Automatic detection of potential mosquito breeding sites from aerial images acquired by unmanned aerial vehicles. Comput. Environ. Urban Syst. 2021, 90, 101692. [Google Scholar] [CrossRef]
- Ahmad, S.; Asif, M.; Majid, M.; Iqbal, M.; Adeel, M. An effective study of geographical pattern and intensity of dengue outbreak among males in punjab, Pakistan. LIFE Int. J. Health Life Sci. 2018, 3, 117–137. [Google Scholar] [CrossRef][Green Version]
- Baig, L.A. Outbreak of dengue fever in pakistan and its prevention. Ann. Jinnah Sindh Med. Univ. 2019, 5, 99. [Google Scholar]
- Bostan, N.; Javed, S.; Eqani, S.A.M.A.S.; Tahir, F.; Bokhari, H. Dengue fever virus in Pakistan: Effects of seasonal pattern and temperature change on distribution of vector and virus. Rev. Med. Virol. 2017, 27, e1899. [Google Scholar] [CrossRef] [PubMed]
- Ahmad, S.; Aziz, M.A.; Aftab, A.; Ullah, Z.; Ahmad, M.I.; Mustan, A. Epidemiology of dengue in Pakistan, present prevalence and guidelines for future control. Int. J. Mosq. Res. 2017, 4, 25–32. [Google Scholar]
- Murad, D.; Badshah, N.; Ali, S.M. Mathematical approach for the dengue fever transmission dynamics. In Proceedings of the 2018 International Conference on Applied and Engineering Mathematics (ICAEM), Taxila, Pakistan, 4–5 September 2018; pp. 1–5. [Google Scholar]
- Murad, D.; Badshah, N.; Ali, S.M. Mathematical modeling and simulation for the dengue fever epidemic. In Proceedings of the 2018 International Conference on Applied and Engineering Mathematics (ICAEM), Taxila, Pakistan, 4–5 September 2018; pp. 1–3. [Google Scholar]
- Shabbir, W.; Pilz, J. Bayesian spatio-temporal analysis for dengue fever in major cities of Pakistan. In Proceedings of the 12th RSEP International Social Sciences Conference, Barcelona, Spain, 23–25 April 2019. [Google Scholar]
- Nisar, S.; Zuhaib, M.A.; Ulasyar, A.; Tariq, M. A Privacy Preserved and Cost Efficient Control Scheme for Coronavirus Outbreak Using Call Data Record and Contact Tracing. IEEE Consum. Electron. Mag. 2020, 10, 104–110. [Google Scholar] [CrossRef]
- Nisar, S.; Zuhaib, M.A.; Ulasyar, A.; Tariq, M. A robust tracking system for COVID-19 like pandemic using advanced hybrid technologies. Computing 2020. [Google Scholar] [CrossRef]
- Nisar, S.; Wakeel, A.; Tahir, W.; Tariq, M. Minimizing Viral Transmission in COVID-19 Like Pandemics: Technologies, Challenges, and Opportunities. IEEE Sens. J. 2022. [Google Scholar] [CrossRef]
- Perez, J. Innovating to Fight COVID-19: Four Ways Drones are Contributing. DJI Enterp. Blog 2020, 1, 1–2. [Google Scholar]
- Sharma, M. How drones are being used to combat COVID-19. Geospat. World 2020, 4, 1–3. [Google Scholar]
- Sedov, L.; Krasnochub, A.; Polishchuk, V. Modeling quarantine during epidemics and mass-testing using drones. PLoS ONE 2020, 15, e0235307. [Google Scholar] [CrossRef] [PubMed]
- McNabb, M. Drone Delivery for Coronavirus: Drone Delivers Test Samples to Lab in 7 Minutes. WeRobotics. 2020. Available online: https://dronelife.com/2020/06/04/drone-delivery-for-coronavirus-in-germany (accessed on 4 June 2020).
- Holroyd, M. Coronavirus: Italy Approves Use of Drones to Monitor Social Distancing, Euronews. 2020. Available online: https://www.euronews.com/2020/03/23/coronavirus-italy-approves-use-of-drones-to-monitor-social-distancing (accessed on 23 March 2020).
- Jakhar, P. Coronavirus: China’s Tech Fights Back’. BBC News, 3 March 2020. [Google Scholar]
- Google; Apple. Exposure notifications: Helping fight COVID-19. FRBSF Econ. Lett. 2020, 14, 1–5. [Google Scholar]


| Reference | Research Focus |
|---|---|
| [68] | In this study, the authors considered several data streams to check spatial risk factors linked with dengue, associated maps gathered through UAV and the active surveillance of febrile cases. They investigated risk factors for symptomatic dengue infection in household proximity to public areas. |
| [69] | The prime motive of this study was to investigate the most suitable UAV to identify Ae. Aegypti habitants through aerial images of mosquito breeding sites. They used various approaches and discussed methodologies to characterize and select the most appropriate UAV for the aerial mapping of mosquito breeding sites. |
| [70] | The key objective of this study was to use deep learning (DL) and sensing techniques on aerial images for the detection of water tanks and swimming pools in order to control dengue. |
| [71] | This study proposed a novel approach for the identification of mosquito breeding sites through drone images. The proposed mechanism generates a map by capturing images of the water retention using a drone. It provides satisfactory accuracy to identify possible water retention areas and produces the final results on the basis of the effect of shadow and the drone camera tilt angle. |
| [72] | This study presented a UAV-based mosquito control approach that is capable of identifying mosquito breeding grounds, such as small-scale standing water bodies through drones and considering appropriate measures to stop the spread of mosquito population. |
| [73] | This study proposes a novel smart system for the identification of mosquito breeding habitants in man-made scenarios. To support the main objective of this study, a UAV was used to gather different configurations of aerial images to develop a database. The database was precisely annotated, and the collected images were used to test and train the proposed system. The authors used random forest as the classification algorithm for identification purposes. The overall obtained results reached a global hit rate above 99 percent for tire and water. Considering the limitation of UAV in the real-time high-resolution video scenario, the proposed system was used off-line. |
| [74] | This study focuses on computational mechanisms for the automatic identification of objects or scenarios considered mosquito breeding sites through drone aerial images. These mechanisms were designed through convolutional neural networks. |
| Reference | Pandemic | Application(s) | UAVs in Dengue |
|---|---|---|---|
| [85] | COVID-19 | Spray Drone | ✘ |
| [86] | COVID-19 | Spray Drone | ✘ |
| [87] | COVID-19 | Delivery Drone | ✘ |
| [88] | COVID-19 | Delivery Drone | ✘ |
| [89] | COVID-19 | Surveillance Drone | ✘ |
| [90] | COVID-19 | Surveillance Sensor Drone | ✘ |
| Our Work | Dengue Virus | Spray Drone | ✔ |
| Name | Cell Number | Current Address | Permanent Address Bedding Location | Temporary Address | Workplace Address | Visited Location | Bedding Location (CDR) |
|---|---|---|---|---|---|---|---|
| ABC | 033312345678 | 11.00°, 22.00° | 12.00°, 23.00° | 13.00°, 24.00° | 14.00°, 25.00° | 15.00°, 26.00° | 11.00°, 22.00° |
| Name | Cell Number | Current Address | Permanent Address Bedding Location | Temporary Address | Workplace Address | Visited Location | Bedding location (CDR) |
|---|---|---|---|---|---|---|---|
| Mr. A | 03313321024 | 33.48°, 73.10° | 33.48°, 73.10° | 33.48°, 73.10° | 33.48°, 73.10° | 33.48°, 73.10° | 33.48°, 73.10° |
| Name | Cell Number | Current Address | Permanent Address Bedding Location | Temporary Address | Workplace Address | Visited Location | Bedding Location (CDR) |
|---|---|---|---|---|---|---|---|
| Mr. B | 03312345678 | 33.57°, 73.06° | 33.57°, 73.06° | 33.99°, 71.48° | 33.57°, 73.06° | 33.99°, 71.48° | 33.57°, 73.06° |
| Name | Cell Number | Current Address | Permanent Address Bedding Location | Temporary Address | Workplace Address | Visited Location | Bedding Location (CDR) |
|---|---|---|---|---|---|---|---|
| Mr. C | 03342345678 | 33.47°, 73.07° | 33.47°, 73.07° | 31.86°, 70.90° | 33.57°, 73.06° | 31.86°, 70.90° | 31.86°, 70.90° |
| Name | Cell Number | Current Address | Permanent Address Bedding Location | Temporary Address | Workplace Address | Visited Location | Bedding Location (CDR) |
|---|---|---|---|---|---|---|---|
| Mr. D | 033312345678 | 34.12°, 72.46° | 33.57°, 73.06° | 34.12°, 72.46° | 33.57°, 73.06° | 34.01°, 71.52° | 33.57°, 73.06° |
| Name | Cell Number | Current Address | Permanent Address Bedding Location | Temporary Address | Workplace Address | Visited Location | Bedding Location (CDR) |
|---|---|---|---|---|---|---|---|
| Mr. E | 031487654321 | 33.57°, 73.06° | 33.57°, 73.06° | 34.12°, 72.46° | 33.56°, 73.01° | 3.57°, 73.06° | 34.01°, 71.52° |
Publisher’s Note: MDPI stays neutral with regard to jurisdictional claims in published maps and institutional affiliations. |
© 2022 by the authors. Licensee MDPI, Basel, Switzerland. This article is an open access article distributed under the terms and conditions of the Creative Commons Attribution (CC BY) license (https://creativecommons.org/licenses/by/4.0/).
Share and Cite
Ali, A.; Nisar, S.; Khan, M.A.; Mohsan, S.A.H.; Noor, F.; Mostafa, H.; Marey, M. A Privacy-Preserved Internet-of-Medical-Things Scheme for Eradication and Control of Dengue Using UAV. Micromachines 2022, 13, 1702. https://doi.org/10.3390/mi13101702
Ali A, Nisar S, Khan MA, Mohsan SAH, Noor F, Mostafa H, Marey M. A Privacy-Preserved Internet-of-Medical-Things Scheme for Eradication and Control of Dengue Using UAV. Micromachines. 2022; 13(10):1702. https://doi.org/10.3390/mi13101702
Chicago/Turabian StyleAli, Amir, Shibli Nisar, Muhammad Asghar Khan, Syed Agha Hassnain Mohsan, Fazal Noor, Hala Mostafa, and Mohamed Marey. 2022. "A Privacy-Preserved Internet-of-Medical-Things Scheme for Eradication and Control of Dengue Using UAV" Micromachines 13, no. 10: 1702. https://doi.org/10.3390/mi13101702
APA StyleAli, A., Nisar, S., Khan, M. A., Mohsan, S. A. H., Noor, F., Mostafa, H., & Marey, M. (2022). A Privacy-Preserved Internet-of-Medical-Things Scheme for Eradication and Control of Dengue Using UAV. Micromachines, 13(10), 1702. https://doi.org/10.3390/mi13101702