
A New Predictive Technology for Perinatal Stem Cell Isolation Suited for Cell Therapy Approaches

 ,
, 

 and
and 
Abstract
:1. Introduction
2. Materials and Methods
2.1. Instrumentation
2.1.1. Fractionation Principle and Procedure
2.1.2. Optical Analysis
2.2. Cell Analysis and Collection
2.3. Isolation of Human Amniotic Epithelial Cells (AECs)
2.4. Downstream Analysis
2.5. Statistical Analysis
3. Results
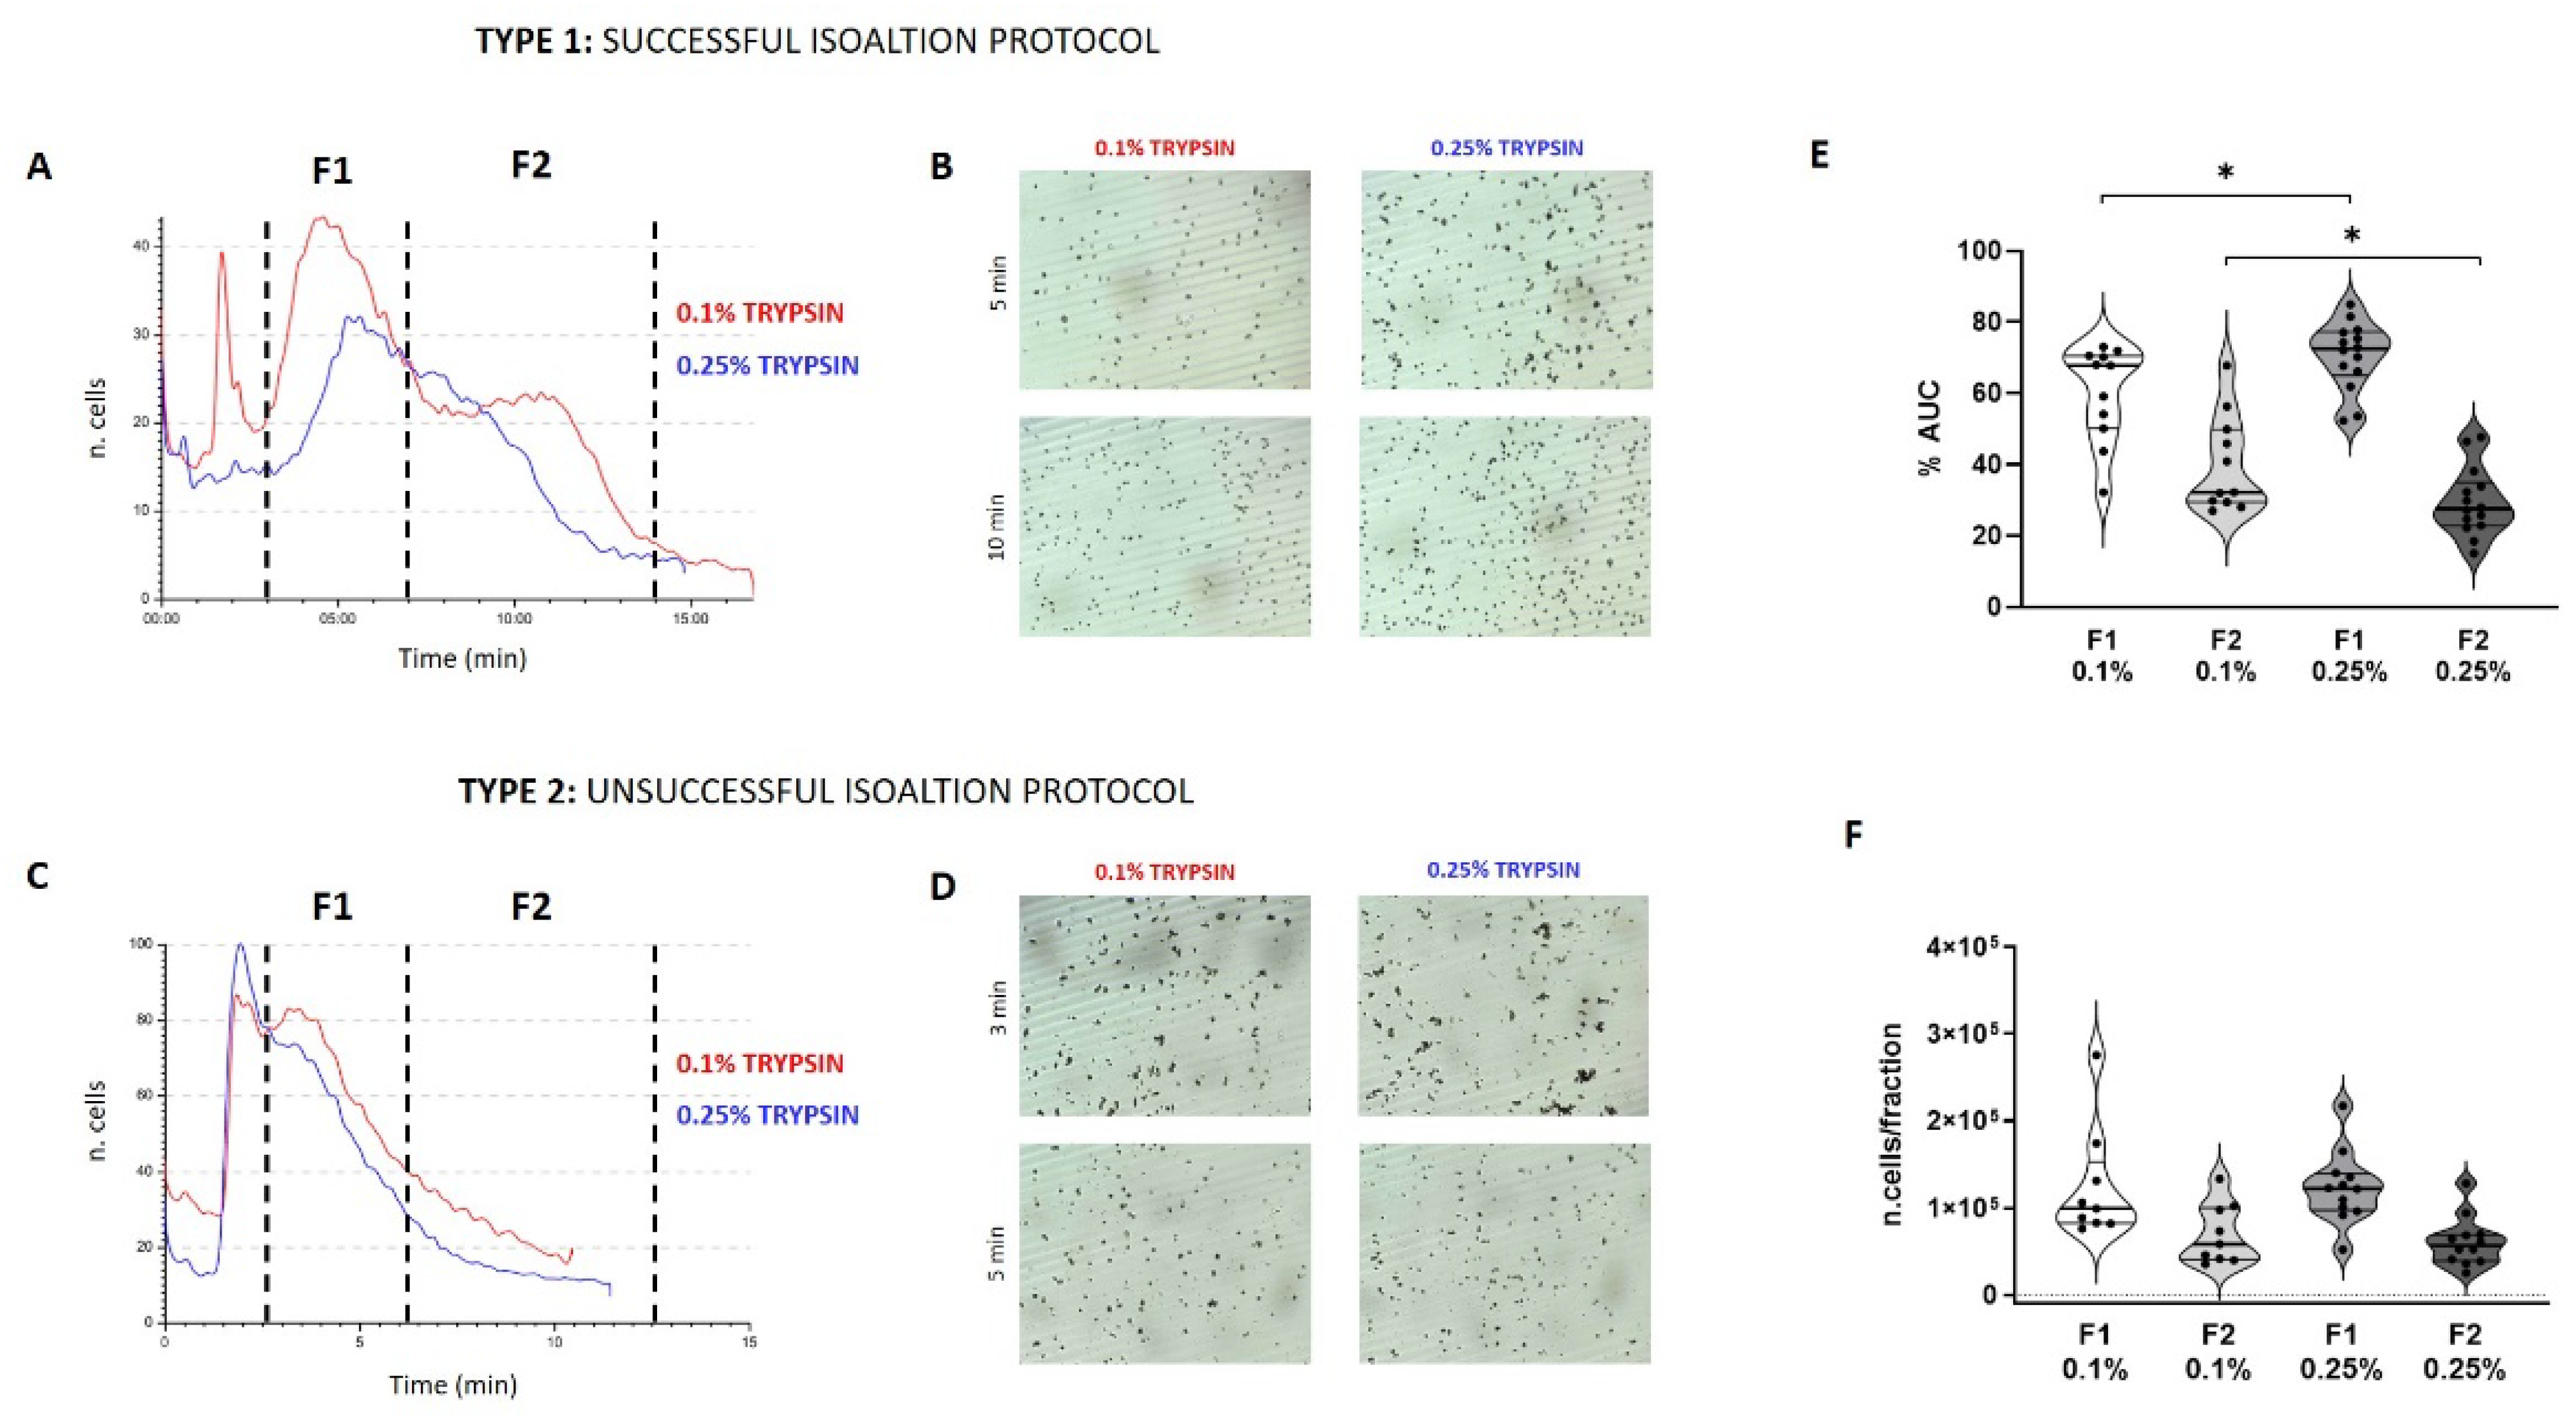
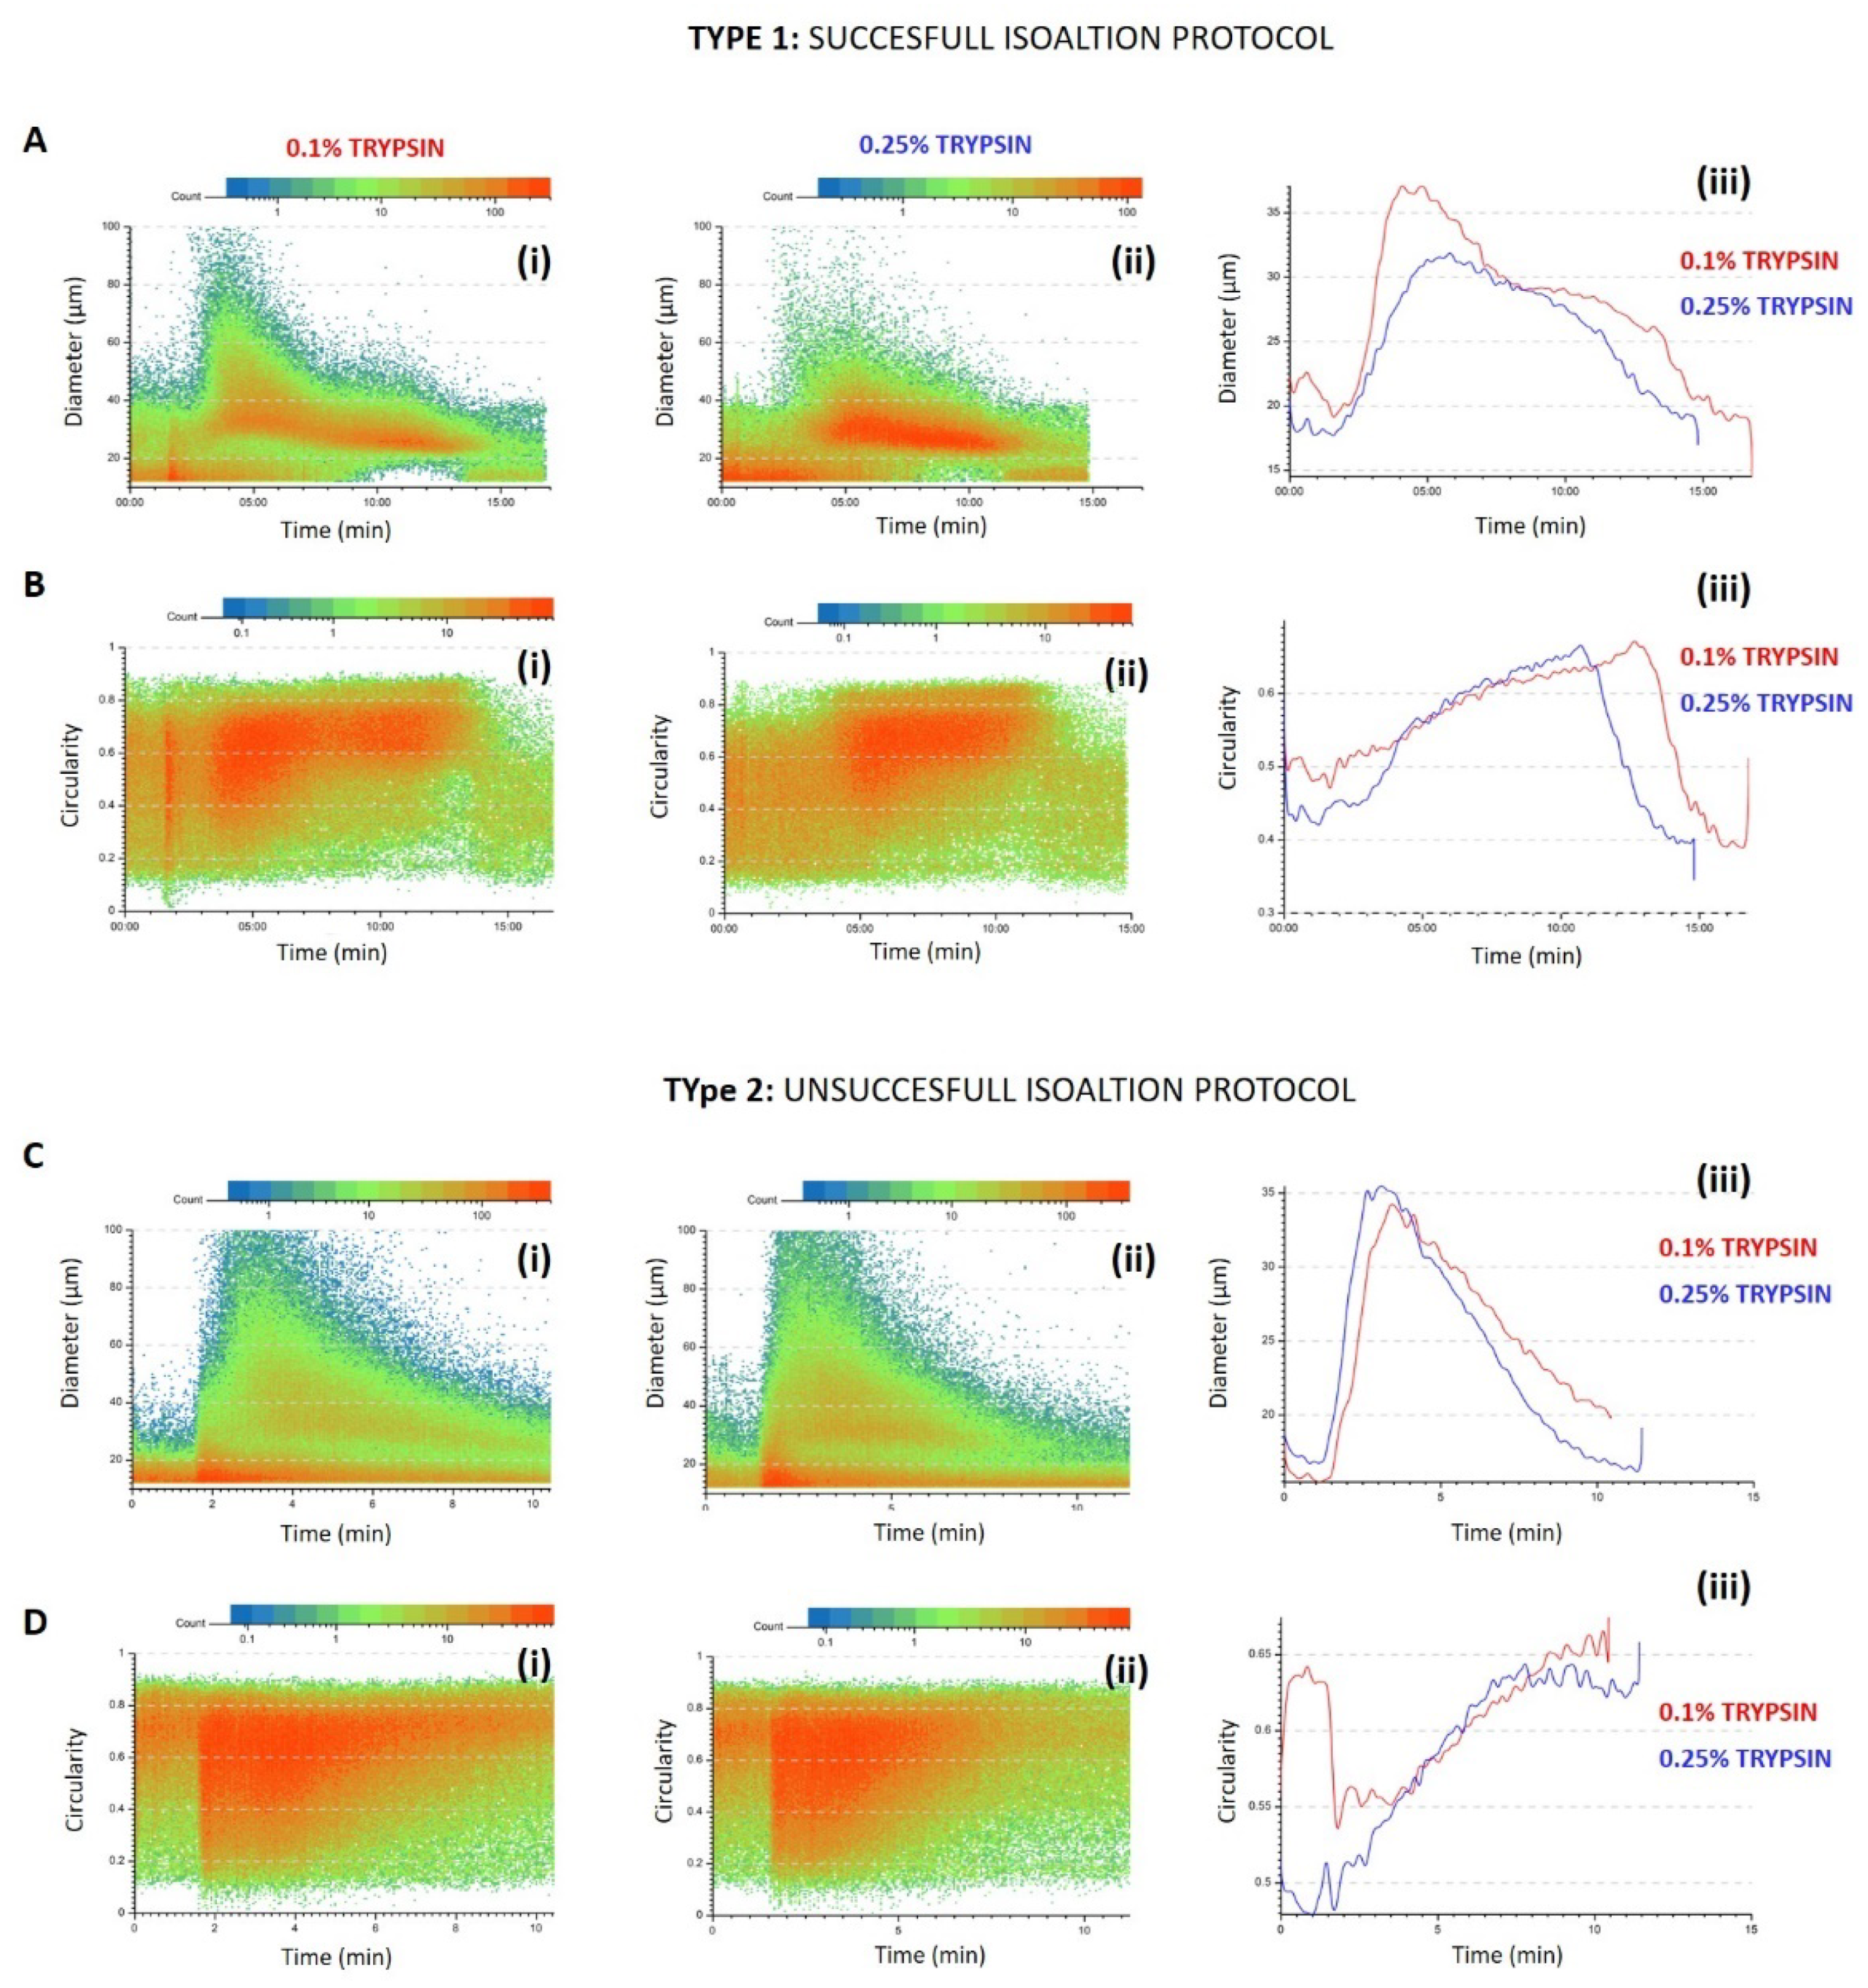
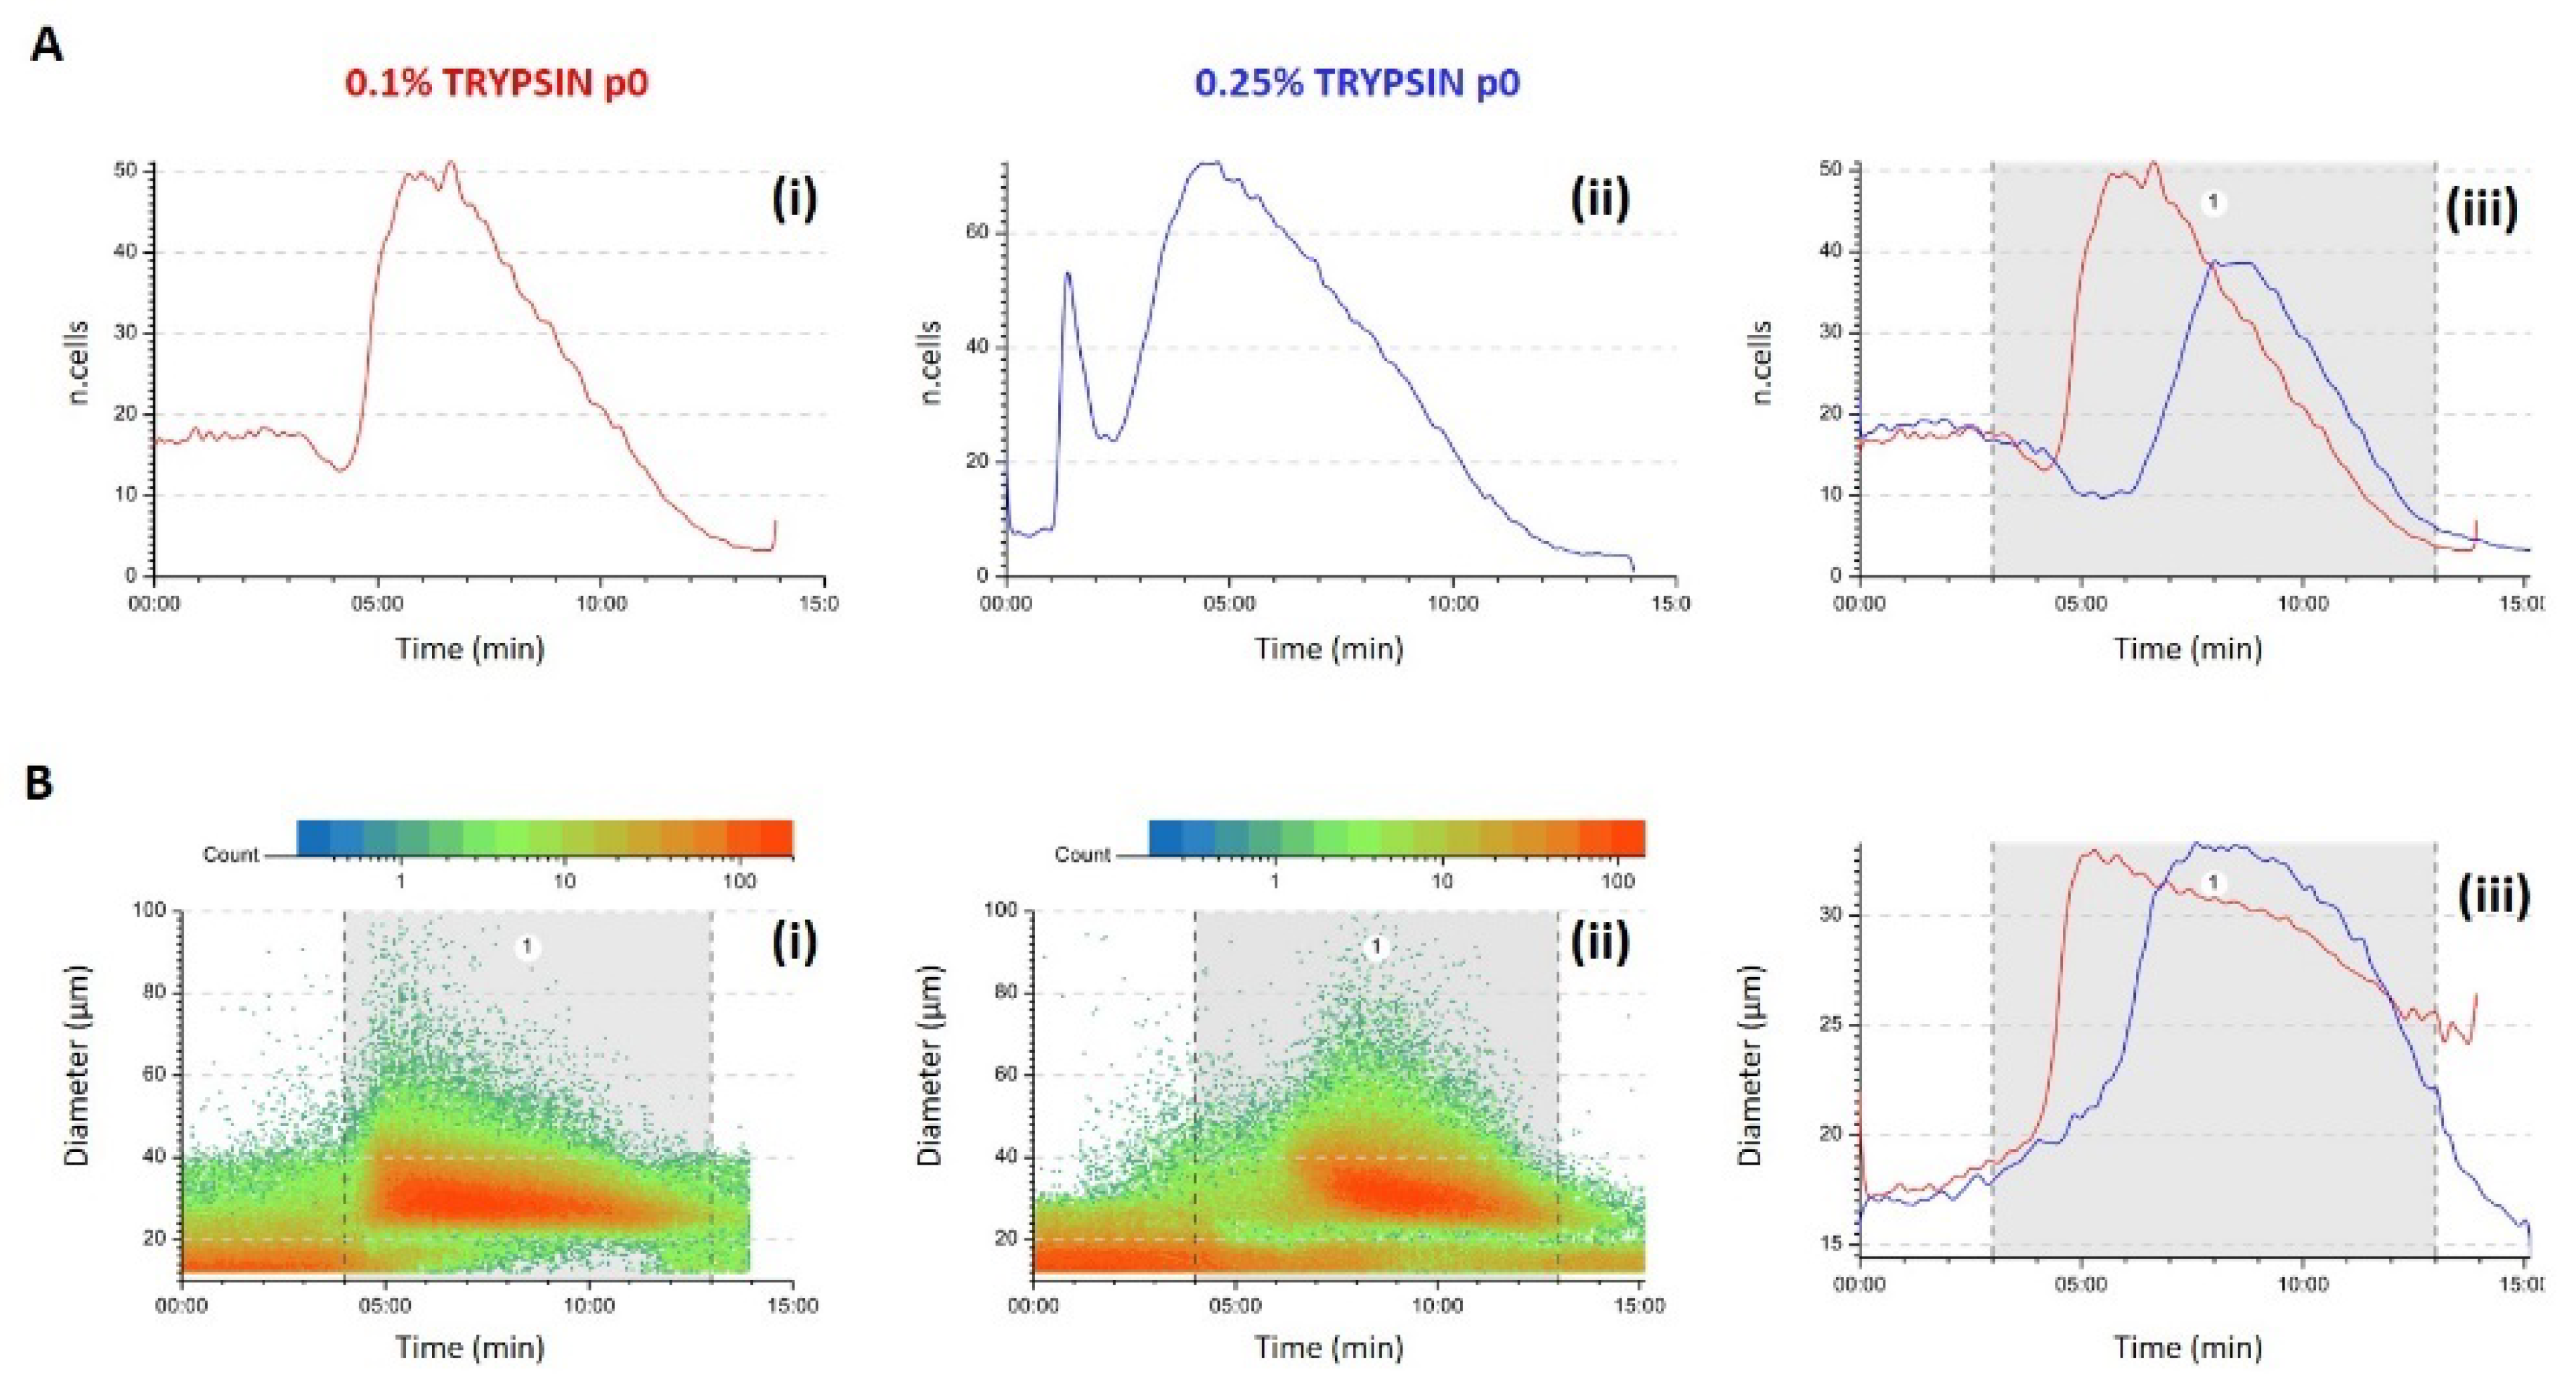
3.1. Predictivity
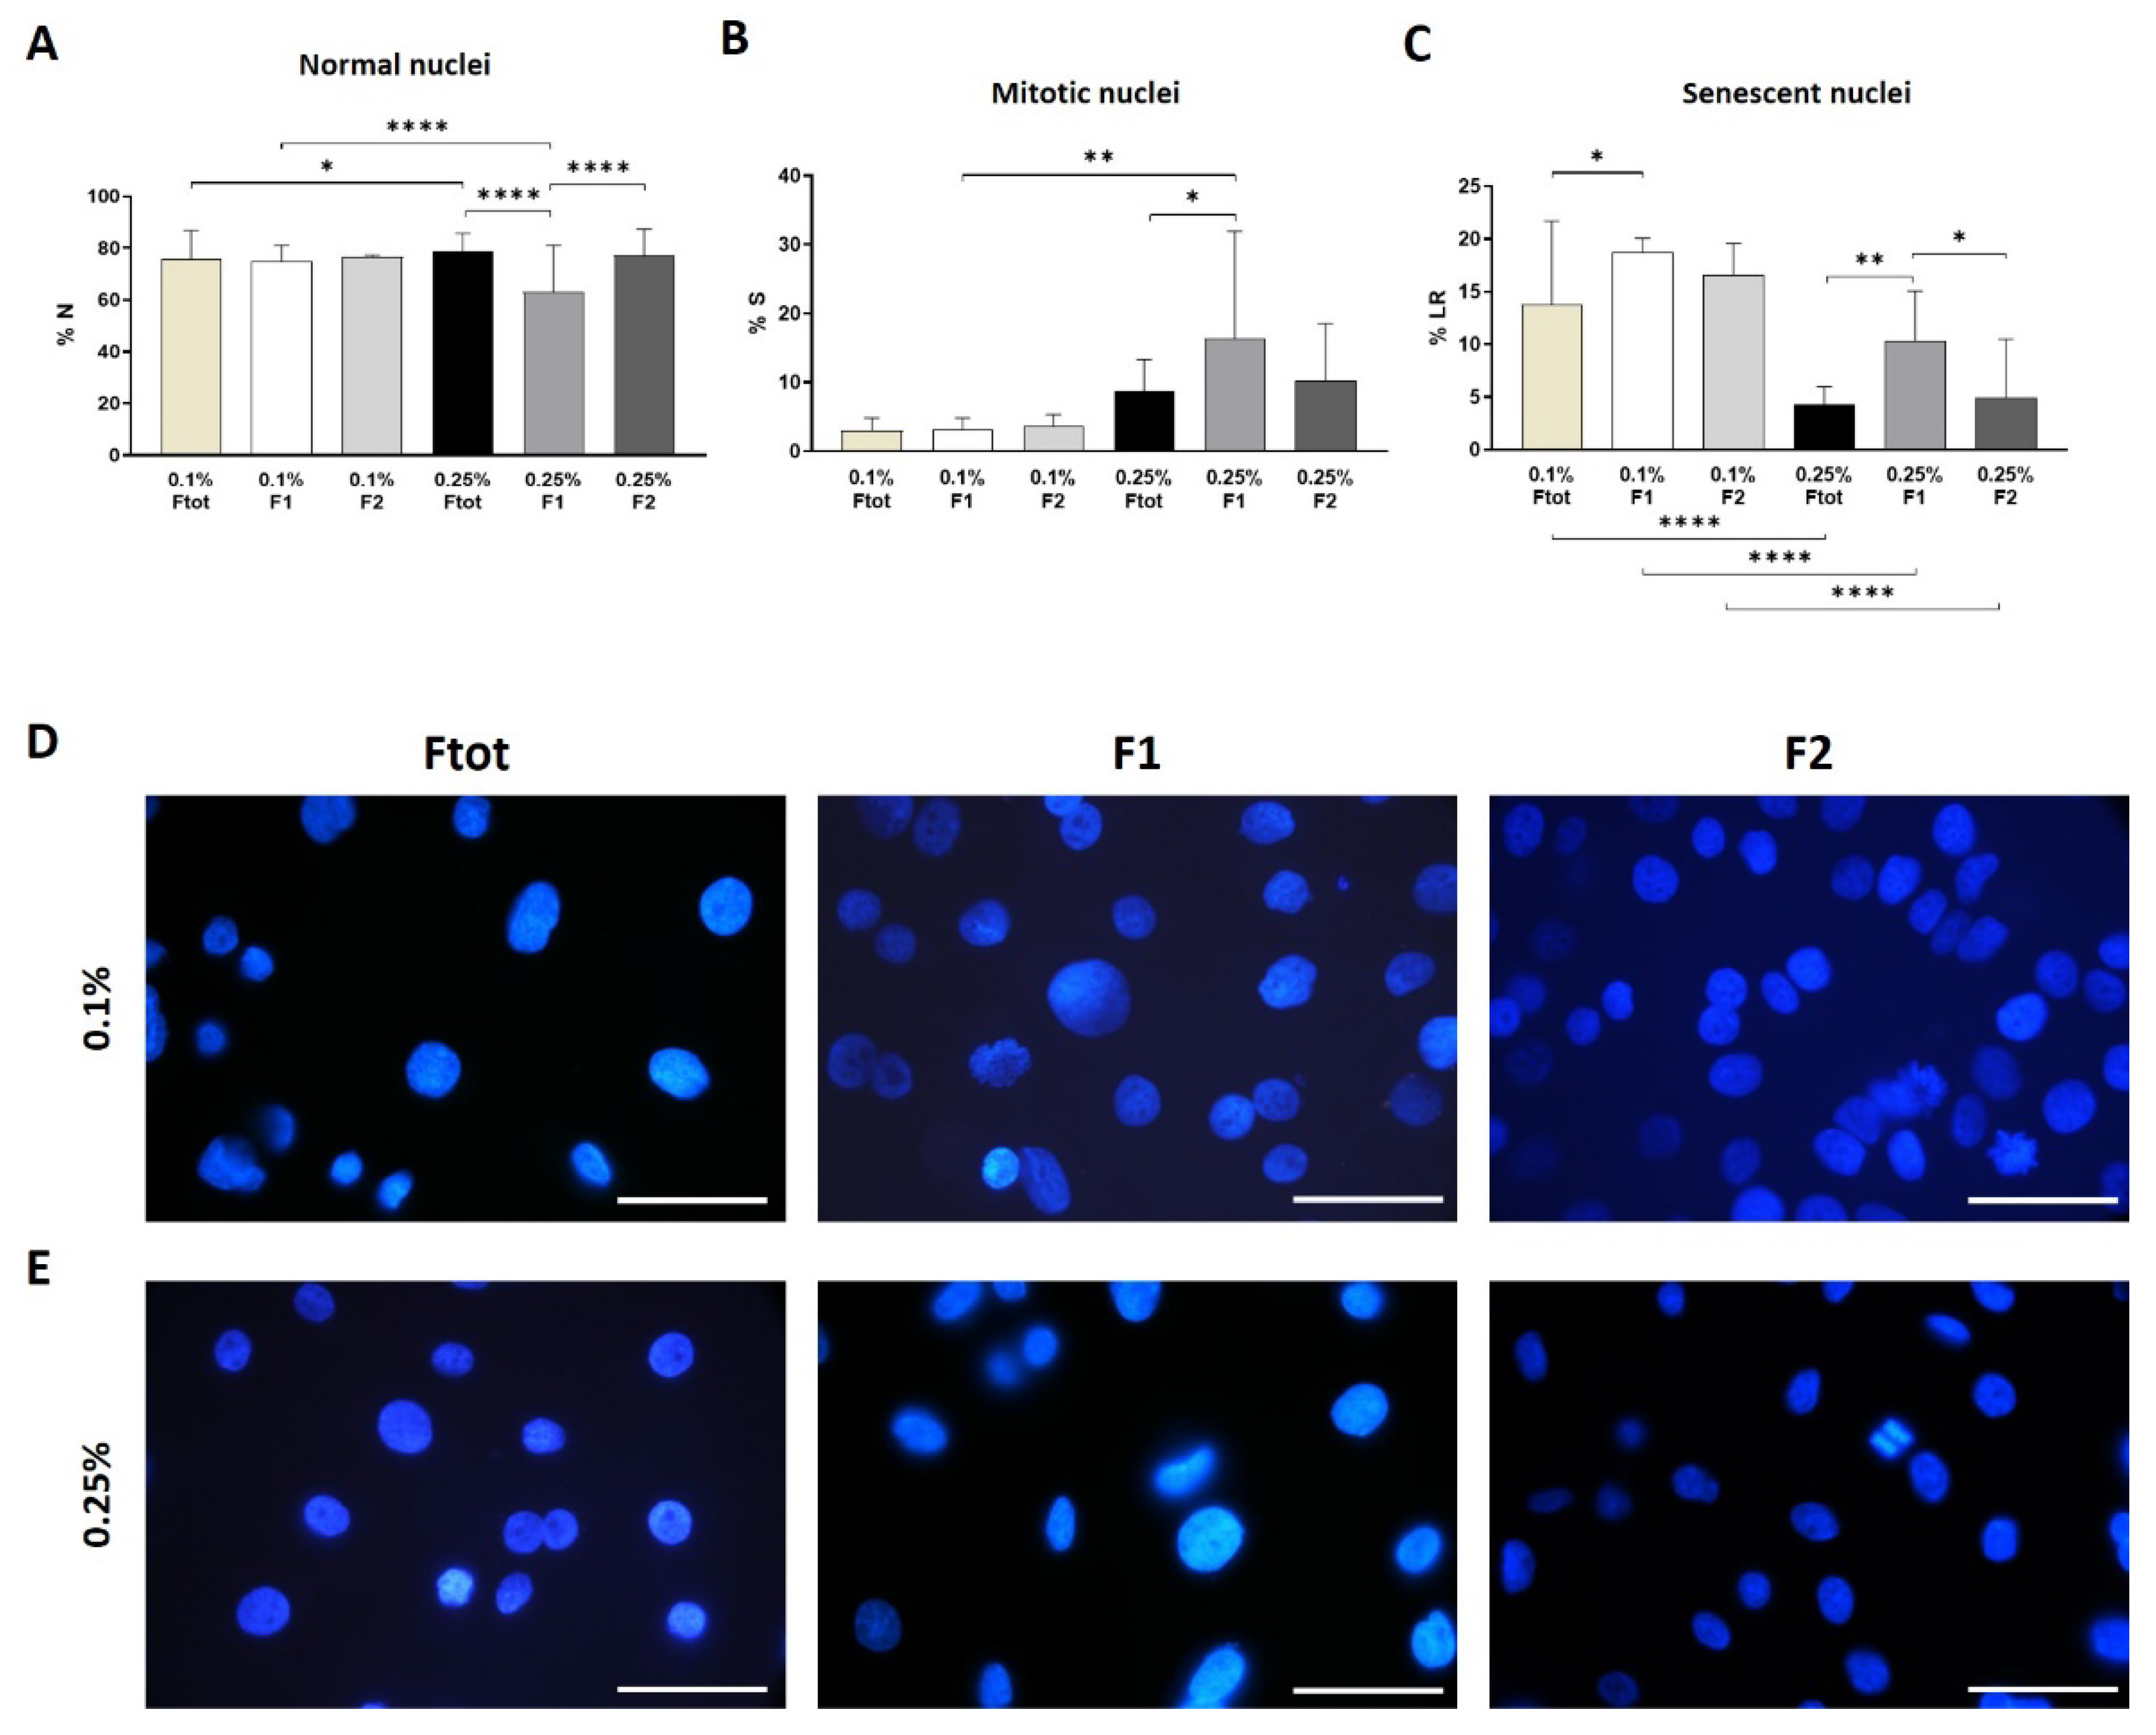
3.2. Quality Control (QC) of Freshly Isolated AECs
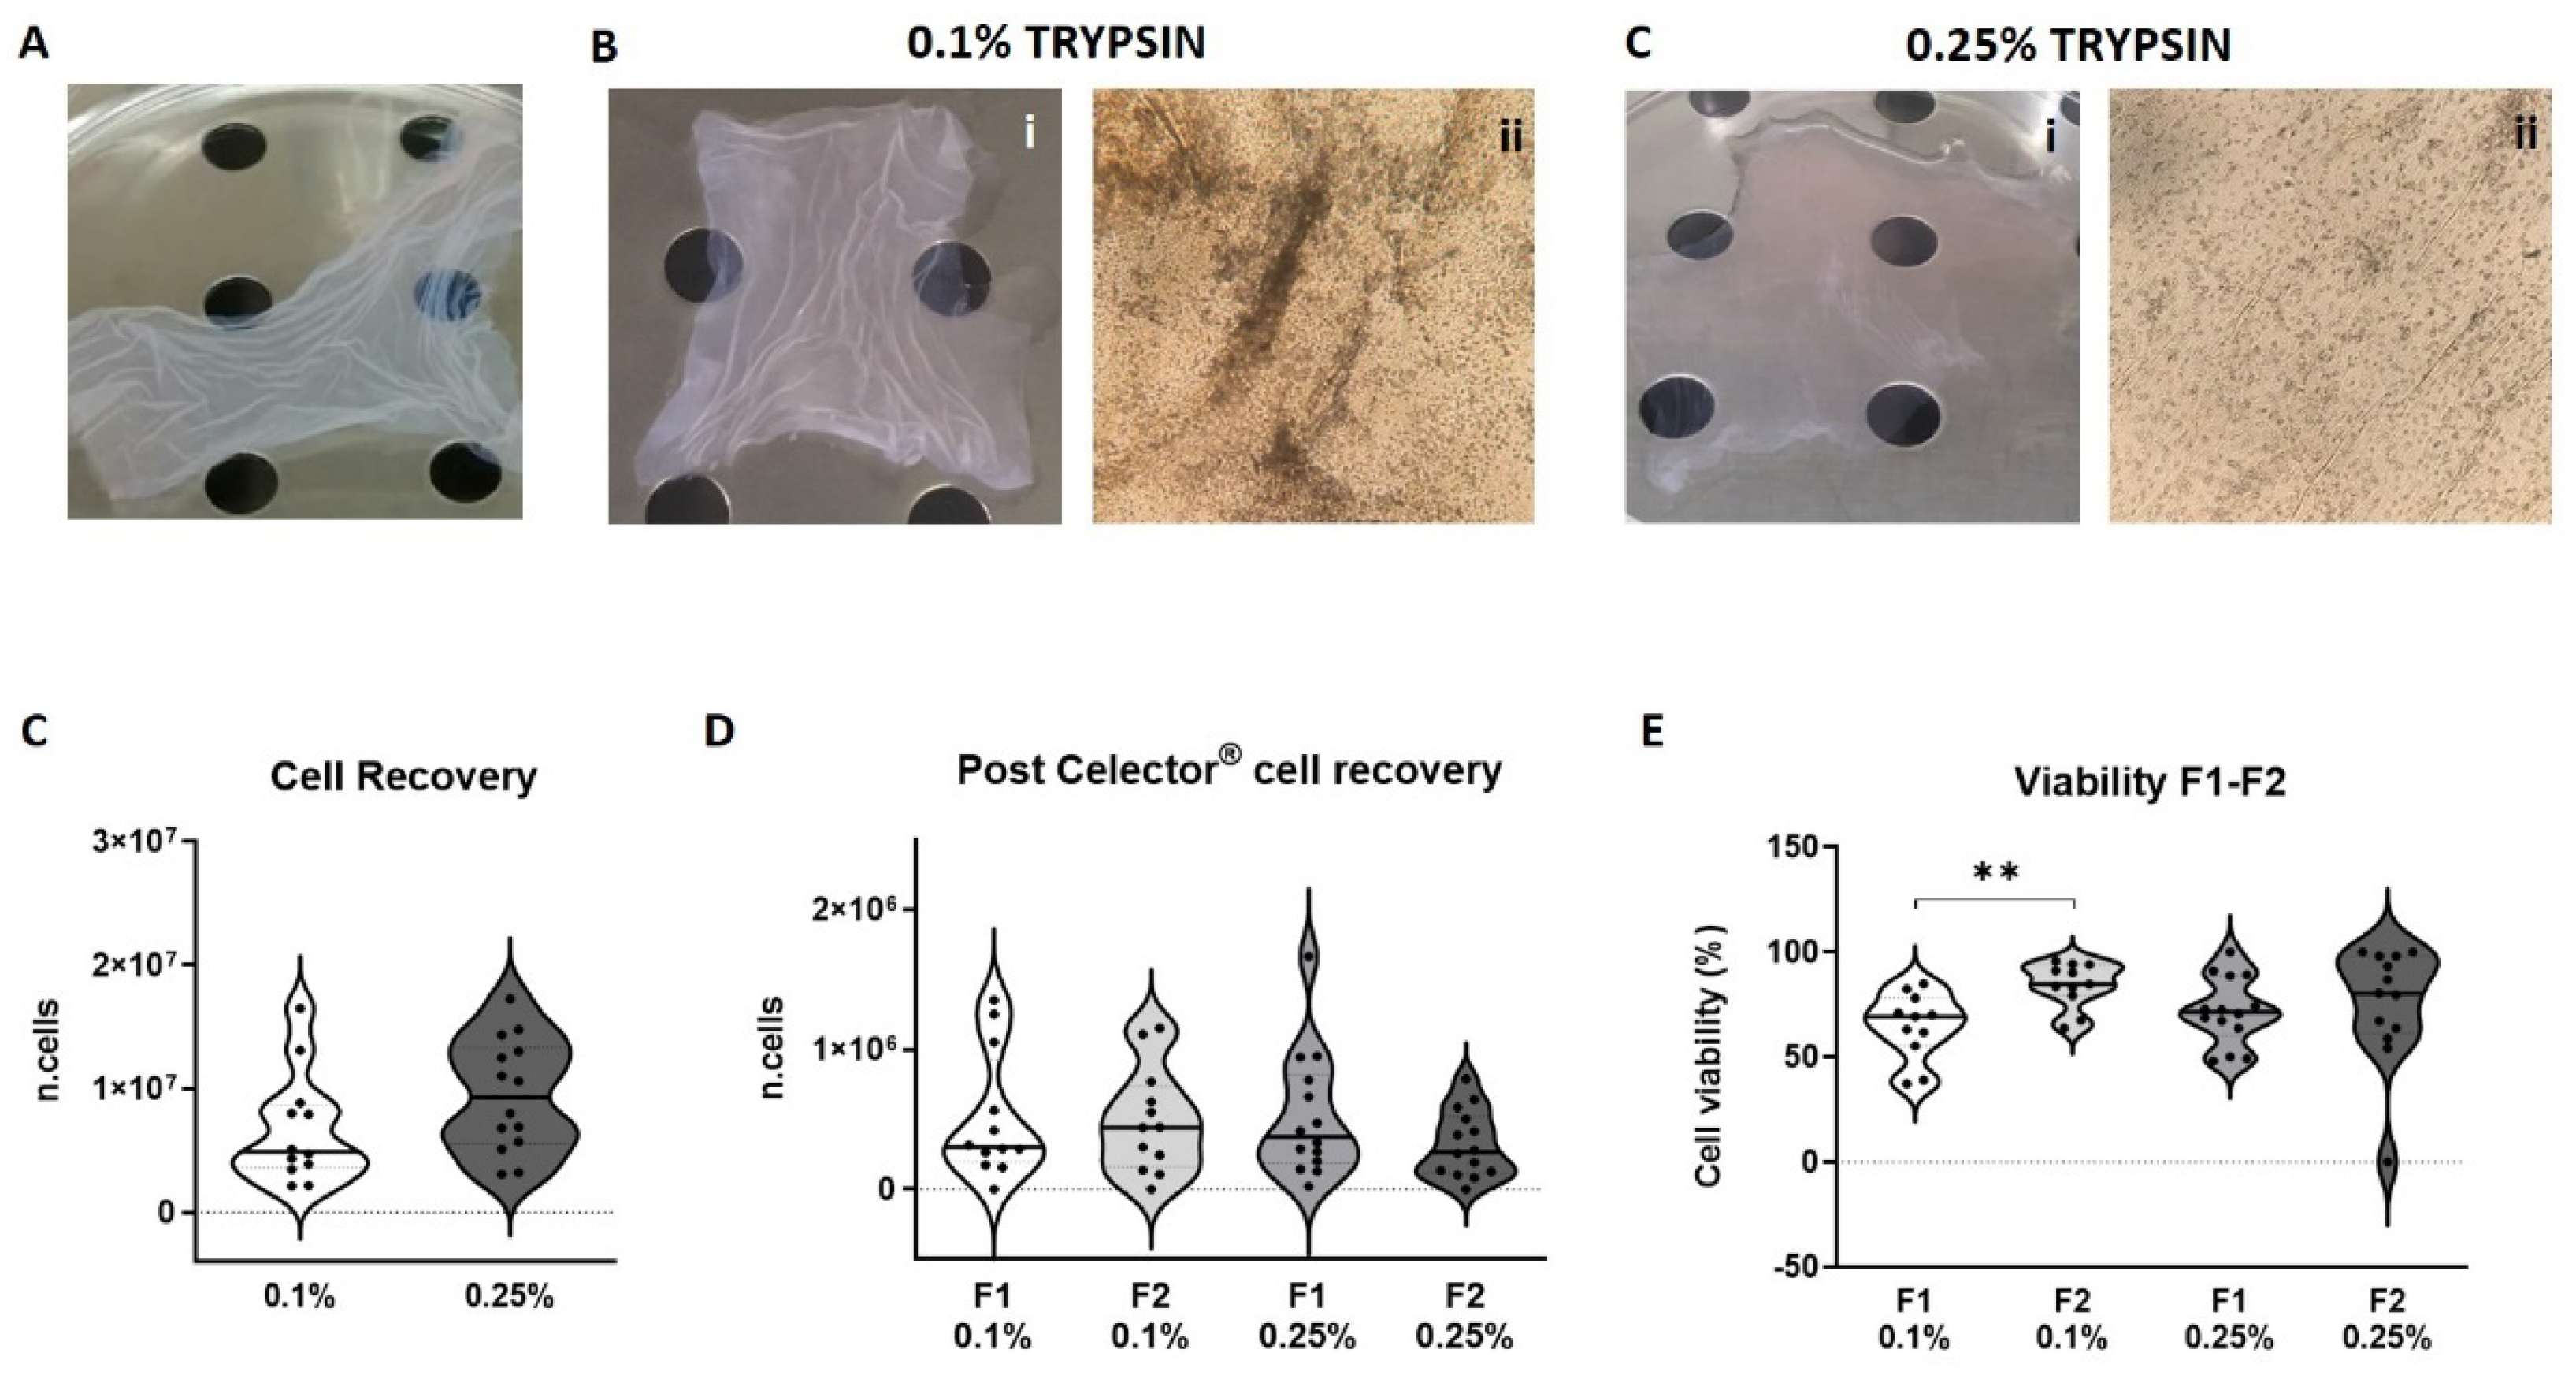
3.3. Viability and Cell Recovery
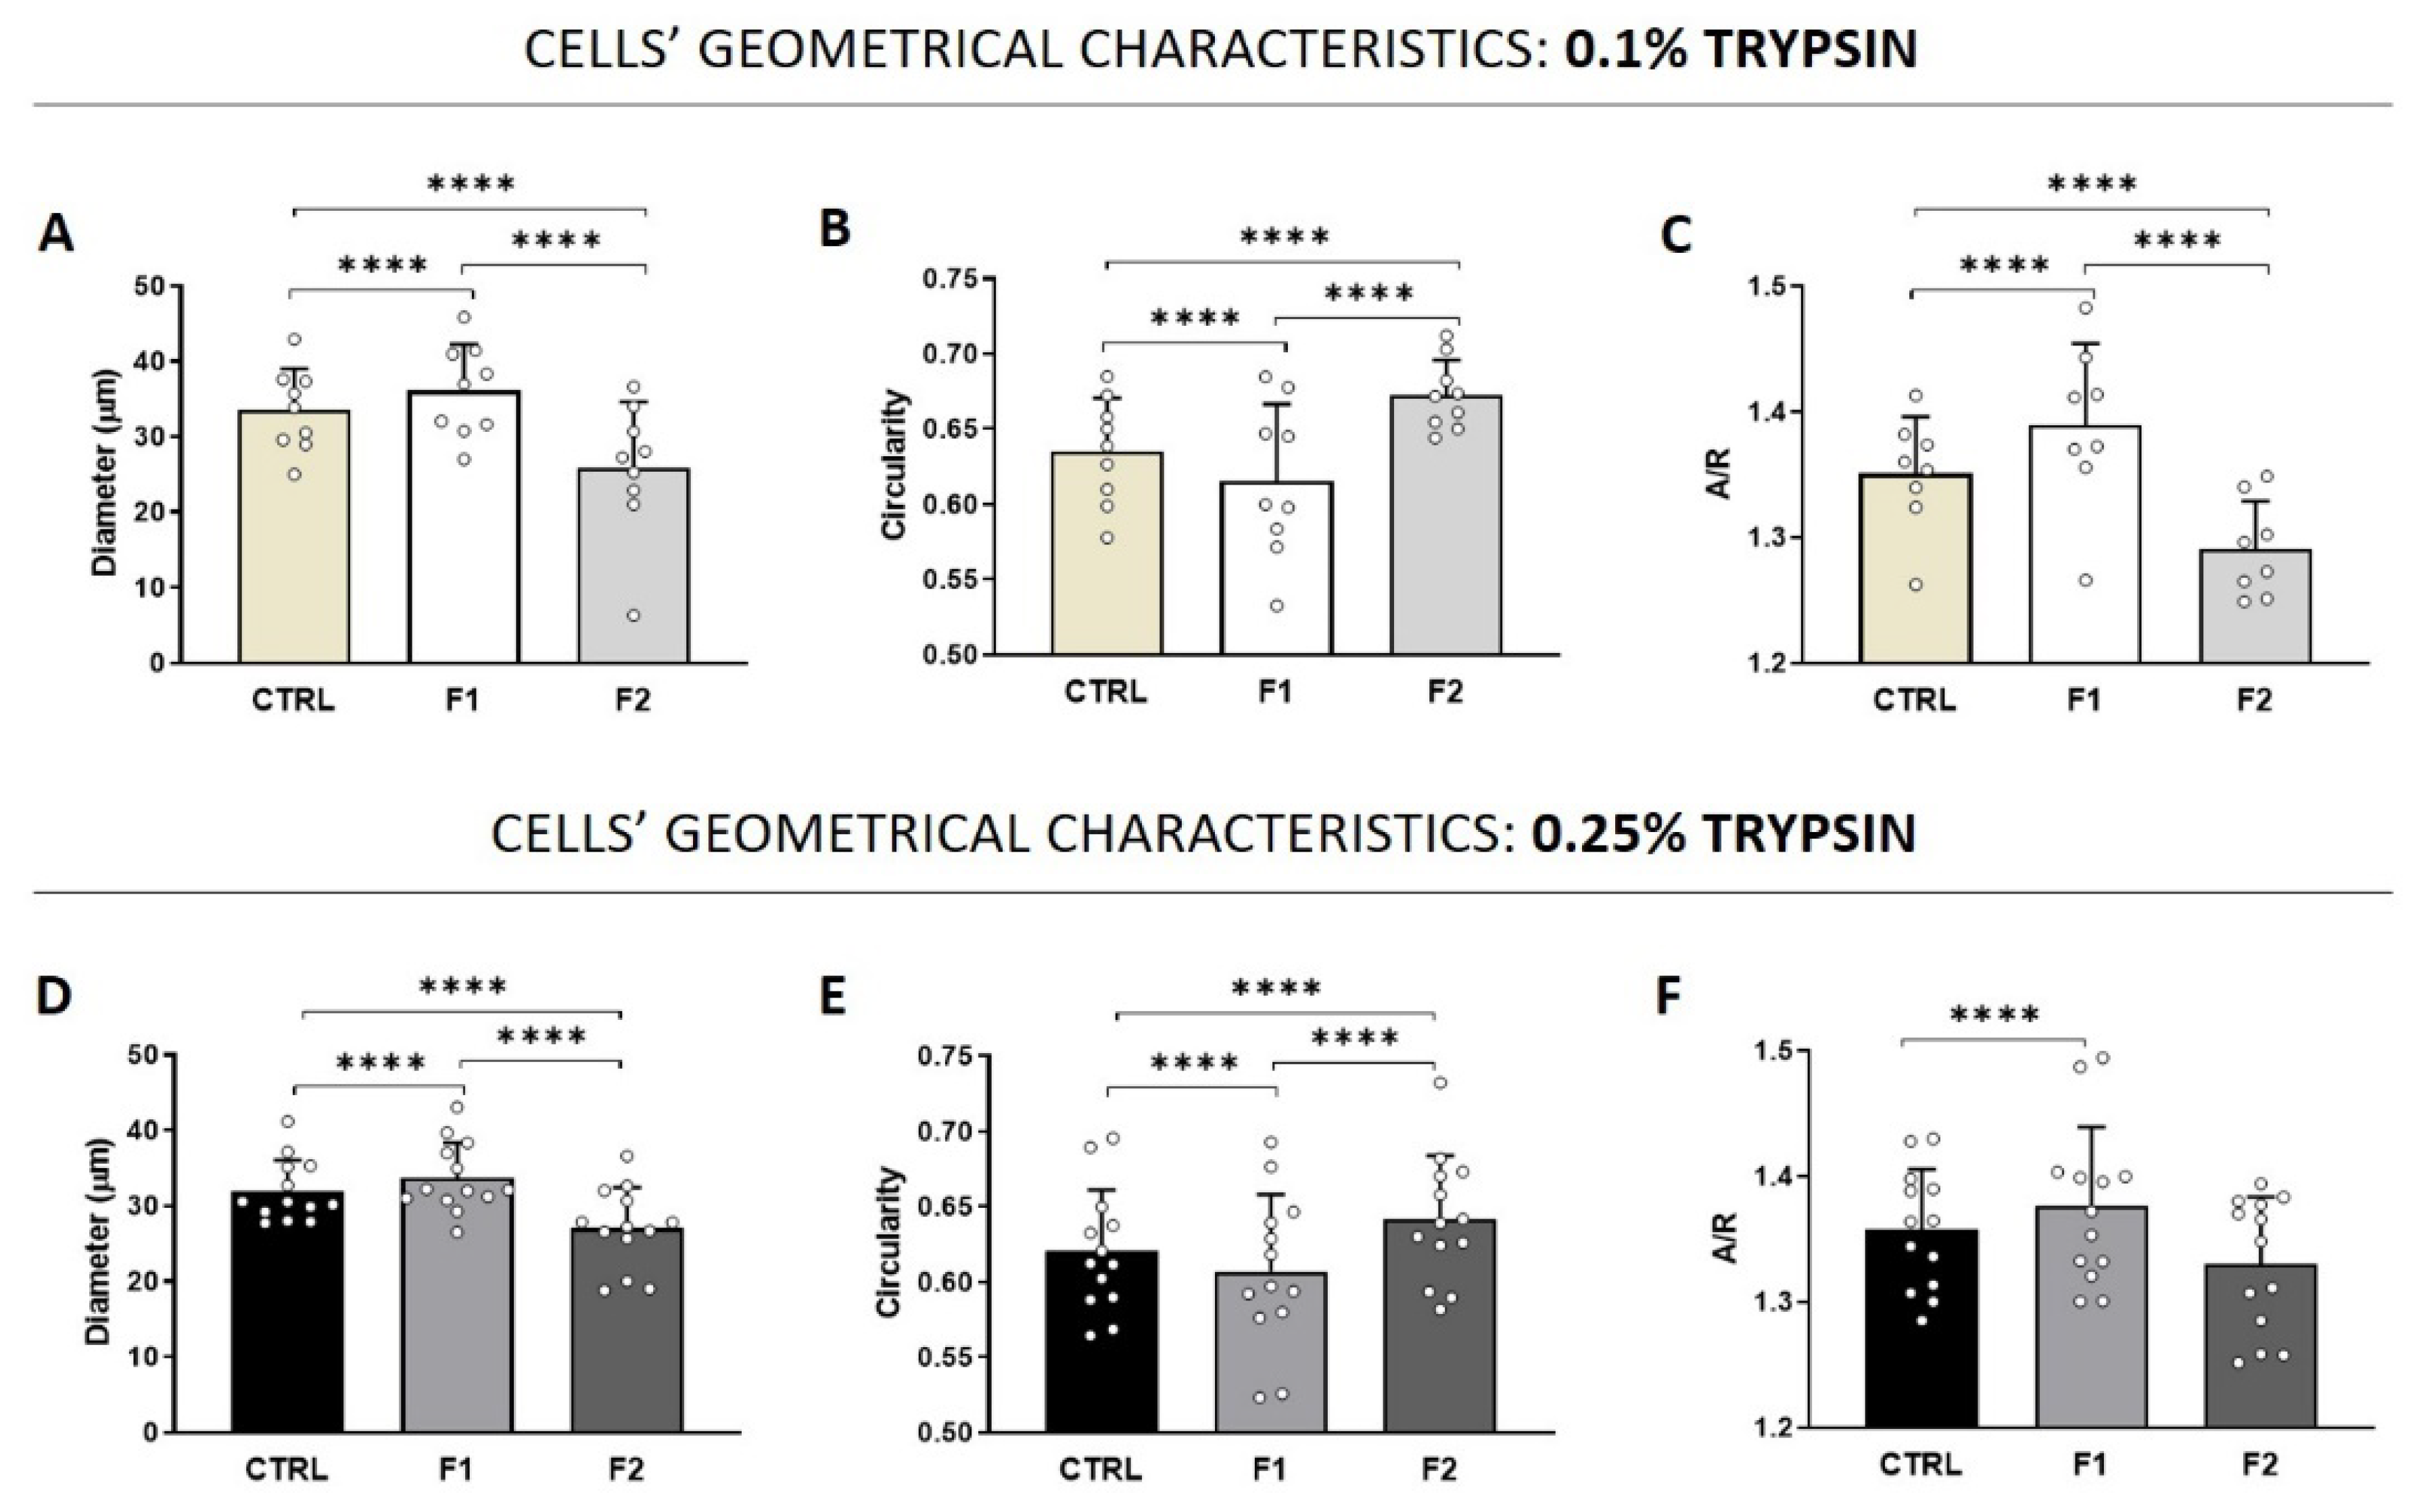
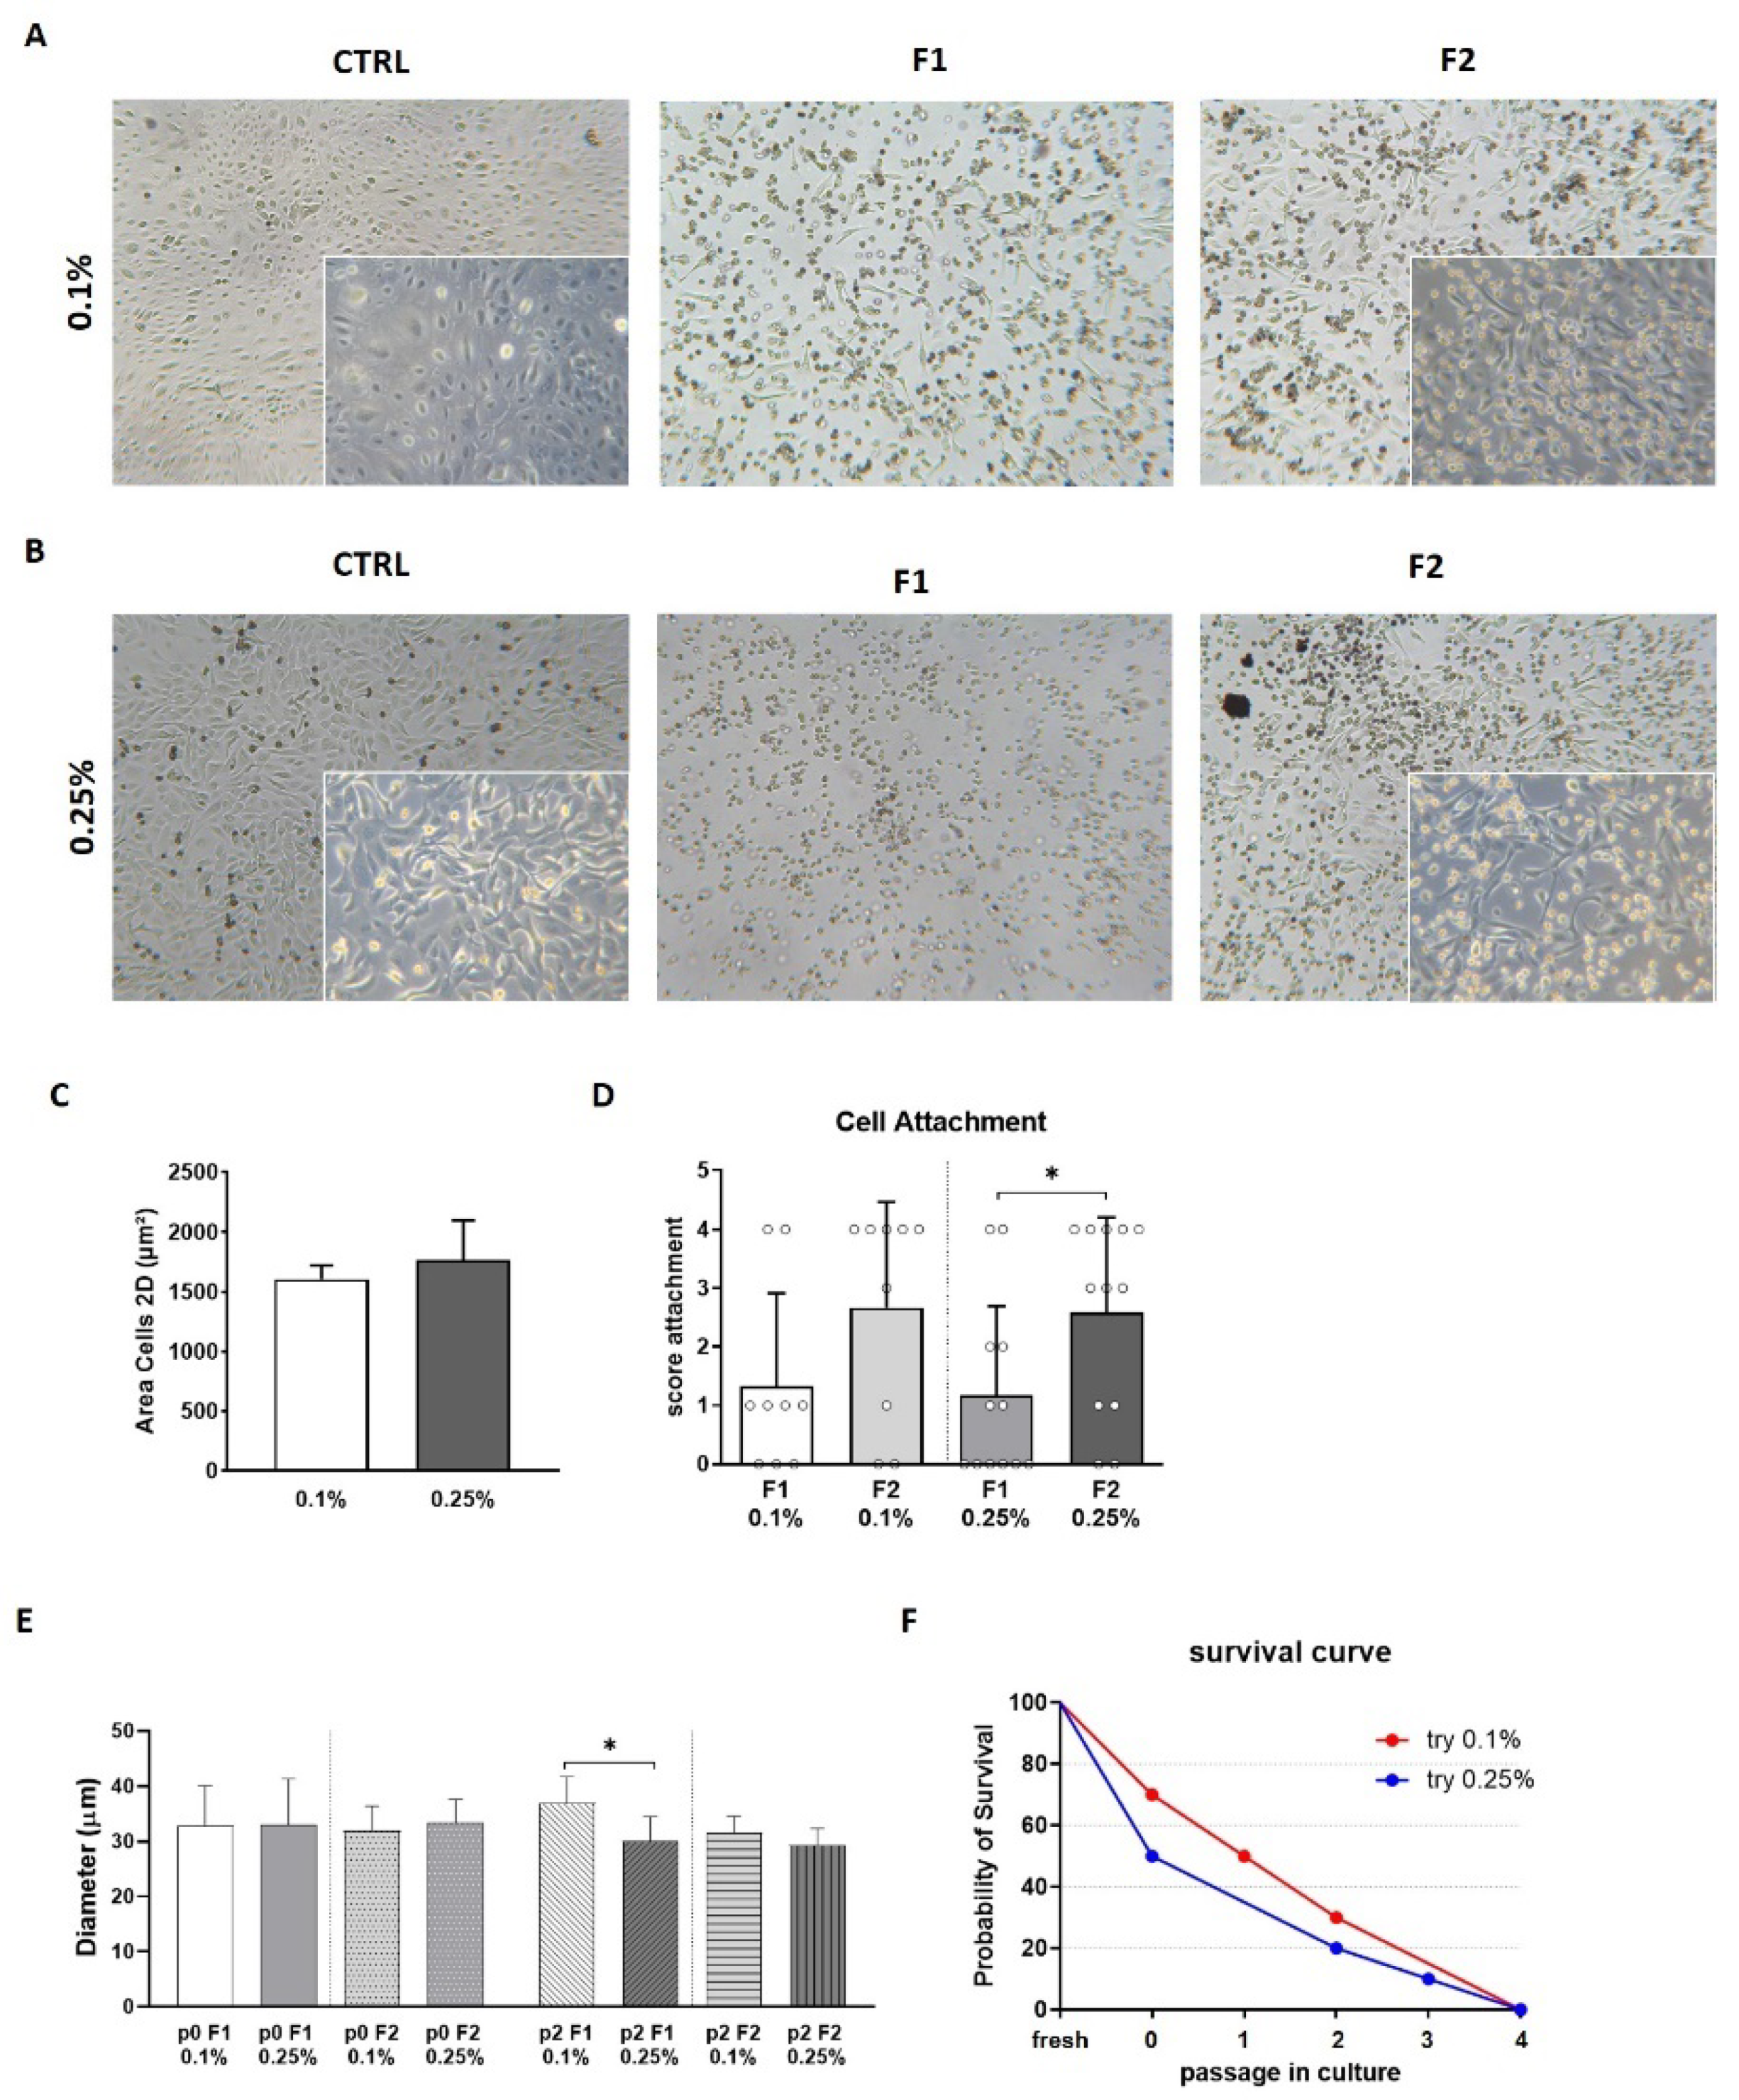
3.4. Morphology and Adhesion Properties
4. Discussion
5. Conclusions
6. Patents
Author Contributions
Funding
Institutional Review Board Statement
Informed Consent Statement
Acknowledgments
Conflicts of Interest
References
- Cheung, T.S.; Bertolino, G.M.; Giacomini, C.; Bornhäuser, M.; Dazzi, F.; Galleu, A. Mesenchymal Stromal Cells for Graft Versus Host Disease: Mechanism-Based Biomarkers. Front. Immunol. 2020, 11, 1338. [Google Scholar] [CrossRef] [PubMed]
- Amorin, B.; Alegretti, A.P.; Valim, V.; Pezzi, A.; Laureano, A.M.; Da Silva, M.A.L.; Wieck, A.; Silla, L. Mesenchymal stem cell therapy and acute graft-versus-host disease: A review. Hum. Cell 2014, 27, 137–150. [Google Scholar] [CrossRef] [Green Version]
- Wayne, A.S.; Baird, K.; Egeler, R.M. Hematopoietic stem cell transplantation for leukemia. Pediatr. Clin. N. Am. 2010, 57, 1–25. [Google Scholar] [CrossRef] [PubMed] [Green Version]
- Takami, A. Hematopoietic stem cell transplantation for acute myeloid leukemia. Int. J. Hematol. 2018, 107, 513–518. [Google Scholar] [CrossRef] [PubMed]
- Moll, G.; Drzeniek, N.; Kamhieh-Milz, J.; Geißler, S.; Volk, H.-D.; Reinke, P. MSC Therapies for COVID-19: Importance of Patient Coagulopathy, Thromboprophylaxis, Cell Product Quality and Mode of Delivery for Treatment Safety and Efficacy. Front. Immunol. 2020, 11, 1091. [Google Scholar] [CrossRef] [PubMed]
- Parolini, O.; Alviano, F.; Bagnara, G.P.; Bilic, G.; Bühring, H.-J.; Evangelista, M.; Hennerbichler, S.; Liu, B.; Magatti, M.; Mao, N.; et al. Concise review: Isolation and characterization of cells from human term placenta: Outcome of the first international Workshop on Placenta Derived Stem Cells. Stem Cells 2008, 26, 300–311. [Google Scholar] [CrossRef] [PubMed] [Green Version]
- Vanover, M.; Wang, A.; Farmer, D. Potential clinical applications of placental stem cells for use in fetal therapy of birth defects. Placenta 2017, 59, 107–112. [Google Scholar] [CrossRef]
- Morandi, F.; Marimpietri, D.; Görgens, A.; Gallo, A.; Srinivasan, R.C.; El-Andaloussi, S.; Gramignoli, R. Human Amnion Epithelial Cells Impair T Cell Proliferation: The Role of HLA-G and HLA-E Molecules. Cells 2020, 9, 2123. [Google Scholar] [CrossRef] [PubMed]
- Gramignoli, R.; Srinivasan, R.C.; Kannisto, K.; Strom, S.C. Isolation of Human Amnion Epithelial Cells According to Current Good Manufacturing Procedures. Curr. Protoc. Stem Cell Biol. 2016, 37, 1E.10.1–1E.10.13. [Google Scholar] [CrossRef]
- Miki, T.; Lehmann, T.; Cai, H.; Stolz, D.B.; Strom, S.C. Stem cell characteristics of amniotic epithelial cells. Stem Cells 2005, 23, 1549–1559. [Google Scholar] [CrossRef] [PubMed] [Green Version]
- Motedayyen, H.; Zarnani, A.-H.; Tajik, N.; Ghotloo, S.; Rezaei, A. Immunomodulatory effects of human amniotic epithelial cells on naive CD4(+) T cells from women with unexplained recurrent spontaneous abortion. Placenta 2018, 71, 31–40. [Google Scholar] [CrossRef]
- Strom, S.C.; Skvorak, K.; Gramignoli, R.; Marongiu, F.; Miki, T. Translation of amnion stem cells to the clinic. Stem Cells Dev. 2013, 22 (Suppl. 1), 96–102. [Google Scholar] [CrossRef] [PubMed]
- Okere, B.; Alviano, F.; Costa, R.; Quaglino, D.; Ricci, F.; Dominici, M.; Paolucci, P.; Bonsi, L.; Iughetti, L. In vitro differentiation of human amniotic epithelial cells into insulin-producing 3D spheroids. Int. J. Immunopathol. Pharmacol. 2015, 28, 390–402. [Google Scholar] [CrossRef] [Green Version]
- Xu, H.; Zhang, J.; Tsang, K.S.; Yang, H.; Gao, W.-Q. Therapeutic Potential of Human Amniotic Epithelial Cells on Injuries and Disorders in the Central Nervous System. Stem Cells Int. 2019, 2019, 5432301. [Google Scholar] [CrossRef] [PubMed] [Green Version]
- Kim, K.Y.; Suh, Y.-H.; Chang, K.-A. Therapeutic Effects of Human Amniotic Epithelial Stem Cells in a Transgenic Mouse Model of Alzheimer’s Disease. Int. J. Mol. Sci. 2020, 21, 2658. [Google Scholar] [CrossRef] [Green Version]
- van den Heuij, L.G.; Fraser, M.; Miller, S.L.; Jenkin, G.; Wallace, E.M.; Davidson, J.O.; Lear, C.A.; Lim, R.; Wassink, G.; Gunn, A.J.; et al. Delayed intranasal infusion of human amnion epithelial cells improves white matter maturation after asphyxia in preterm fetal sheep. J. Cereb. Blood Flow Metab. 2019, 39, 223–239. [Google Scholar] [CrossRef] [PubMed]
- Hodges, R.J.; Lim, R.; Jenkin, G.; Wallace, E.M. Amnion epithelial cells as a candidate therapy for acute and chronic lung injury. Stem Cells Int. 2012, 2012, 709763. [Google Scholar] [CrossRef] [PubMed] [Green Version]
- Andrewartha, N.; Yeoh, G. Human Amnion Epithelial Cell Therapy for Chronic Liver Disease. Stem Cells Int. 2019, 2019, 8106482. [Google Scholar] [CrossRef] [Green Version]
- Lebreton, F.; Lavallard, V.; Bellofatto, K.; Bonnet, R.; Wassmer, C.H.; Perez, L.; Kalandadze, V.; Follenzi, A.; Boulvain, M.; Kerr-Conte, J.; et al. Insulin-producing organoids engineered from islet and amniotic epithelial cells to treat diabetes. Nat. Commun. 2019, 10, 4491. [Google Scholar] [CrossRef] [PubMed] [Green Version]
- Liu, J.; Hua, R.; Gong, Z.; Shang, B.; Huang, Y.; Guo, L.; Liu, T.; Xue, J. Human amniotic epithelial cells inhibit CD4+ T cell activation in acute kidney injury patients by influencing the miR-101-c-Rel-IL-2 pathway. Mol. Immunol. 2017, 81, 76–84. [Google Scholar] [CrossRef] [PubMed]
- Song, Y.-S.; Joo, H.-W.; Park, I.-H.; Shen, G.-Y.; Lee, Y.; Shin, J.H.; Kim, H.; Shin, I.-S.; Kim, K.-S. Transplanted Human Amniotic Epithelial Cells Secrete Paracrine Proangiogenic Cytokines in Rat Model of Myocardial Infarction. Cell Transpl. 2015, 24, 2055–2064. [Google Scholar] [CrossRef] [Green Version]
- Zhao, B.; Liu, J.-Q.; Zheng, Z.; Zhang, J.; Wang, S.-Y.; Han, S.-C.; Zhou, Q.; Guan, H.; Li, C.; Su, L.-L.; et al. Human amniotic epithelial stem cells promote wound healing by facilitating migration and proliferation of keratinocytes via ERK, JNK and AKT signaling pathways. Cell Tissue Res. 2016, 365, 85–99. [Google Scholar] [CrossRef] [PubMed]
- Weidinger, A.; Poženel, L.; Wolbank, S.; Banerjee, A. Sub-Regional Differences of the Human Amniotic Membrane and Their Potential Impact on Tissue Regeneration Application. Front. Bioeng. Biotechnol. 2020, 8, 613804. [Google Scholar] [CrossRef] [PubMed]
- Centurione, L.; Passaretta, F.; Centurione, M.A.; De Munari, S.; Vertua, E.; Silini, A.; Liberati, M.; Parolini, O.; Di Pietro, R. Mapping of the Human Placenta: Experimental Evidence of Amniotic Epithelial Cell Heterogeneity. Cell Transpl. 2018, 27, 12–22. [Google Scholar] [CrossRef] [PubMed]
- Srinivasan, R.C.; Strom, S.C.; Gramignoli, R. Effects of Cryogenic Storage on Human Amnion Epithelial Cells. Cells 2020, 9, 1696. [Google Scholar] [CrossRef] [PubMed]
- Bilic, G.; Zeisberger, S.M.; Mallik, A.S.; Zimmermann, R.; Zisch, A.H. Comparative characterization of cultured human term amnion epithelial and mesenchymal stromal cells for application in cell therapy. Cell Transpl. 2008, 17, 955–968. [Google Scholar] [CrossRef] [PubMed] [Green Version]
- Ghamari, S.-H.; Abbasi-Kangevari, M.; Tayebi, T.; Bahrami, S.; Niknejad, H. The Bottlenecks in Translating Placenta-Derived Amniotic Epithelial and Mesenchymal Stromal Cells into the Clinic: Current Discrepancies in Marker Reports. Front Bioeng. Biotechnol. 2020, 8, 180. [Google Scholar] [CrossRef] [Green Version]
- Shen, Z.-Y.; Xu, L.-Y.; Li, E.-M.; Zhuang, B.-R.; Lu, X.-F.; Shen, J.; Wu, X.-Y.; Li, Q.-S.; Lin, Y.-J.; Chen, Y.-W.; et al. Autophagy and endocytosis in the amnion. J. Struct. Biol. 2008, 162, 197–204. [Google Scholar] [CrossRef]
- Motedayyen, H.; Esmaeil, N.; Tajik, N.; Khadem, F.; Ghotloo, S.; Khani, B.; Rezaei, A. Method and key points for isolation of human amniotic epithelial cells with high yield, viability and purity. BMC Res. Notes 2017, 10, 552. [Google Scholar] [CrossRef] [PubMed] [Green Version]
- Koike, C.; Zhou, K.; Takeda, Y.; Fathy, M.; Okabe, M.; Yoshida, T.; Nakamura, Y.; Kato, Y.; Nikaido, T. Characterization of amniotic stem cells. Cell. Reprogram. 2014, 16, 298–305. [Google Scholar] [CrossRef] [Green Version]
- Cui, P.; Wang, S. Application of microfluidic chip technology in pharmaceutical analysis: A review. J. Pharm. Anal. 2019, 9, 238–247. [Google Scholar] [CrossRef] [PubMed]
- Reschiglian, P.; Zattoni, A.; Roda, B.; Casolari, S.; Moon, M.H.; Lee, J.; Jung, J.; Rodmalm, K.; Cenacchi, G. Bacteria sorting by field-flow fractionation. Application to whole-cell Escherichia coil vaccine strains. Anal. Chem. 2002, 74, 4895–4904. [Google Scholar] [CrossRef]
- Wang, X.-B.; Yang, J.; Huang, Y.; Vykoukal, J.; Becker, F.F.; Gascoyne, P.R.C. Cell separation by dielectrophoretic field-flow-fractionation. Anal. Chem. 2000, 72, 832–839. [Google Scholar] [CrossRef] [Green Version]
- Roda, B.; Lanzoni, G.; Alviano, F.; Zattoni, A.; Costa, R.; Di Carlo, A.; Marchionni, C.; Franchina, M.; Ricci, F.; Tazzari, P.L.; et al. A novel stem cell tag-less sorting method. Stem Cell Rev. Rep. 2009, 5, 420–427. [Google Scholar] [CrossRef] [PubMed]
- Roda, B.; Reschiglian, P.; Alviano, F.; Lanzoni, G.; Bagnara, G.P.; Ricci, F.; Buzzi, M.; Tazzari, P.L.; Pagliaro, P.; Michelini, E.; et al. Gravitational field-flow fractionation of human hemopoietic stem cells. J. Chromatogr. A 2009, 1216, 9081–9087. [Google Scholar] [CrossRef]
- Ilancheran, S.; Michalska, A.; Peh, G.; Wallace, E.; Pera, M.; Manuelpillai, U. Stem cells derived from human fetal membranes display multilineage differentiation potential. Biol. Reprod. 2007, 77, 577–588. [Google Scholar] [CrossRef] [PubMed] [Green Version]
- Filippi-Chiela, E.C.; Oliveira, M.M.; Jurkovski, B.; Jacques, S.M.C.; da Silva, V.D.; Lenz, G. Nuclear morphometric analysis (NMA): Screening of senescence, apoptosis and nuclear irregularities. PLoS ONE 2012, 7, e42522. [Google Scholar] [CrossRef] [PubMed] [Green Version]
- Kabat, M.; Bobkov, I.; Kumar, S.; Grumet, M. Trends in mesenchymal stem cell clinical trials 2004–2018: Is efficacy optimal in a narrow dose range? Stem Cells Transl. Med. 2020, 9, 17–27. [Google Scholar] [CrossRef] [PubMed] [Green Version]
- Pamies, D.; Bal-Price, A.; Simeonov, A.; Tagle, D.; Allen, D.; Gerhold, D.; Yin, D.; Pistollato, F.; Inutsuka, T.; Sullivan, K.; et al. Good Cell Culture Practice for stem cells and stem-cell-derived models. ALTEX 2017, 34, 95–132. [Google Scholar] [CrossRef] [PubMed] [Green Version]
- Pamies, D.; Bal-Price, A.; Chesne, C.; Coecke, S.; Dinnyes, A.; Eskes, C.; Grillari, R.; Gstraunthaler, G.; Hartung, T.; Jennings, P.; et al. Advanced Good Cell Culture Practice for human primary, stem cell-derived and organoid models as well as microphysiological systems. ALTEX 2018, 35, 353–378. [Google Scholar] [CrossRef]
- Kilpinen, H.; Goncalves, A.; Leha, A.; Afzal, V.; Alasoo, K.; Ashford, S.; Bala, S.; Bensaddek, D.; Casale, F.P.; Culley, O.; et al. Common genetic variation drives molecular heterogeneity in human iPSCs. Nature 2017, 546, 370–375. [Google Scholar] [CrossRef] [PubMed] [Green Version]
- Zhang, Q.; Lai, D. Application of human amniotic epithelial cells in regenerative medicine: A systematic review. Stem Cell Res. Ther. 2020, 11, 439. [Google Scholar] [CrossRef] [PubMed]
- Pfister, G.; Toor, S.M.; Nair, V.S.; Elkord, E. An evaluation of sorter induced cell stress (SICS) on peripheral blood mononuclear cells (PBMCs) after different sort conditions–Are your sorted cells getting SICS? J. Immunol. Methods 2020, 487, 112902. [Google Scholar] [CrossRef] [PubMed]
- Binek, A.; Rojo, D.; Godzien, J.; Rupérez, F.J.; Nuñez, V.; Jorge, I.; Ricote, M.; Vázquez, J.; Barbas, C. Flow Cytometry Has a Significant Impact on the Cellular Metabolome. J. Proteome Res. 2019, 18, 169–181. [Google Scholar] [CrossRef] [PubMed]
- Marklein, R.A.; Surdo, J.L.L.; Bellayr, I.H.; Godil, S.A.; Puri, R.K.; Bauer, S.R. High Content Imaging of Early Morphological Signatures Predicts Long Term Mineralization Capacity of Human Mesenchymal Stem Cells upon Osteogenic Induction. Stem Cells 2016, 34, 935–947. [Google Scholar] [CrossRef] [PubMed] [Green Version]


Publisher’s Note: MDPI stays neutral with regard to jurisdictional claims in published maps and institutional affiliations. |
© 2021 by the authors. Licensee MDPI, Basel, Switzerland. This article is an open access article distributed under the terms and conditions of the Creative Commons Attribution (CC BY) license (https://creativecommons.org/licenses/by/4.0/).
Share and Cite
Zia, S.; Martini, G.; Pizzuti, V.; Maggio, A.; Simonazzi, G.; Reschiglian, P.; Bonsi, L.; Alviano, F.; Roda, B.; Zattoni, A. A New Predictive Technology for Perinatal Stem Cell Isolation Suited for Cell Therapy Approaches. Micromachines 2021, 12, 782. https://doi.org/10.3390/mi12070782
Zia S, Martini G, Pizzuti V, Maggio A, Simonazzi G, Reschiglian P, Bonsi L, Alviano F, Roda B, Zattoni A. A New Predictive Technology for Perinatal Stem Cell Isolation Suited for Cell Therapy Approaches. Micromachines. 2021; 12(7):782. https://doi.org/10.3390/mi12070782
Chicago/Turabian StyleZia, Silvia, Giulia Martini, Valeria Pizzuti, Alessia Maggio, Giuliana Simonazzi, Pierluigi Reschiglian, Laura Bonsi, Francesco Alviano, Barbara Roda, and Andrea Zattoni. 2021. "A New Predictive Technology for Perinatal Stem Cell Isolation Suited for Cell Therapy Approaches" Micromachines 12, no. 7: 782. https://doi.org/10.3390/mi12070782
APA StyleZia, S., Martini, G., Pizzuti, V., Maggio, A., Simonazzi, G., Reschiglian, P., Bonsi, L., Alviano, F., Roda, B., & Zattoni, A. (2021). A New Predictive Technology for Perinatal Stem Cell Isolation Suited for Cell Therapy Approaches. Micromachines, 12(7), 782. https://doi.org/10.3390/mi12070782