
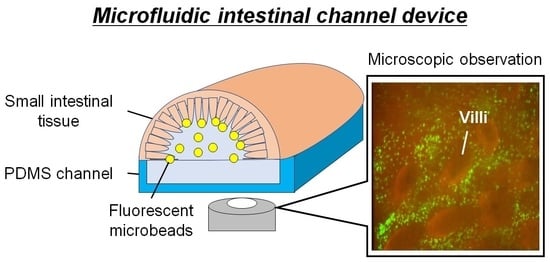
Microfluidic Device Using Mouse Small Intestinal Tissue for the Observation of Fluidic Behavior in the Lumen


Abstract
1. Introduction
2. Materials and Methods
2.1. Material and Reagents
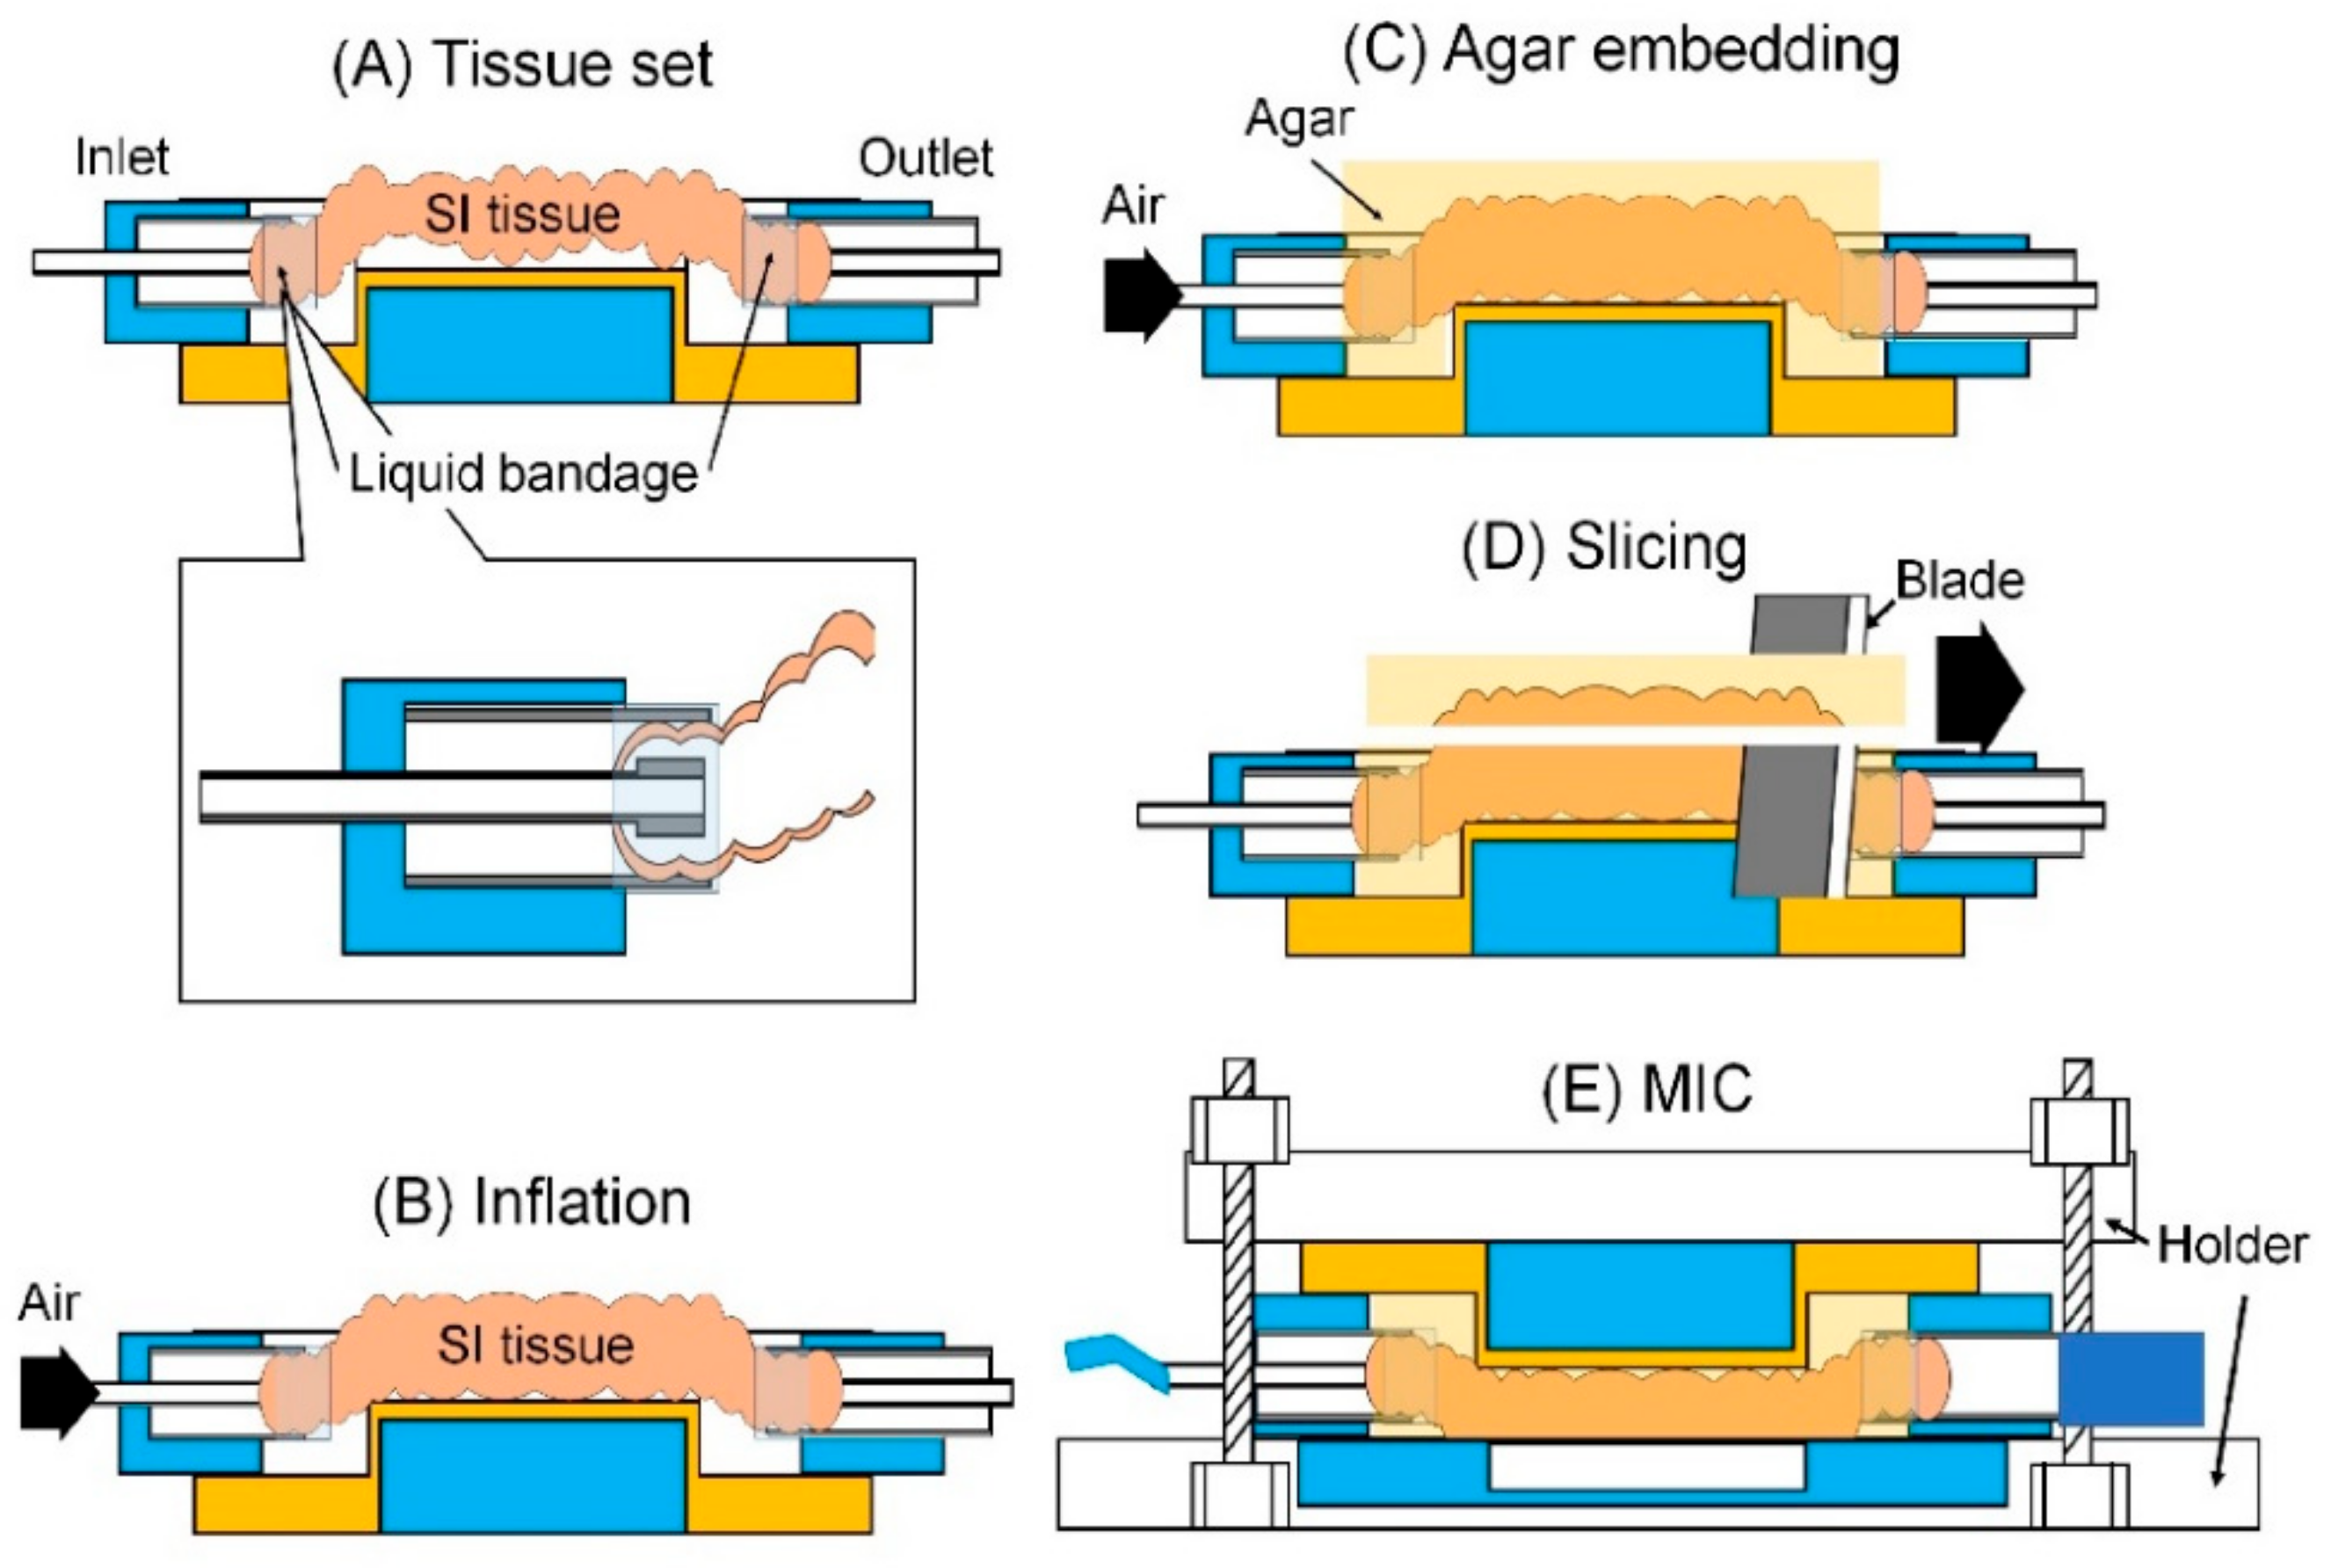
2.2. Tissue Preparation
2.3. Image Acquisition and Processing
2.4. PIV
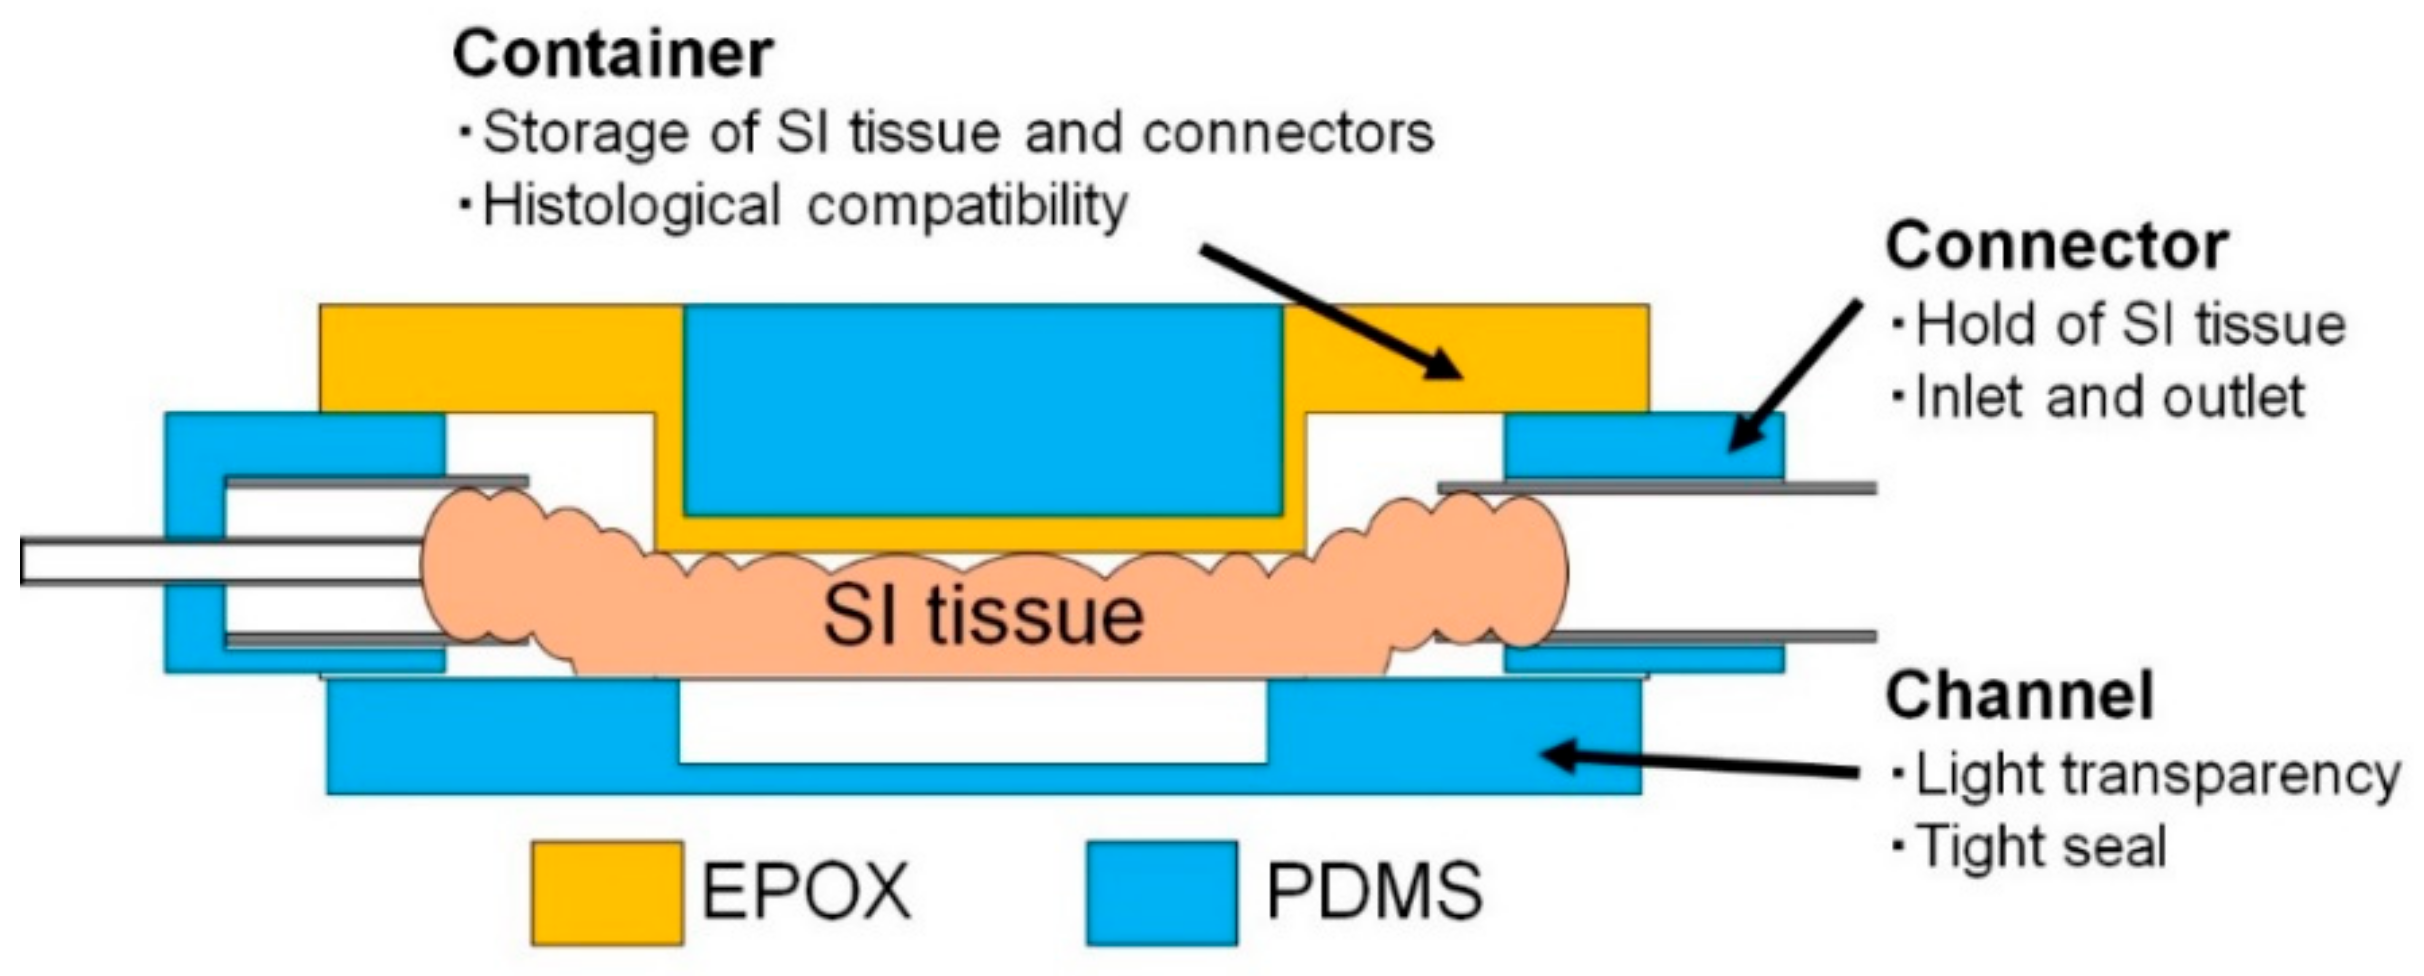
2.5. MIC
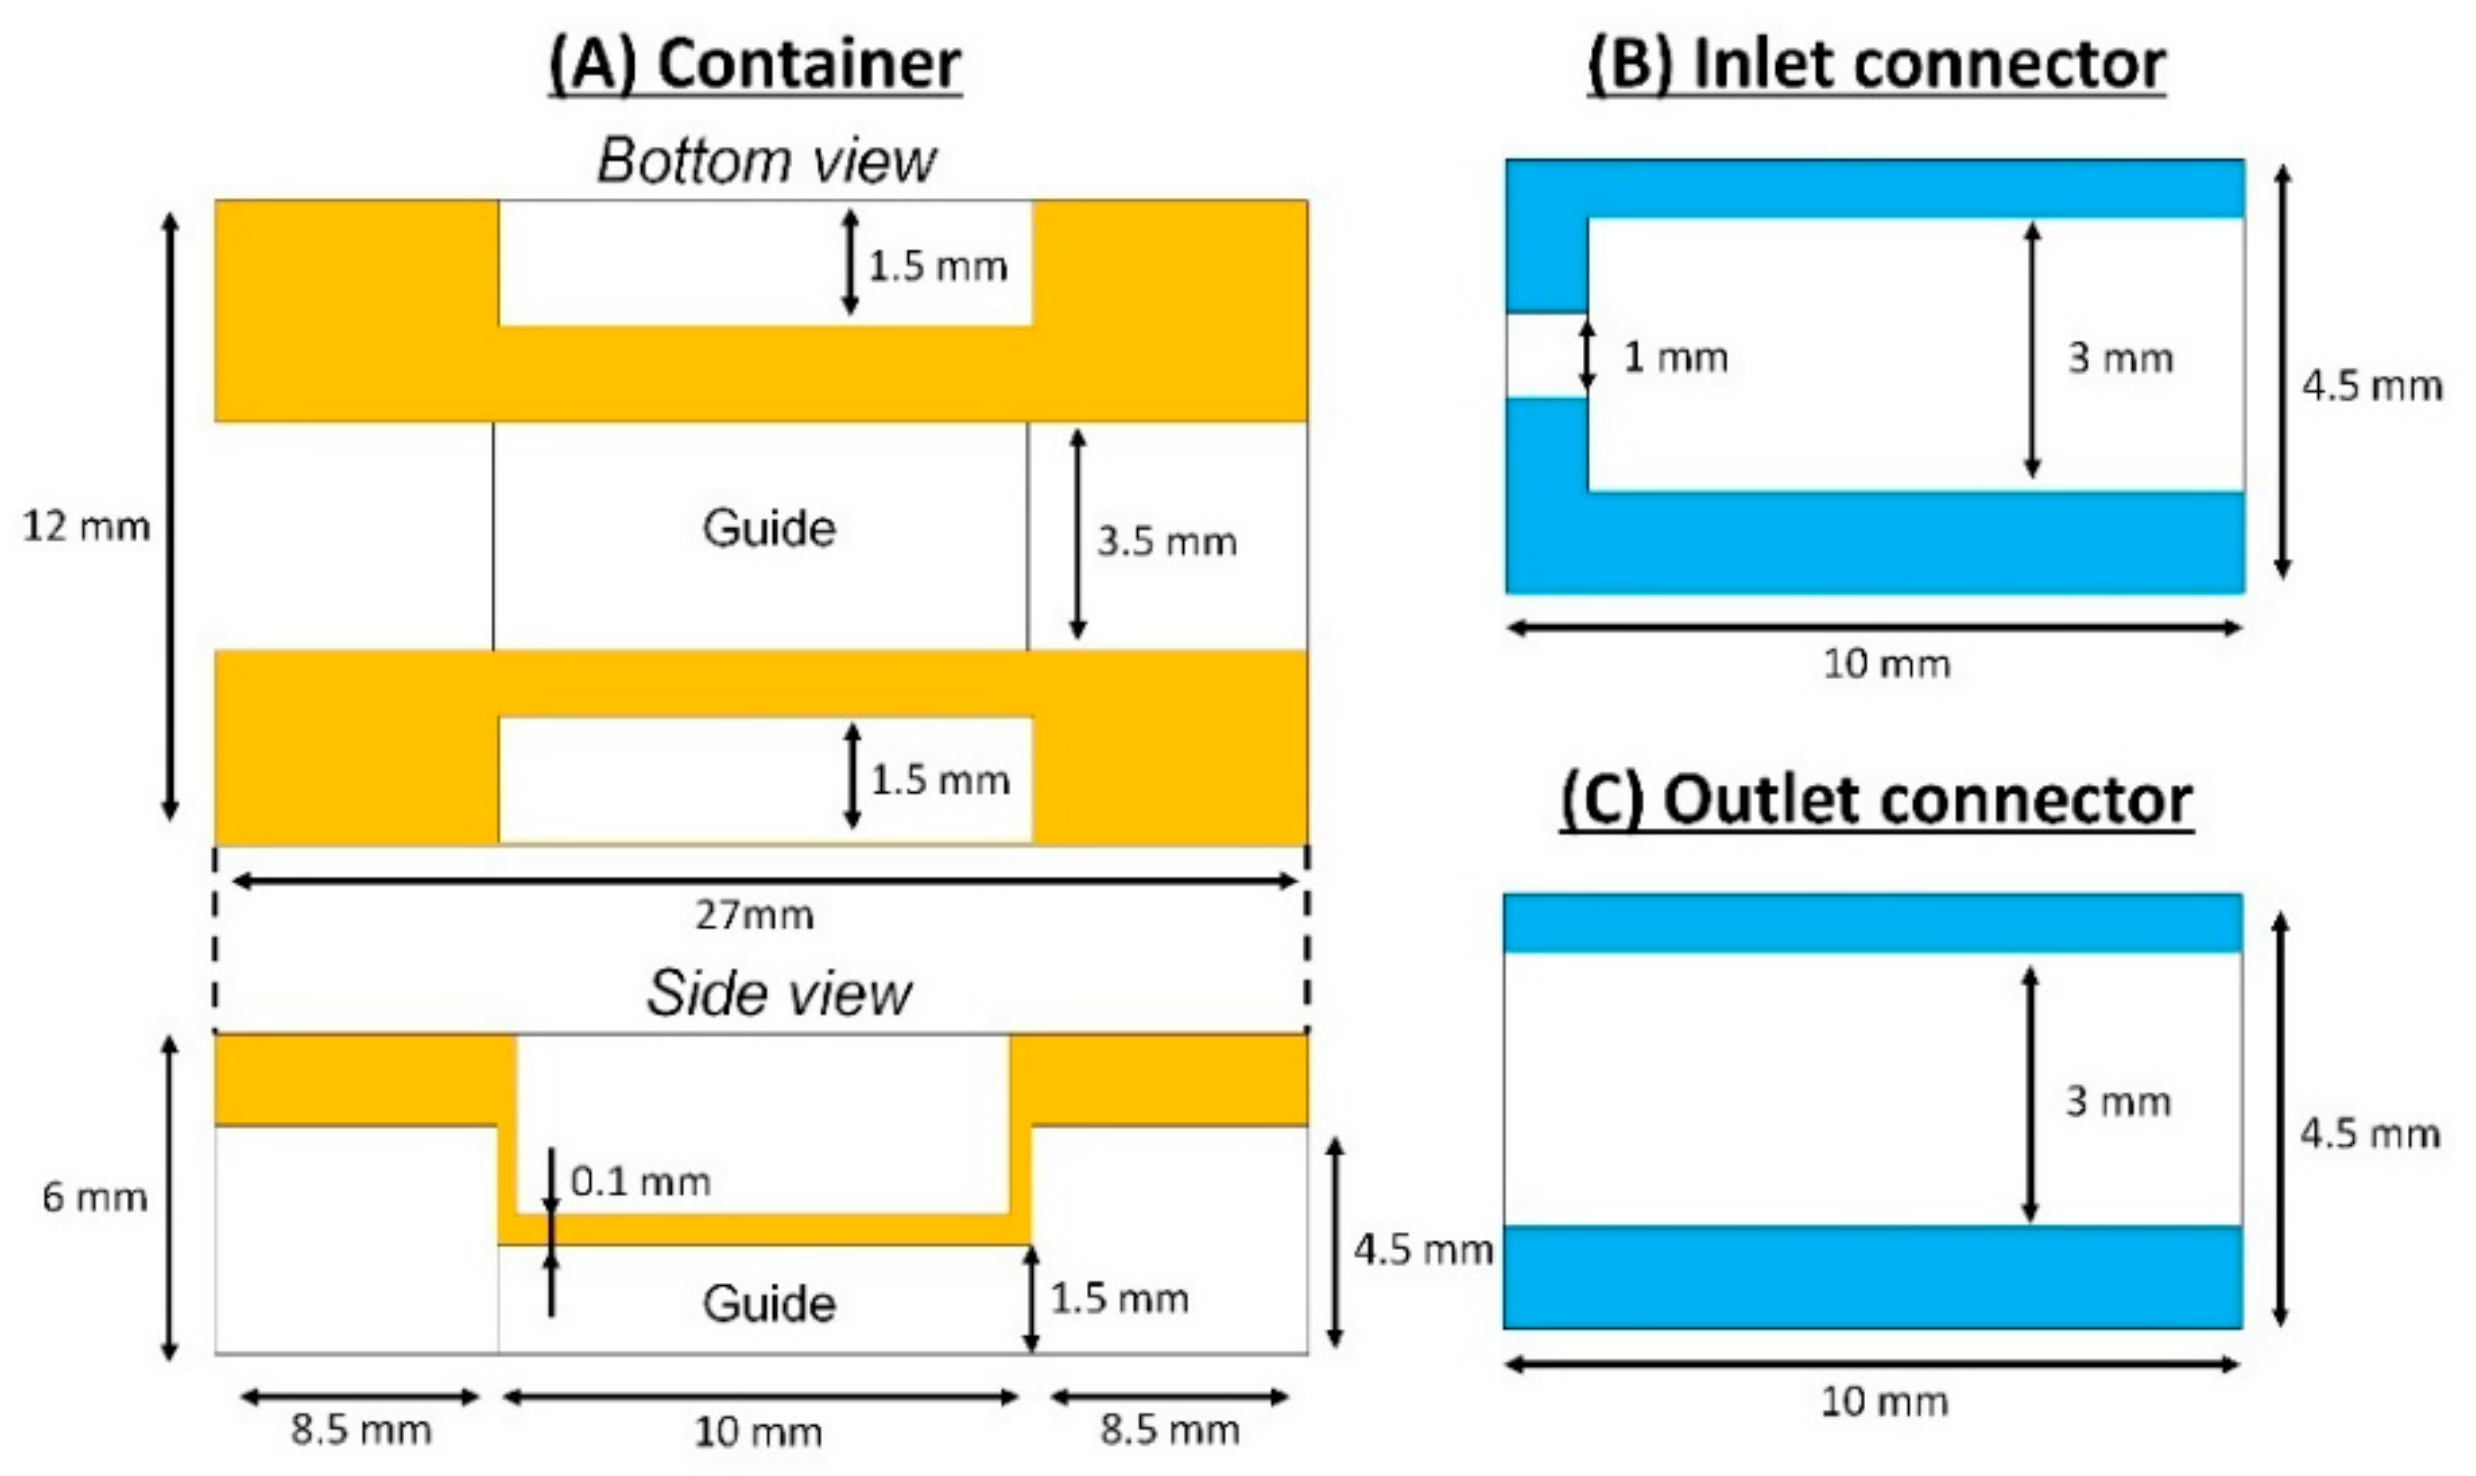
2.5.1. Design of the MIC
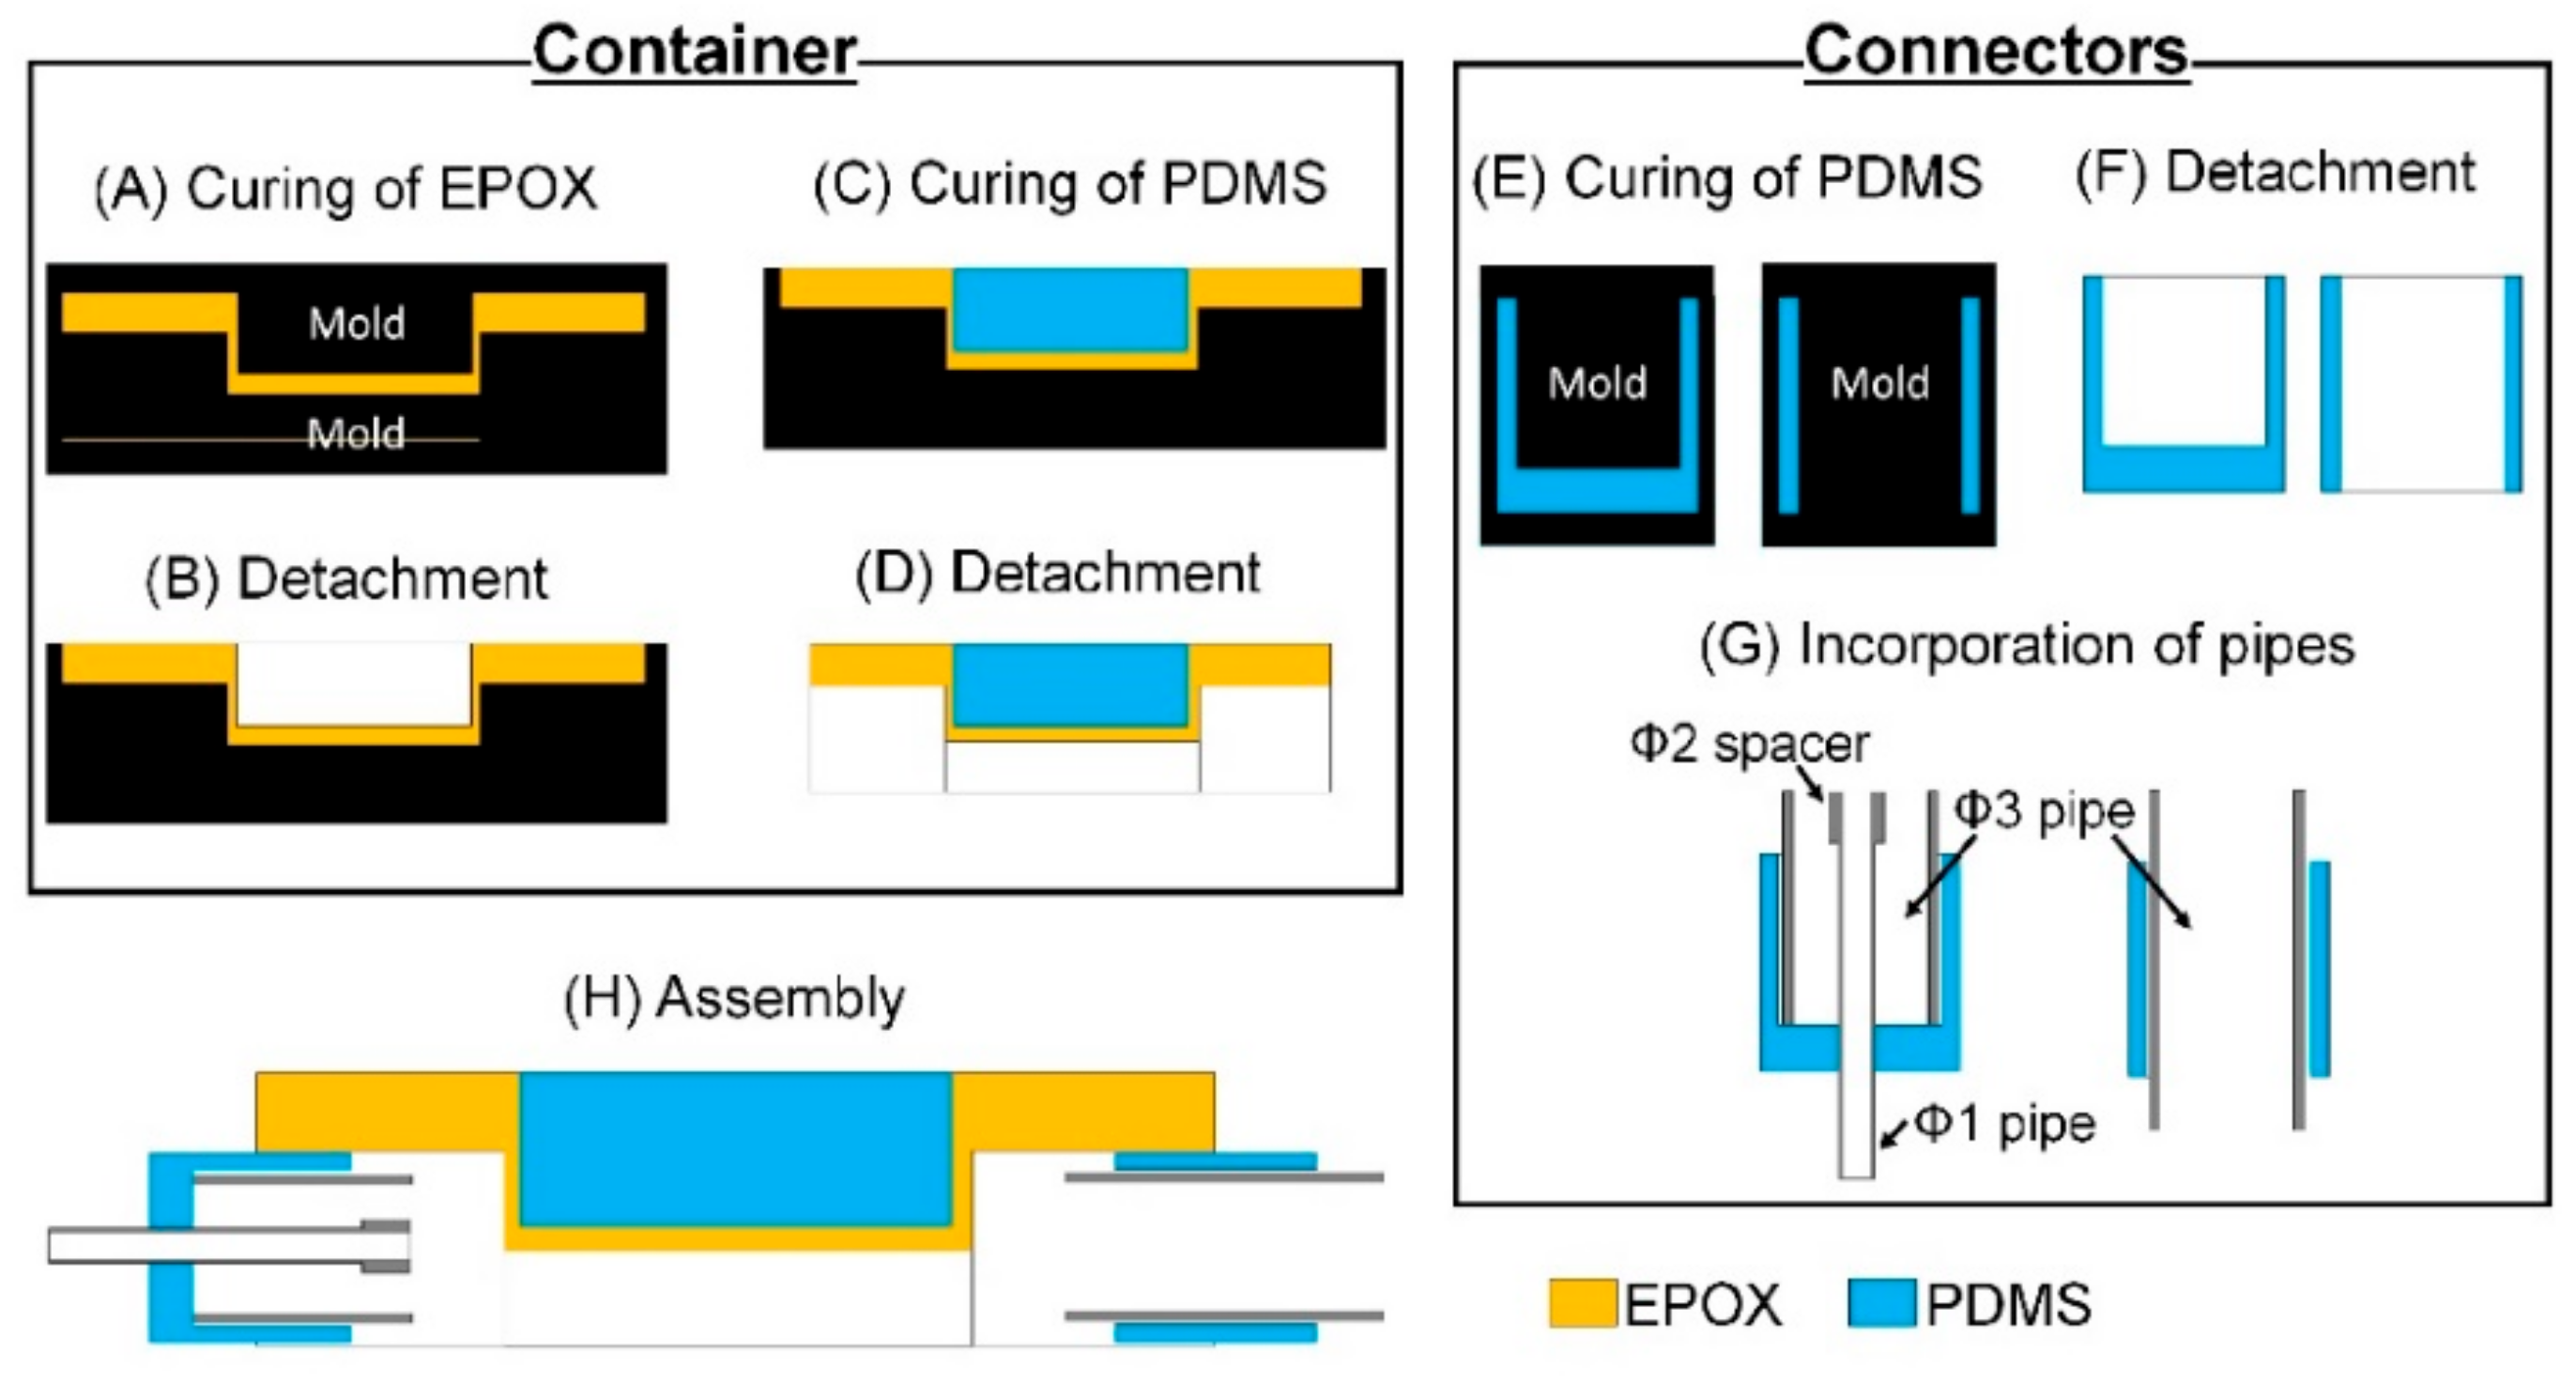
2.5.2. Fabrication Procedure of the MIC
2.5.3. Assembly Procedure of the MIC
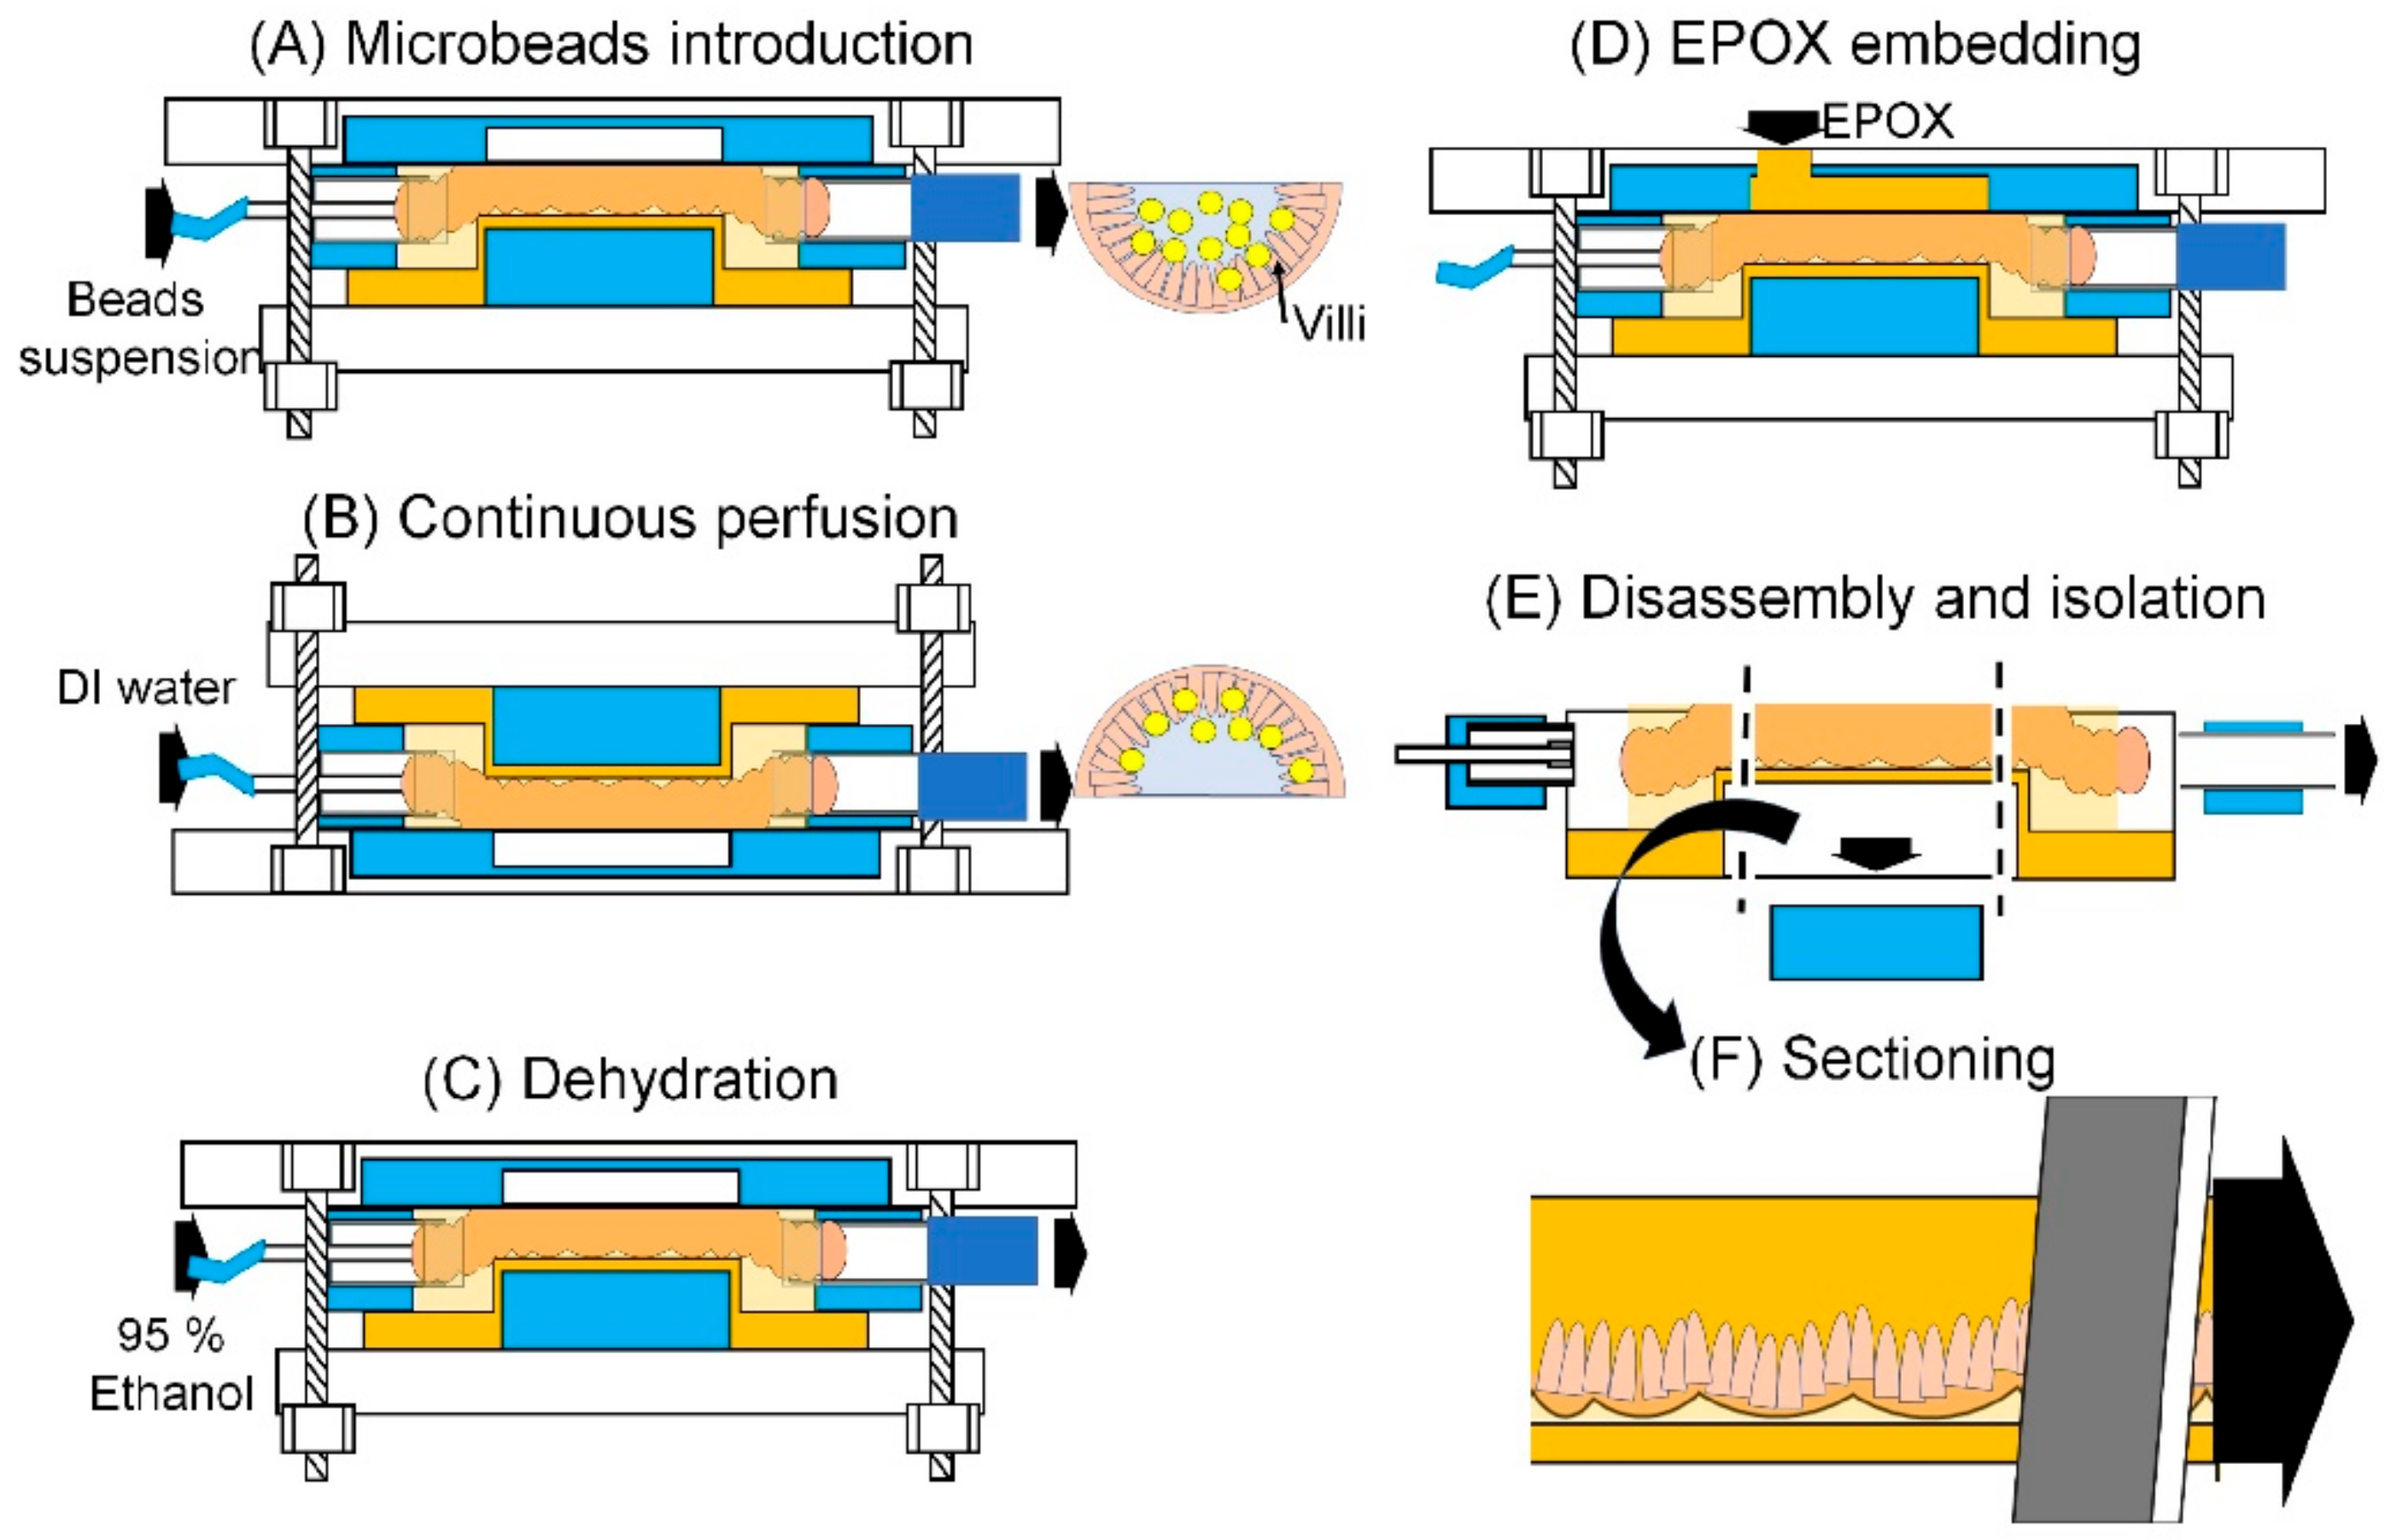
2.5.4. Experimental Procedure Using MIC
3. Results and Discussion
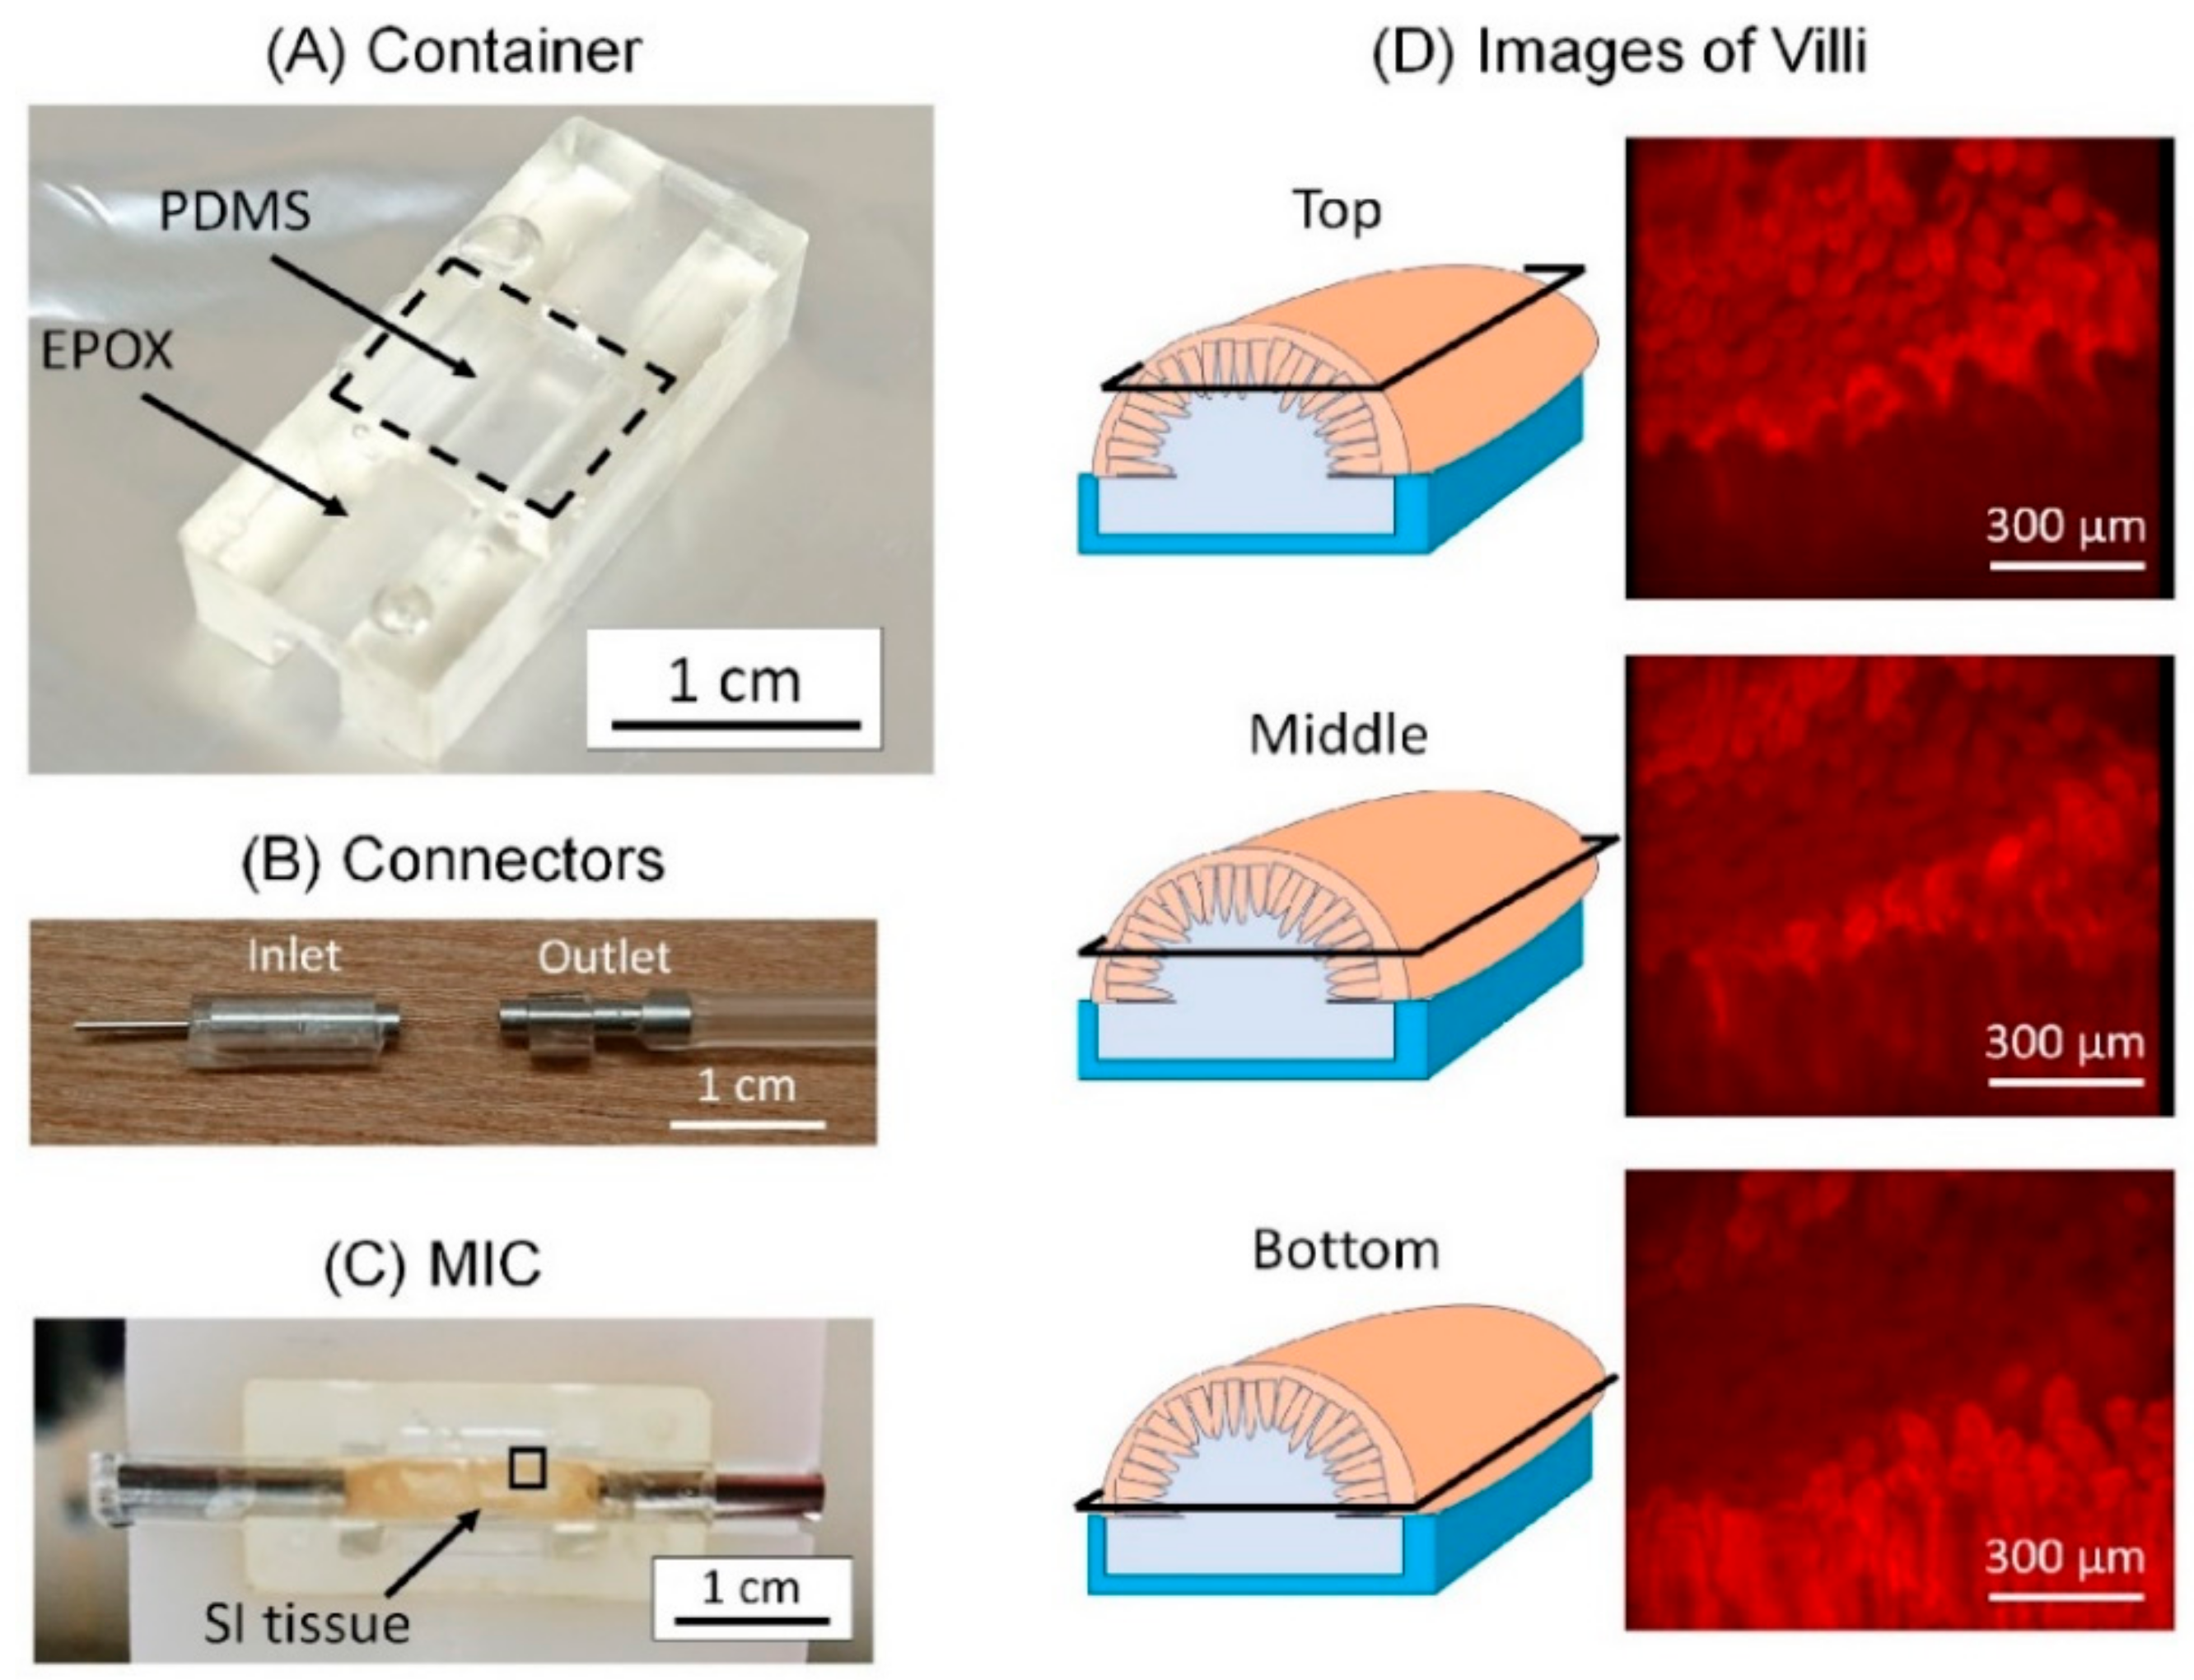
3.1. Fabricated MIC
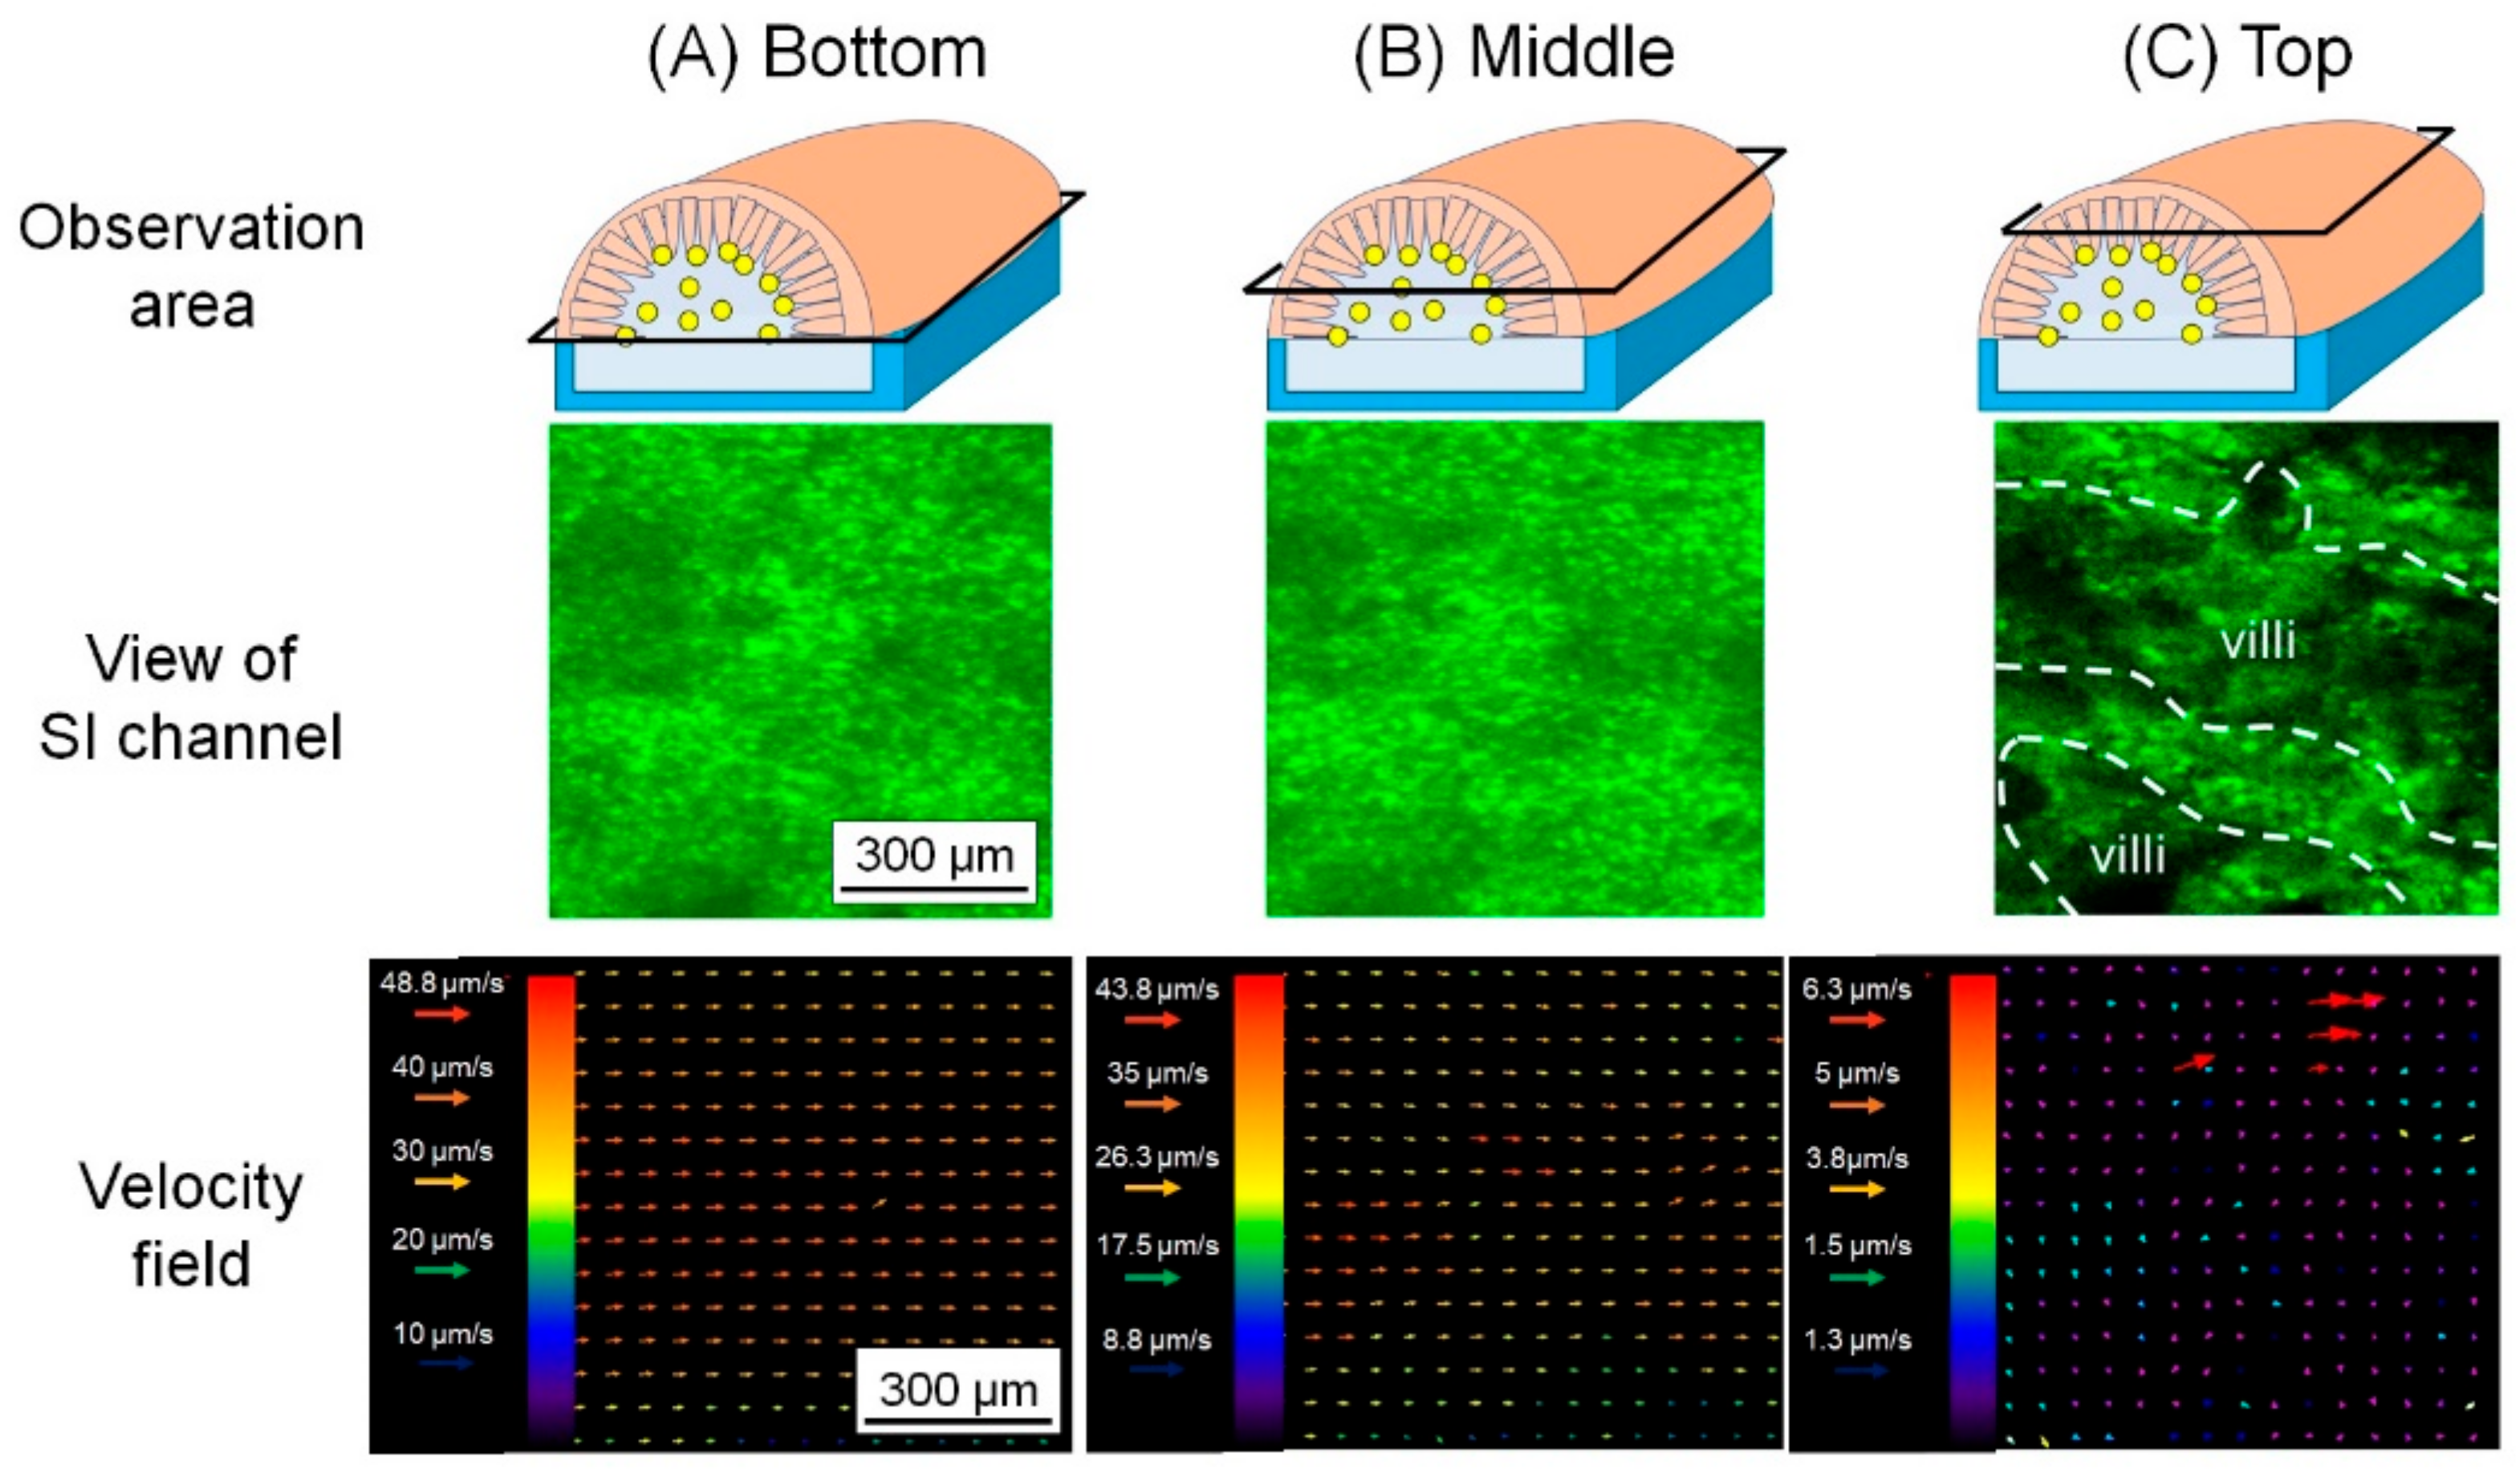
3.2. Analysis of the Microbeads Distribution in SI Channel
3.3. Analysis of Flow Field in SI Channel
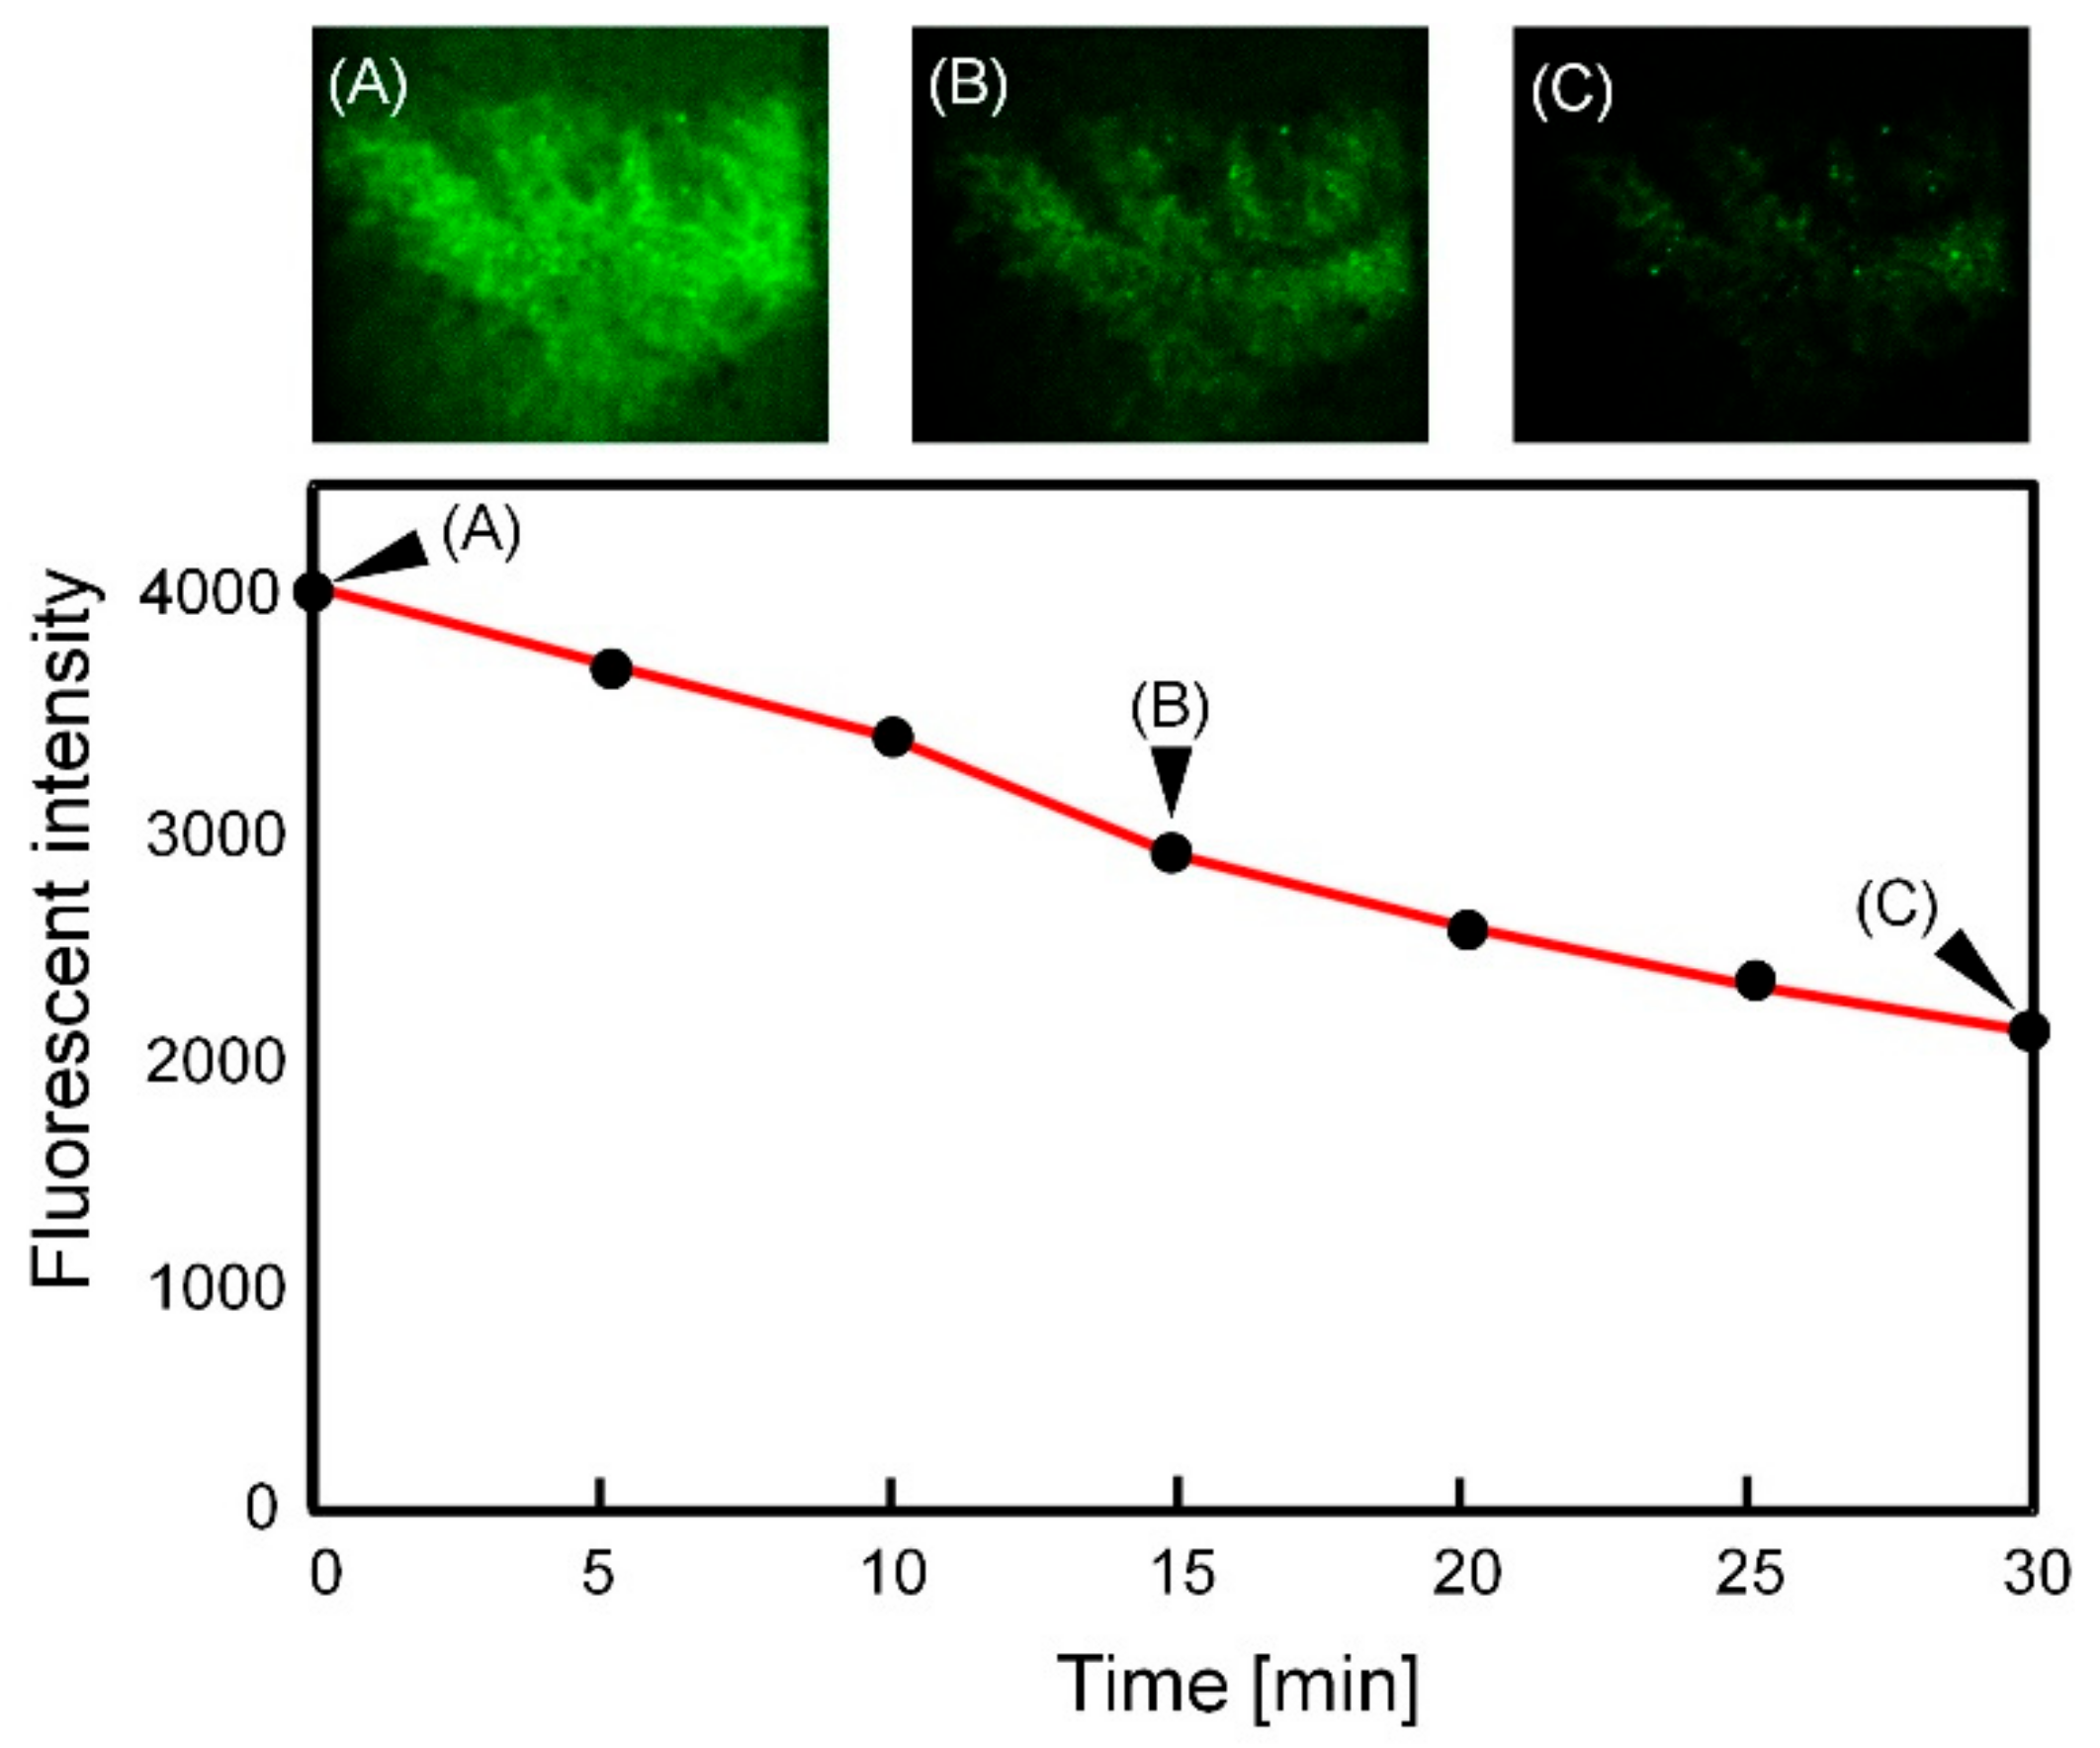
3.4. Transition of the Fluorescent Beads Distribution around the Villi against Time
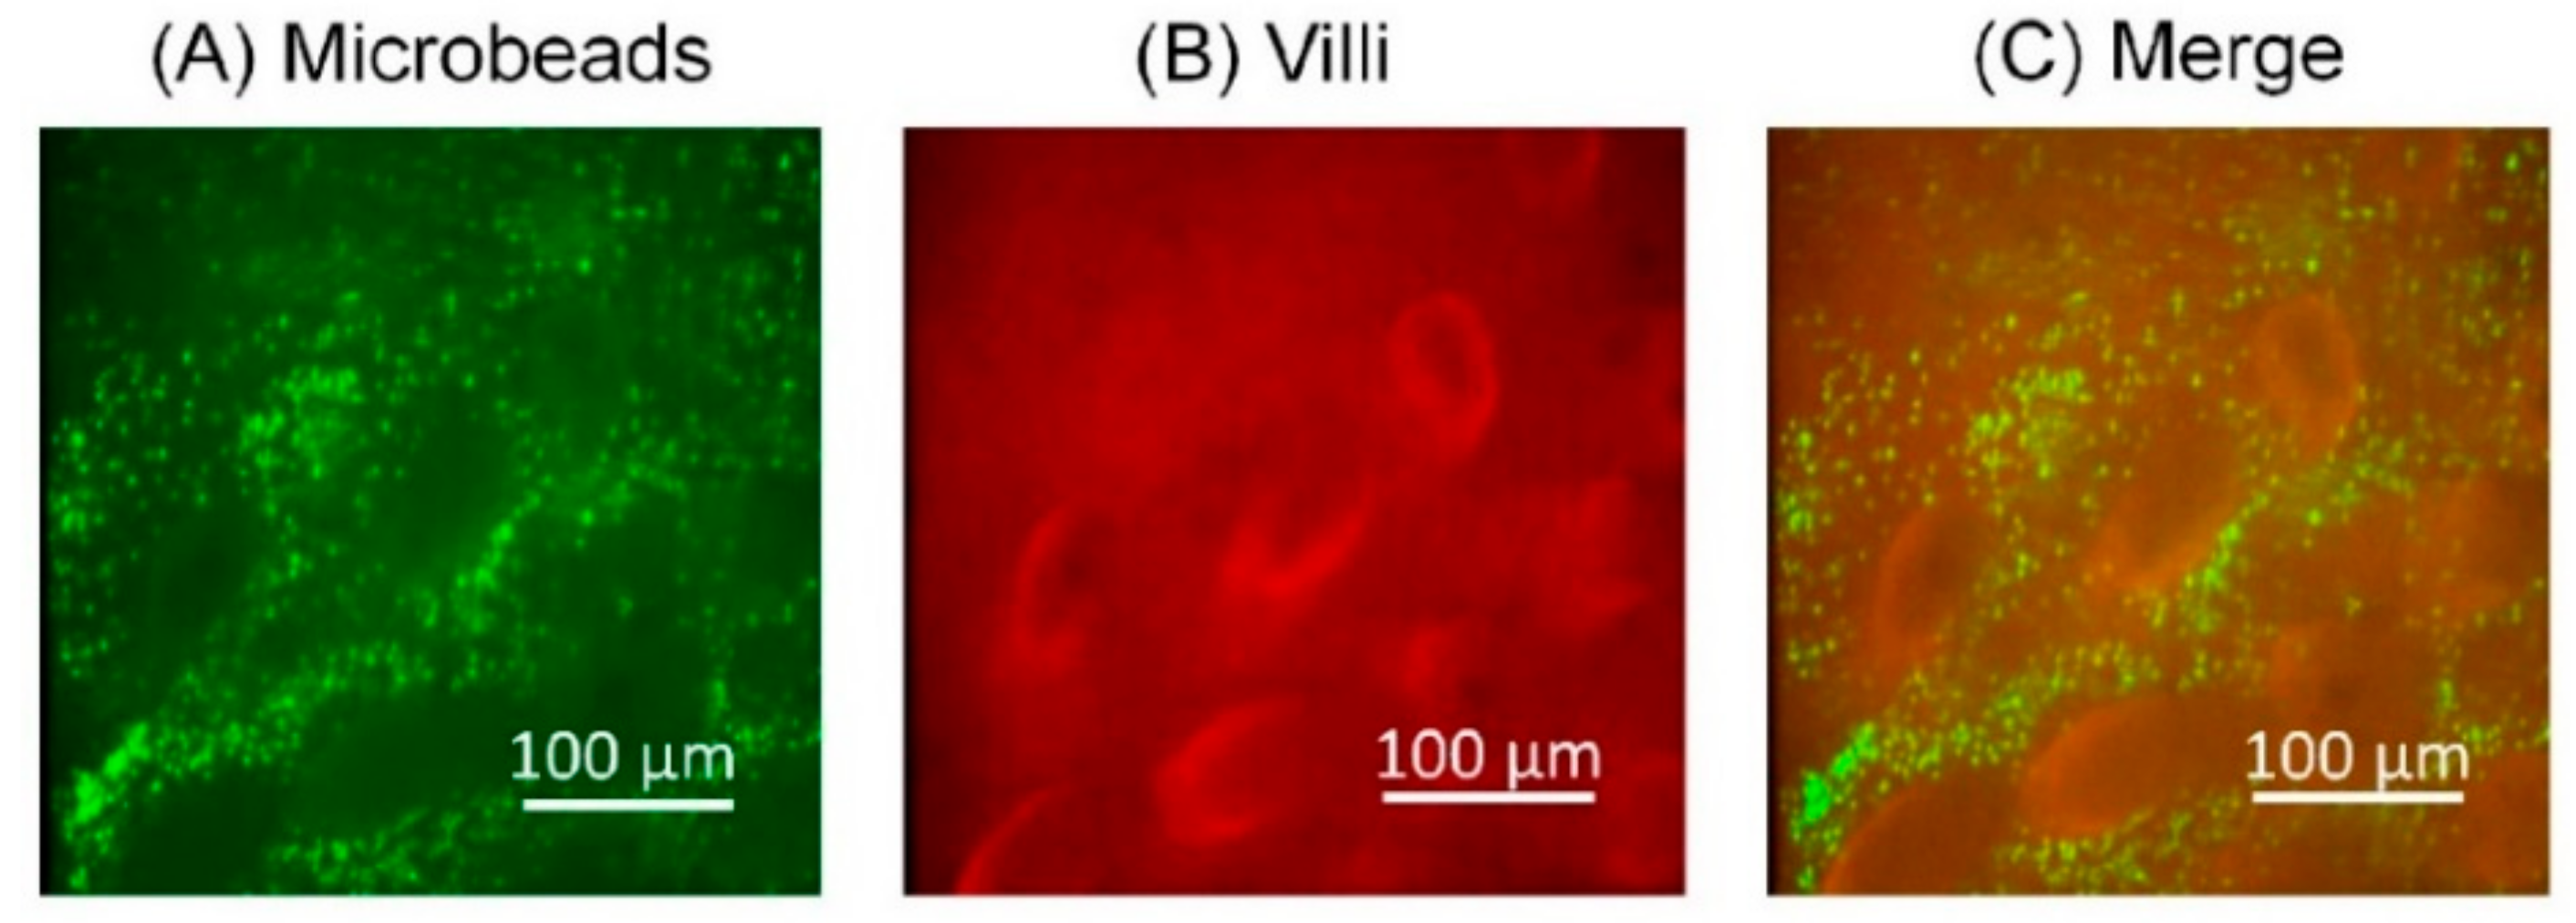
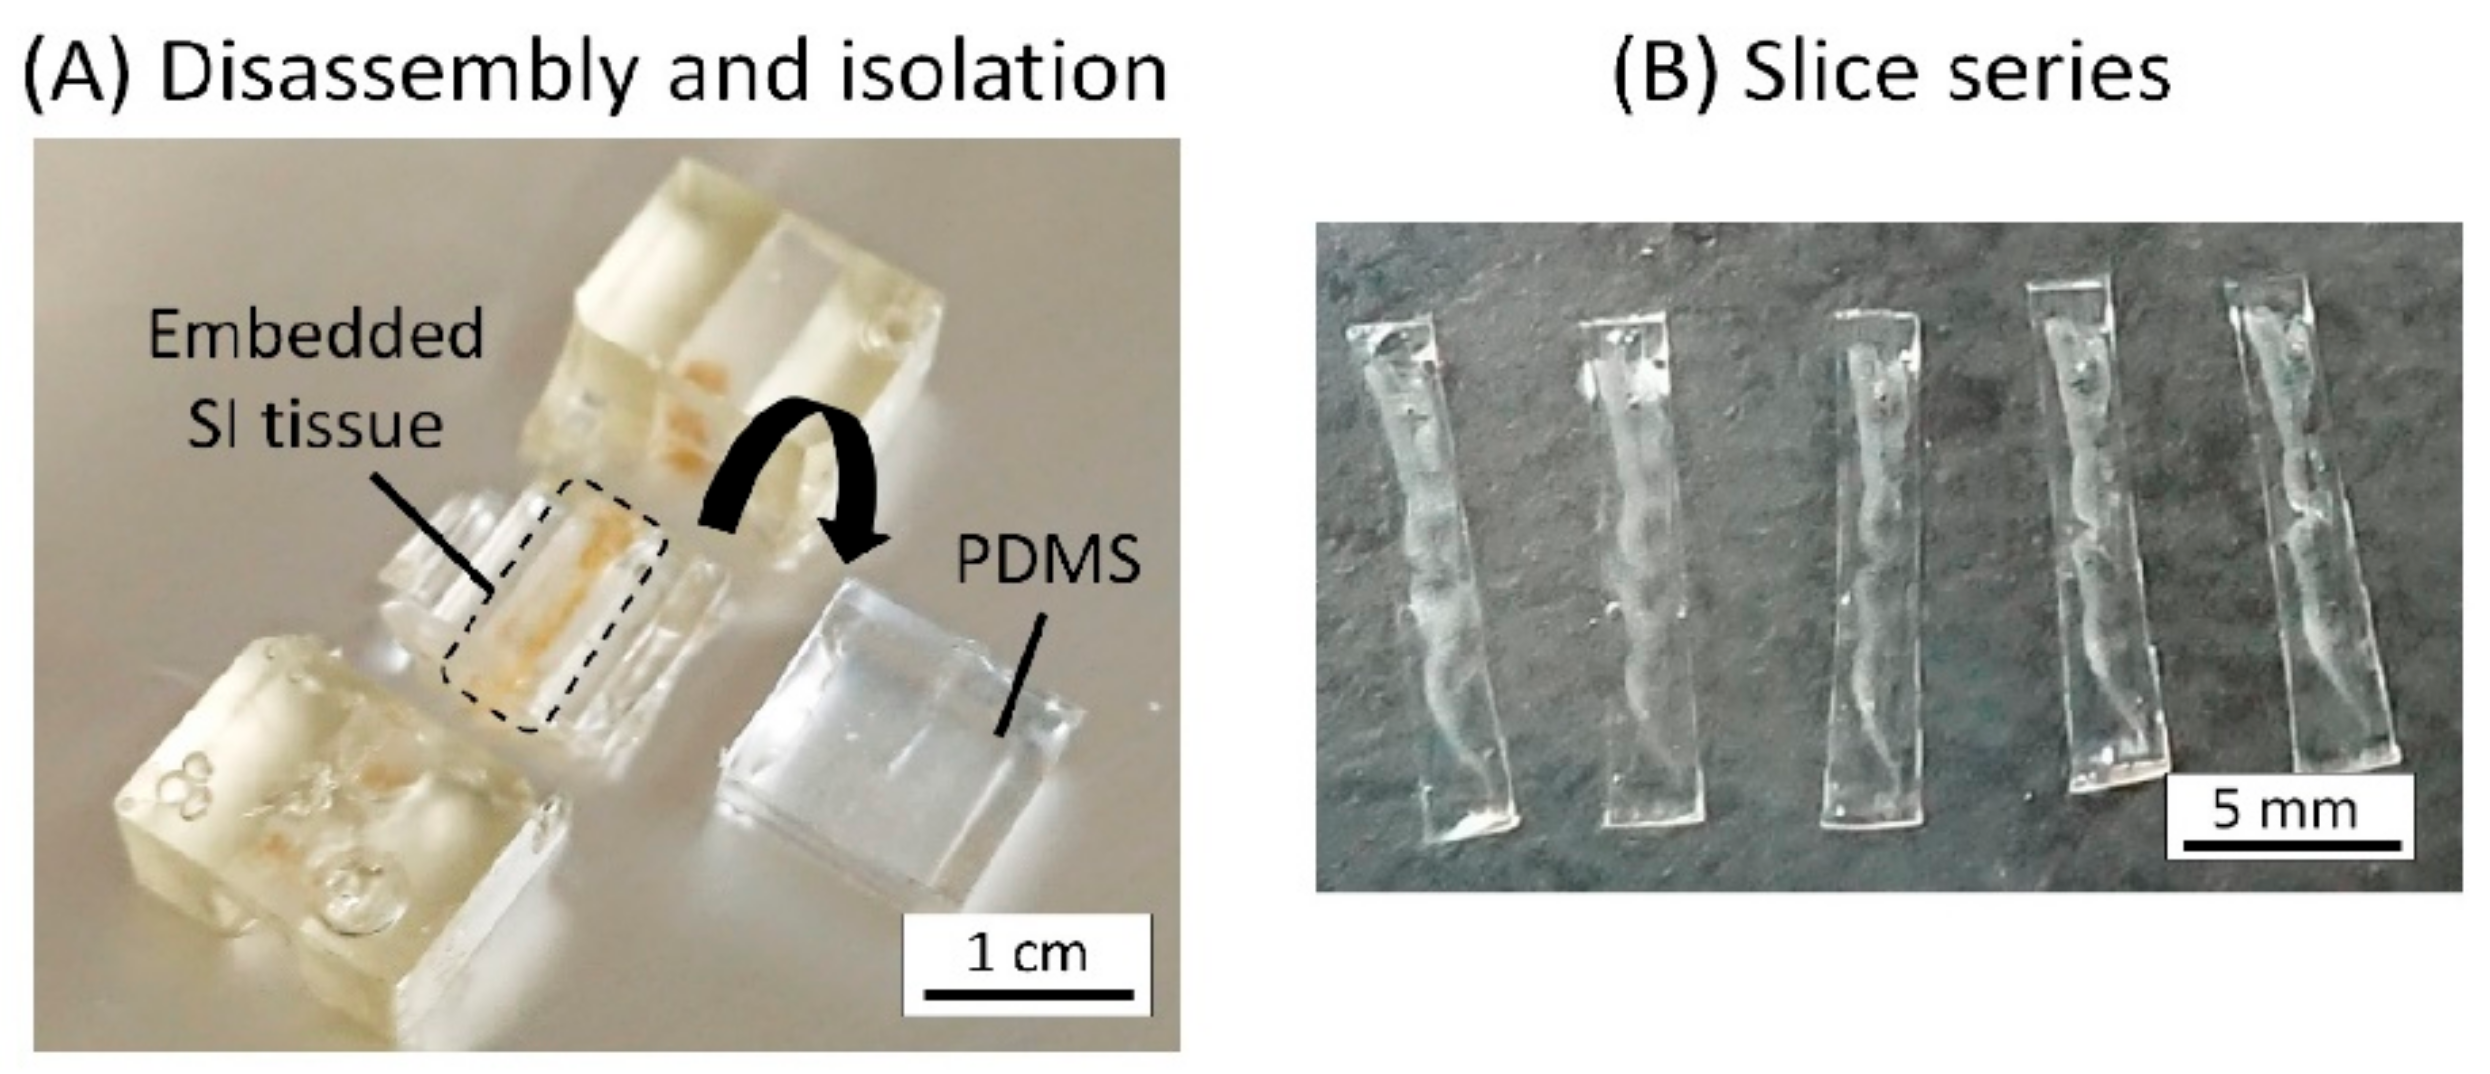
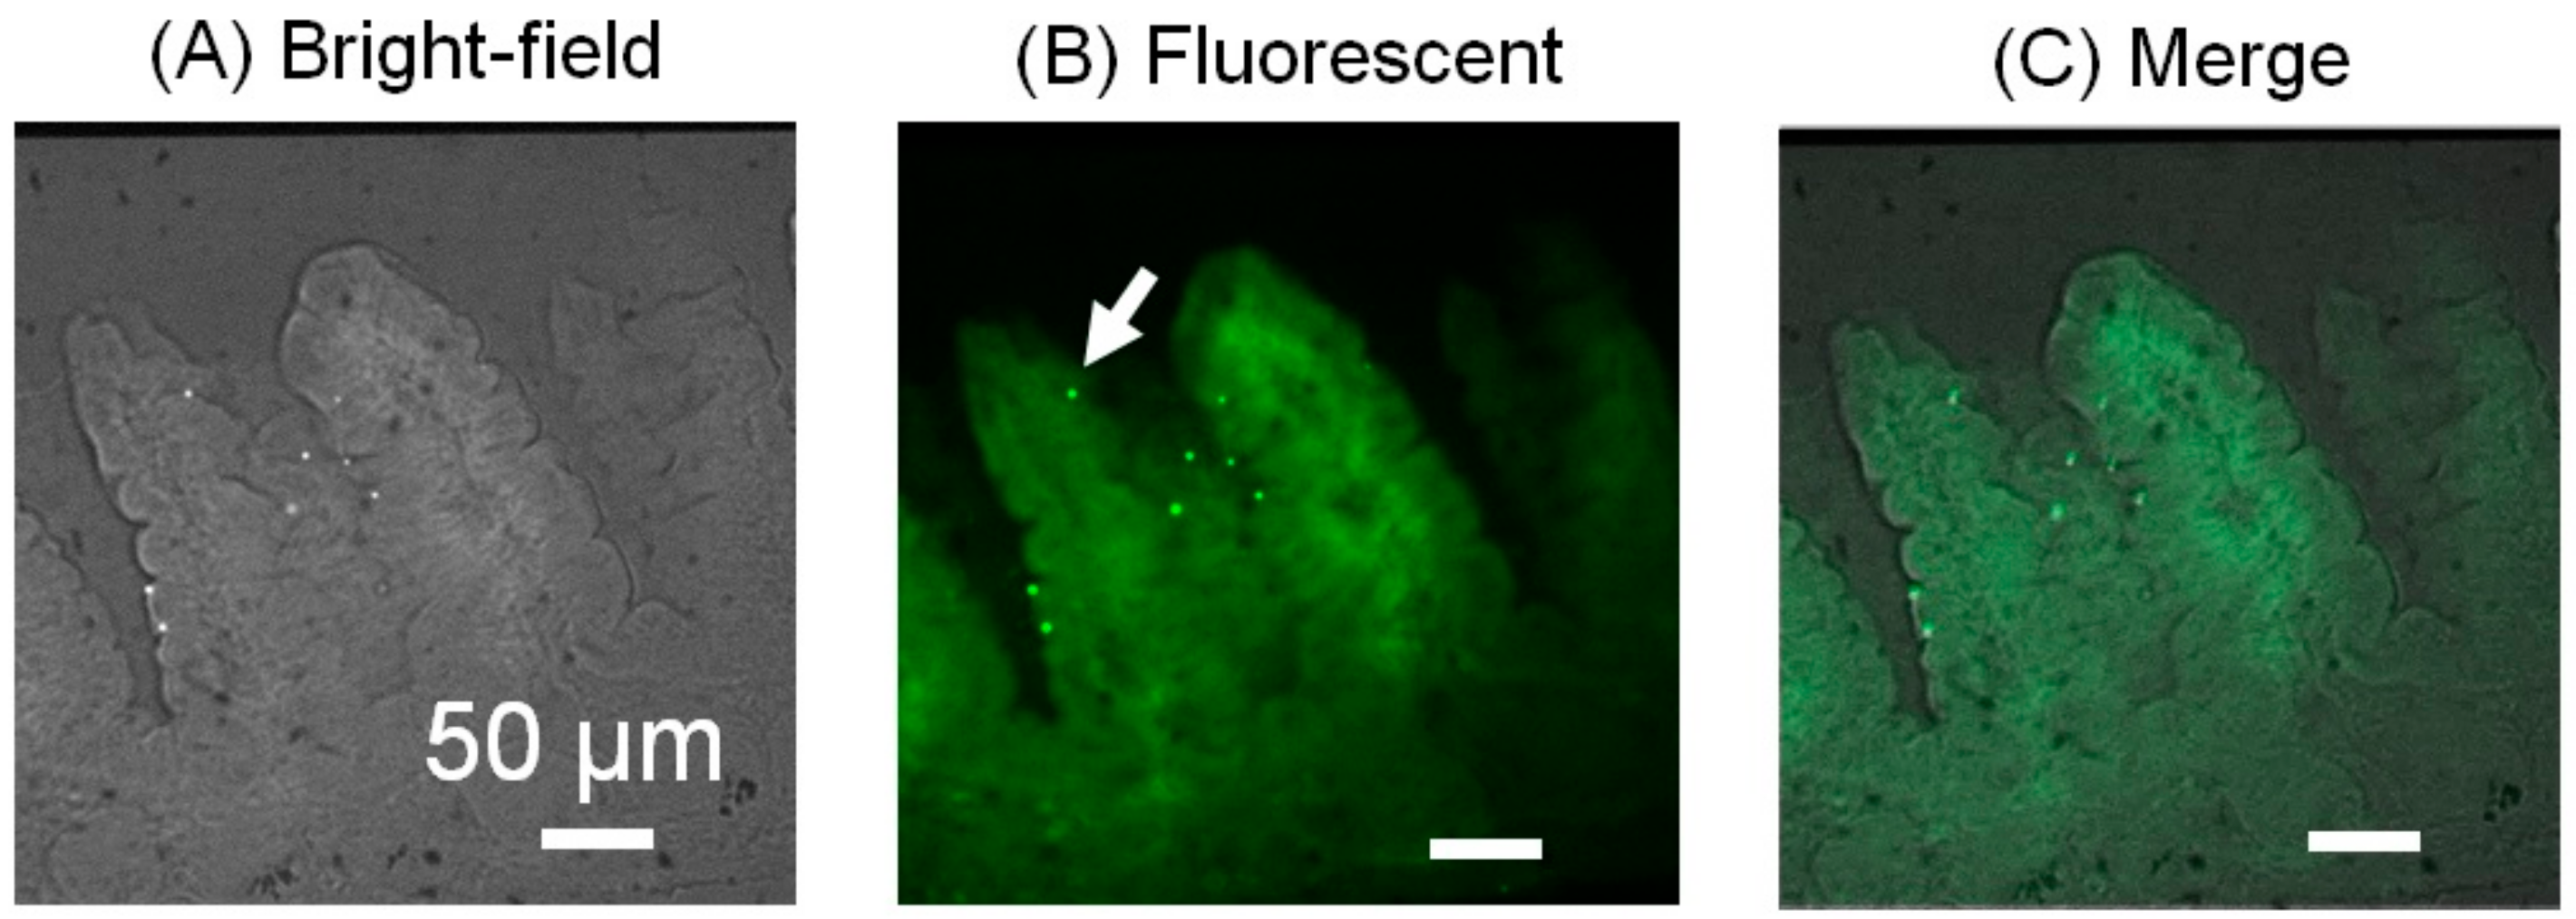
3.5. Histological Analysis of the Microbeads Distribution
4. Conclusions
Supplementary Materials
Author Contributions
Funding
Institutional Review Board Statement
Conflicts of Interest
References
- Huttenhower, C.; Gevers, D.; Knight, R.; Abubucker, S.; Badger, J.H.; Chinwalla, A.T. The Human Microbiome Project Consortium. Structure, function and diversity of the healthy microbiome. Nature 2012, 486, 207. [Google Scholar]
- Geva-Zatorsky, N.; Sefik, E.; Kua, L.; Mathis, D.; Benoist, C.; Kasper, D.L. Mining the Human Gut Microbiota for Immunomodulatory Organisms. Cell 2017, 168, 928–943. [Google Scholar] [CrossRef] [PubMed]
- Marteau, P.; Pochart, P.; Dore, J.; Bera-Maillet, C.; Bernalier, A.; Corthier, G. Comparative Study of Bacterial Groups within the Human Cecal and Fecal self. Appl. Environ. Microbiol. 2001, 67, 4939–4942. [Google Scholar] [CrossRef] [PubMed]
- Espey, M.G. Role of oxygen gradients in shaping redox relationships between the human intestine and its microbiota. Free Radic. Biol. Med. 2013, 55, 130–140. [Google Scholar] [CrossRef] [PubMed]
- Albenberg, L.; Esipova, T.V.; Judge, C.P.; Bittinger, K.; Chen, J.; Laughlin, A.; Grunberg, S.; Baldassano, R.N.; Lewis, J.D.; Li, H.; et al. Correlation Between Intraluminal Oxygen Gradient and Radial Partitioning of Intestinal Microbiota in Humans and Mice. Gastroenterology 2014, 147, 1055–1063. [Google Scholar] [CrossRef]
- Silva, C.D.; Wagner, C.; Bonnardel, J.; Gorvel, J.P.; Lelouard, H. The Peyer’s Patch Mononuclear Phagocyte System at Steady State and during Infection. Front. Immunol. 2017, 8, 1254. [Google Scholar] [CrossRef]
- Takiishi, T.; Fenero, C.I.M.; Câmara, N.O.S. Intestinal barrier and gut microbiota: Shaping our immune responses throughout life. Tissue Barriers 2017, 5, e13732208. [Google Scholar] [CrossRef]
- Atarashi, K.; Tanoue, T.; Ando, M.; Hattori, M.; Umesaki, Y.; Honda, K. Th17 Cell Induction by Adhesion of Microbes to Intestinal Epithelial Cells. Cell 2015, 163, 367–380. [Google Scholar] [CrossRef] [PubMed]
- Chieppa, A.; Rescigno, M.; Huang, A.Y.C.; Germain, R.N. Dynamic imaging of dendritic cell extension into the small bowel lumen in response to epithelial cell TLR engagement. J. Exp. Med. 2006, 203, 2841–2852. [Google Scholar] [CrossRef] [PubMed]
- Chang, S.Y.; Ko, H.J.; Kweon, M.N. Mucosal dendritic cells shape mucosal immunity. Exp. Mol. Med. 2014, 46, e84. [Google Scholar] [CrossRef]
- Suh, S.H.; Choe, K.; Hong, S.P.; Jeong, S.H.; Mäkinen, T.; Kim, K.S.; Alitalo, K.; Surh, C.D.; Koh, G.Y.; Song, J.H. Gut microbiota regulates lacteal integrity by inducing VEGF-C in intestinal villus macrophages. EMBO Rep. 2019, 20, e46927. [Google Scholar] [CrossRef] [PubMed]
- Jang, M.H.; Kweon, M.N.; Iwatani, K.; Yamamoto, M.; Terahara, K.; Sasakawa, C.; Suzuki, T.; Nochi, T.; Yokota, Y.; Rennert, P.D.; et al. Intestinal villous M cells: An antigen entry site in the mucosal epithelium. Proc. Natl. Acad. Sci. USA 2004, 101, 6110–6115. [Google Scholar] [CrossRef] [PubMed]
- Torii, A.; Torii, S.; Fujiwara, S.; Tanaka, H.; Inagaki, N.; Nagai, H. Lactobacillus Acidophilus Strain L-92 Regulates the Production of Th1 Cytokine as well as Th2 Cytokines. Allergol. Int. 2007, 56, 293–301. [Google Scholar] [CrossRef] [PubMed]
- Yanagihara, S.; Kanaya, T.; Fukuda, S.; Nakato, G.; Hanazato, M.; Wu, X.R.; Yamamoto, N.; Ohno, H. Uromodulin-SlpA binding dictates Lactobacillus acidophilus uptake by intestinal epithelial M cells. Int. Immunol. 2017, 29, 357–363. [Google Scholar] [CrossRef]
- Shreedhar, V.K.; Kelsall, B.L.; Neutra, M.R. Cholera Toxin Induces Migration of Dendritic Cells from the Subepithelial Dome Region to T- and B-Cell Areas of Peyer’s Patches. Infect. Immun. 2003, 71, 504–509. [Google Scholar] [CrossRef] [PubMed]
- Kim, H.J.; Huh, D.; Hamilton, G.; Ingber, D.E. Human gur-on-a-chip inhabited by microbial flora that experiences intestinal peristalsis-like motions and flow. Lab Chip 2012, 12, 2165–2174. [Google Scholar] [CrossRef]
- Donkers, J.M.; Amirabadi, H.E.; Steeg, E.V.D. Intestine-on-a-chip: Next level in vitro research model of the human intestine. Curr. Opin. Toxicol. 2021, 25, 6–14. [Google Scholar] [CrossRef]
- Shah, P.; Fritz, J.V.; Glaab, E.; Desai, M.S.; Greenhalgh, K.; Frachet, A.; Niegowska, M.; Estes, M.; Jäger, C.; Seguin-Devaux, C.; et al. A microfluidics-based in vitro model of the gastrointestinal human-microbe interface. Nat. Commun. 2016, 7, 11535. [Google Scholar] [CrossRef] [PubMed]
- Jing, B.; Wang, Z.A.; Zhang, C.; Deng, Q.; Wei, J.; Luo, Y.; Zhang, X.; Li, J.; Du, Y. Establishment and Application of Peristaltic Human Gut-Vessel Microsystem for Studying Host-Microbial Interaction. Front. Bioeng. Biotechnol. 2020, 8, 272. [Google Scholar] [CrossRef]
- Bein, A.; Shin, W.; Jalili-Firoozinezhad, S.; Park, M.H.; Sontheimer-Phelps, A.; Tovaglieri, A.; Chalkidaki, A.; Kim, H.J.; Ingber, D.E. Microfluidic Organ-on-a-Chip Models of Human Intestine. CMGH Cell. Mol. Gastroenterol. Hepatol. 2017, 5, 659–668. [Google Scholar] [CrossRef]
- Kim, H.J.; Lee, J.; Choi, J.H.; Bahinski, A.; Ingber, D.E. Co-culture of Living Microbiome with Microengineered Human Intestinal Villi in a Gut-on-a-Chip Microfluidic Device. J. Vis. Exp. 2016, 114, e54344. [Google Scholar] [CrossRef] [PubMed]
- Kim, H.J.; Ingber, D.E. Gut-on-a-Chip microenvironment induces human intestinal cells to undergo villus differentiation. Integr. Biol. 2013, 5, 1130–1140. [Google Scholar] [CrossRef]
- Costa, M.O.; Nosach, R.; Harding, J.C.S. Development of a 3D printed device to support long term intestinal culture as an alternative to hyperoxic chamber methods. 3D Print. Med. 2017, 3, 9. [Google Scholar] [CrossRef] [PubMed]
- Baydoun, M.; Treizeibré, A.; Follet, J.; Vanneste, S.B.; Creusy, C.; Dercourt, L.; Delaire, B.; Mouray, A.; Viscogliosi, E.; Certad, G.; et al. An interphase Microfluidic Culture System for the Study of Ex Vivo Intestinal Tissue. Micromachiens 2020, 11, 150. [Google Scholar] [CrossRef] [PubMed]
- Dawson, A.; Dyer, C.; Macfie, J.; Davise, J.; Karsai, L.; Greenman, J.; Jacobsen, M. A microfluidic chip based model for the study of full thickness human intestinal tissue using dual flow. Biomicrofluidics 2016, 10, 064101. [Google Scholar] [CrossRef] [PubMed]
- Richardson, A.; Schwerdtfeger, L.A.; Eaton, D.; Mclean, I.; Henry, C.S.; Tobet, S.A. A microfluidic organotypic device for culture of mammalian intestines ex vivo. Anal. Method. 2020, 12, 297–303. [Google Scholar] [CrossRef]
- Kuriu, S.; Kadonosono, T.; Kizaka-Kondoh, S.; Ishida, T. Slicing Spheroid in Microfluidic Devices for Morphological and Immunohistochemical Analysis. Micromachines 2020, 11, 480. [Google Scholar] [CrossRef]
- Cremer, J.; Segota, I.; Yang, C.Y.; Arnoldini, M.; Sauls, J.T.; Zhang, Z.; Gutierrez, E.; Groisman, A.; Hwa, T. Effect of flow and peristaltic mixing on bacterial growth in a gut-like channel. Proc. Natl. Acad. Sci. USA 2016, 113, 11414–11419. [Google Scholar] [CrossRef]
- Demouveaux, B.; Gouyer, V.; Robbe-Masselot, C.; Gottrand, F.; Narita, T.; Desseyn, J.L. Mucin CYS domain stiffens the mucus gel hindering bacteria and spermatozoa. Sci. Rep. 2019, 9, 16993. [Google Scholar] [CrossRef]
- Lieleg, O.; Vladescu, I.; Ribbeck, K. Characterization of Particle Translocation through Mucin Hydrogels. Biophys. J. 2010, 98, 1782–1789. [Google Scholar] [CrossRef] [PubMed]


Publisher’s Note: MDPI stays neutral with regard to jurisdictional claims in published maps and institutional affiliations. |
© 2021 by the authors. Licensee MDPI, Basel, Switzerland. This article is an open access article distributed under the terms and conditions of the Creative Commons Attribution (CC BY) license (https://creativecommons.org/licenses/by/4.0/).
Share and Cite
Kuriu, S.; Yamamoto, N.; Ishida, T. Microfluidic Device Using Mouse Small Intestinal Tissue for the Observation of Fluidic Behavior in the Lumen. Micromachines 2021, 12, 692. https://doi.org/10.3390/mi12060692
Kuriu S, Yamamoto N, Ishida T. Microfluidic Device Using Mouse Small Intestinal Tissue for the Observation of Fluidic Behavior in the Lumen. Micromachines. 2021; 12(6):692. https://doi.org/10.3390/mi12060692
Chicago/Turabian StyleKuriu, Satoru, Naoyuki Yamamoto, and Tadashi Ishida. 2021. "Microfluidic Device Using Mouse Small Intestinal Tissue for the Observation of Fluidic Behavior in the Lumen" Micromachines 12, no. 6: 692. https://doi.org/10.3390/mi12060692
APA StyleKuriu, S., Yamamoto, N., & Ishida, T. (2021). Microfluidic Device Using Mouse Small Intestinal Tissue for the Observation of Fluidic Behavior in the Lumen. Micromachines, 12(6), 692. https://doi.org/10.3390/mi12060692