
Detection of Senecionine in Dietary Sources by Single-Use Electrochemical Sensor


Abstract
:
1. Introduction
2. Materials and Methods
2.1. Apparatus
2.2. Chemicals
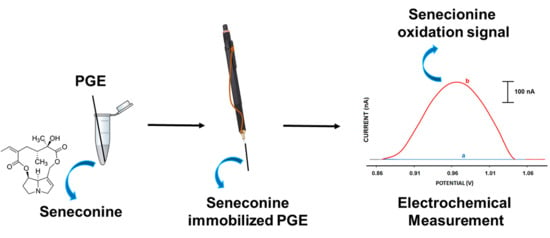
2.3. Procedure
2.4. Sample Preparation
2.4.1. Flour
2.4.2. Aqueous Extraction of Herbal Tea Sample
2.5. Electrochemical Measurement
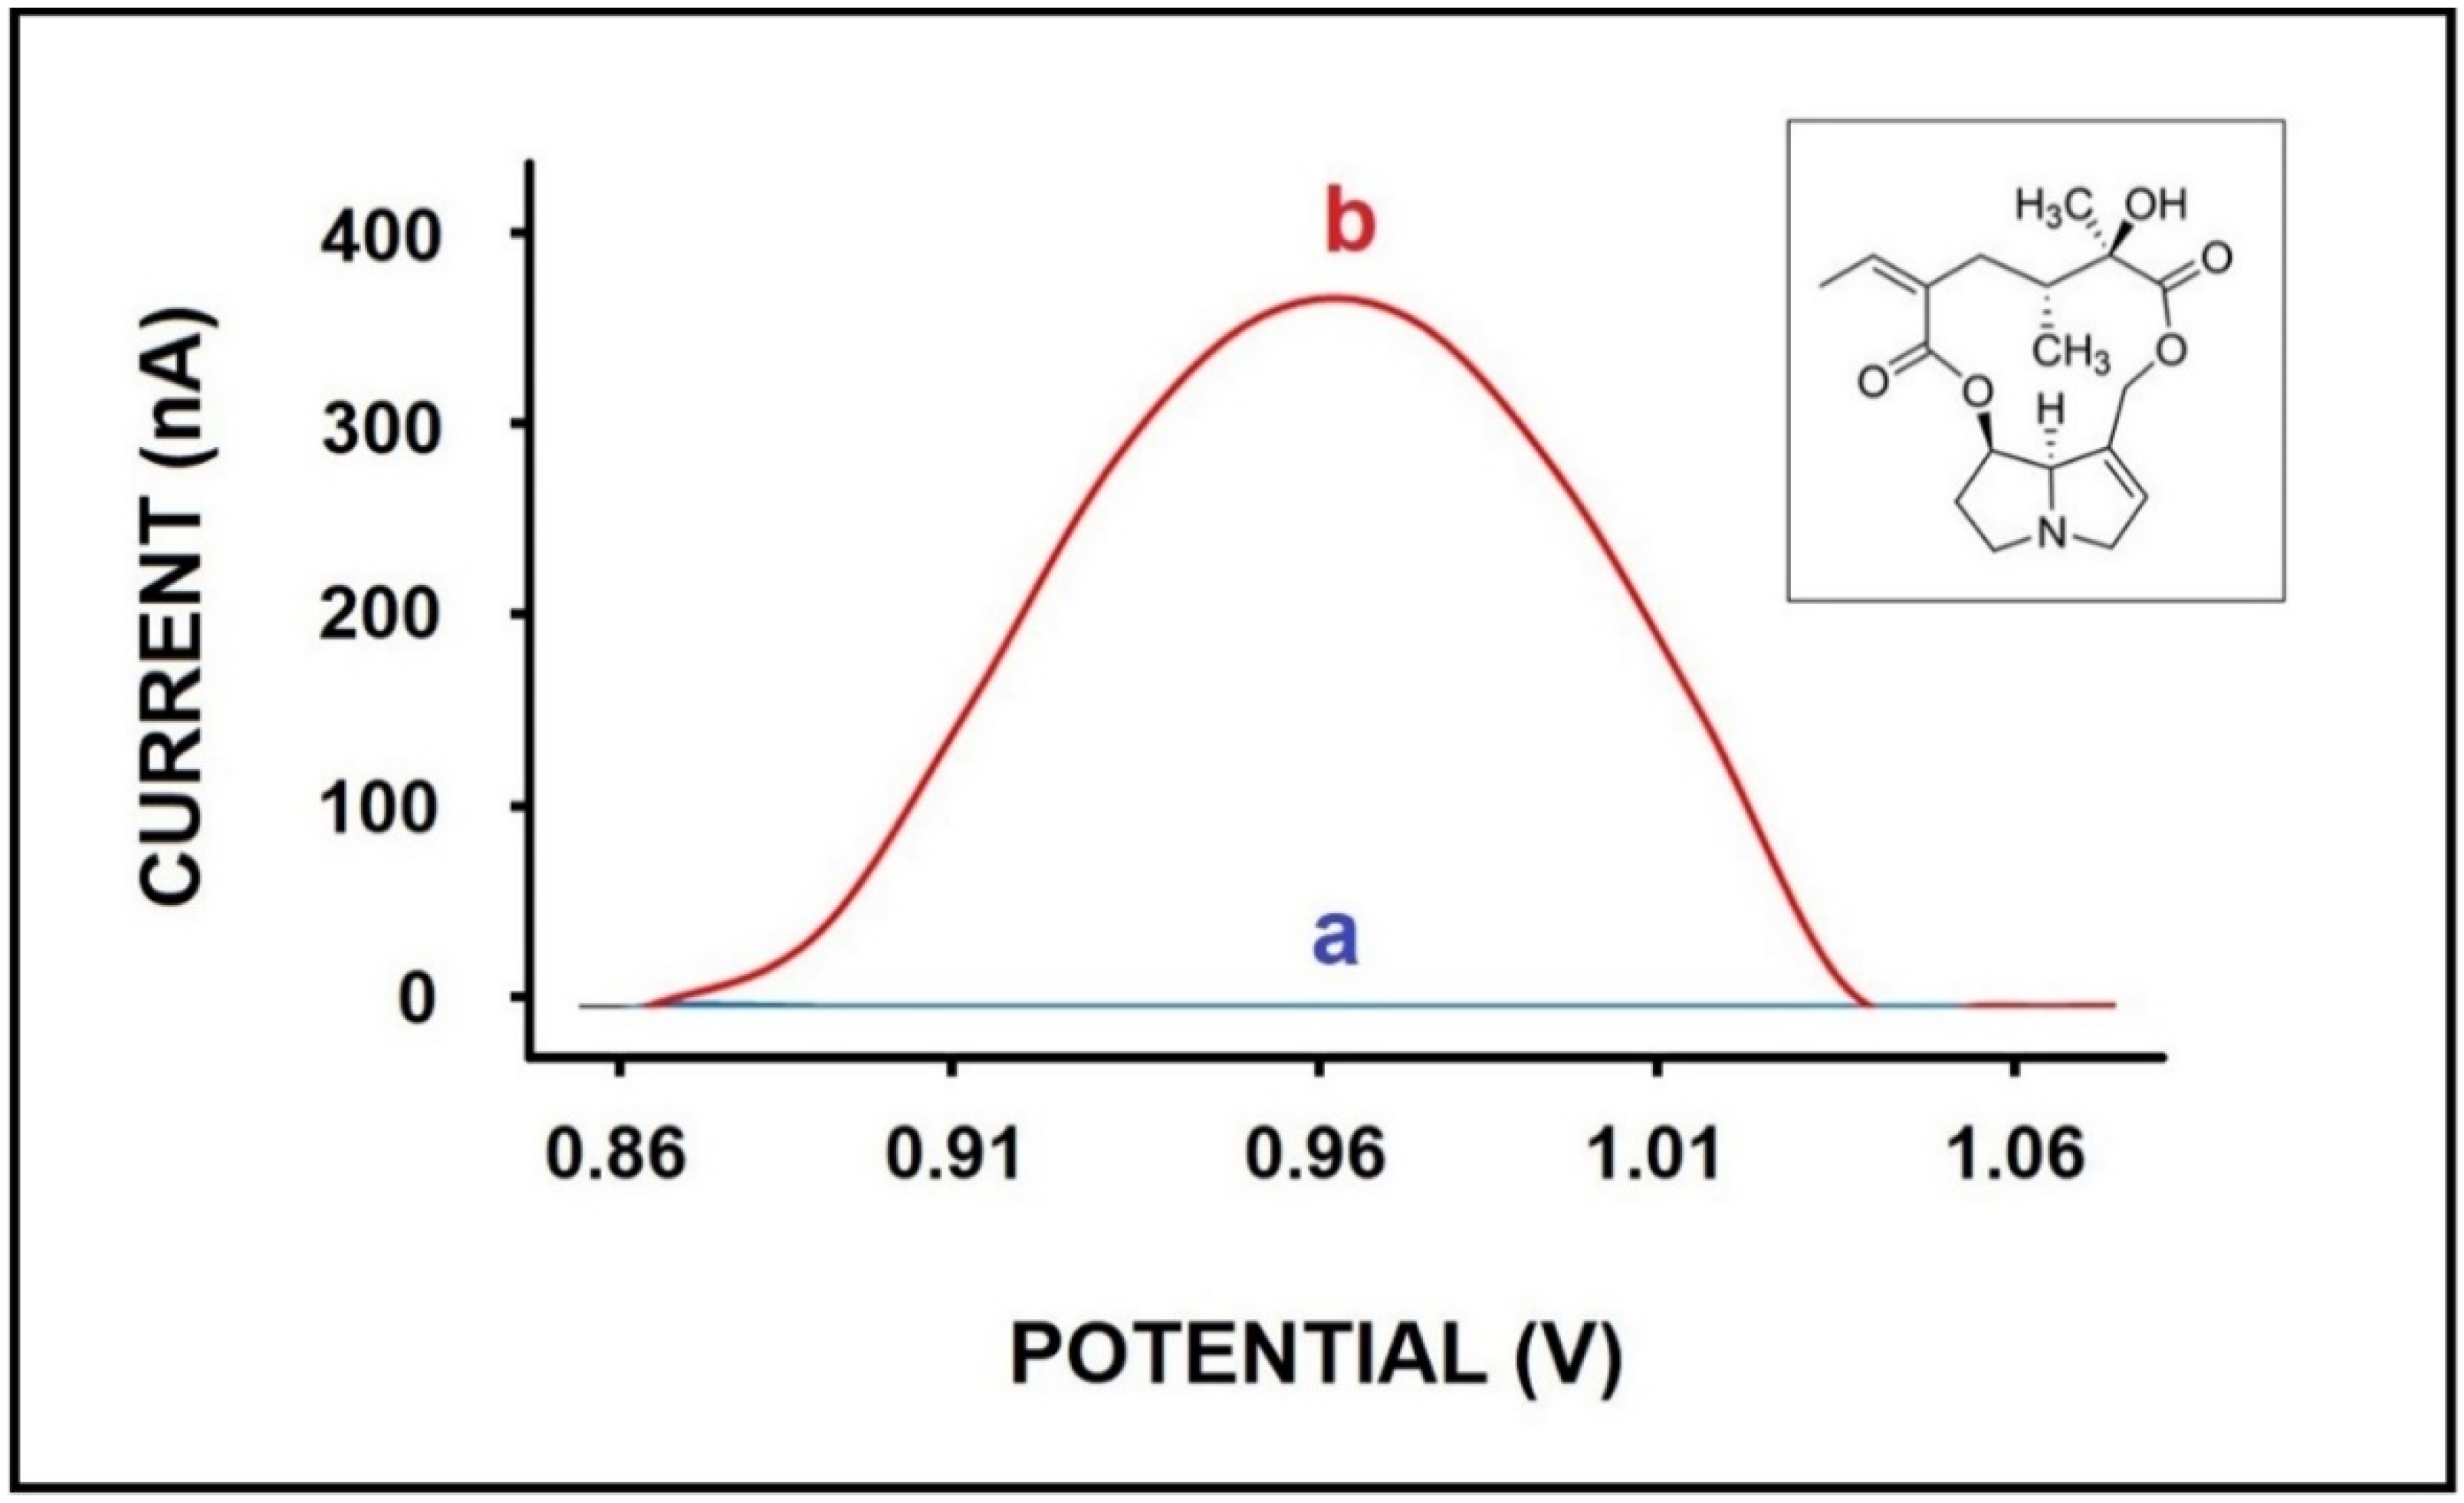
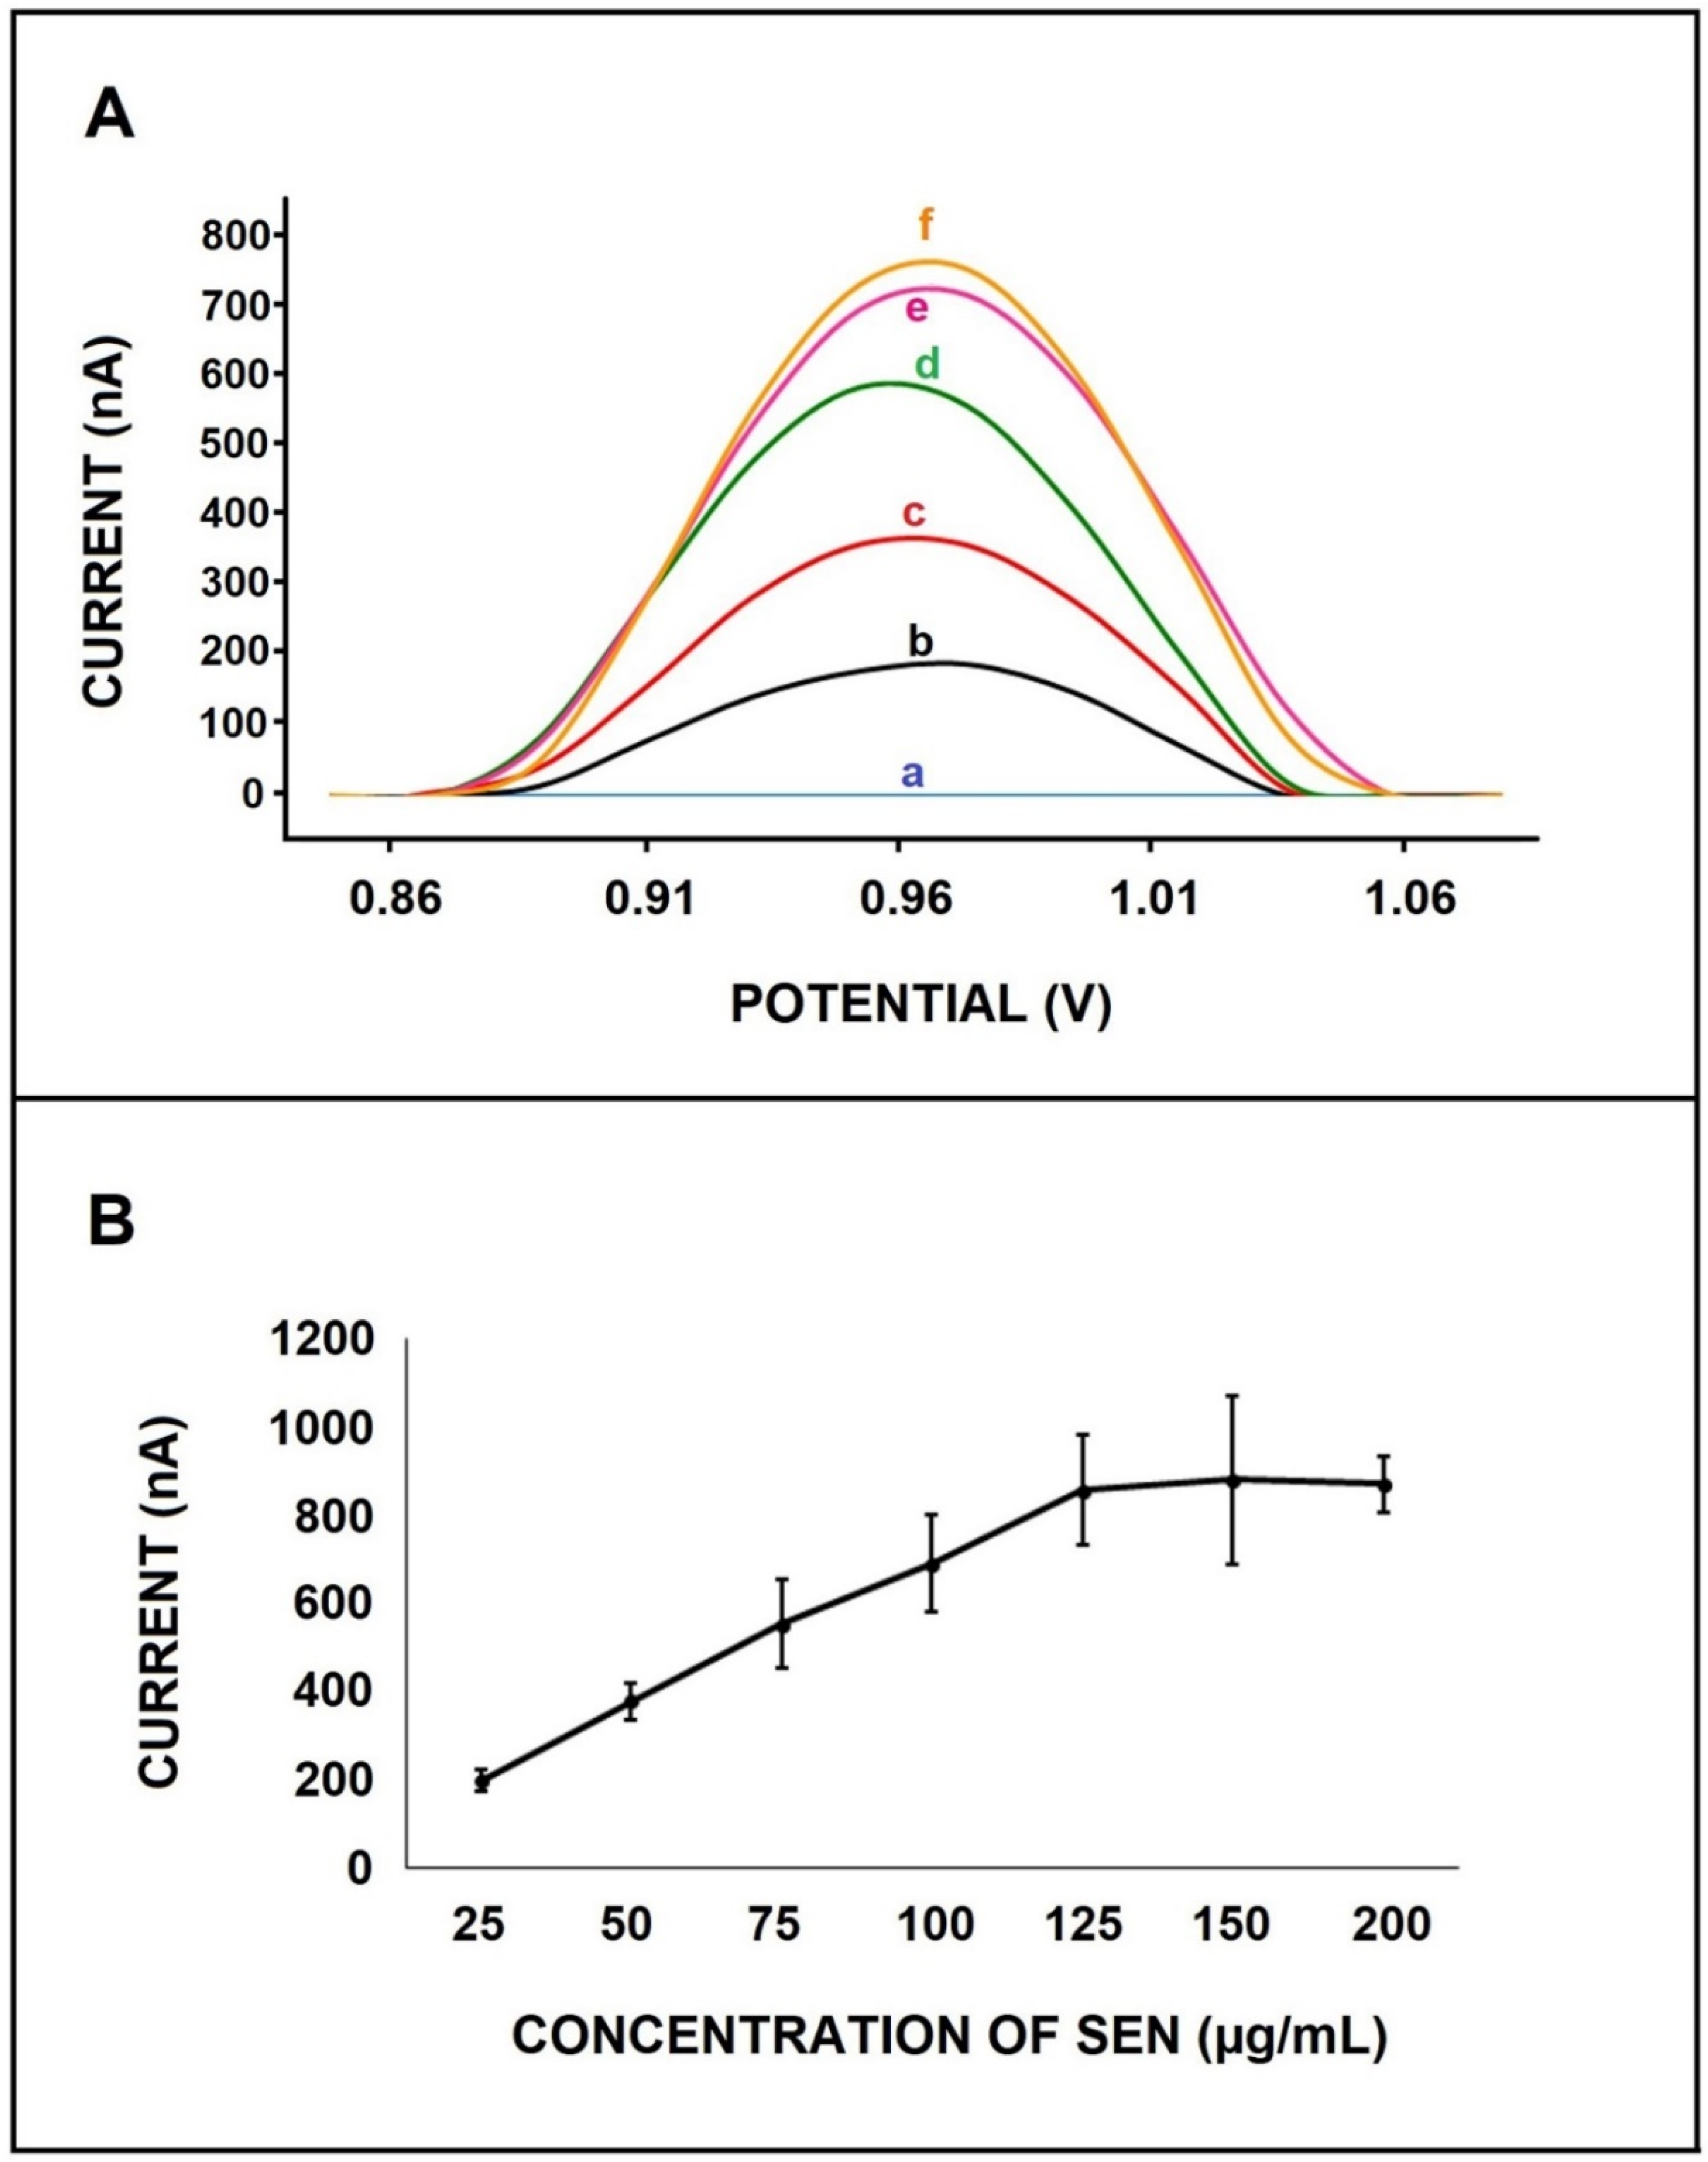
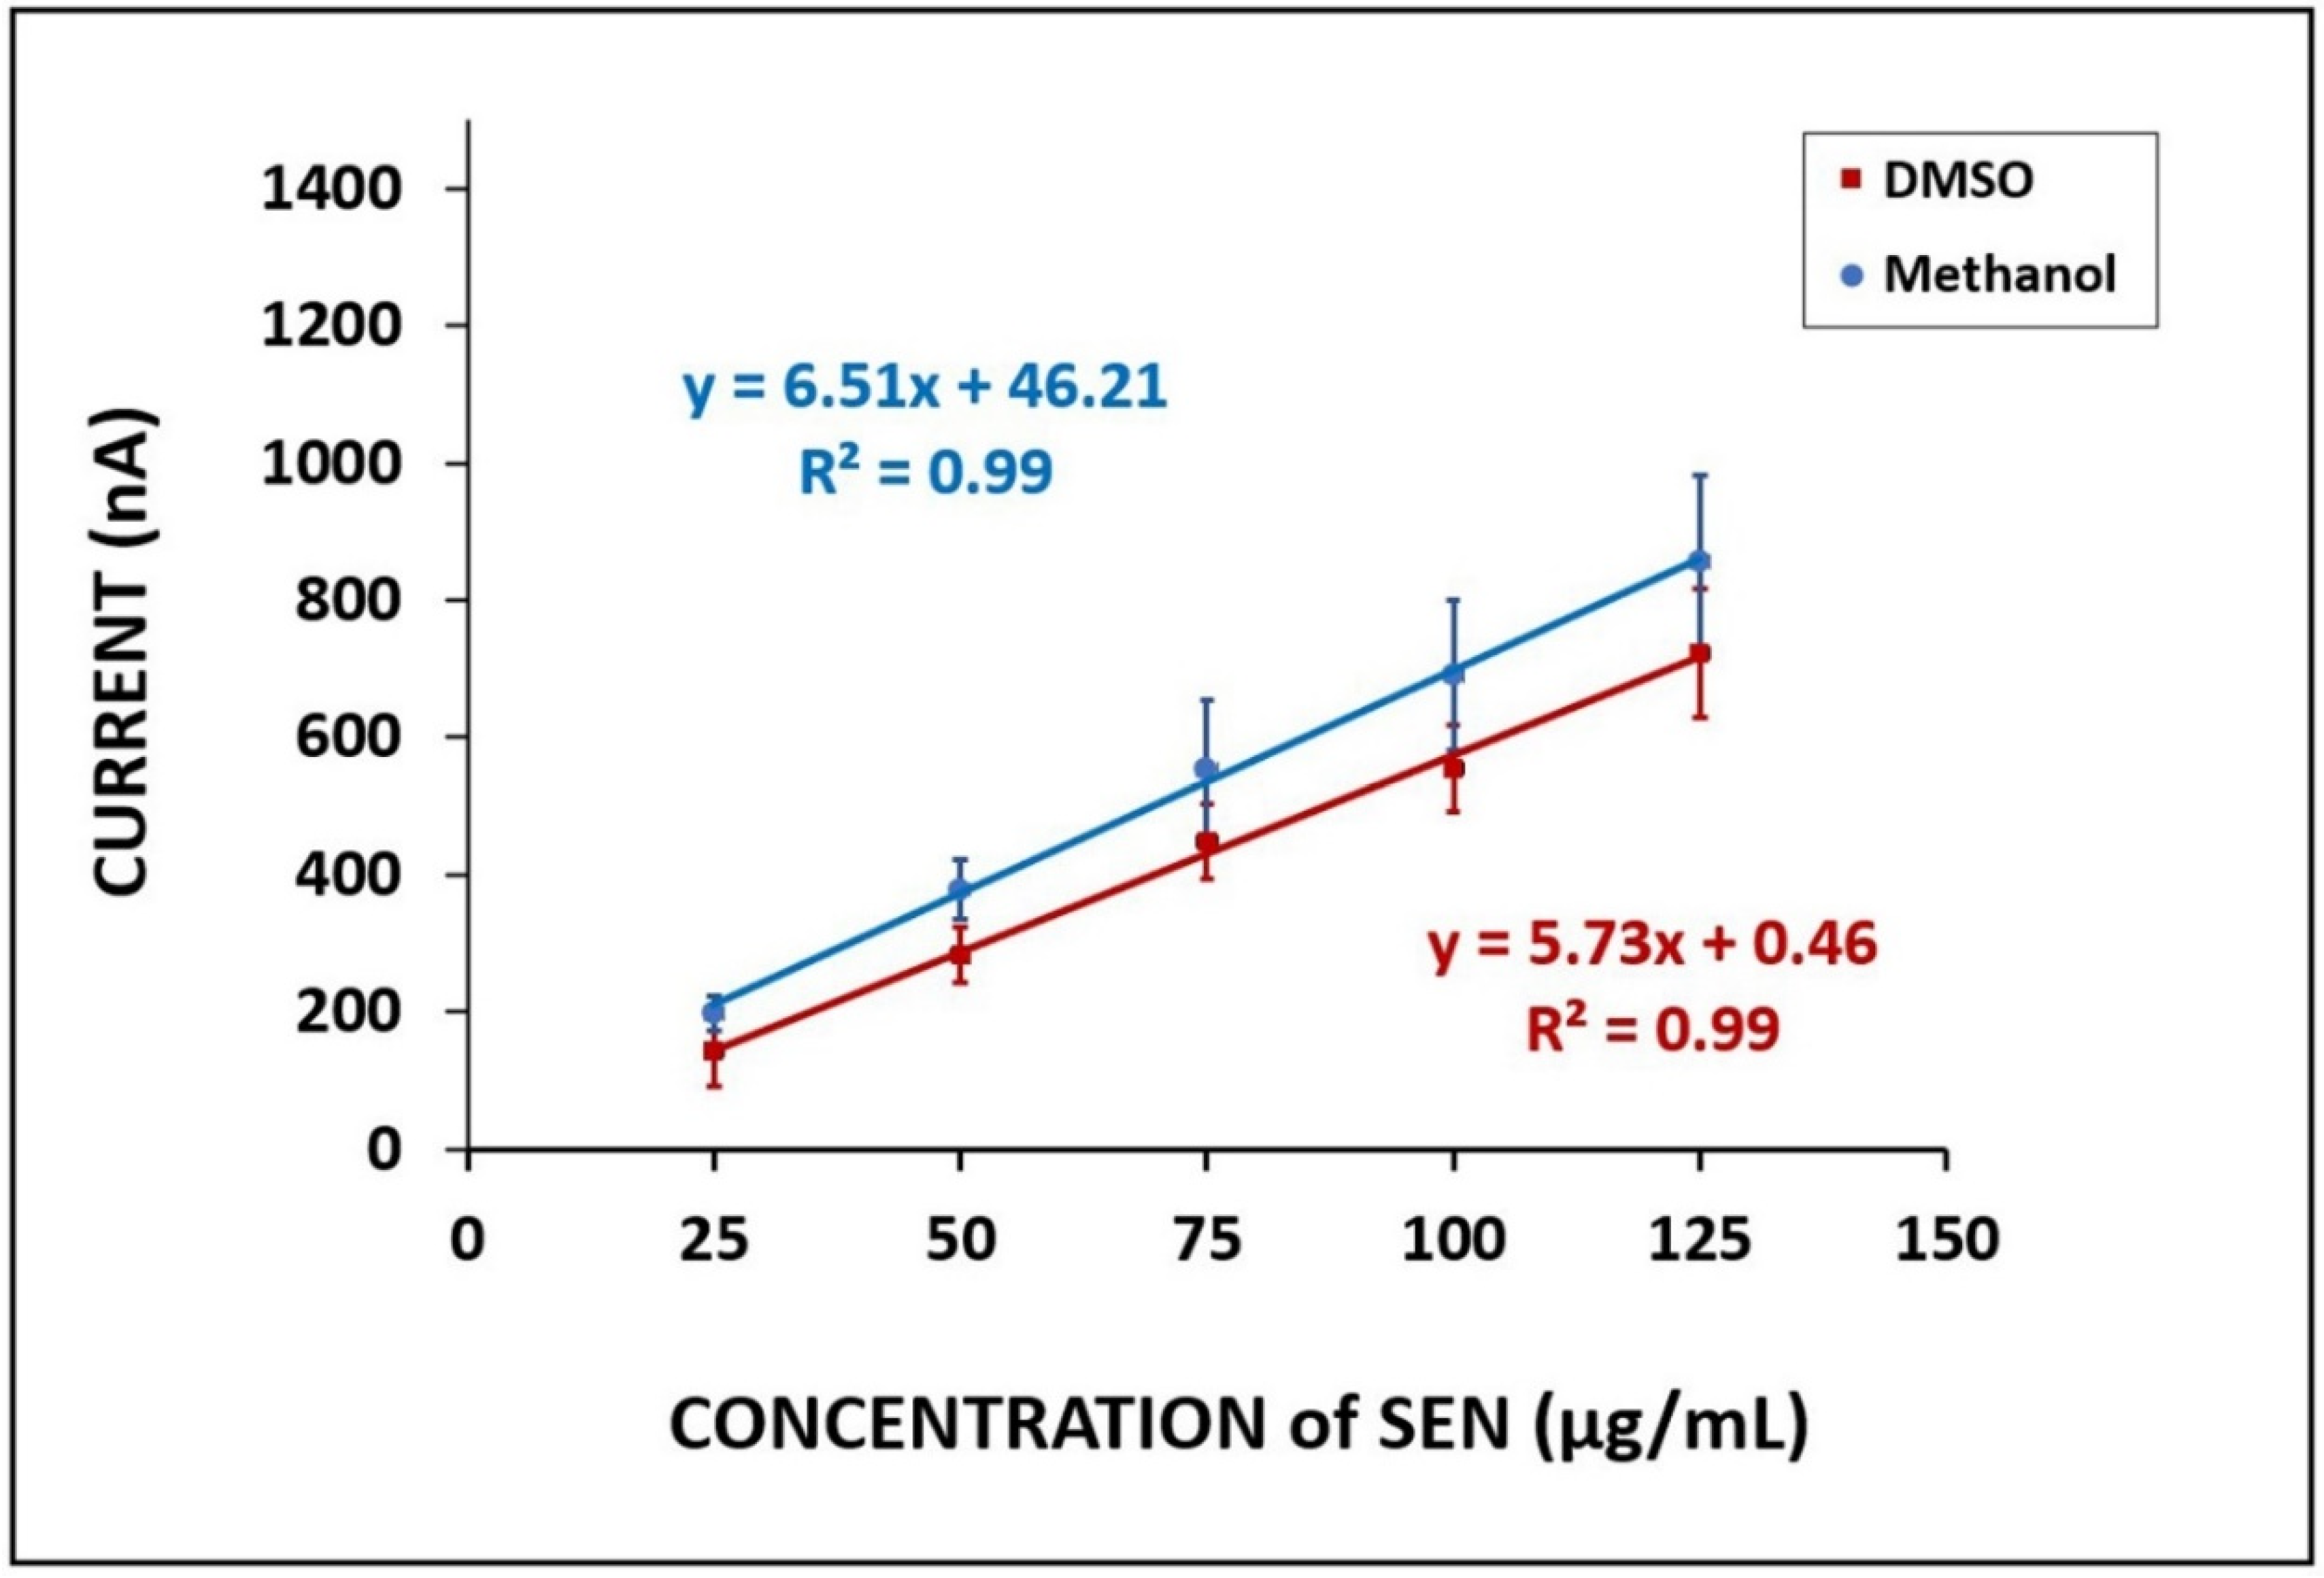
3. Results and Discussion
4. Voltammetric Detection of SEN in Flour and Herbal Tea Samples
5. Conclusions
Supplementary Materials
Author Contributions
Funding
Data Availability Statement
Acknowledgments
Conflicts of Interest
References
- Hartmann, T. Chemical ecology of pyrrolizidine alkaloids. Planta 1999, 207, 483–495. [Google Scholar] [CrossRef]
- Reimann, A.; Nurhayati, N.; Backenköhler, A.; Ober, D. Repeated evolution of the pyrrolizidine alkaloid-mediated defense system in separate angiosperm lineages. Plant Cell 2004, 16, 2772–2784. [Google Scholar] [CrossRef] [PubMed] [Green Version]
- Roeder, E. Medicinal plants in Europe containing pyrrolizidine alkaloids. Pharmazie 1995, 50, 83–98. [Google Scholar] [CrossRef]
- E-Commission Monography of E Commission Bundesanzeiger nr 138 z 27.07.1990. Rośliny Lecznicze w Fitoterapii; Borkowski, B., Ed.; Instytut Roślin i Przetworów Zielarskich: Poznań, Poland, 1994; ISBN 8390174421/9788390174426. [Google Scholar]
- EFSA opinion of the scientific panel on contaminants in the food chain on a request from the european commission related to pyrrolizidine alkaloids as undesirable substances in animal feed. EFSA J. 2007, 5, 447.
- Dreger, M.; Stanislawska, M.; Krajewska-Patan, A.; Mielcarek, S.; Mikolajczak, P.L.; Buchwald, W. Pyrrolizidine alkaloids—Chemistry, biosynthesis, pathway, toxicity, safety and perspectives of medicinal usage. Herba Pol. 2009, 55, 127–147. [Google Scholar]
- Moreira, R.; Pereira, D.M.; Valentão, P.; Andrade, P.B. Pyrrolizidine alkaloids: Chemistry, pharmacology, toxicology and food safety. Int. J. Mol. Sci. 2018, 19, 1668. [Google Scholar] [CrossRef] [Green Version]
- Schoental, R. Toxicology and Carcinogenic Action of Pyrrolizidine Alkaloids. Cancer Res. 1968, 28, 2237–2246. [Google Scholar]
- Hirono, I.; Mori, H.; Culvenor, C.C.J. Carcinogenic Activity of Coltsfoot, Tussilago farfara L. GANN Jpn. J. Cancer Res. 1976, 67, 125–129. [Google Scholar]
- Ridker, P.M.; Ohkuma, S.; Mcdermott, W.V.; Trey, C.; Huxtable, R.J. Hepatic Venocclusive Disease Associated With the Consumption of Pyrrolizidine Containing Dietary Supplements. Gastroenterology 1985, 88, 1050–1054. [Google Scholar] [CrossRef]
- Mohabbat, O.; Younos, M.S.; Merzad, A.A.; Srivastava, R.N.; Sediq, G.G.; Aram, G.N. An Outbreak of Hepatic Veno-Occlusive Disease in North-Western Afghanistan. Lancet 1976, 7980, 269–271. [Google Scholar] [CrossRef]
- Selzer, M.B.; Parker, R.G.F.; Chir, P. Senecio poisoning exhibiting as chiari’s syndrome a report on twelve cases. Am. J. Pathol. 1951, 27, 885–907. [Google Scholar] [CrossRef] [PubMed] [Green Version]
- Chauvin, P.; Dillon, J.; Moren, A. An outbreak of Heliotrope food poisoning, Tadjikistan, November 1992–March 1993. Sante 1994, 4, 263–268. [Google Scholar] [PubMed]
- Stillman, A.E.; Huxtable, R.; Consroe, P.; Kohnen, P.; Smith, S. Hepatic veno occlusive disease due to pyrrolizidine (Senecio) poisoning in Arizona. Gastroenterology 1977, 73, 349–352. [Google Scholar] [CrossRef]
- Knight, A.; Kimberling, C.; Stermitz, F.R.; Roby, M. No TitleCynoglossum officinale (hound’s-tongue)—A cause of pyrrolizidine alkaloid poisoning in horses. J. Am. Vet. Assoc. 1984, 185, 647–650. [Google Scholar]
- Pass, D.; Hogg, G.; Russell, R.; Edgar, J.A.; Tence, I.; Rikard-Bell, L. Poisoning of chickens and ducks by pyrrolizidine alkaloids of Heliotropum europium. Aust. Vet. J. 1978, 55, 284–288. [Google Scholar] [CrossRef]
- Coulombe, R.A.; Drew, G.L.; Stermitz, F.R. Pyrrolizidine alkaloids crosslink DNA with actin. Toxicol. Appl. Pharmacol. 1999, 154, 198–202. [Google Scholar] [CrossRef]
- Culvenor, C.C.J.; Downing, D.T.; Edgar, J.A.; Jago, M.V. Pyrrolizidine Alkaloids As Alkylating and Antimitotic Agents. Ann. N. Y. Acad. Sci. 1969, 163, 837–847. [Google Scholar] [CrossRef]
- Cao, Y.; Colegate, S.M.; Edgar, J.A. Safety assessment of food and herbal products containing hepatotoxic pyrrolizidine alkaloids: Interlaboratory consistency and the importance of N-oxide determination. Phytochem. Anal. 2008, 19, 526–533. [Google Scholar] [CrossRef] [PubMed]
- Deinzer, M.; Thomson, P.; Burgett, D.; Isaacton, D. Pyrrolizidine alkaloids: Their occurrence in honey from tansy ragwort (Senecio jacobaea L.). Science 1977, 195, 497–499. [Google Scholar] [CrossRef] [PubMed]
- Wang, J.; Kawde, A.N.; Erdem, A.; Salazar, M. Magnetic bead-based label-free electrochemical detection of DNA hybridization. Analyst 2001, 126, 2020–2024. [Google Scholar] [CrossRef]
- Erdem, A.; Eksin, E.; Kesici, E.; Yaralı, E.; Kanat, E. Single-use sensor technology for monitoring of zearalenone in foods: ZentoSens. Microchem. J. 2019, 147, 37–42. [Google Scholar] [CrossRef]
- Eksin, E.; Congur, G.; Erdem, A. Electrochemical assay for determination of gluten in flour samples. Food Chem. 2015, 184, 183–187. [Google Scholar] [CrossRef] [PubMed]
- Thangaraj, R.; Manjula, N.; Kumar, A.S. Rapid simultaneous electrochemical sensing of tea polyphenols. Anal. Methods 2012, 4, 2922–2928. [Google Scholar] [CrossRef]
- Vishnu, N.; Gandhi, M.; Badhulika, S.; Kumar, A.S. Tea quality testing using 6B pencil lead as an electrochemical sensor. Anal. Methods 2018, 10, 2327–2336. [Google Scholar] [CrossRef]
- Miller, J.N.; Miller, J.C. Statistics and Chemometrics for Analytical Chemistry, 6th ed.; Pearson Education: London, UK, 2010; ISBN 978-0-273-73042-2. [Google Scholar]
- Griffin, C.T.; Danaher, M.; Elliott, C.T.; Glenn Kennedy, D.; Furey, A. Detection of pyrrolizidine alkaloids in commercial honey using liquid chromatography-ion trap mass spectrometry. Food Chem. 2013, 136, 1577–1583. [Google Scholar] [CrossRef]
- Bretanha, L.C.; Piovezan, M.; Sako, A.F.V.; Pizzolatti, M.G.; Micke, G.A. Strategy for a Fast and Simple Method for Trace Determination of Senecionine and Senecionine N-Oxide in Honey Using LVI in HPLC-MS/MS. Am. J. Anal. Chem. 2014, 5, 681–687. [Google Scholar] [CrossRef] [Green Version]
- Jiang, Z.; Liu, F.; Goh, J.J.L.; Yu, L.; Li, S.F.Y.; Ong, E.S.; Ong, C.N. Determination of senkirkine and senecionine in Tussilago farfara using microwave-assisted extraction and pressurized hot water extraction with liquid chromatography tandem mass spectrometry. Talanta 2009, 79, 539–546. [Google Scholar] [CrossRef] [PubMed]
- Qi, X.; Wang, S.; Wu, B.; Qu, H. Determination of hepatotoxic pyrrolizidine alkaloids in gynura segetum by MEKC. Chromatographia 2009, 70, 281–285. [Google Scholar] [CrossRef]
- Yang, M.; Li, J.Y.; Li, X.Y.; Cong, L.B.; Zhu, J.; Xie, H.; Yuan, H.L.; Xiao, X.H. Simultaneous determination of senecionine, senlciphylline, and senecionine N-Oxide in Gynura segetum by RP-HPLC. Anal. Lett. 2009, 42, 1820–1830. [Google Scholar] [CrossRef]
- Langer, T.; Mösti, E.; Chizzola, R.; Gutleb, R. A Competitive Enzyme Immunoassay for the Pyrrolizidine Alkaloids of the Senecionine Type. Planta Med. 1996, 62, 267–271. [Google Scholar] [CrossRef]
- Roseman, D.M.; Wu, X.; Bober, M.; Miller, R.B.; Kurth, M.J.; Milco, L.A. Development of a Class-Specific Competitive Enzyme-Linked Immunosorbent Assay for the Detection of Pyrrolizidine Alkaloids in Vitro. J. Agric. Food Chem. 1992, 40, 1008–1014. [Google Scholar] [CrossRef]
- Crews, C.; Startin, J.R.; Clarke, P.A. Determination of pyrrolizidine alkaloids in honey from selected sites by solid phase extraction and HPLC-MS. Food Addit. Contam. 1997, 14, 419–428. [Google Scholar] [CrossRef] [PubMed]


| Sample Content | Current (nA) | RSD% | Difference |
|---|---|---|---|
| 25 µg/mL SEN | 209.67 ± 15.76 | 7.52 | - |
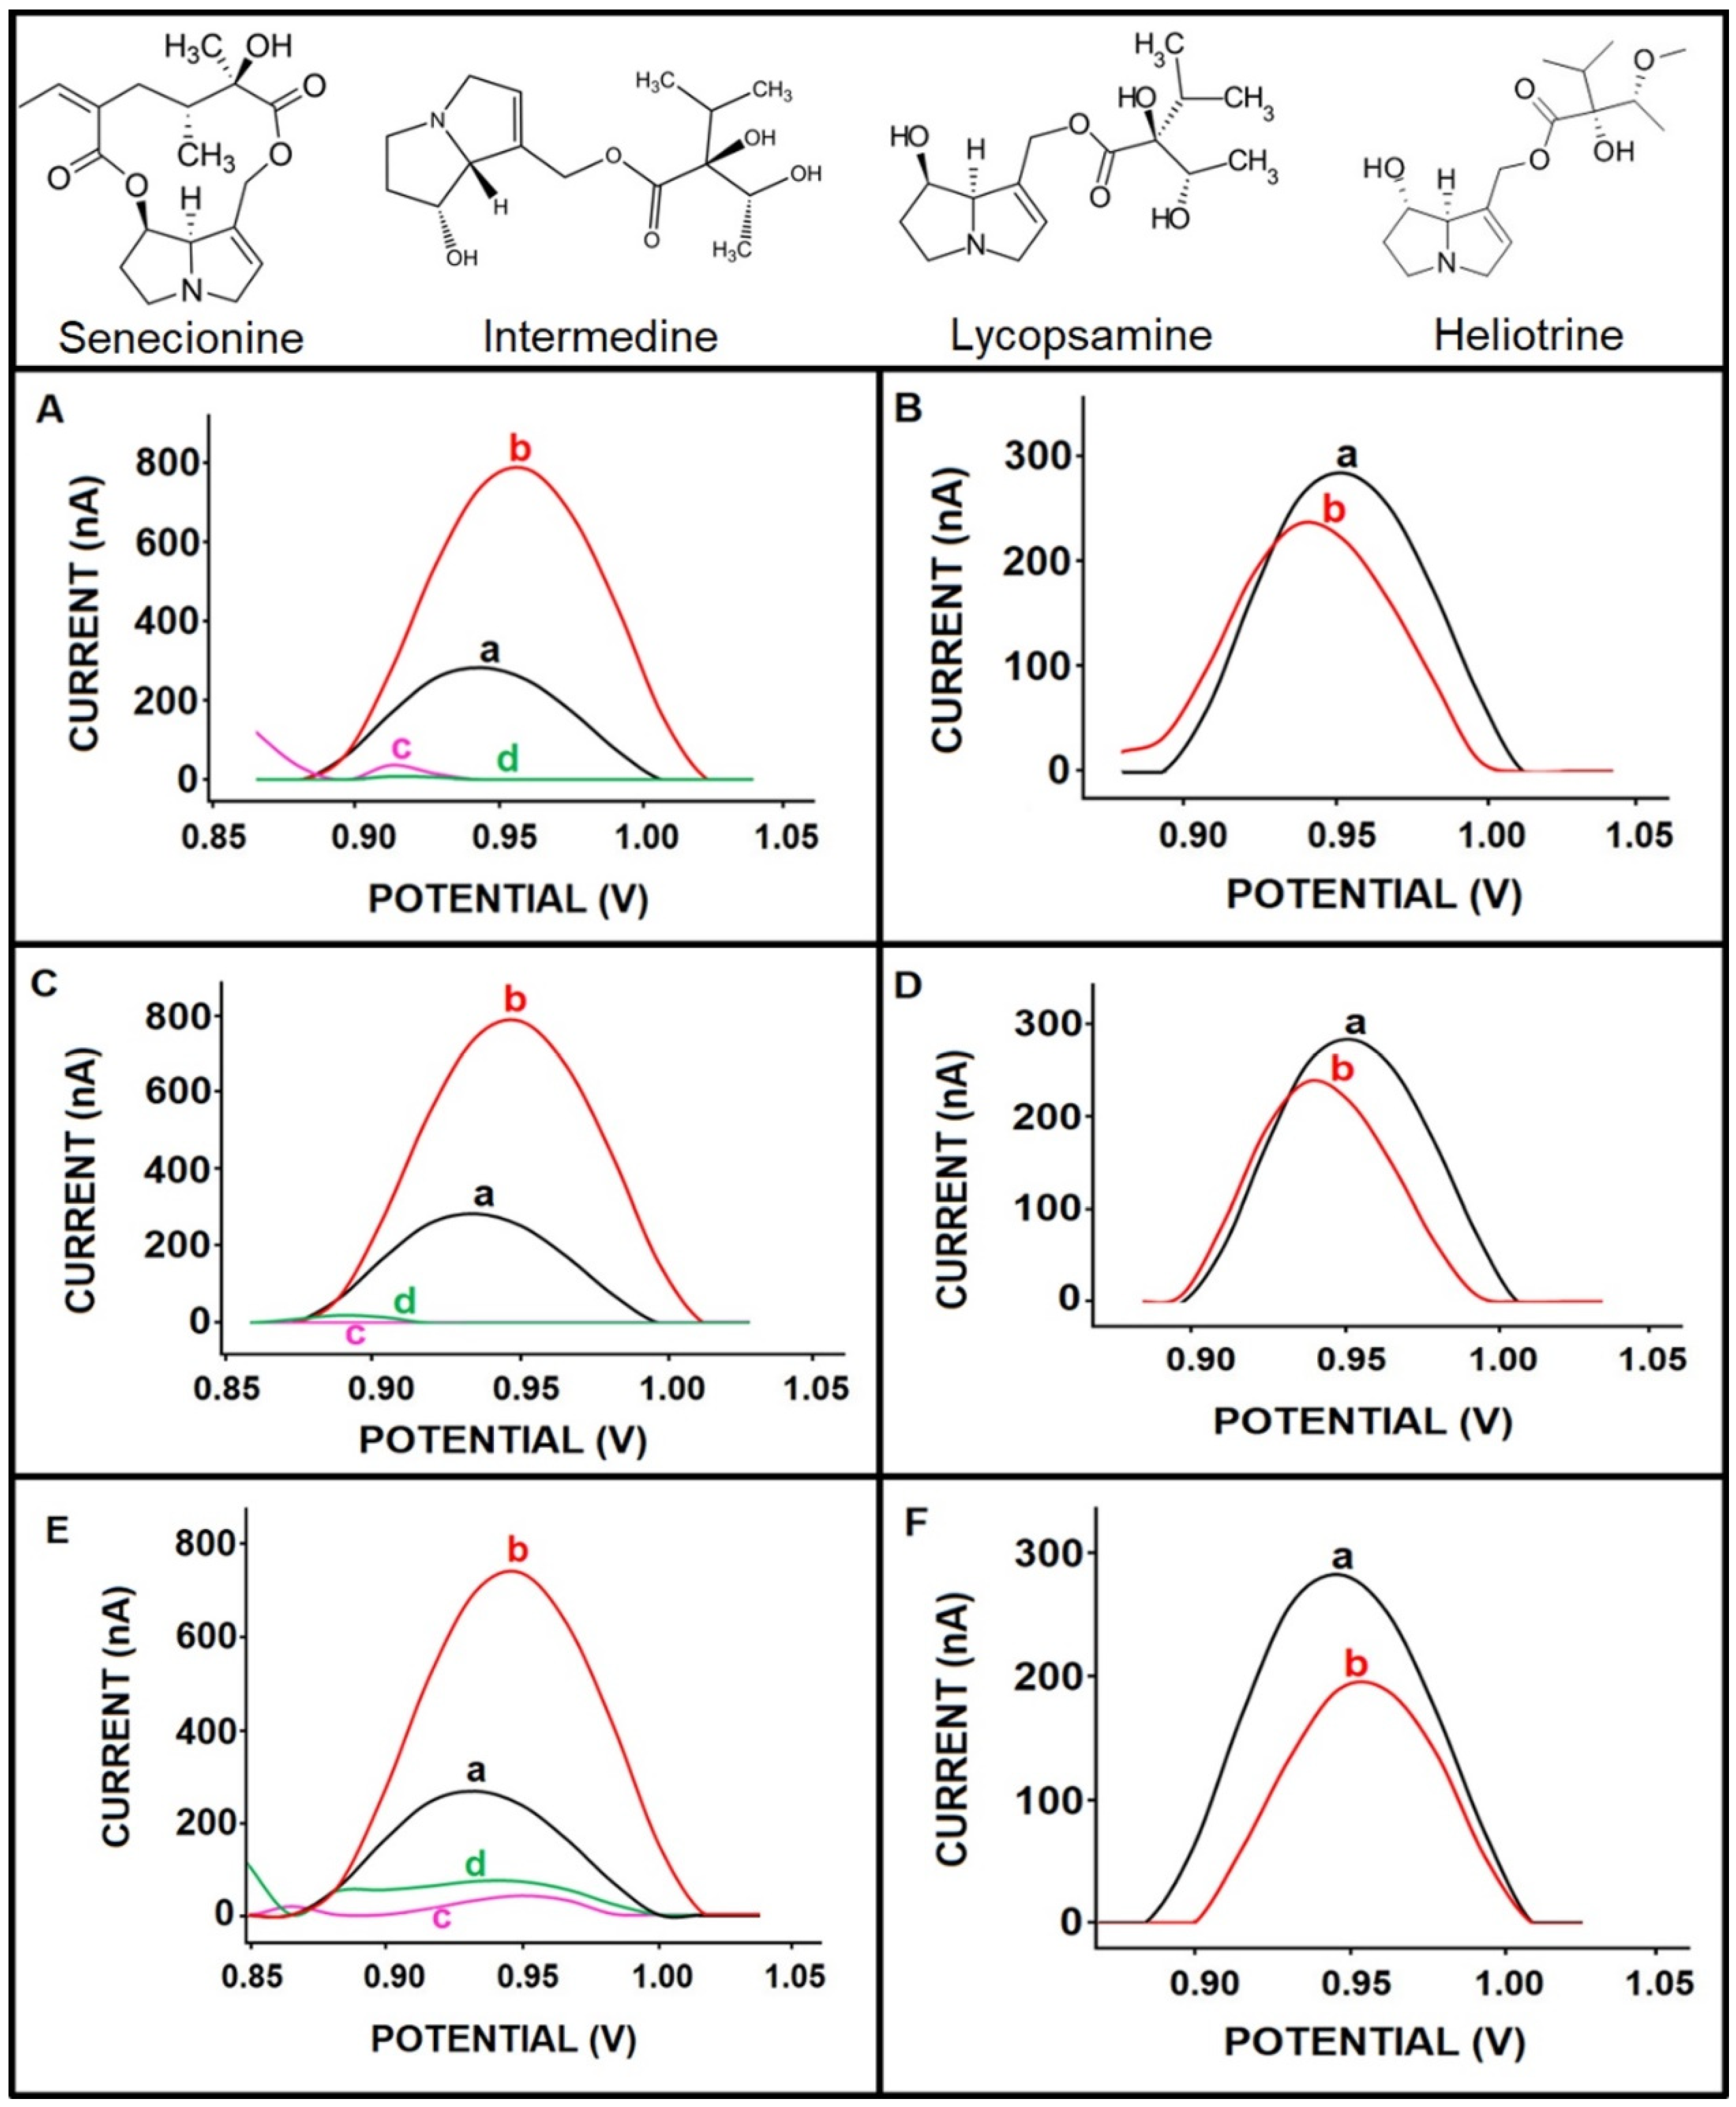
| 25 µg/mL SEN in the presence of 25 µg/mL intermedine | 202.67 ± 14.57 | 7.19 | 7 nA (3.3%) |
| 25 µg/mL SEN in the presence of 25 µg/mL lycopsamine | 200.00 ± 9.17 | 4.58 | 9.67 nA (4.6%) |
| 25 µg/mL SEN in the presence of 25 µg/mL heliotrine | 208.50 ± 20.24 | 9.71 | 1.17 nA (0.5%) |
| Method | Alkaloid | LOD | Application to Real Sample | Reference |
|---|---|---|---|---|
| Liquid chromatography-ion trap mass spectroscopy | Senecionine | 0.0237 µg/mL | Honey | [27] |
| HPLC-MS/MS | Senecionine and Senecionine N-Oxide | Senecionine: 57 ng/kg Senecionine N-Oxide: 59 ng/kg | Honey | [28] |
| Liquid chromatography tandem mass spectroscopy | Senecionine | 1.32 µg/g | Medicinal plants | [29] |
| MEKC | Senecionine | 1 µg/mL | Medicinal plant | [30] |
| RP-HPLC | Senecionine and Senecionine N-Oxide | Senecionine: 0.21 µg/mL Senecionine N-Oxide: 0.52 µg/mL | Medicinal plant | [31] |
| ELISA | Senecionine | 68.3 fmol | Medical plants | [32] |
| ELISA | Senecionine | Parent PA: 31,200 ng/mL, Digested PA: 1190 ng/mL | Plants | [33] |
| HPLC-MS | Senecionine | 0.002 mg/kg | Honey | [34] |
| DPV | Senecionine | 5.45 µg/mL in buffer, 12.28 µg/mL in flour sample, and 18.98 µg/mL in linden tea sample | Flour and herbal tea | This study |
Publisher’s Note: MDPI stays neutral with regard to jurisdictional claims in published maps and institutional affiliations. |
© 2021 by the authors. Licensee MDPI, Basel, Switzerland. This article is an open access article distributed under the terms and conditions of the Creative Commons Attribution (CC BY) license (https://creativecommons.org/licenses/by/4.0/).
Share and Cite
Senturk, H.; Eksin, E.; Zeybek, U.; Erdem, A. Detection of Senecionine in Dietary Sources by Single-Use Electrochemical Sensor. Micromachines 2021, 12, 1585. https://doi.org/10.3390/mi12121585
Senturk H, Eksin E, Zeybek U, Erdem A. Detection of Senecionine in Dietary Sources by Single-Use Electrochemical Sensor. Micromachines. 2021; 12(12):1585. https://doi.org/10.3390/mi12121585
Chicago/Turabian StyleSenturk, Huseyin, Ece Eksin, Ulvi Zeybek, and Arzum Erdem. 2021. "Detection of Senecionine in Dietary Sources by Single-Use Electrochemical Sensor" Micromachines 12, no. 12: 1585. https://doi.org/10.3390/mi12121585
APA StyleSenturk, H., Eksin, E., Zeybek, U., & Erdem, A. (2021). Detection of Senecionine in Dietary Sources by Single-Use Electrochemical Sensor. Micromachines, 12(12), 1585. https://doi.org/10.3390/mi12121585