Stability Performance Analysis of Various Packaging Materials and Coating Strategies for Chronic Neural Implants under Accelerated, Reactive Aging Tests

Abstract
:1. Introduction
2. Methods
2.1. Chemicals
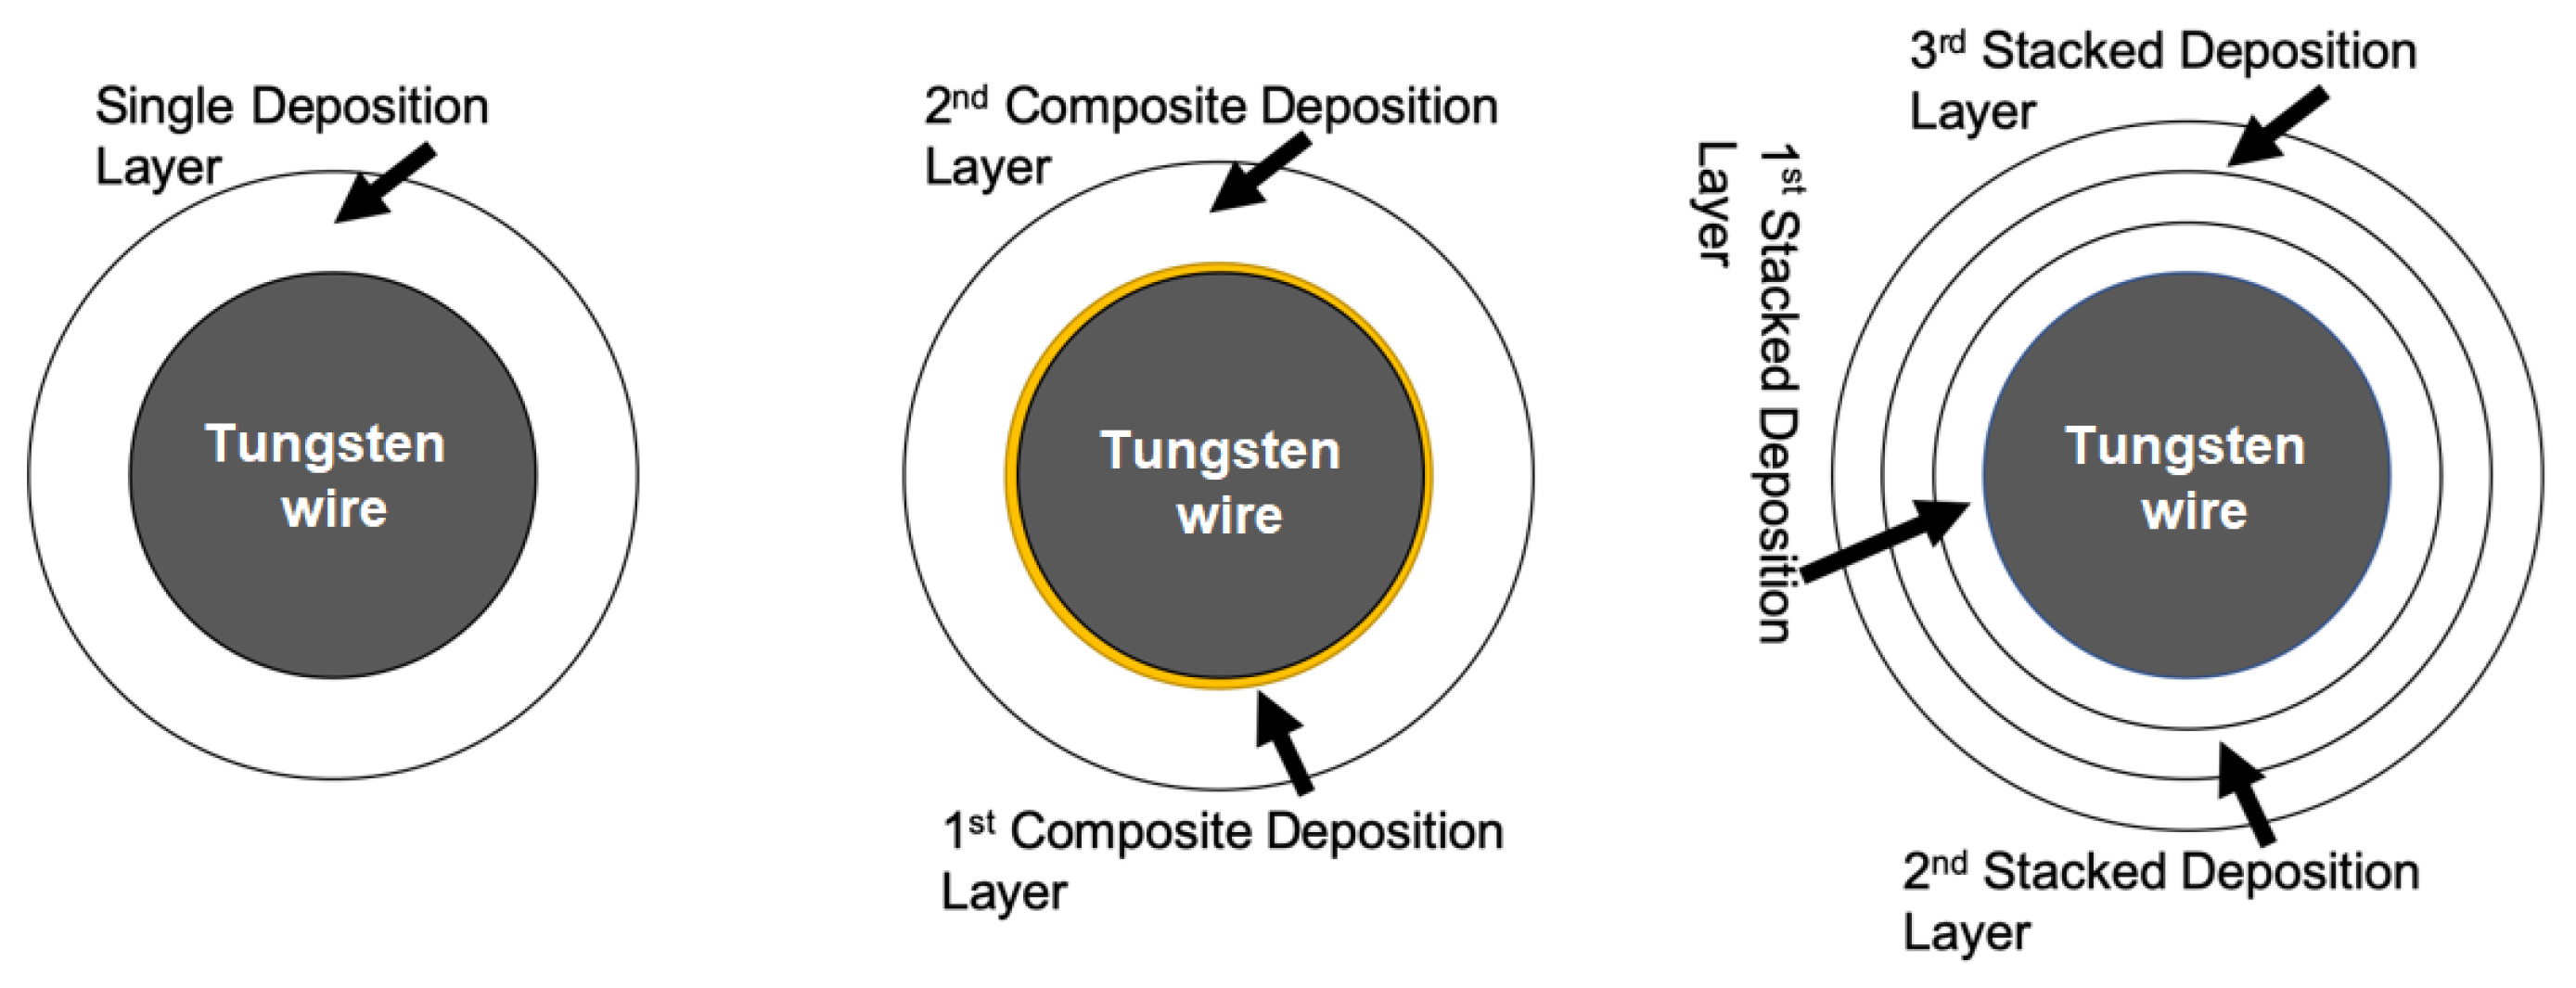
2.2. Testing Probes
2.3. Dissolution of Tungsten by Hydrogen Peroxide
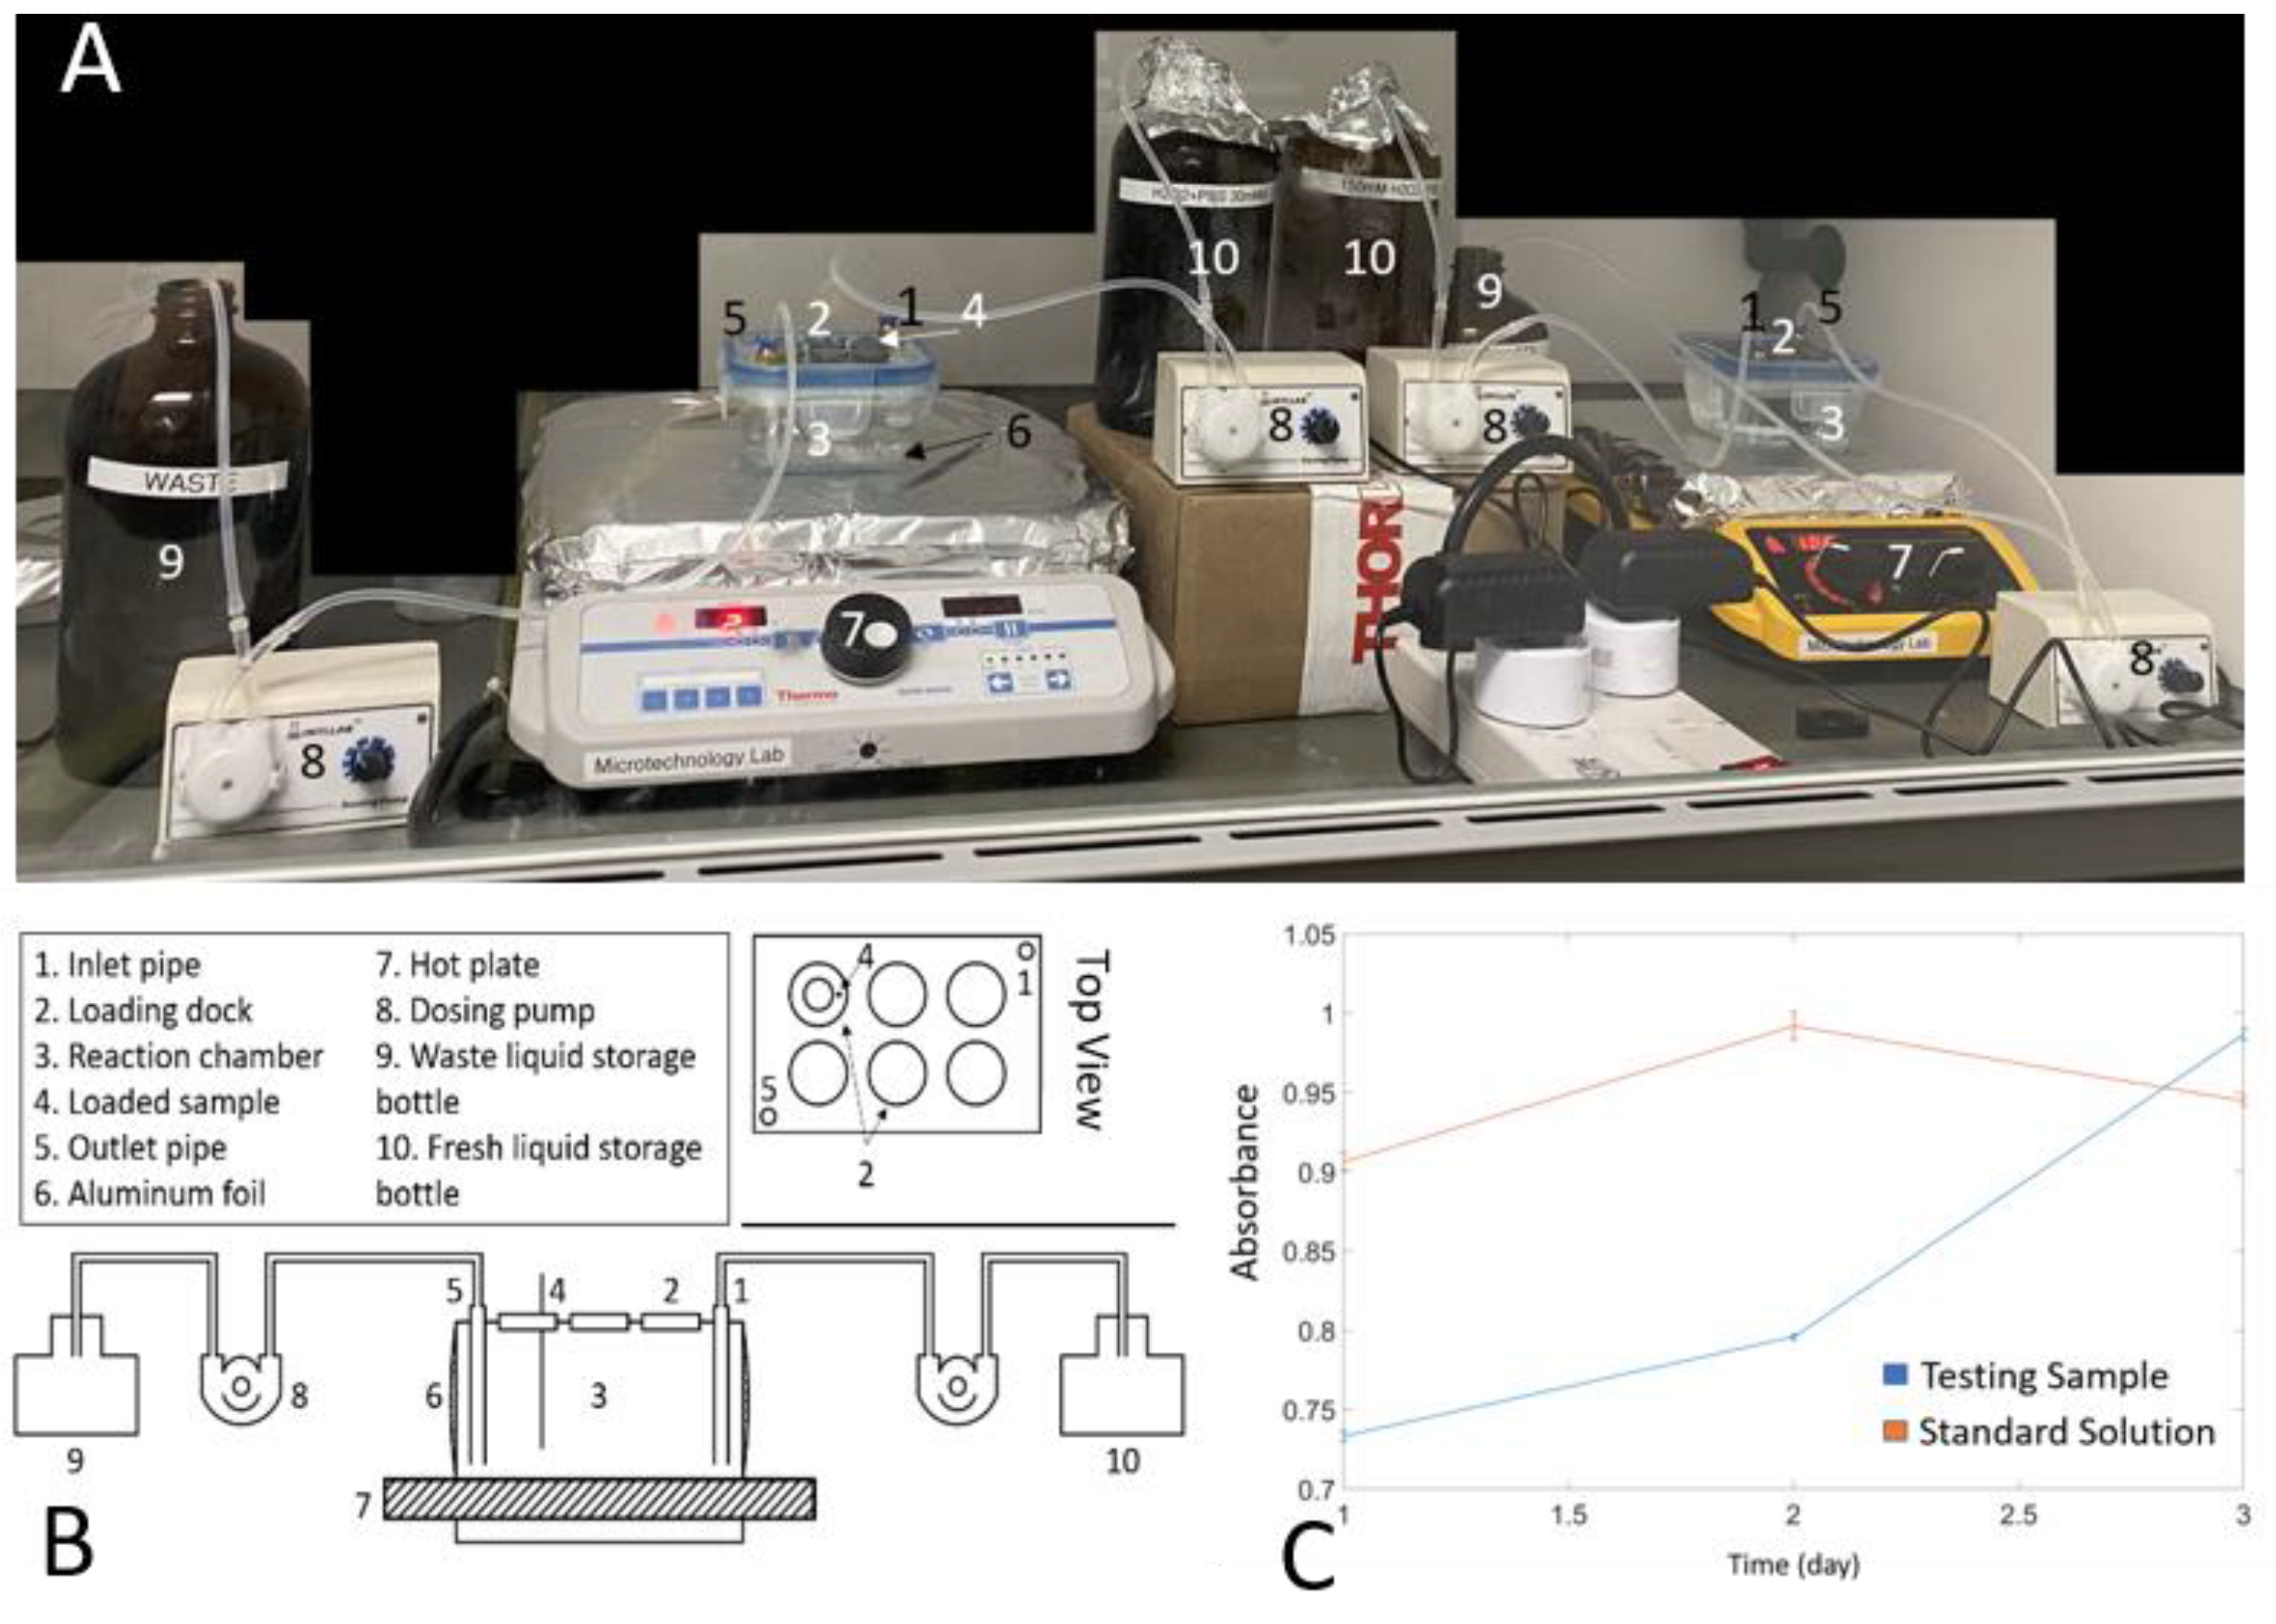
2.4. Experiment Setup
2.5. Hydrogen Peroxide Concentration Maintaining
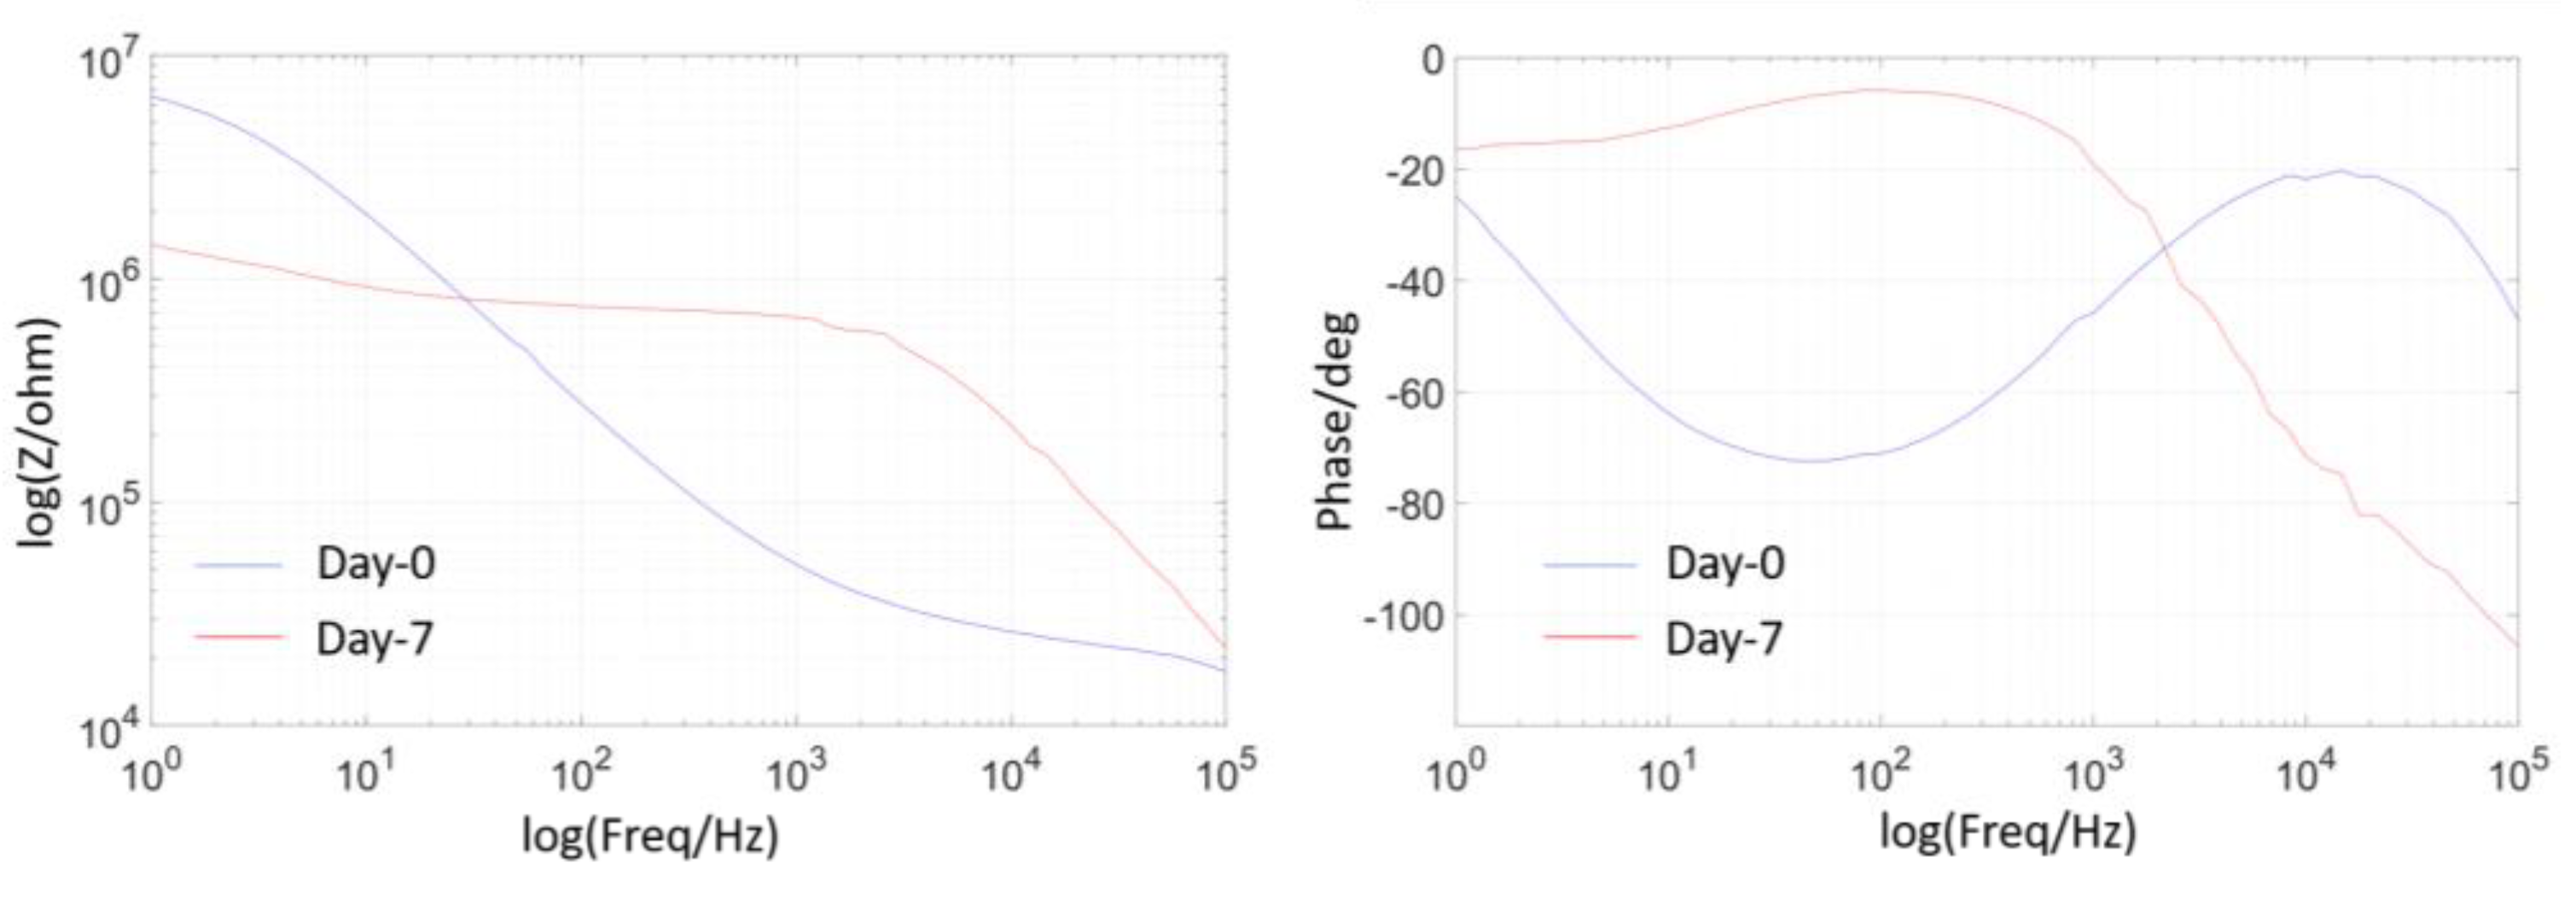
2.6. EIS Measurement
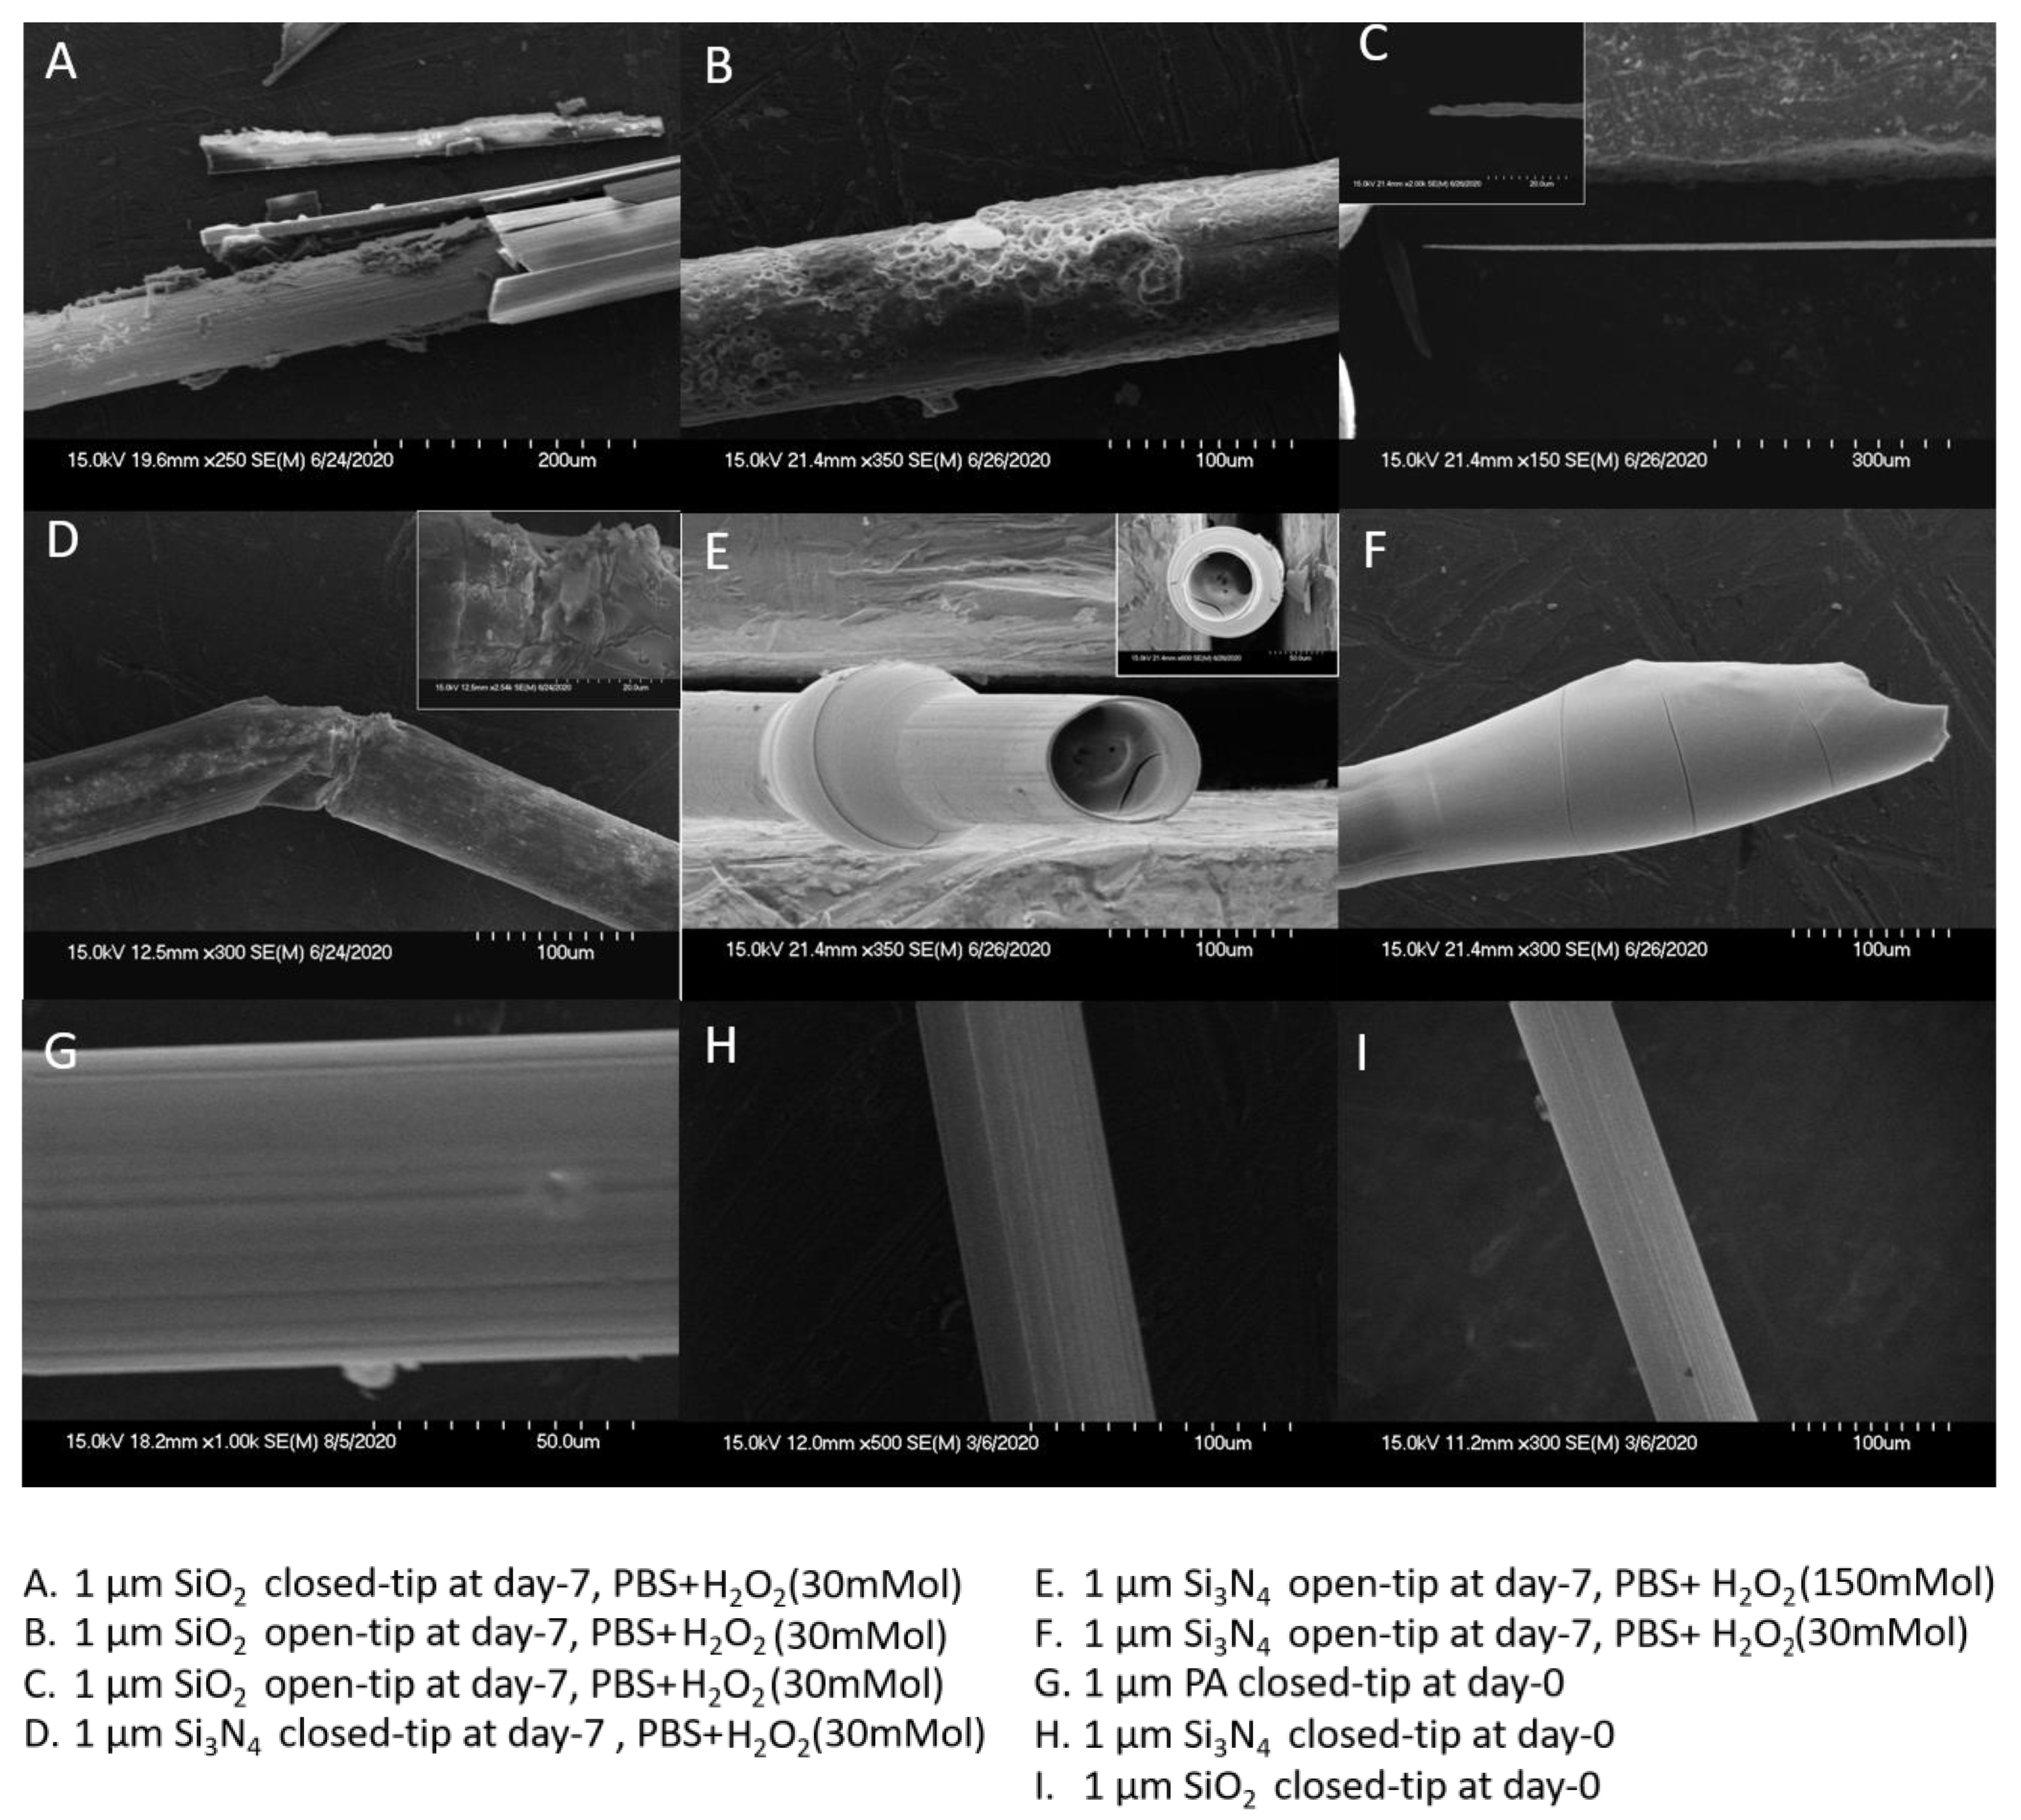
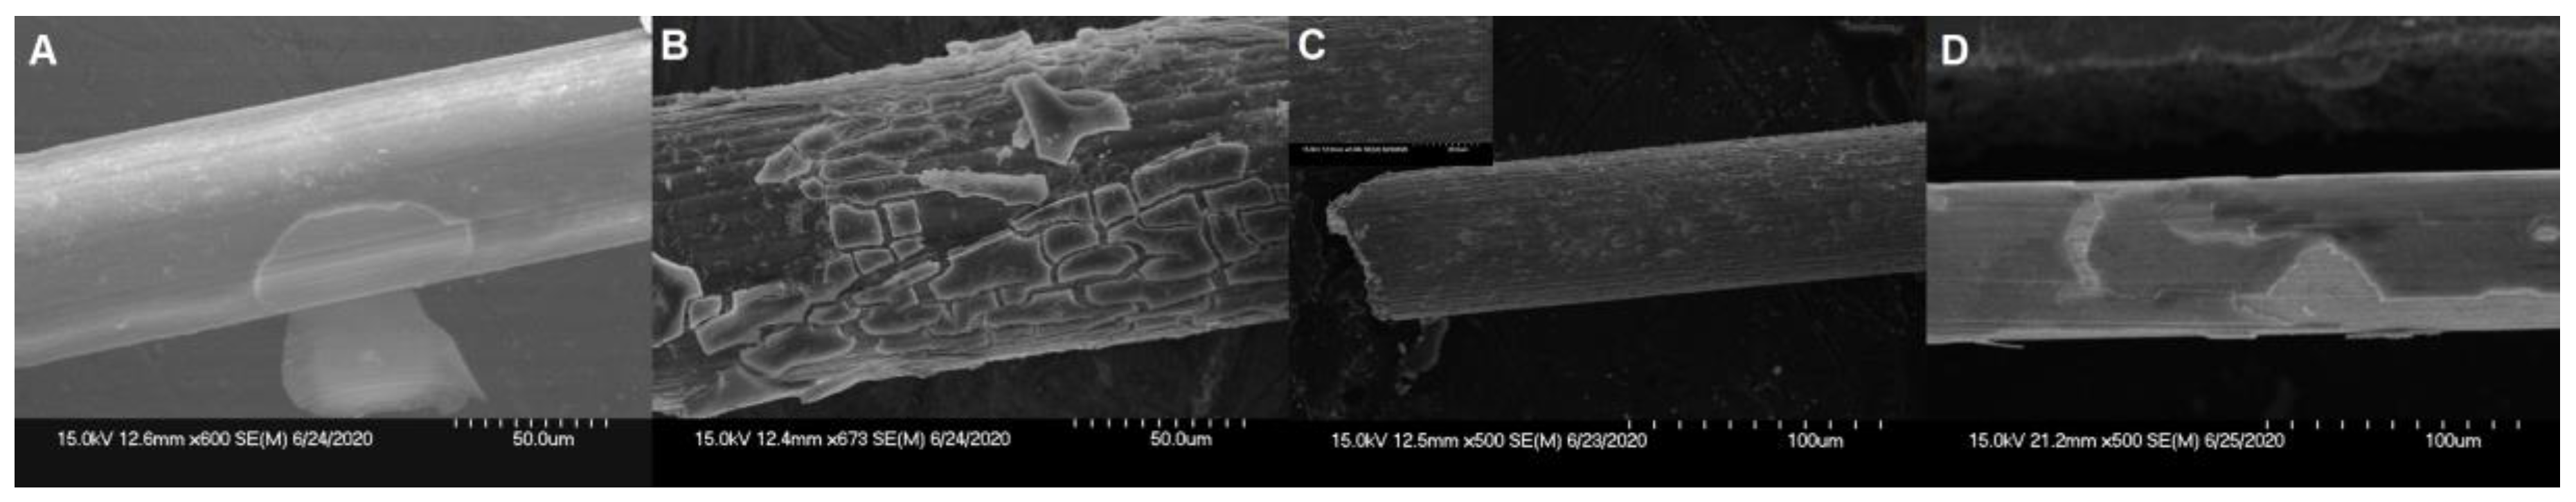
2.7. SEM Image
2.8. Data Analysis
3. Results
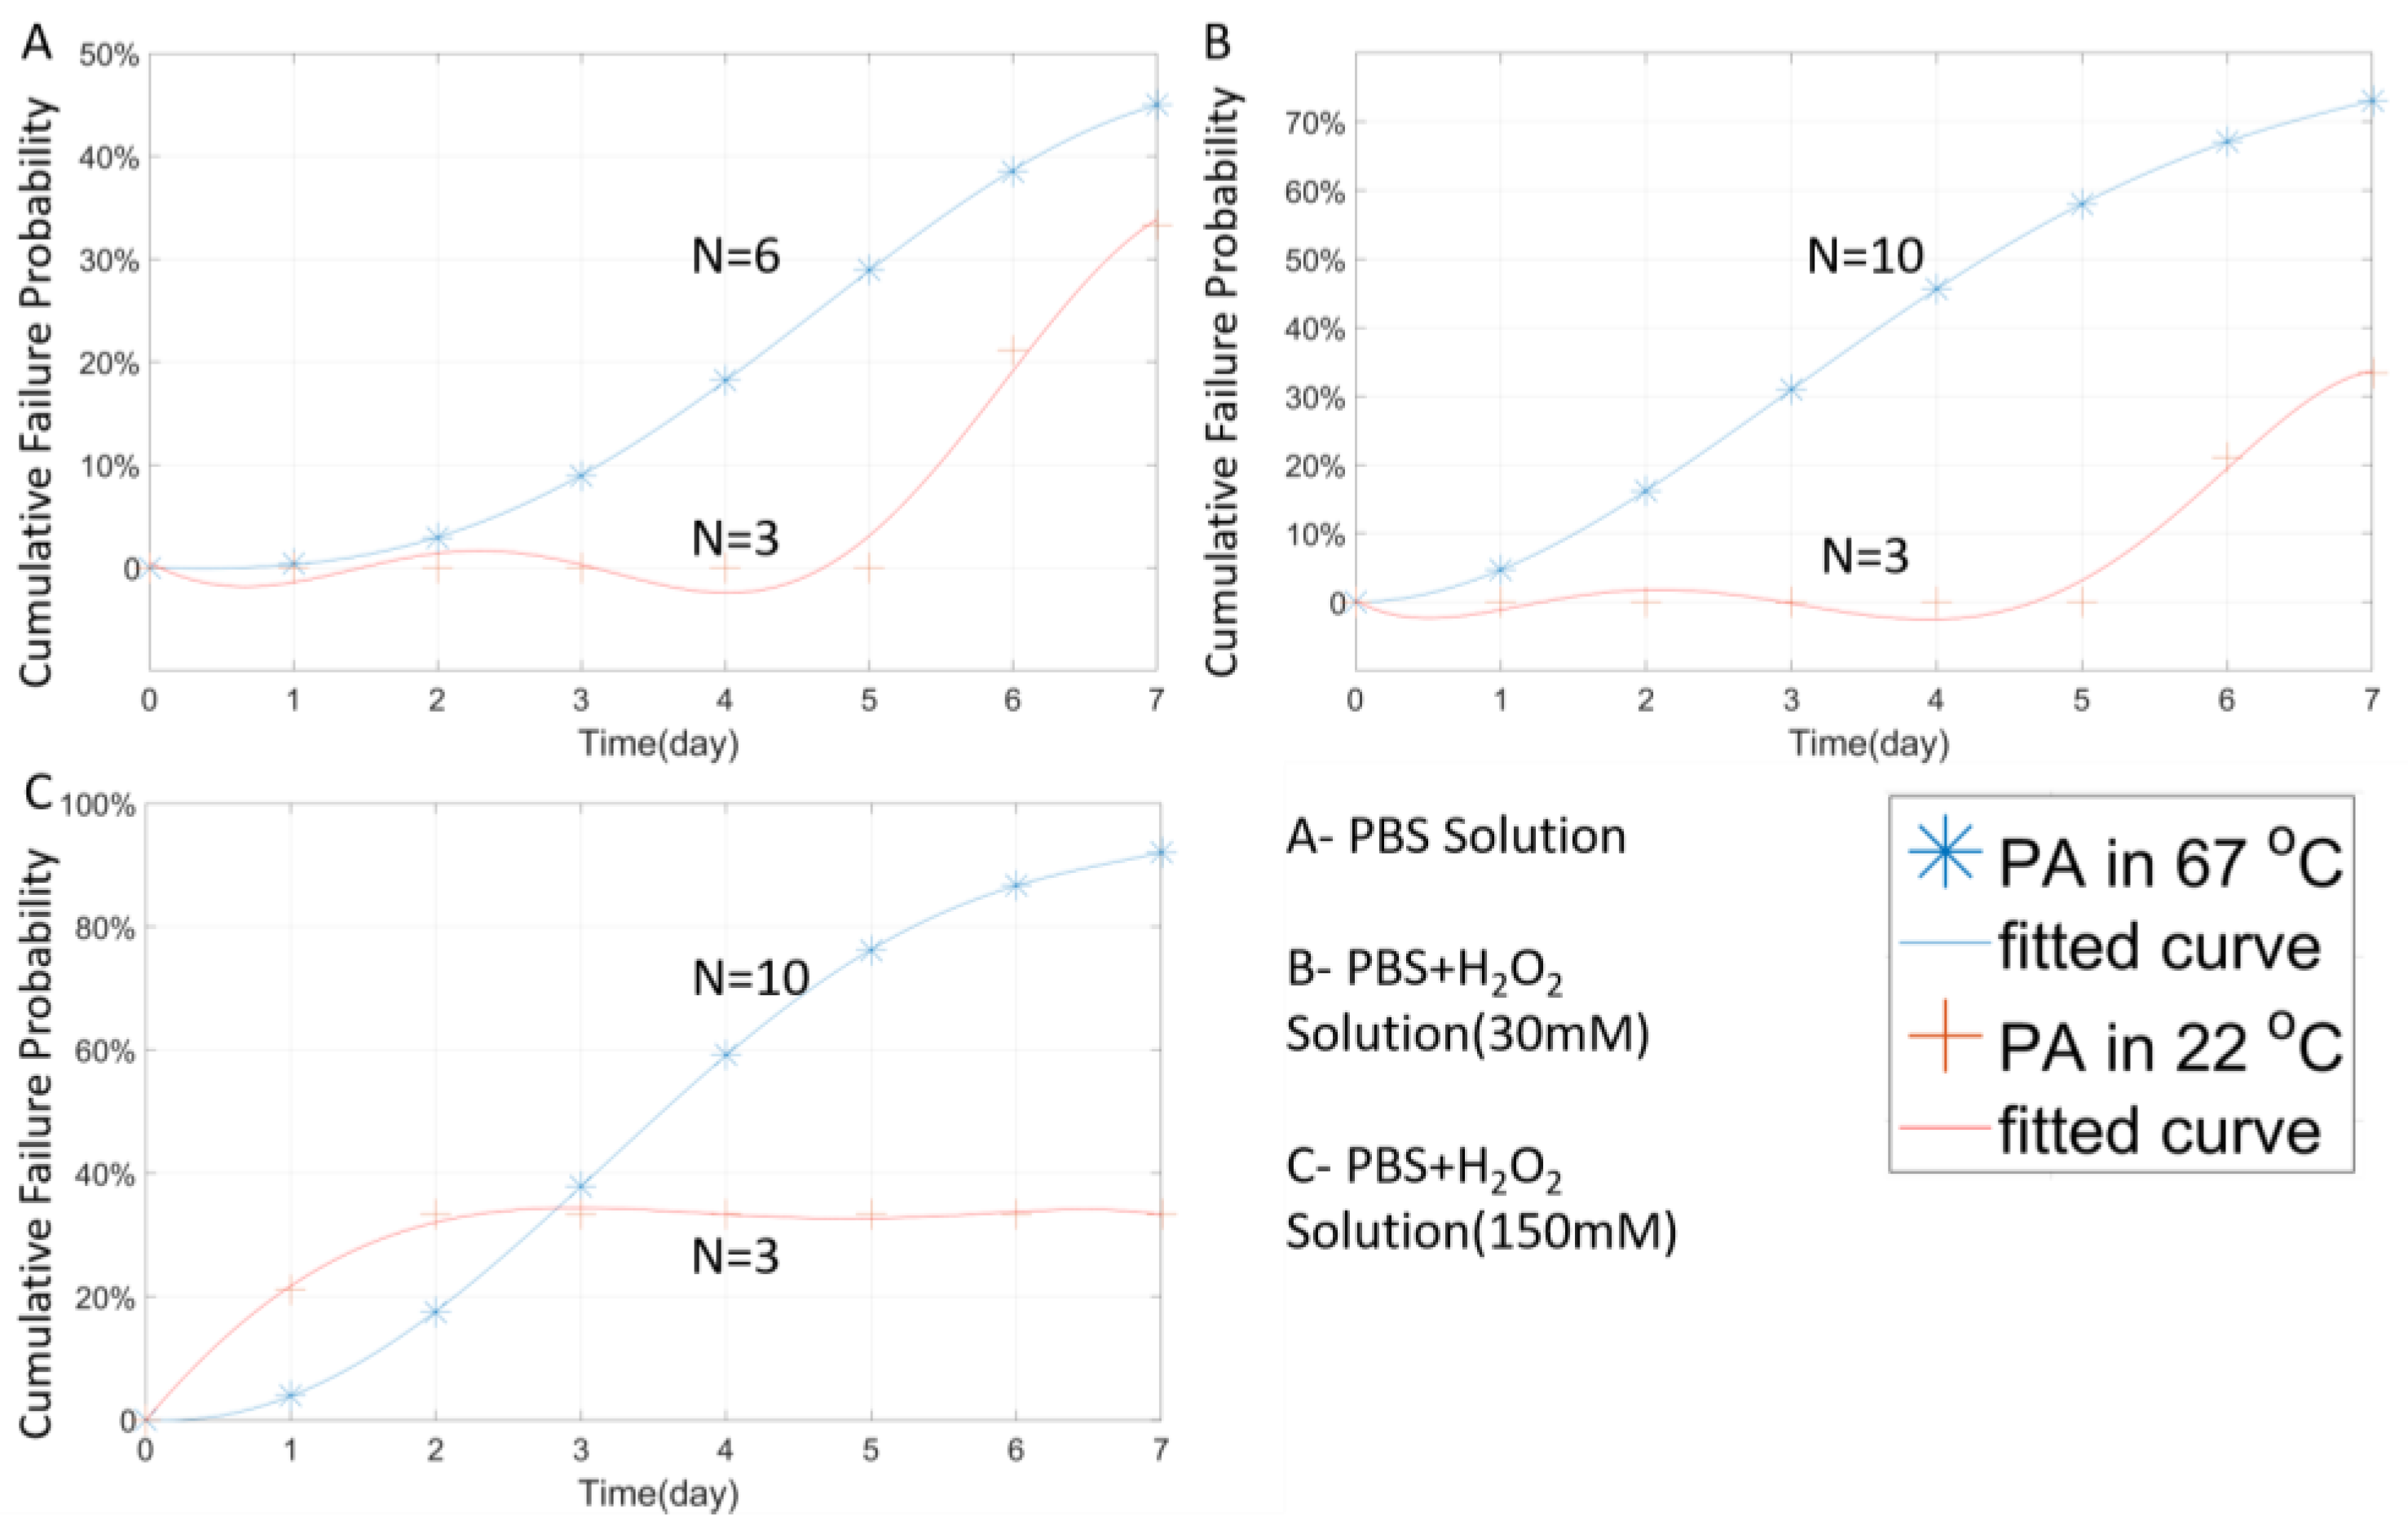
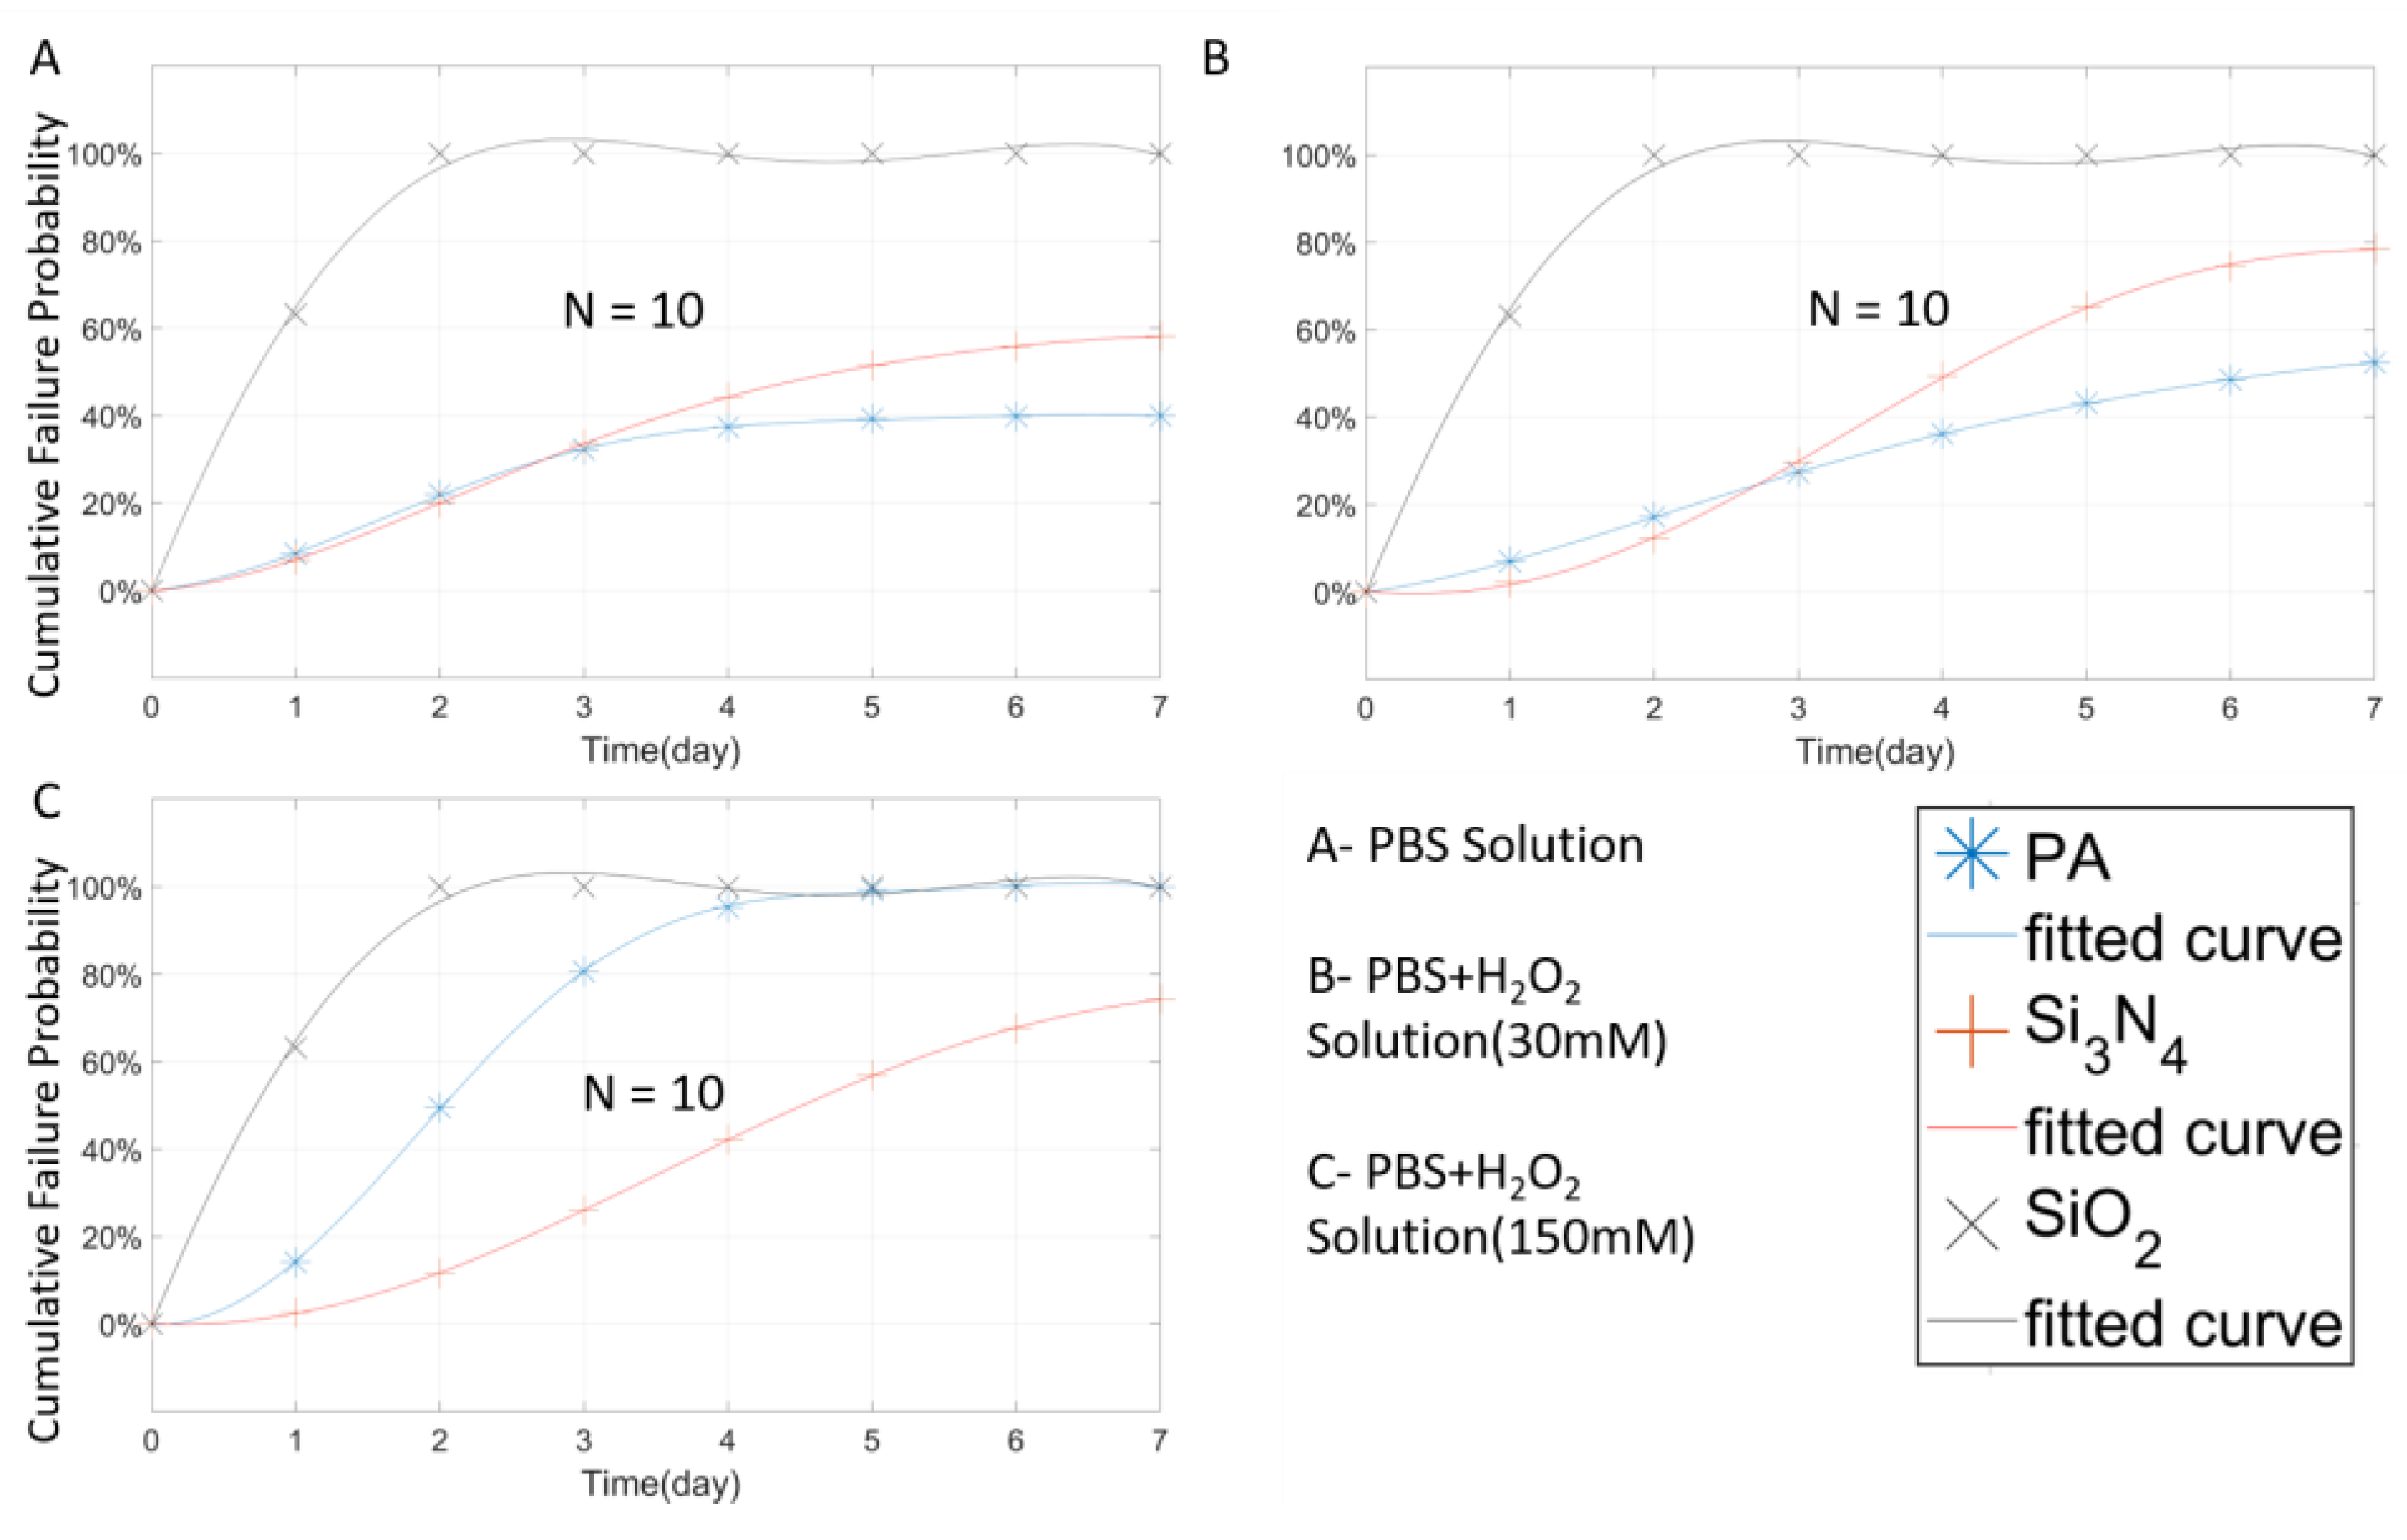
3.1. Temperature Effect
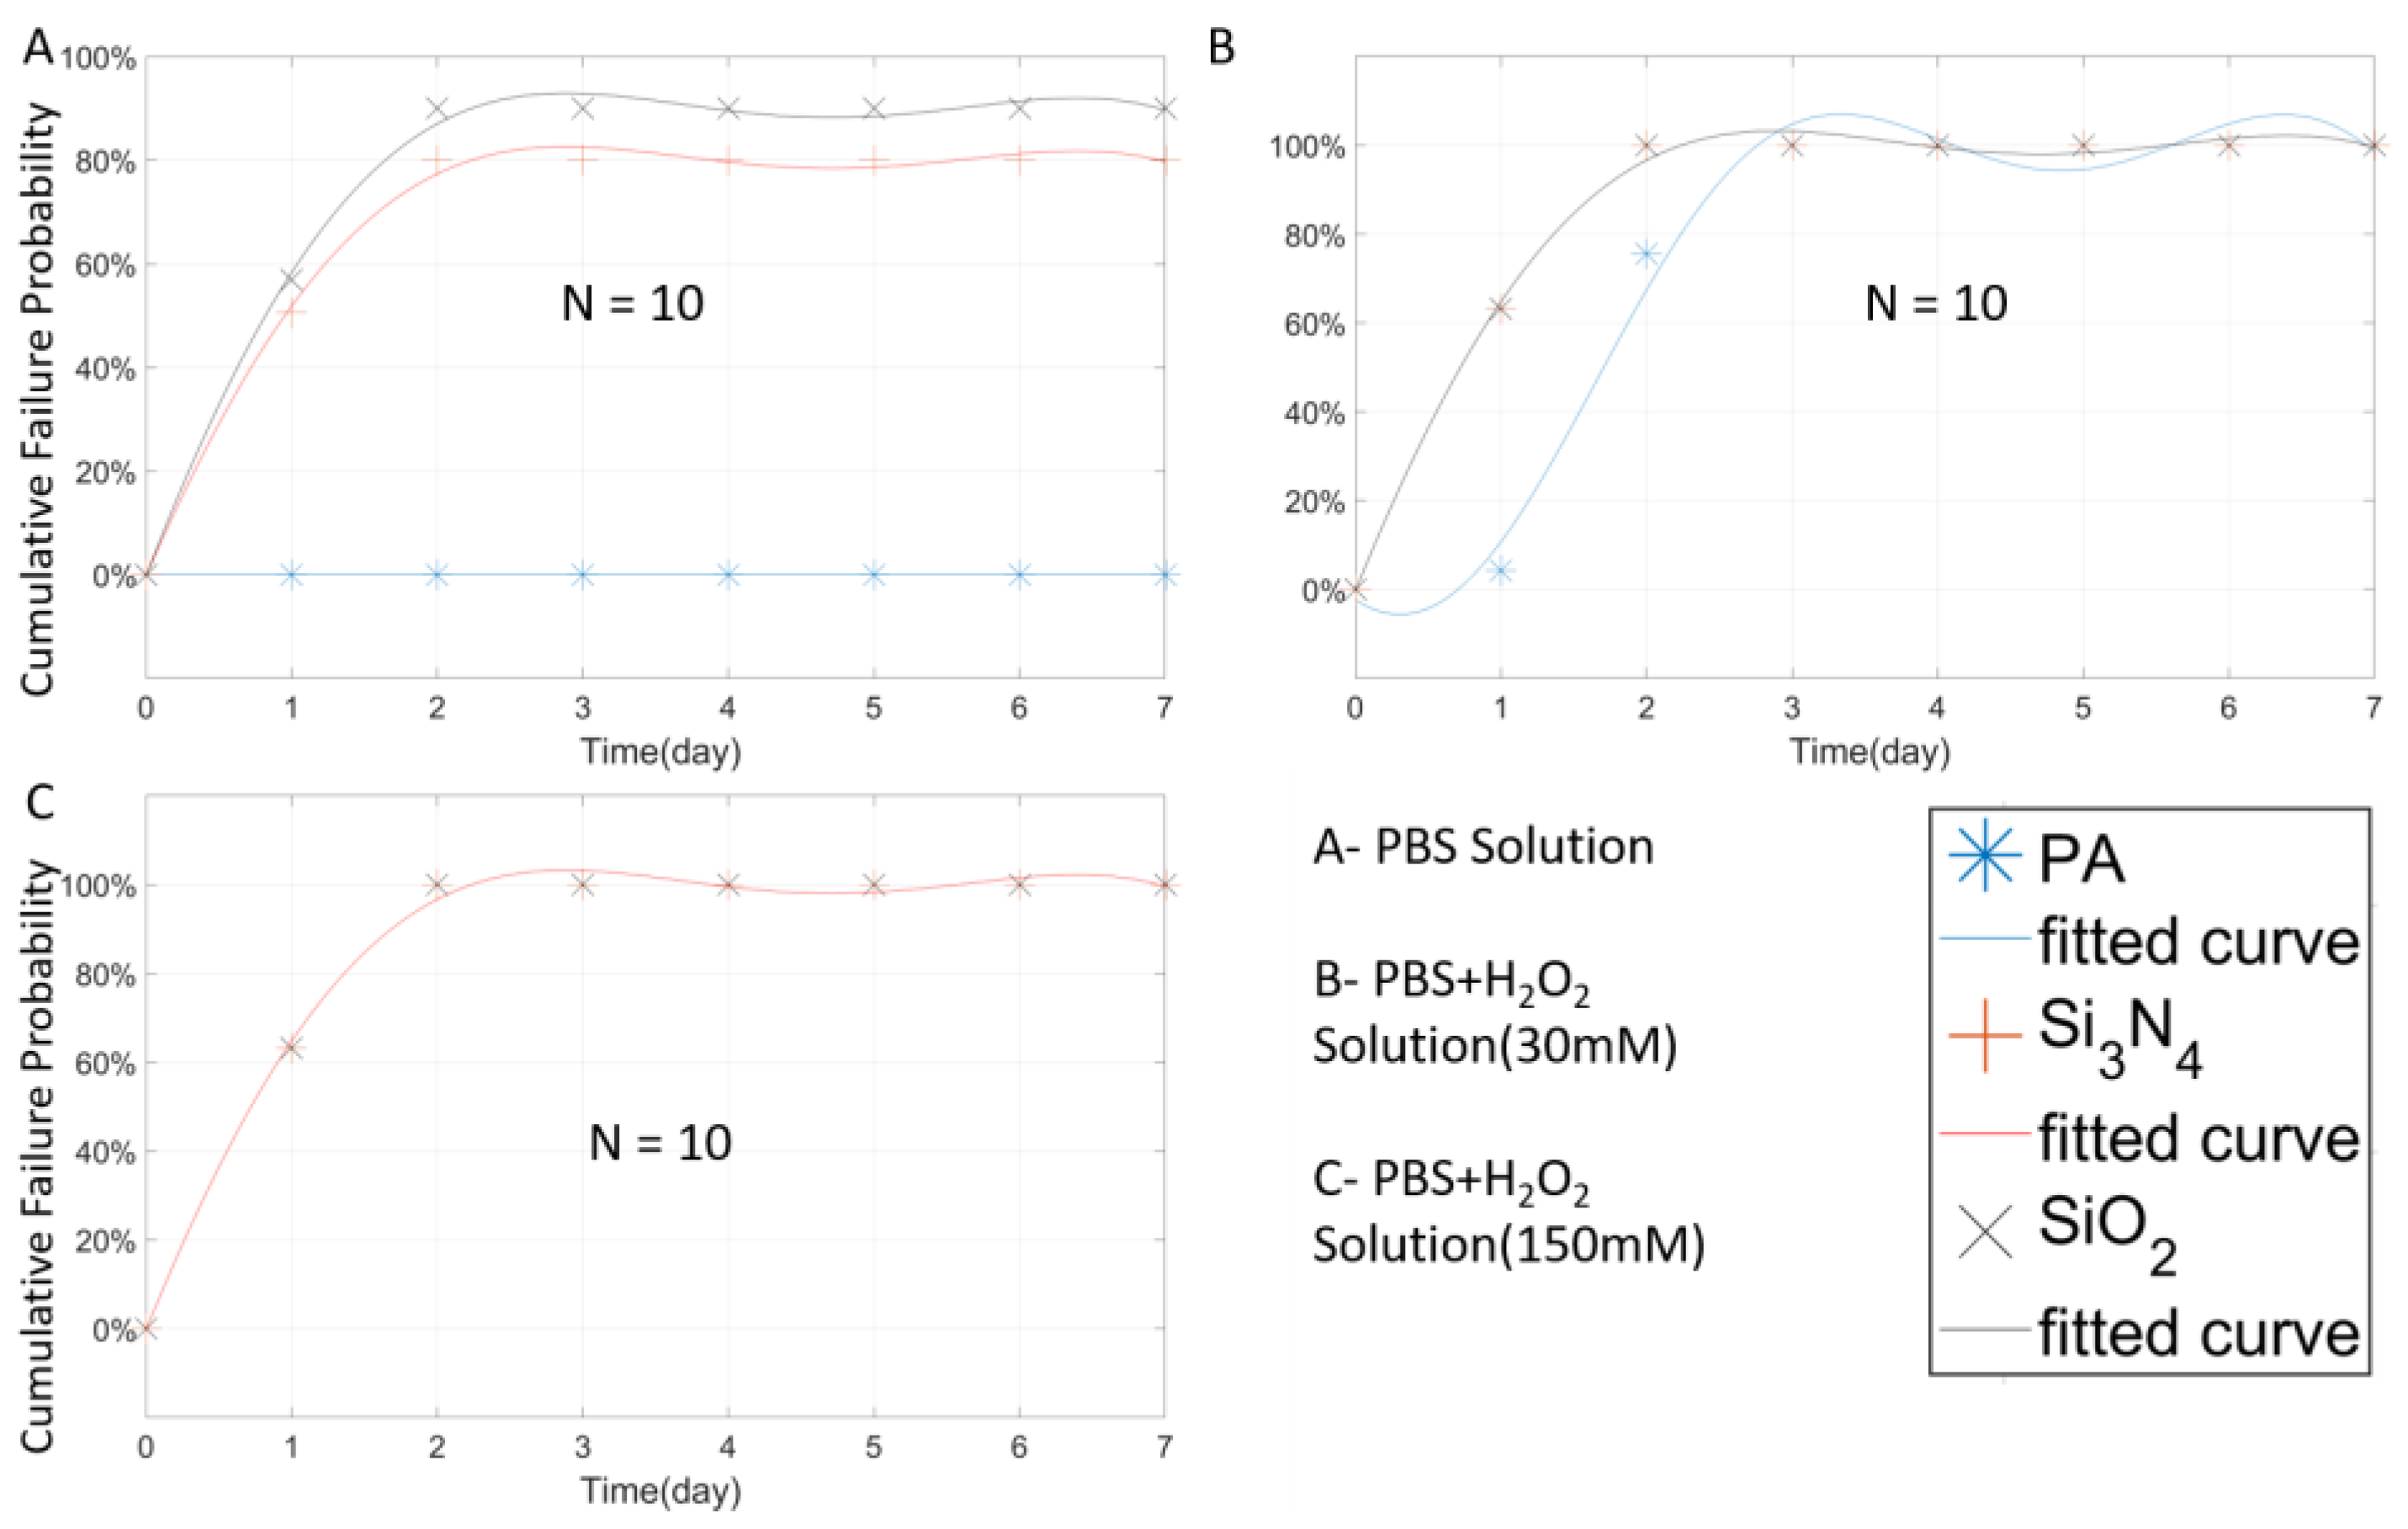
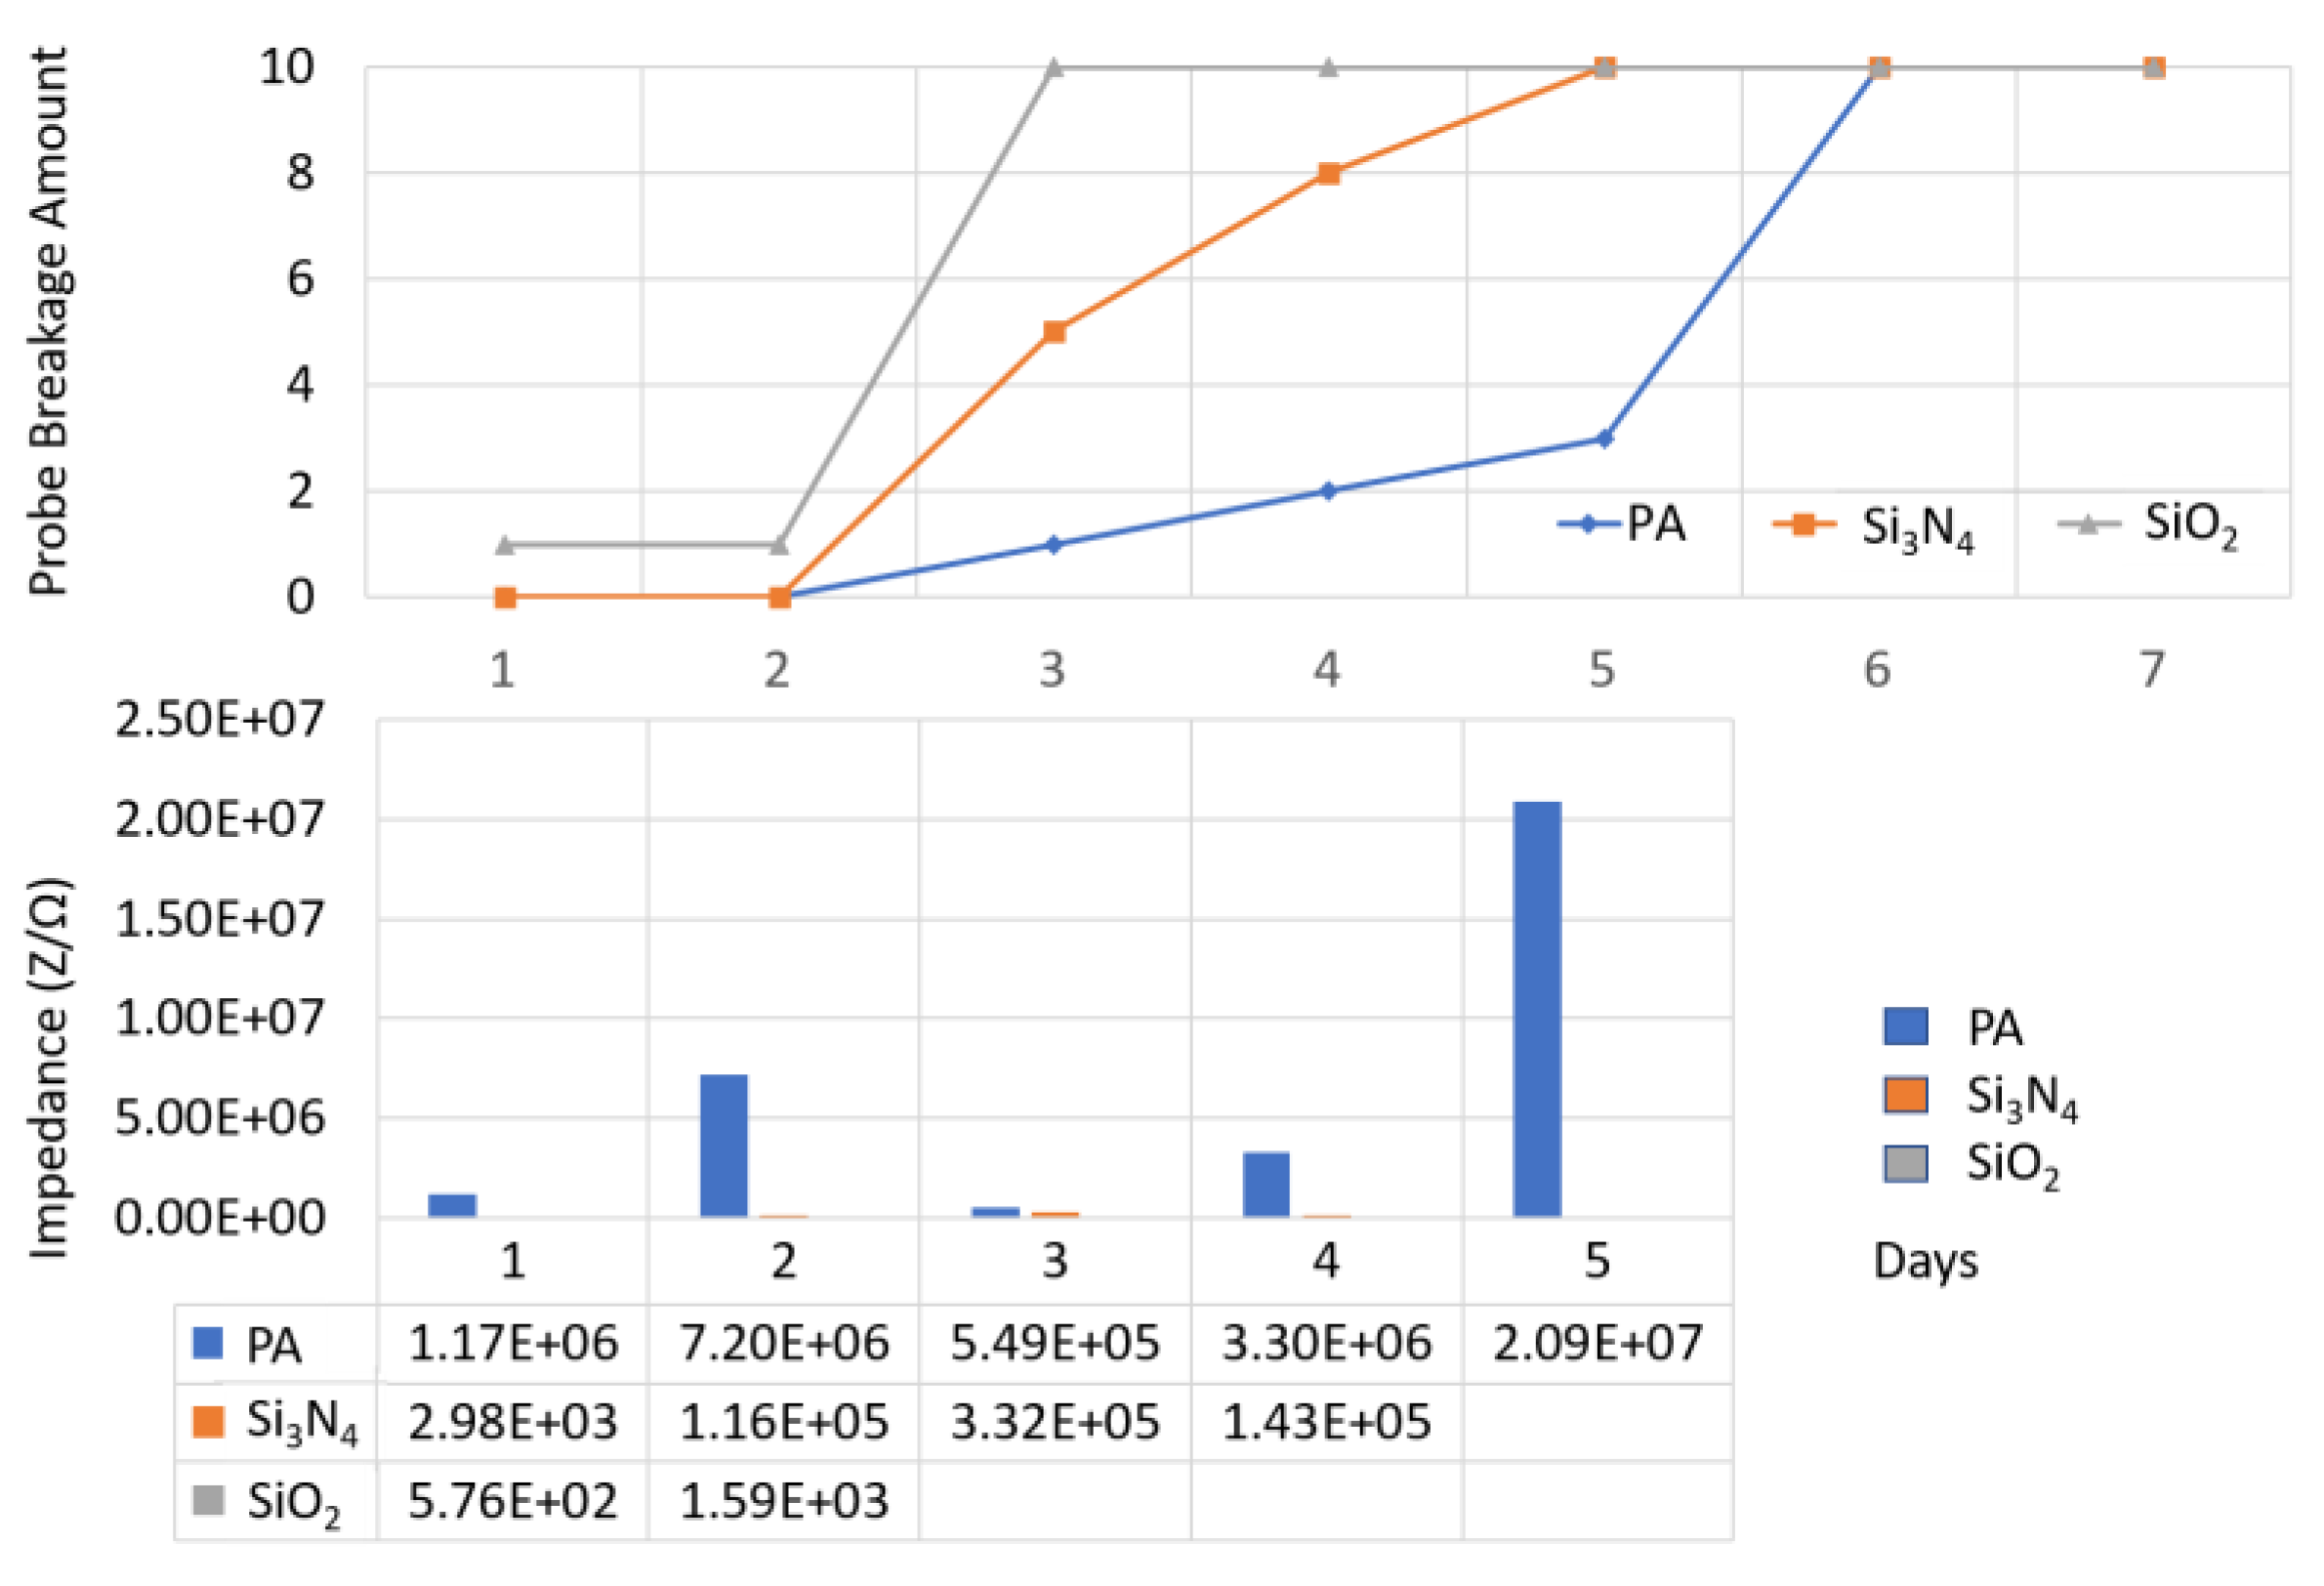
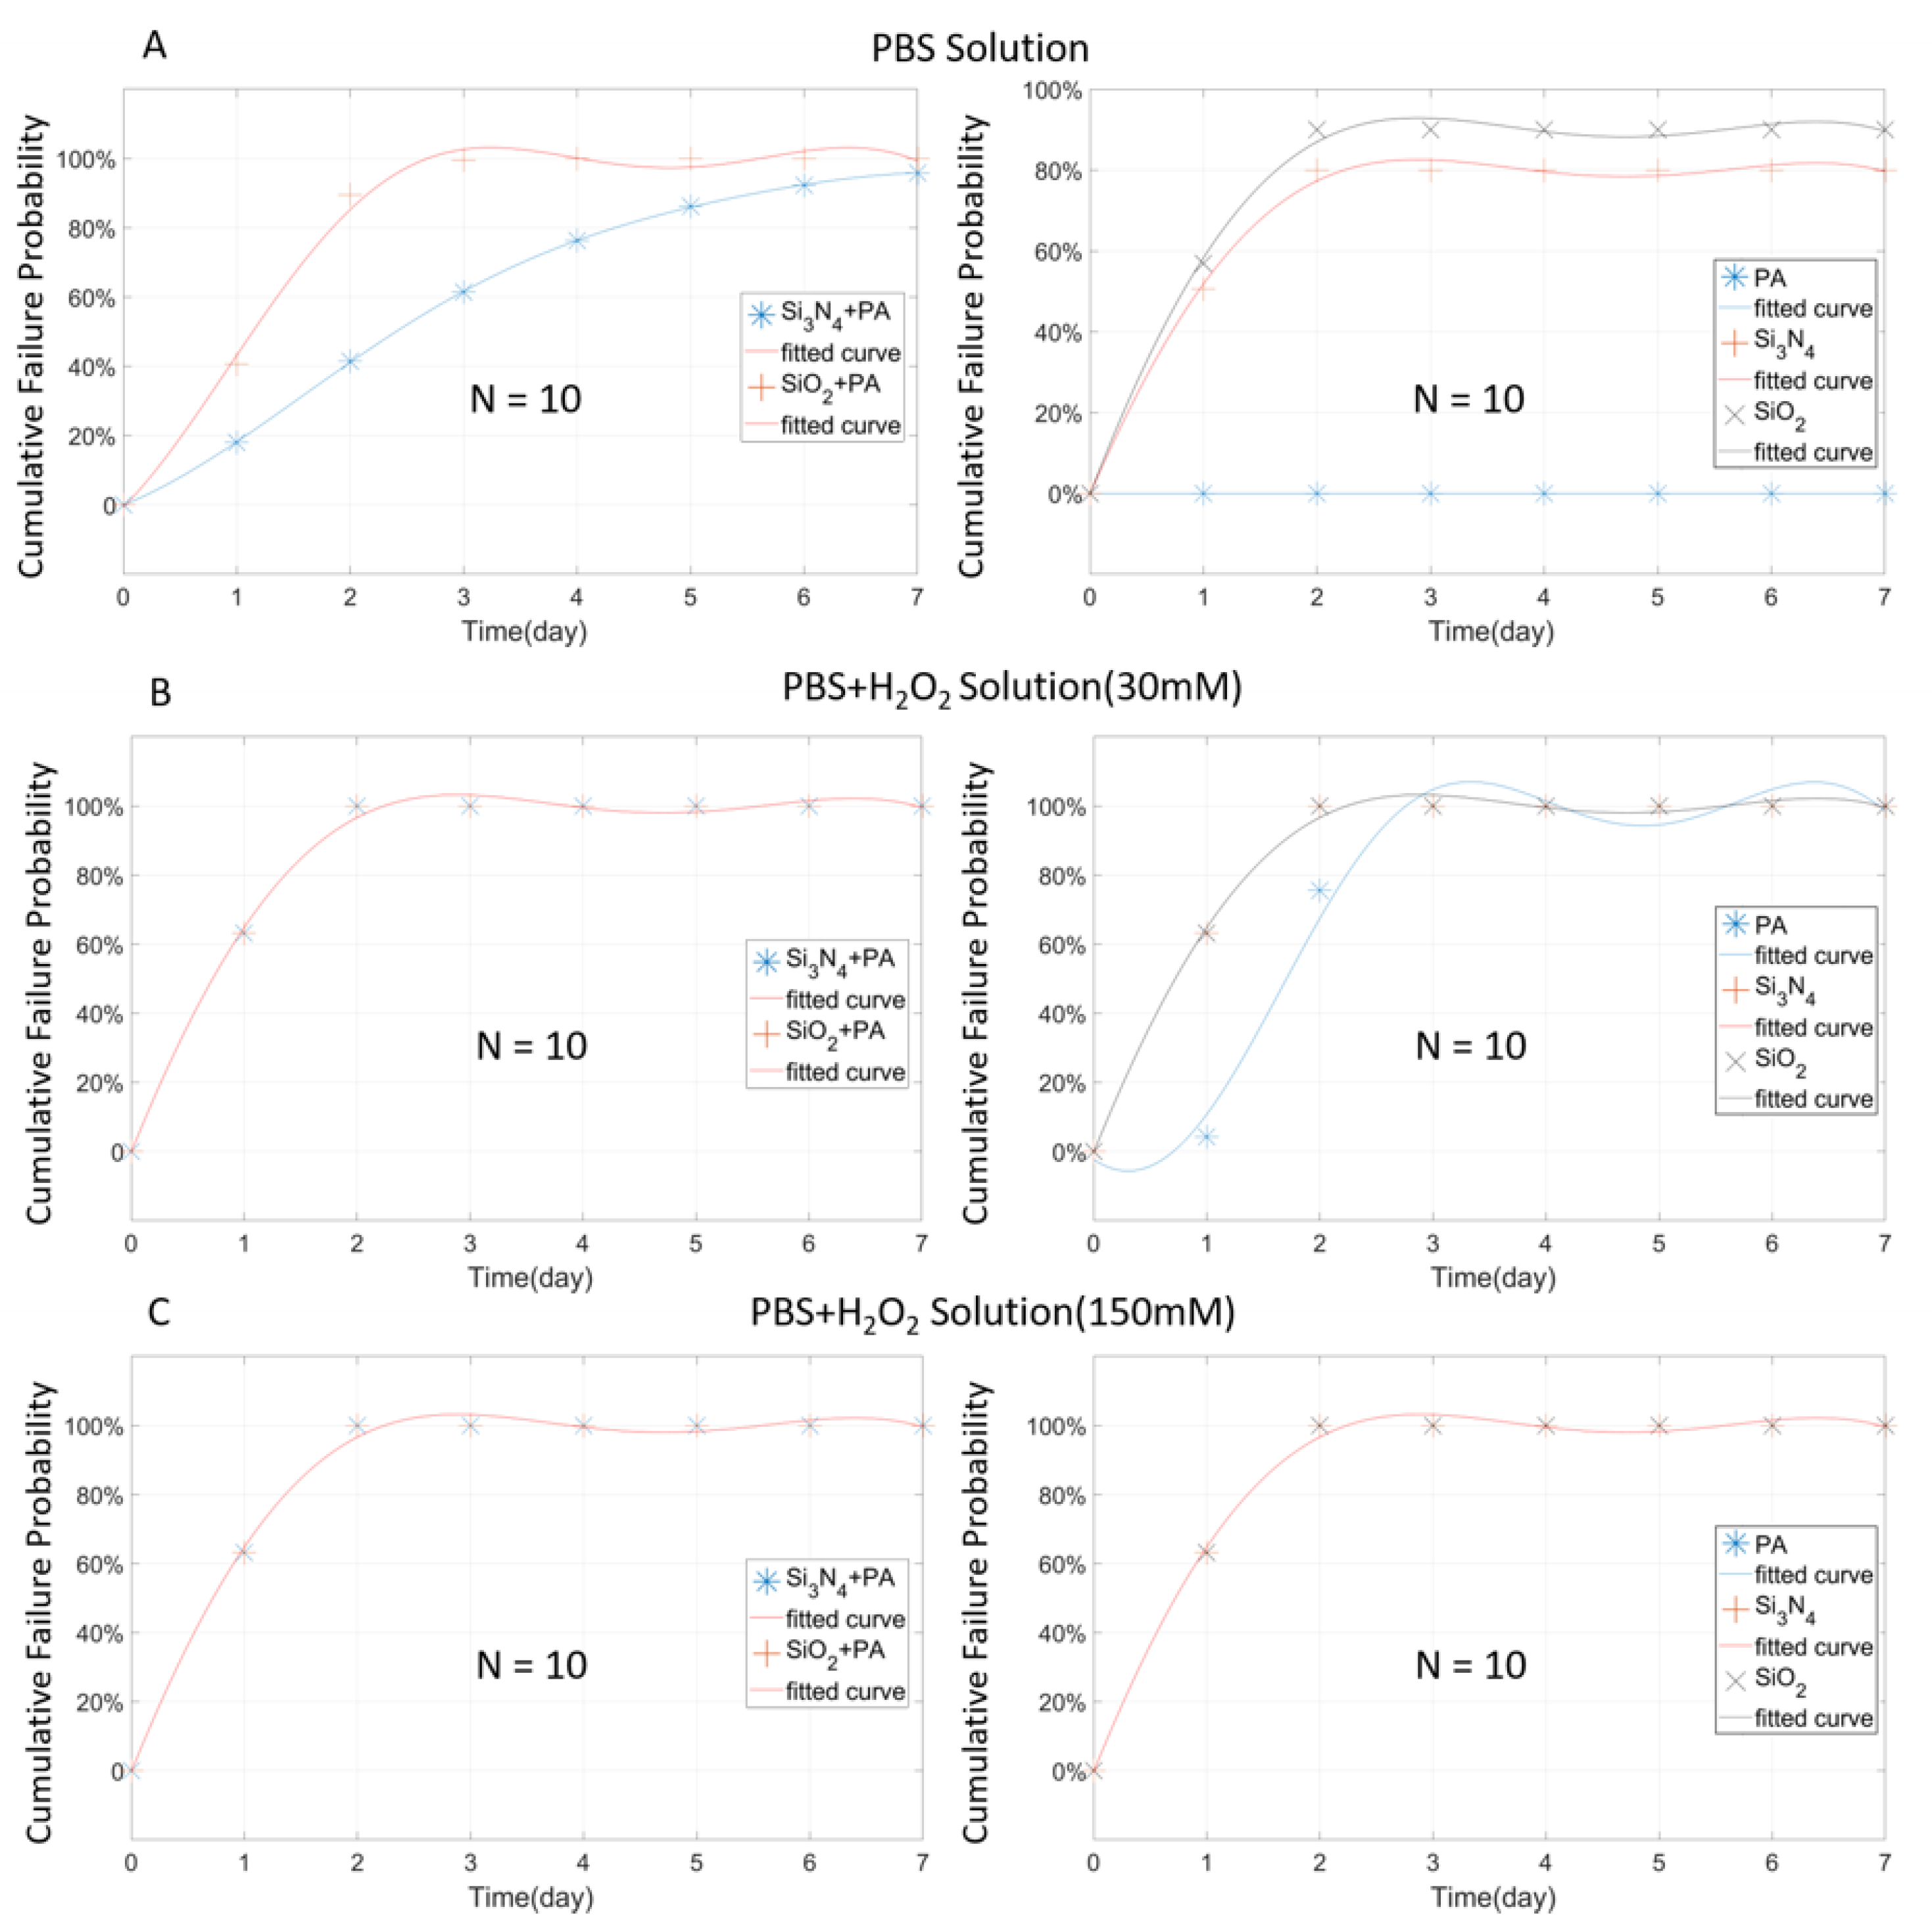
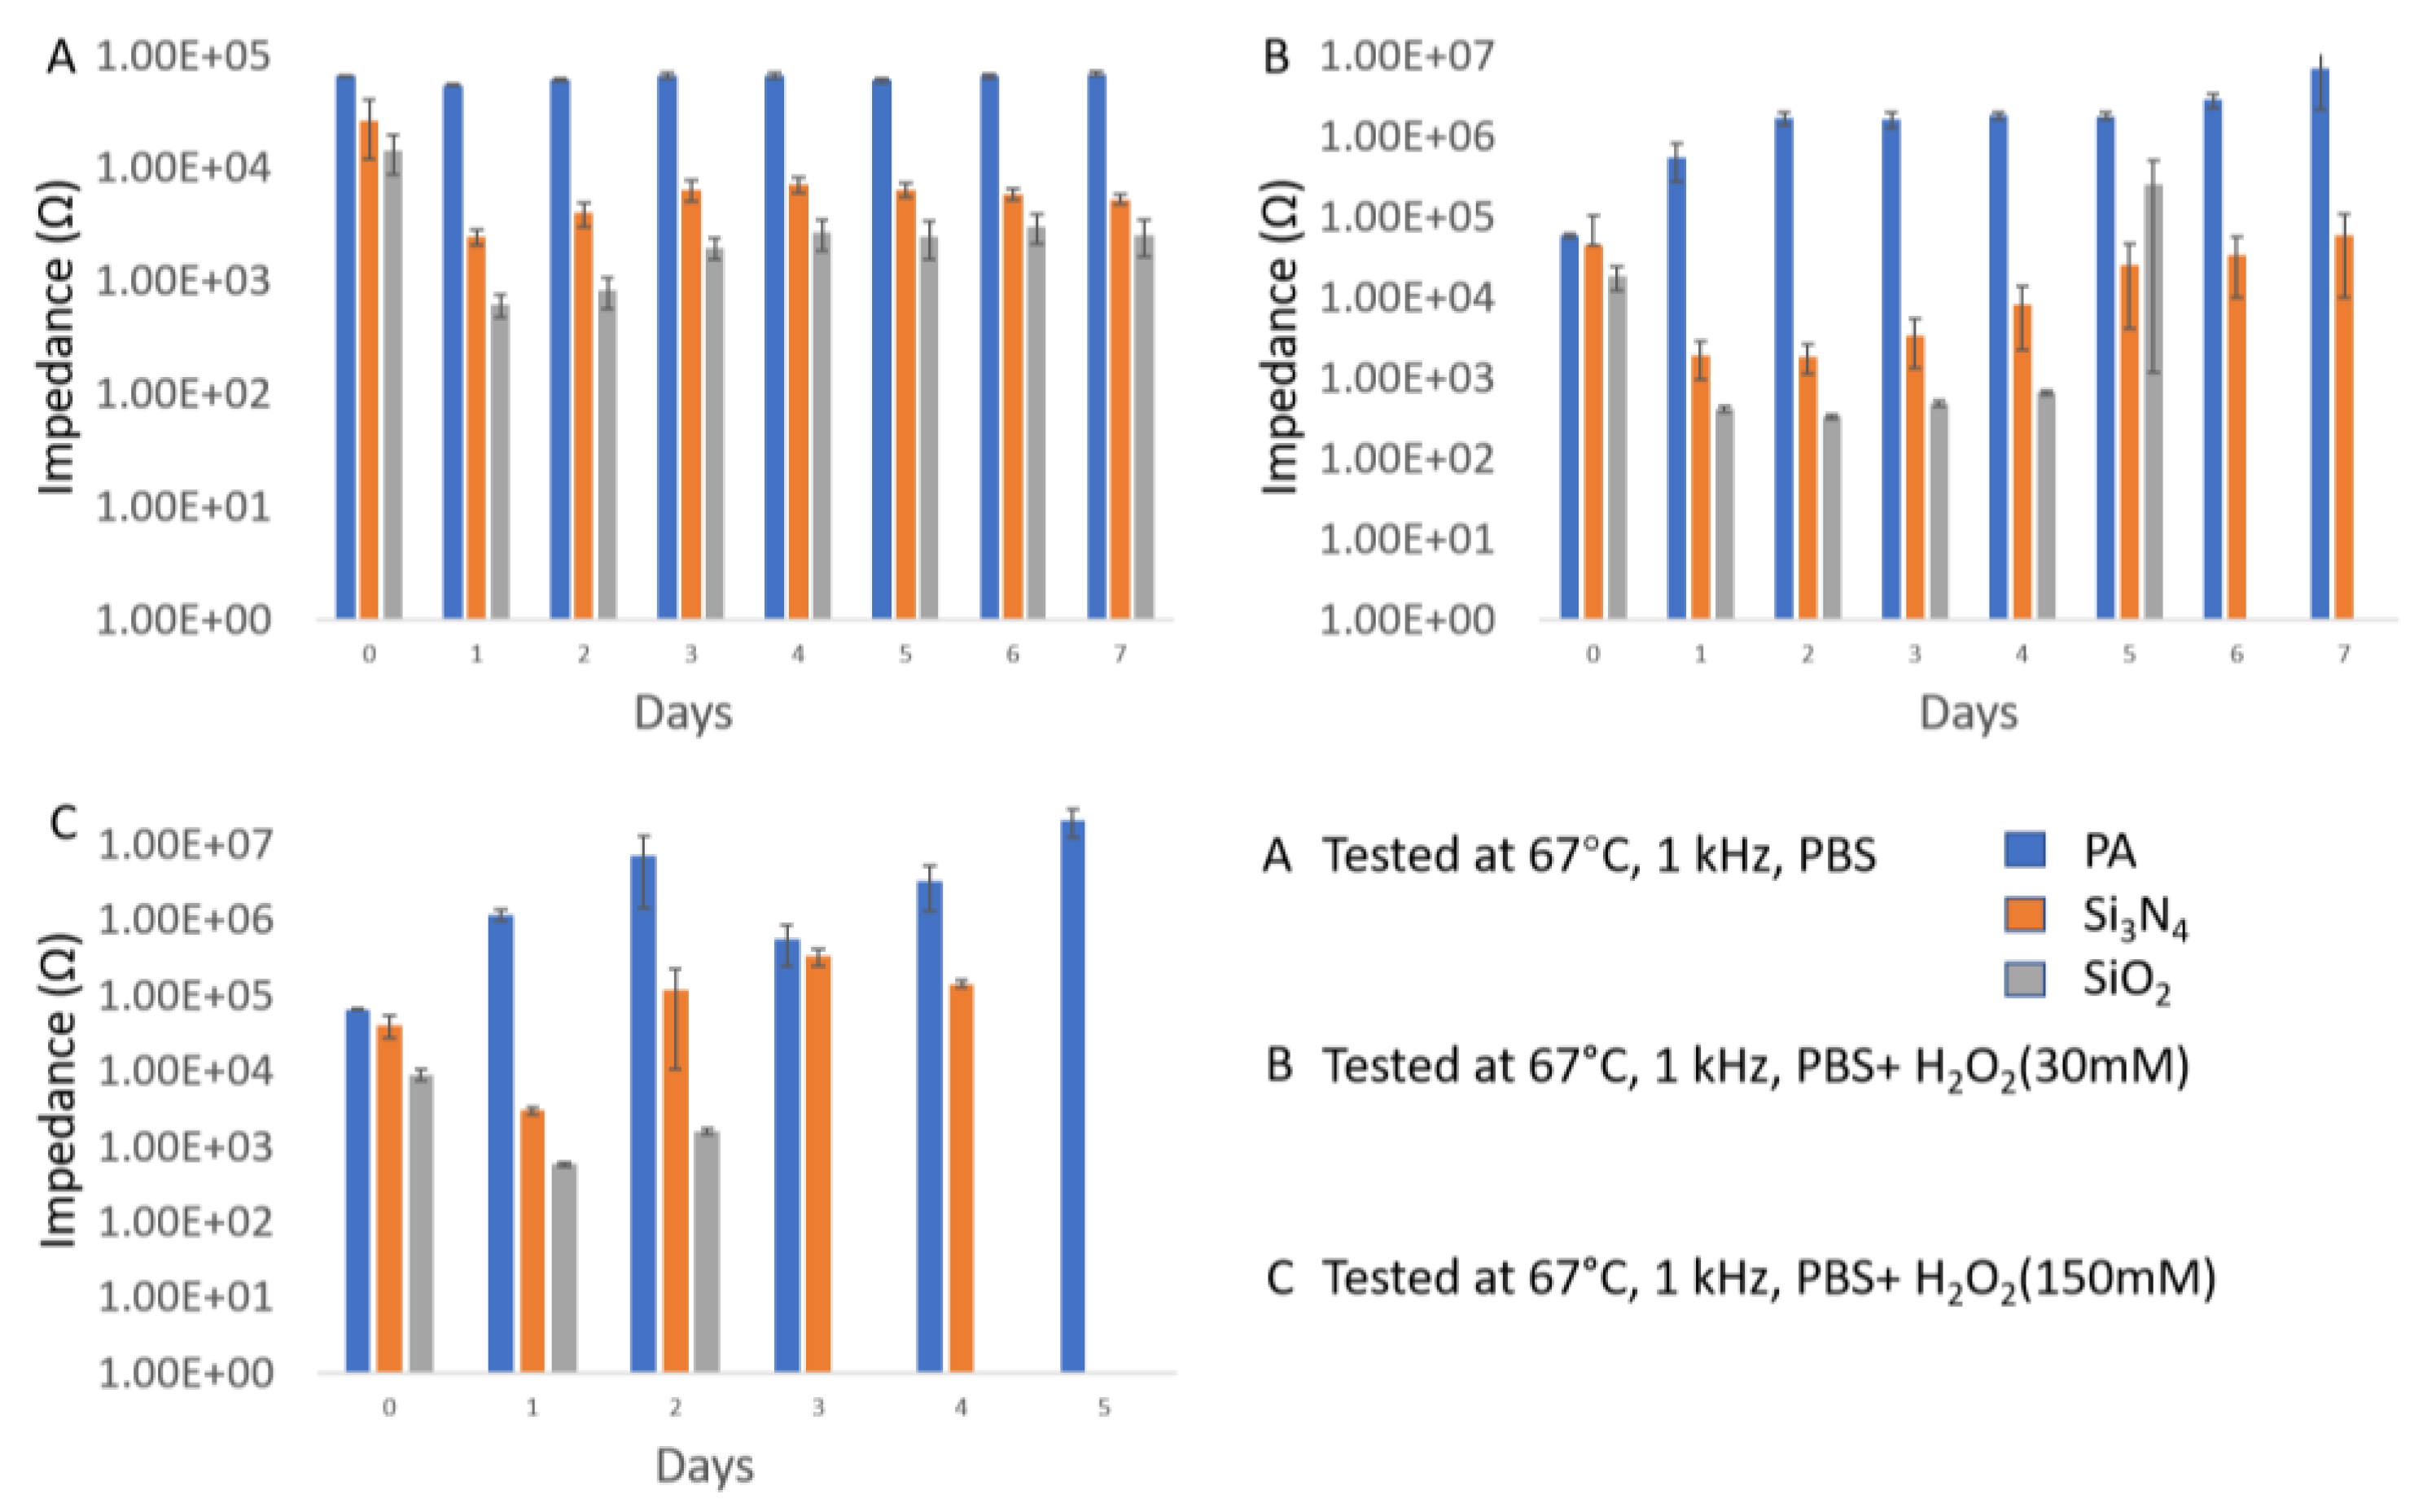
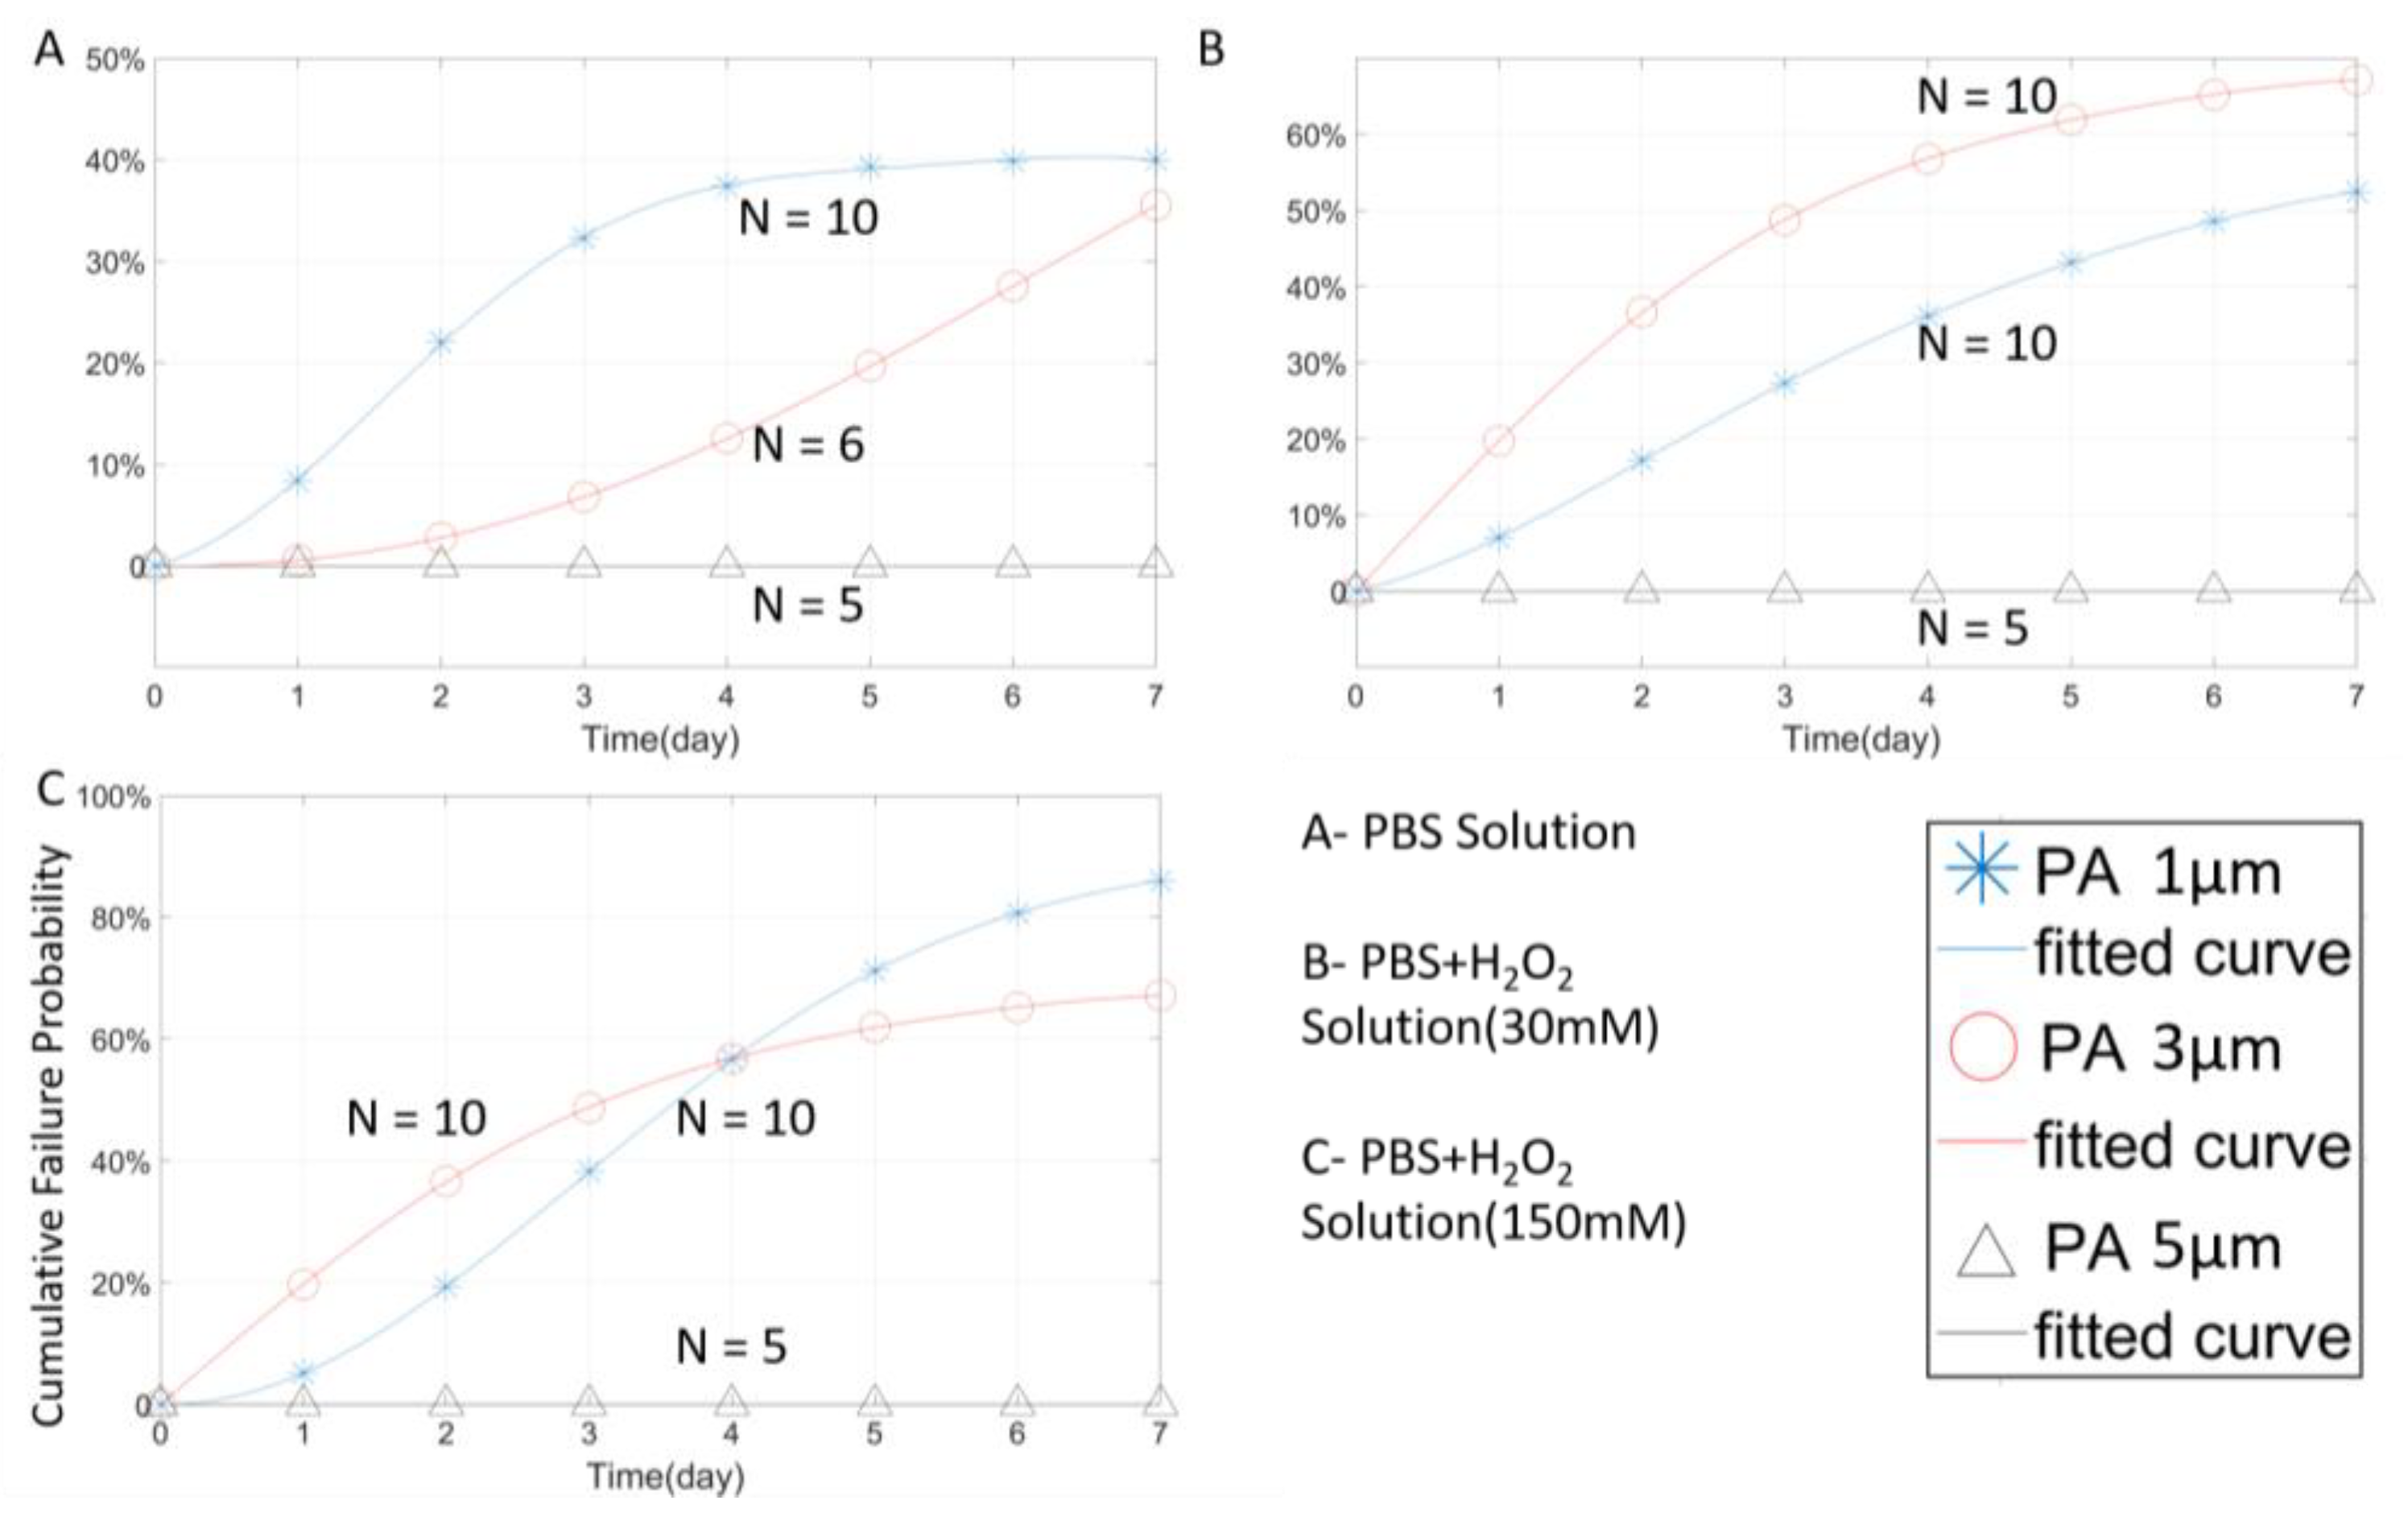
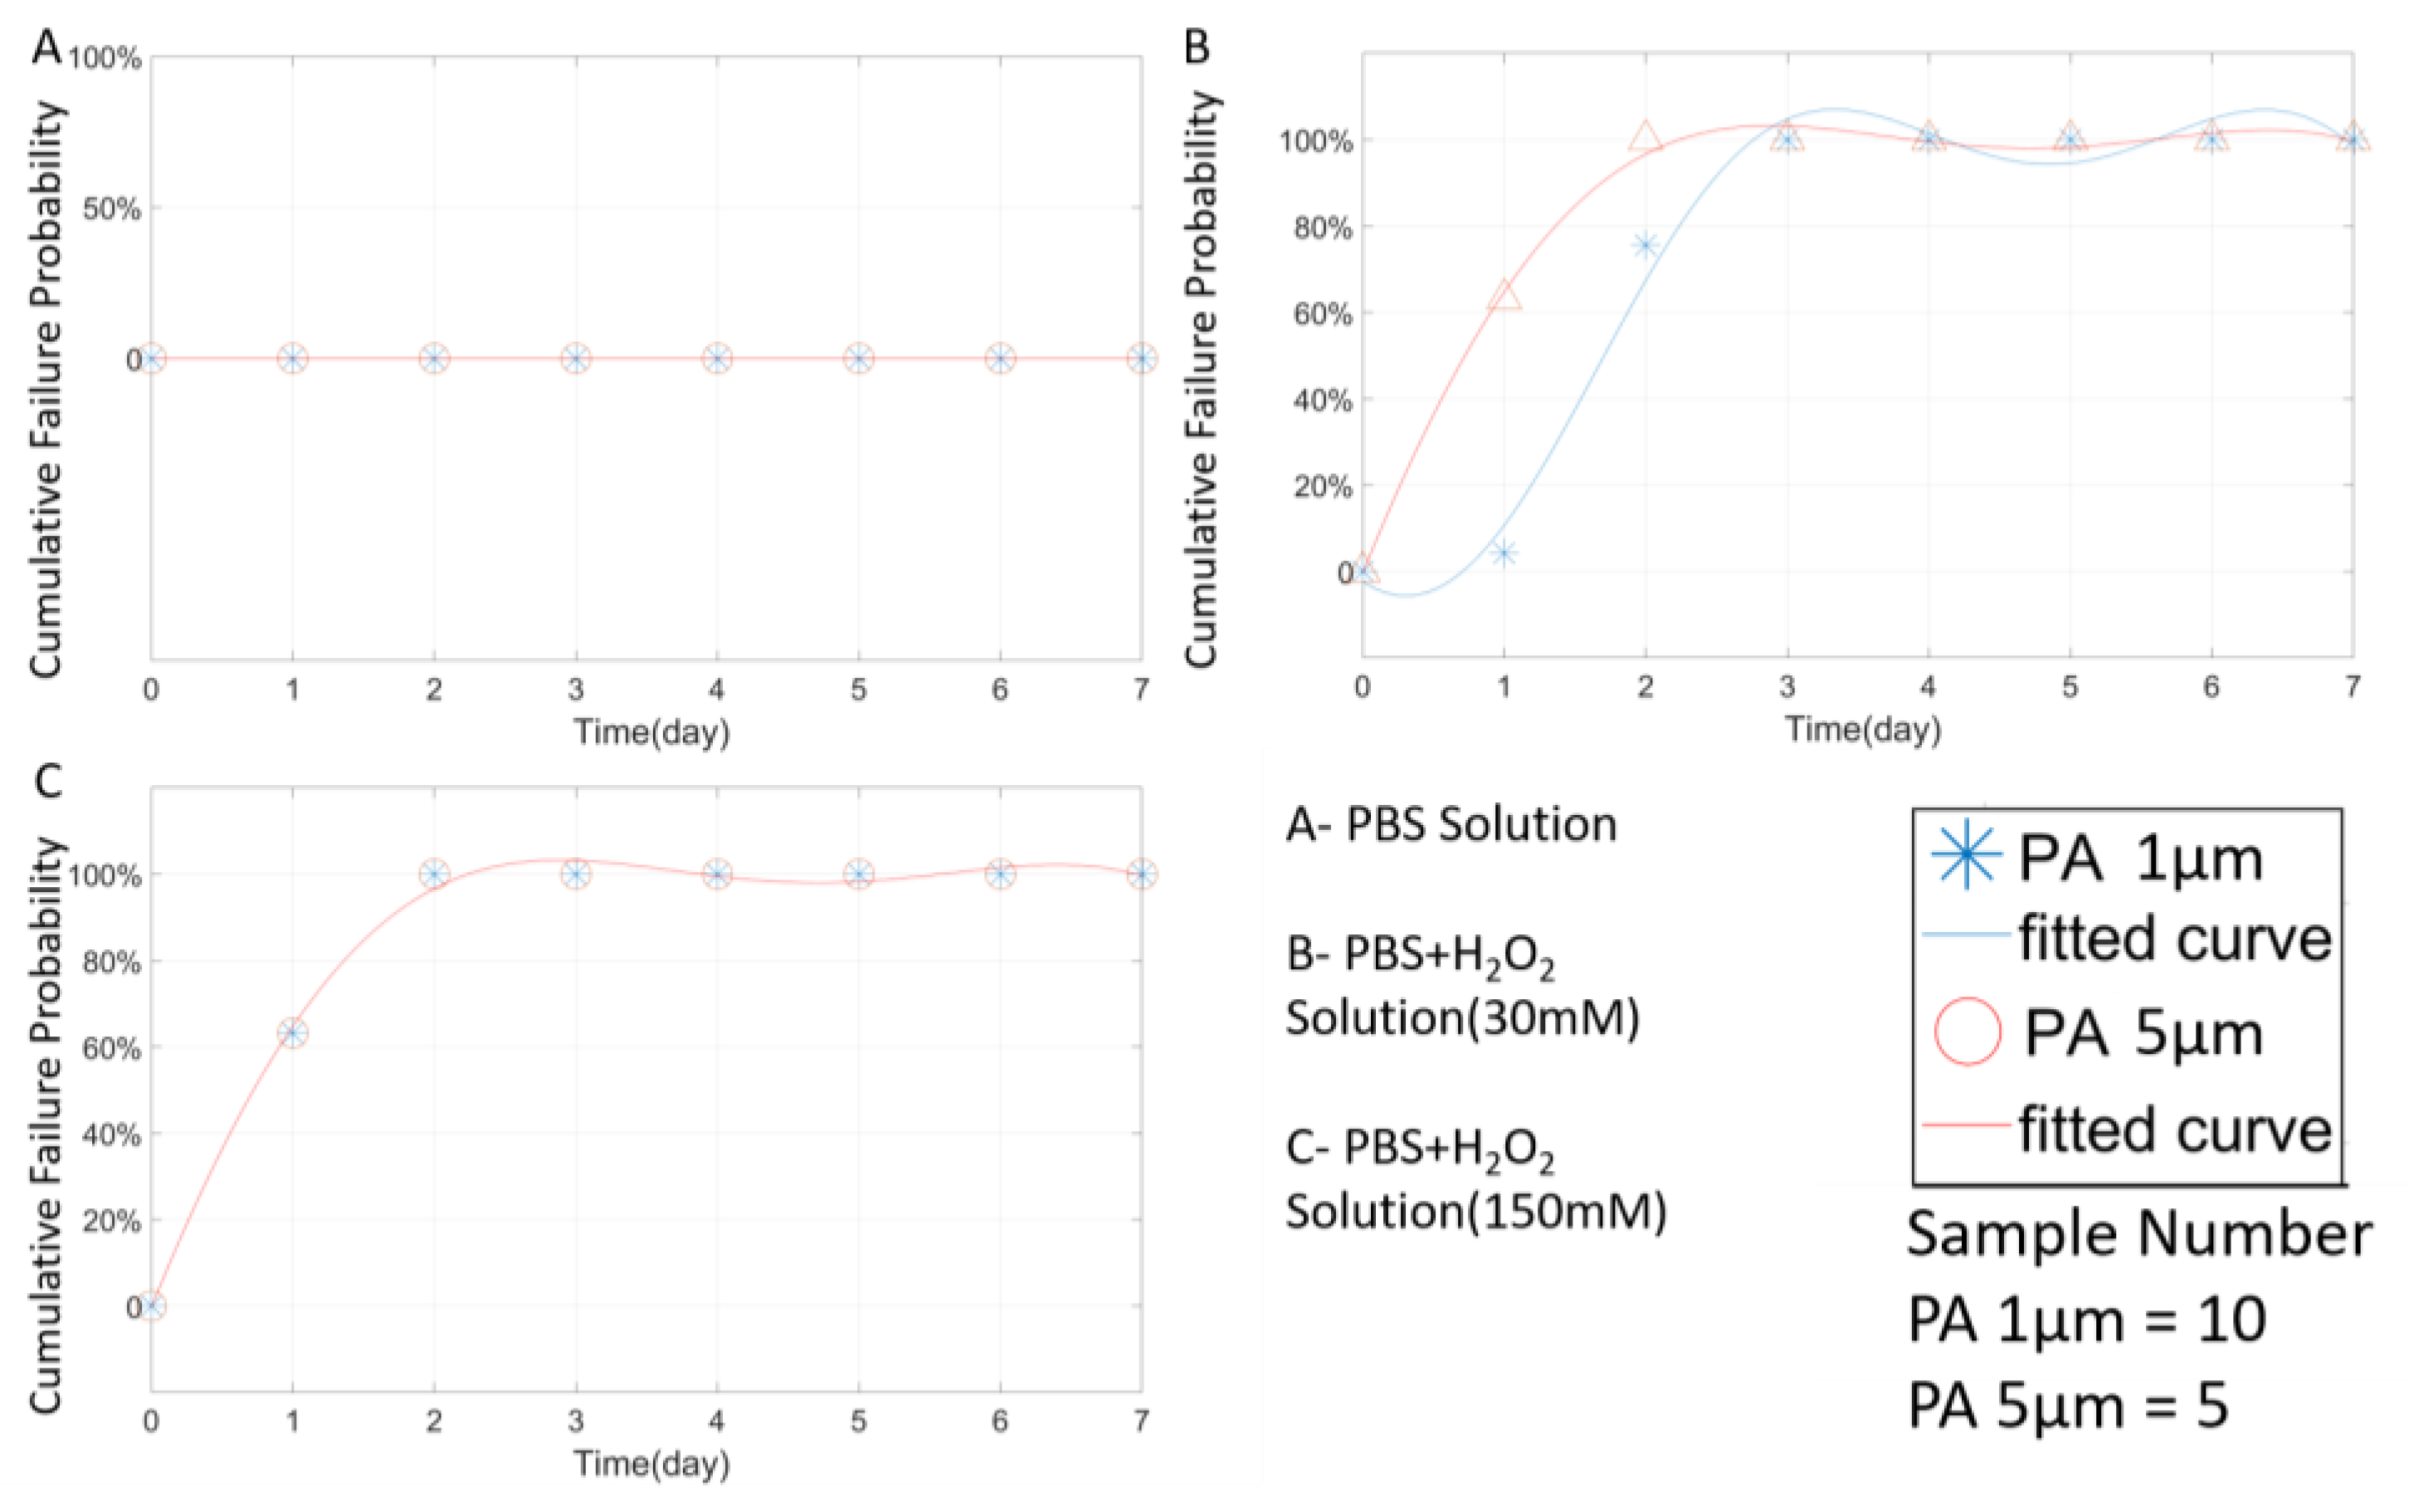
3.2. Analysis of Three Single-Layer Materials at 1 µm Thickness
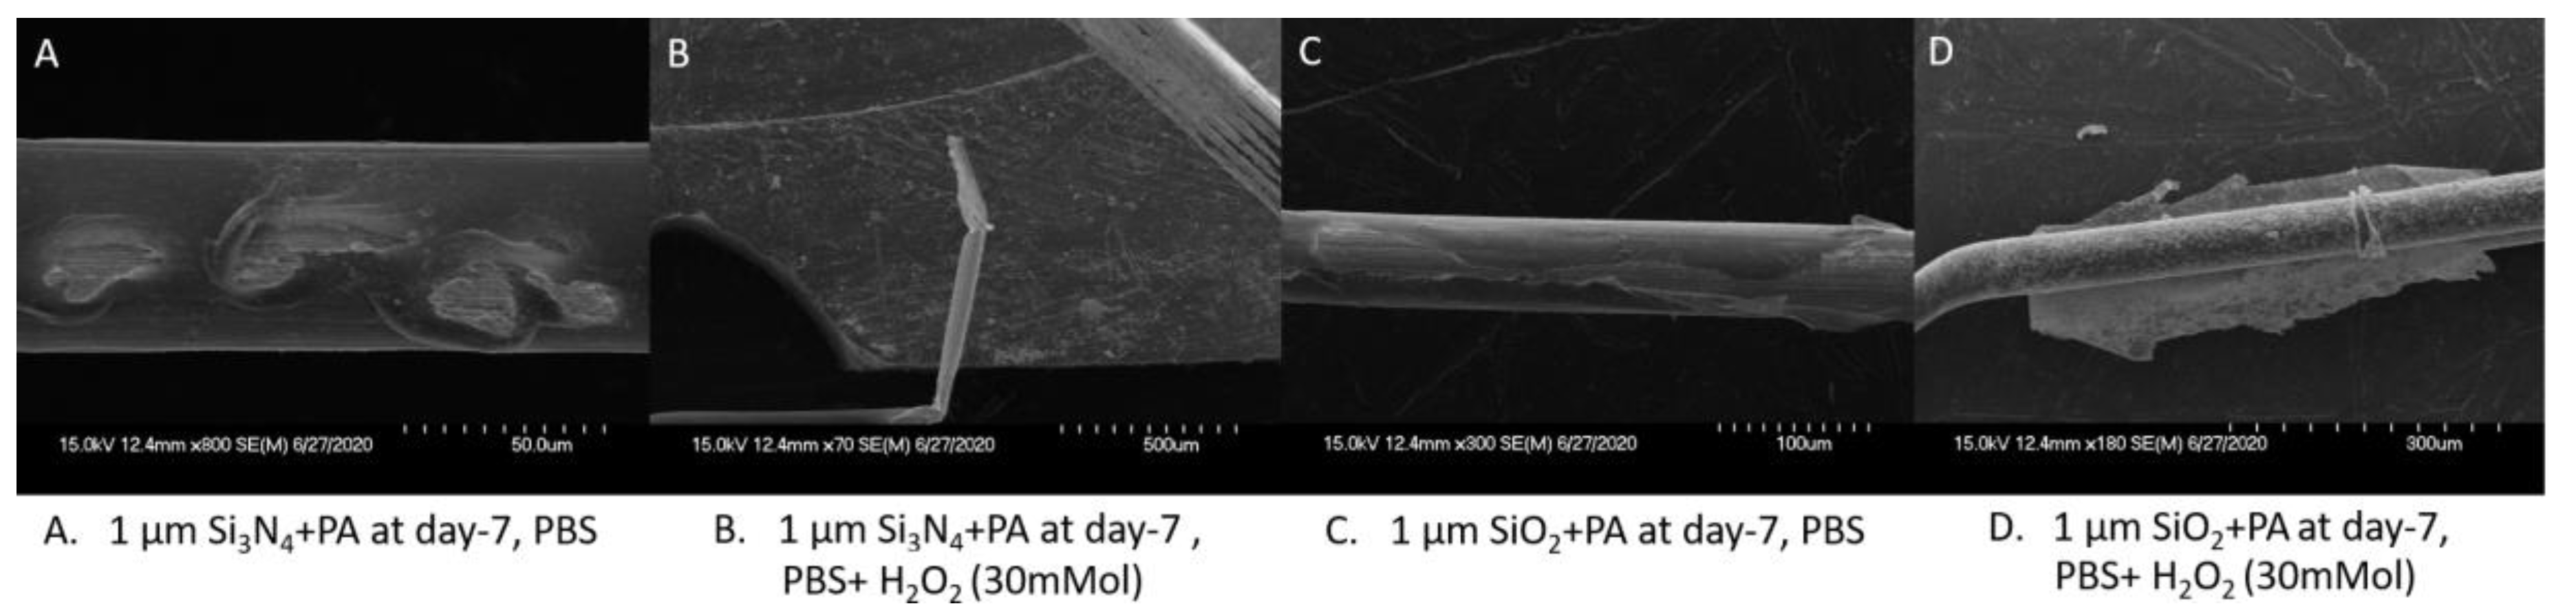
3.3. Composite Packaging Design
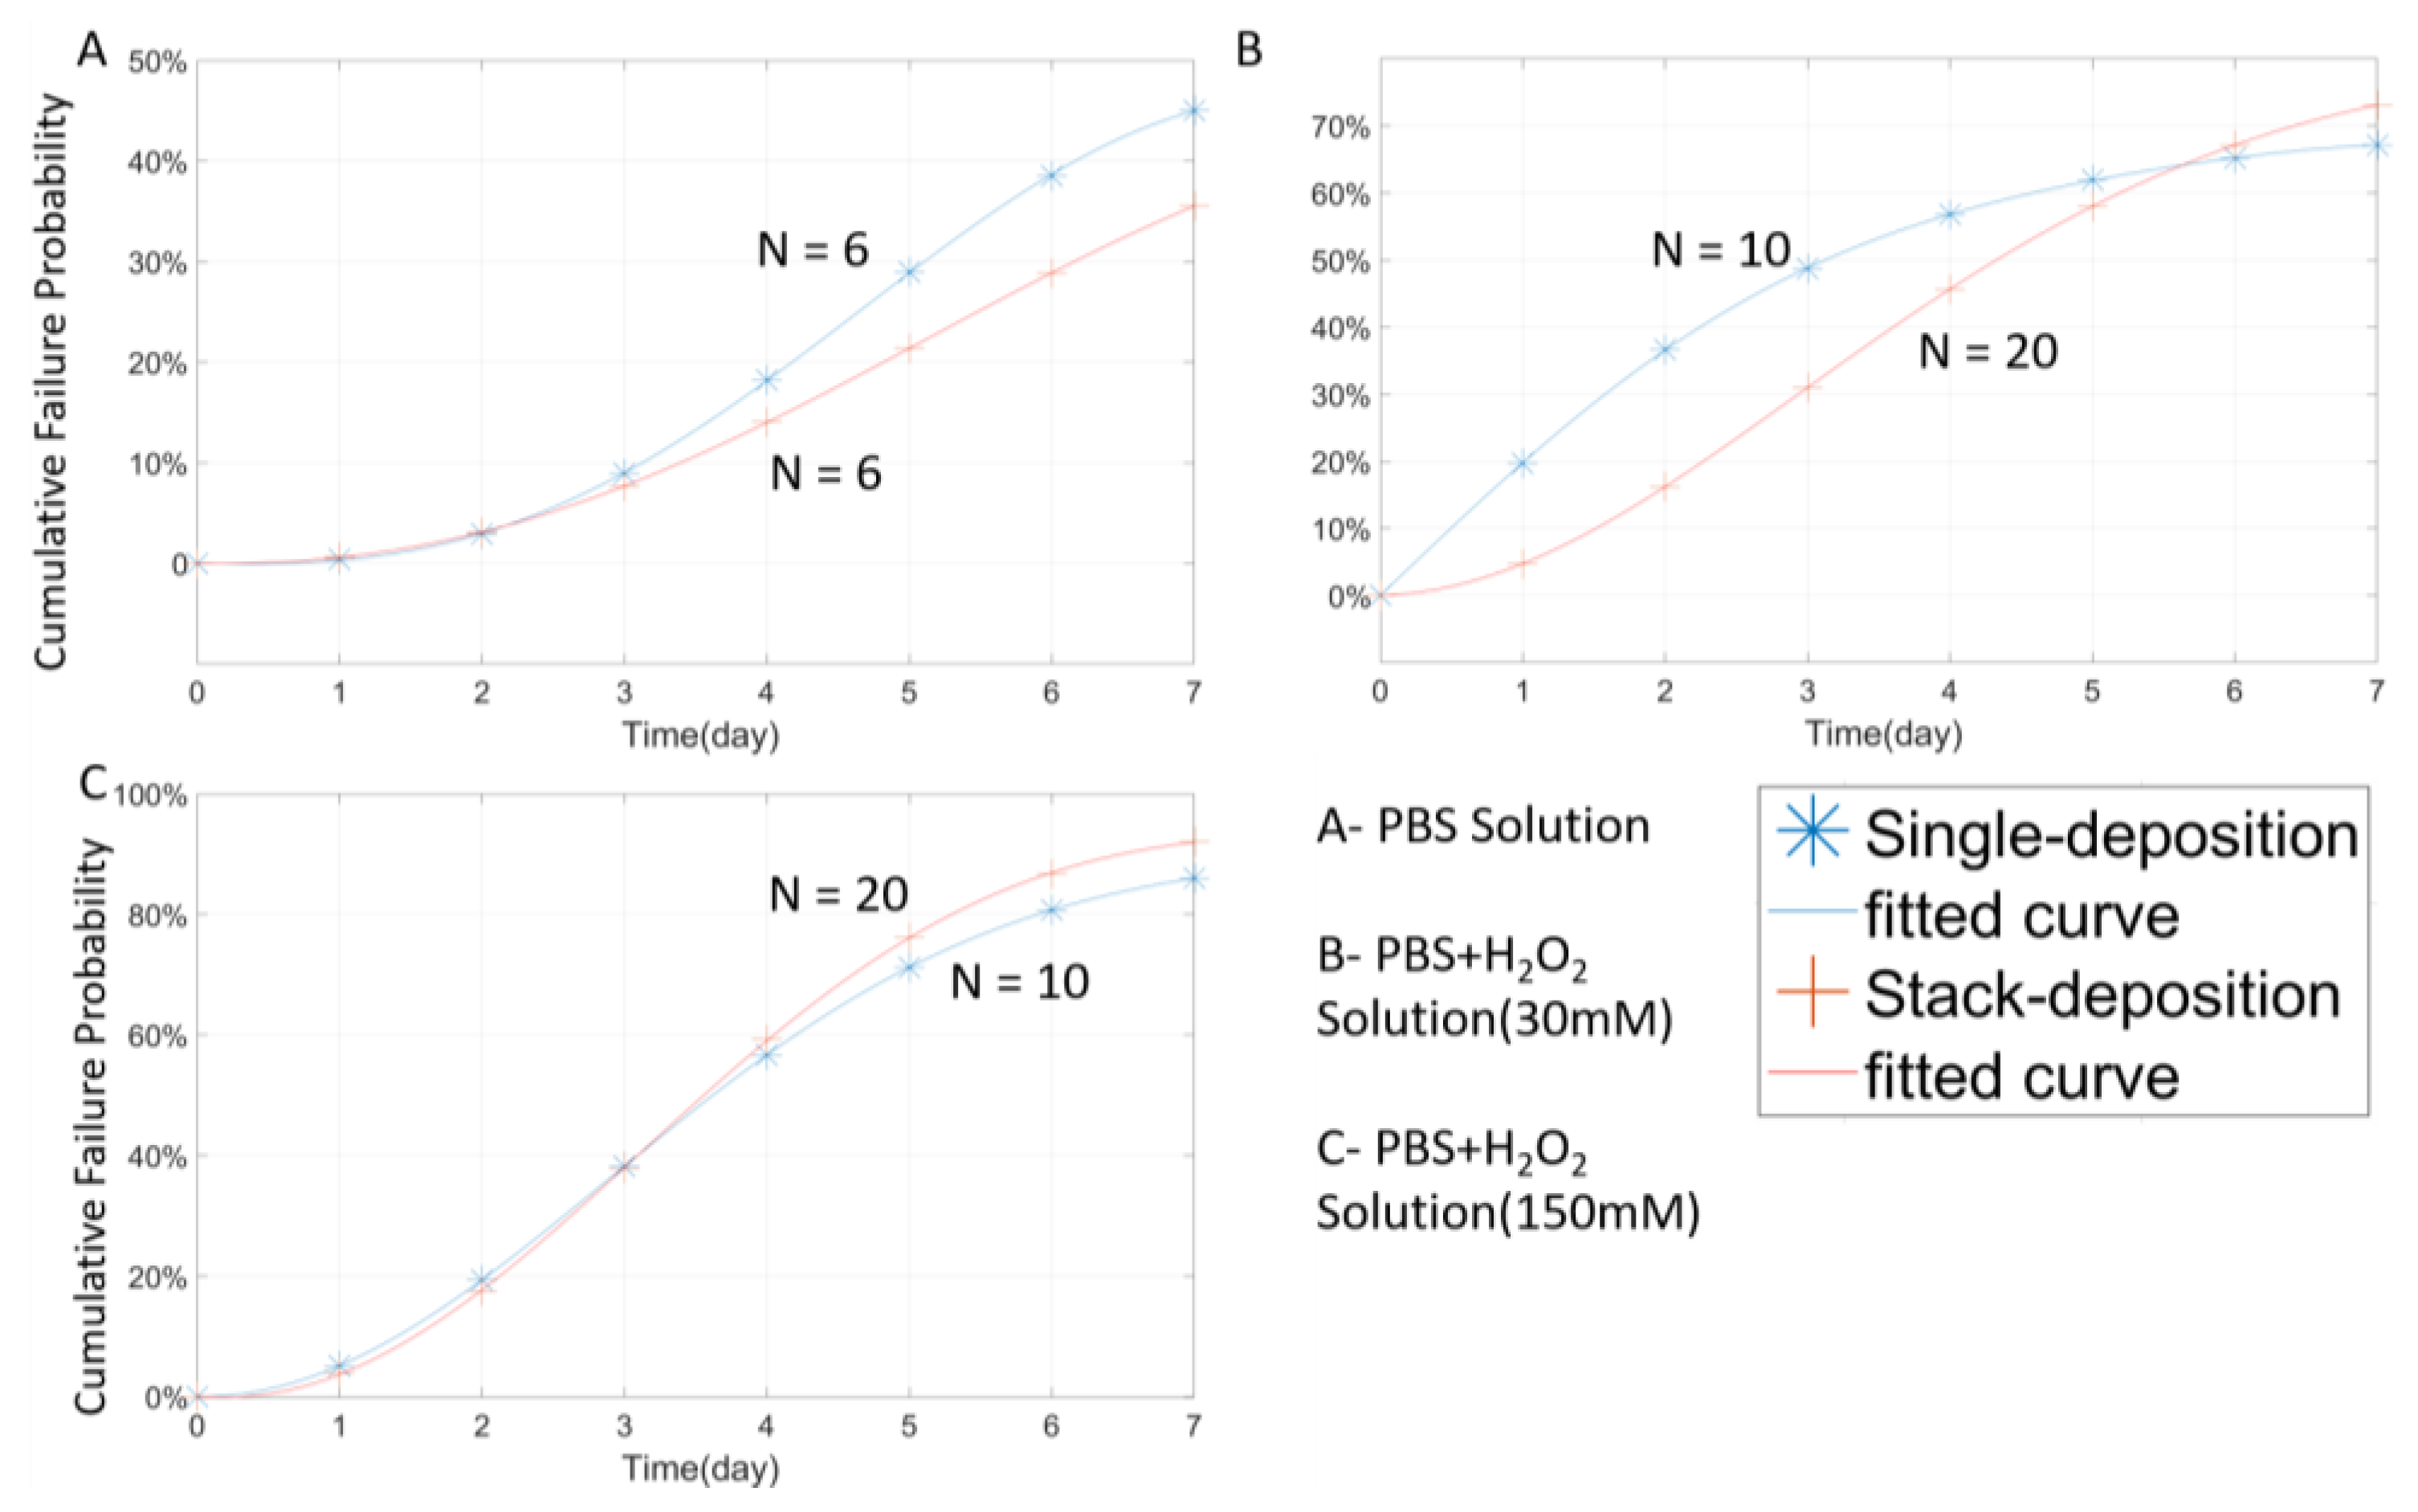
3.4. Multilayer Stack Strategy and Thickness Effect
4. Discussion
4.1. PA Coating and Thickness Effect
4.2. Non-Organic Coating and PECVD
4.3. Evaluation of Failure
5. Conclusions
Author Contributions
Funding
Acknowledgments
Conflicts of Interest
References
- Bootin, M.L. Deep brain stimulation: Overview and update. J. Clin. Monit. Comput. 2006, 20, 341–346. [Google Scholar]
- Hierold, C.; Clasbrumme, B.; Behrend, D.; Scheiter, T.; Steger, M.; Oppermann, K.; Kapels, H.; Landgraf, E.; Wenzel, D.; Etuodt, D.; et al. Implantable low power integrated pressure sensor system for minimal invasive telemetric patient monitoring. In Proceedings of the MEMS 98. IEEE. Eleventh Annual International Workshop on Micro Electro Mechanical Systems. An Investigation of Micro Structures, Sensors, Actuators, Machines and Systems (Cat. No. 98CH36176), Heidelberg, Germany, 25–29 January 1998. [Google Scholar]
- Guiraud, D.; Stieglitz, T.; Koch, K.P.; Divoux, J.-L.; Rabischong, P. An implantable neuroprosthesis for standing and walking in paraplegia: 5-year patient follow-up. J. Neural Eng. 2006, 3, 268. [Google Scholar]
- Chappuis, V.; Buser, R.; Bragger, U.; Bornstein, M.M.; Salvi, G.E.; Buser, D. Long-term outcomes of dental implants with a titanium plasma-sprayed surface: A 20-year prospective case series study in partially edentulous patients. Clin. Implant. Dent. Relat. Res. 2013, 15, 780–790. [Google Scholar]
- Takmakov, P.; Ruda, K.; Phillips, K.S.; Isayeva, I.S.; Krauthamer, V.; Welle, C.G. Rapid evaluation of the durability of cortical neural implants using accelerated aging with reactive oxygen species. J. Neural Eng. 2015, 12, 026003. [Google Scholar]
- Street, M.G.; Welle, C.G.; Takmakov, P. Automated reactive accelerated aging for rapid in vitro evaluation of neural implant performance. Rev. Sci. Instrum. 2018, 89, 094301. [Google Scholar]
- Kotzar, G.; Freas, M.; Abel, P.; Fleischman, A.; Roy, S.; Zorman, C.A.; Moran, J.M.; Melzak, J. Evaluation of MEMS materials of construction for implantable medical devices. Biomaterials 2002, 23, 2737–2750. [Google Scholar]
- Onuki, Y.; Bhardwaj, U.; Papadimitrakopoulos, F.; Burgess, D.J. A review of the biocompatibility of implantable devices: Current challenges to overcome foreign body response. J. Diabetes Sci. Technol. 2008, 2, 1003–1015. [Google Scholar]
- Hassler, C.; Boretius, T.; Stieglitz, T. Polymers for neural implants. J. Polym. Sci. Part B Polym. Phys. 2011, 49, 18–33. [Google Scholar]
- Kim, B.J.; Meng, E. Review of polymer MEMS micromachining. J. Micromech. Microeng. 2015, 26, 013001. [Google Scholar]
- Scholten, K.; Meng, E. Materials for microfabricated implantable devices: A review. Lab Chip 2015, 15, 4256–4272. [Google Scholar]
- Patel, N.R.; Piyush, P.G. A review on biomaterials: Scope, applications & human anatomy significance. Int. J. Emerg. Technol. Adv. Eng. 2012, 2, 91–101. [Google Scholar]
- Fattahi, P.; Yang, G.; Kim, G.; Abidian, M.R. A review of organic and inorganic biomaterials for neural interfaces. Adv. Mater. 2014, 26, 1846–1885. [Google Scholar]
- Hogg, A.; Uhl, S.; Feuvrier, F.; Girardet, Y.; Graf, B.; Aellen, T.; Keppner, H.; Tardy, Y.; Burger, J. Protective multilayer packaging for long-term implantable medical devices. Surf. Coat. Technol. 2014, 225, 124–129. [Google Scholar]
- Zhao, S.; Feng, Y.; Xiong, S.; Peng, B.; Sun, B.; Wu, T.; Yang, C. Biocompatible organic/inorganic composite film packaging for implantable retinal prosthesis. In Proceedings of the 2018 IEEE 13th Annual International Conference on Nano/Micro Engineered and Molecular Systems (NEMS), Grand Hyatt, Singapore, 22–26 April 2018. [Google Scholar]
- Caldwell, R.; Street, M.G.; Sharma, R.; Takmakov, P.; Baker, B.; Rieth, L. Characterization of Parylene-C degradation mechanisms: In vitro reactive accelerated aging model compared to multiyear in vivo implantation. Biomaterials 2020, 232, 119731. [Google Scholar]
- Kang, N.; Standley, A.; Chang, J.H.-C.; Liu, Y.; Tai, Y.-C. Effects of deposition temperature on Parylene-C properties. In Proceedings of the 2013 IEEE 26th International Conference on Micro Electro Mechanical Systems (MEMS), Taipei, Taiwan, 20–24 January 2013. [Google Scholar]
- Hassler, C.; Von Metzen, R.P.; Ruther, P.; Stieglitz, T. Characterization of parylene C as an encapsulation material for implanted neural prostheses. J. Biomed. Mater. Res. Part B Appl. Biomater. 2010, 93, 266–274. [Google Scholar]
- Lee, S.; Kanno, S.; Kino, H.; Tanaka, T. Study of insertion characteristics of Si neural probe with sharpened tip for minimally invasive insertion to brain. Jpn. J. Appl. Phys. 2013, 52, 04CL04. [Google Scholar]
- Cheng, M.-Y.; Je, M.; Tan, K.L.; Tan, E.L.; Lim, R.; Yao, L.; Li, P.; Park, W.-T.; Phua, E.J.R.; Gan, C.L.; et al. A low-profile three-dimensional neural probe array using a silicon lead transfer structure. J. Micromech. Microeng. 2013, 23, 095013. [Google Scholar]
- Kanno, S.; Lee, S.-R.; Harashima, T.; Kuki, T.; Kino, H.; Mushiake, H.; Yao, H.; Tanaka, T. Multiple optical stimulation to neuron using Si opto-neural probe with multiple optical waveguides and metal-cover for optogenetics. In Proceedings of the 2013 35th Annual International Conference of the IEEE Engineering in Medicine and Biology Society (EMBC), Osaka, Japan, 3–7 July 2013. [Google Scholar]
- Herwik, S.; Kisban, S.; Aarts, A.A.; Seidl, K.; Girardeau, G.; Benchenane, K.; Zugaro, M.B.; Wiener, S.I.; Paul, O.; Neves, H.P.; et al. Fabrication technology for silicon-based microprobe arrays used in acute and sub-chronic neural recording. J. Micromech. Microeng. 2009, 19, 074008. [Google Scholar]
- Guo, K.; Pei, W.; Li, X.; Gui, Q.; Tang, R.; Liu, J.; Chen, H. Fabrication and characterization of implantable silicon neural probe with microfluidic channels. Sci. China Technol. Sci. 2012, 55, 1–5. [Google Scholar]
- Oh, S.J.; Song, J.K.; Kim, S.J. Neural interface with a silicon neural probe in the advancement of microtechnology. Biotechnol. Bioprocess Eng. 2003, 8, 252–256. [Google Scholar]
- Paik, S.-J.; Park, Y.; Cho, D. Roughened polysilicon for low impedance microelectrodes in neural probes. J. Micromech. Microeng. 2003, 13, 373. [Google Scholar]
- Jiang, G.; Zhou, D.D. Technology advances and challenges in hermetic packaging for implantable medical devices. In Implantable Neural Prostheses 2; Springer: Berlin/Heidelberg, Germany, 2009; pp. 27–61. [Google Scholar]
- Wasikiewicz, J.; Roohpour, N.; Vadgama, P. Packaging and coating materials for implantable devices. In Implantable Sensor Systems for Medical Applications; Elsevier: Amsterdam, The Netherlands, 2013; pp. 68–107. [Google Scholar]
- Vomero, M.; Castagnola, E.; Ordonez, J.; Carli, S.; Zucchini, E.; Maggiolini, E.; Gueli, C.; Goshi, N.; Ciarpella, F.; Cea, C.; et al. Incorporation of Silicon Carbide and Diamond-Like Carbon as Adhesion Promoters Improves In Vitro and In Vivo Stability of Thin-Film Glassy Carbon Electrocorticography Arrays. Adv. Biosyst. 2018, 2, 1700081. [Google Scholar]
- Fonseca, C.; Barbosa, M.A. Corrosion behaviour of titanium in biofluids containing H2O2 studied by electrochemical impedance spectroscopy. Corros. Sci. 2001, 43, 547–559. [Google Scholar]
- Hukins, D.W.L.; Mahomed, A.; Kukureka, S. Accelerated aging for testing polymeric biomaterials and medical devices. Med. Eng. Phys. 2008, 30, 1270–1274. [Google Scholar]
- Ceyssens, F.; Puers, R. Insulation lifetime improvement of polyimide thin film neural implants. J. Neural Eng. 2015, 12, 054001. [Google Scholar]
- Shamma-Donoghue, S.; May, G.; Cotter, N.; White, R.; Simmons, F. Thin-film multielectrode arrays for a cochlear prosthesis. IEEE Trans. Electron Devices 1982, 29, 136–144. [Google Scholar]
- Rubehn, B.; Stieglitz, T. In vitro evaluation of the long-term stability of polyimide as a material for neural implants. Biomaterials 2010, 31, 3449–3458. [Google Scholar]
- Boppart, S.A.; Wheeler, B.; Wallace, C. A flexible perforated microelectrode array for extended neural recordings. IEEE Trans. Biomed. Eng. 1992, 39, 37–42. [Google Scholar]
- Stieglitz, T.; Beutel, H.; Schuettler, M.; Meyer, J.-U. Micromachined, polyimide-based devices for flexible neural interfaces. Biomed. Microdevices 2000, 2, 283–294. [Google Scholar]
- Rubehn, B.; Bosman, C.A.; Oostenveld, R.; Fries, P.; Stieglitz, T. A MEMS-based flexible multichannel ECoG-electrode array. J. Neural Eng. 2009, 6, 036003. [Google Scholar]
- Lei, X.; Kane, S.; Cogan, S.; Lorach, H.; Galambos, L.; Huie, P.; Mathieson, K.; Kamins, T.; Harris, J.; Palanker, D. SiC protective coating for photovoltaic retinal prosthesis. J. Neural Eng. 2016, 13, 046016. [Google Scholar]
- Saddow, S.E.; Frewin, C.L.; Cespedes, F.A.; Gazziro, M.; Bernadin, E.; Thomas, S. SiC for biomedical applications. Mater. Sci. Forum 2016, 858, 1010–1014. [Google Scholar]
- Grill, A. Diamond-like carbon coatings as biocompatible materials—An overview. Diam. Relat. Mater. 2003, 12, 166–170. [Google Scholar]
- Roy, R.K.; Lee, K.-R. Biomedical applications of diamond-like carbon coatings: A review. J. Biomed. Mater. Res. Part B Appl. Biomater. 2007, 83, 72–84. [Google Scholar]
- Patrick, E.; Orazem, M.E.; Sanchez, J.C.; Nishida, T. Corrosion of tungsten microelectrodes used in neural recording applications. J. Neurosci. Methods 2011, 198, 158–171. [Google Scholar]
- Emsley, J.E. The Elements, 2nd ed.; Oxford University Press: New York, NY, USA, 1991; ISBN 978-0-19-855569-8. [Google Scholar]
- Murau, P.C. Dissolution of tungsten by hydrogen peroxide. Anal. Chem. 1961, 33, 1125–1126. [Google Scholar]
- Seo, J.; You, K.; Moon, J.; Kim, J.H.; Paik, U. Communication—Corrosion Behavior of Tungsten Metal Gate in the Presence of Hydrogen Peroxide at Acidic Medium. ECS J. Solid State Sci. Technol. 2017, 6, P169–P171. [Google Scholar]
- Badwey, J.A.; Karnovsky, M.L. Active oxygen species and the functions of phagocytic leukocytes. Annu. Rev. Biochem. 1980, 49, 695–726. [Google Scholar]
- Halliwell, B. Reactive oxygen species and the central nervous system. J. Neurochem. 1992, 59, 1609–1623. [Google Scholar]
- Freinbichler, W.; Colivicchi, M.A.; Stefanini, C.; Bianchi, L.; Ballini, C.; Misini, B.; Weinberger, P.; Linert, W.; Varešlija, D.; Tipton, K.F.; et al. Highly reactive oxygen species: Detection, formation, and possible functions. Cell. Mol. Life Sci. 2011, 68, 2067–2079. [Google Scholar]
- Minnikanti, S.; Diao, G.; Pancrazio, J.J.; Xie, X.; Rieth, L.; Solzbacher, F.; Peixoto, N. Lifetime assessment of atomic-layer-deposited Al2O3–Parylene C bilayer coating for neural interfaces using accelerated age testing and electrochemical characterization. Acta Biomater. 2014, 10, 960–967. [Google Scholar]
- Eisenberg, G. Colorimetric determination of hydrogen peroxide. Ind. Eng. Chem. Anal. Ed. 1943, 15, 327–328. [Google Scholar]
- Feilat, E.A.; Grzybowski, S.; Knight, P.; Doriott, L. Breakdown and aging behavior of composite insulation system under DC and AC high voltages. WSEAS Trans. Circuits Syst. 2005, 4, 780. [Google Scholar]
- Lamont, C.; Mazza, F.; Donaldson, N. A Bayesian Demonstration of Reliability for Encapsulated Implanted Electronics. In Proceedings of the 2019 9th International IEEE/EMBS Conference on Neural Engineering (NER), San Francisco, CA, USA, 20–23 March 2019; pp. 730–733. [Google Scholar] [CrossRef]
- Feilat, E.A.; Grzybowski, S.; Knight, P. Accelerated aging of high voltage encapsulated transformers for electronics applications. In Proceedings of the 6th International Conference on Properties and Applications of Dielectric Materials (Cat. No.00CH36347), Xi’an, China, 21–26 June 2000; Volume 1, pp. 209–212. [Google Scholar] [CrossRef]


| Material | Thickness (μm) | Type | Samples Number | Time (Days) | Temperature (°C) |
|---|---|---|---|---|---|
| SiO2 | 1 | Open-tip | 30 | 7 | 67 |
| Si3N4 | 1 | Open-tip | 30 | 7 | 67 |
| PA | 1 | Open-tip | 30 | 7 | 67 |
| SiO2 | 1 | Close-tip | 30 | 7 | 67 |
| Si3N4 | 1 | Close-tip | 30 | 7 | 67 |
| PA | 1 | Close-tip | 30 | 7 | 67 |
| SiO2 + PA | 1.1 | Open-tip | 30 | 7 | 67 |
| Si3N4 + PA | 1.1 | Open-tip | 30 | 7 | 67 |
| PA | 3 | Close-tip | 26 | 7 | 67 |
| PA | 3 | Close-tip | 9 | 7 | 22 |
| PA-S 1 | 3 | Close-tip | 46 | 7 | 67 |
| PA | 5 | Close-tip | 15 | 7 | 67 |
| PA | 5 | Open-tip | 15 | 7 | 67 |
| Material | Thickness (μm) | Type | Solution | 3-day 4 | 7-day 5 | AST 6 (Day) | AEST 7 (Day) | LST 8 (Day) | LEST 9 (Day) |
|---|---|---|---|---|---|---|---|---|---|
| PA | 1 | Open-tip | PBS | 10(100%) | 10(100%) | NA | NA | NA | NA |
| PA | 5 | Open-tip | PBS | 5(100%) | 5(100%) | NA | NA | NA | NA |
| PA | 1 | Open-tip | P + H(30) 2 | 0(0%) | 0(0%) | <1.7 | <13.6 | <2 | <16 |
| PA | 5 | Open-tip | P + H(30) | 0(0%) | 0(0%) | <1 | <8 | <1 | <8 |
| PA | 1 | Open-tip | P + H(150) 3 | 0(0%) | 0(0%) | <1 | <8 | <1 | <8 |
| PA | 5 | Open-tip | P + H(150) | 0(0%) | 0(0%) | <1 | <8 | <1 | <8 |
| PA | 1 | Close-tip | PBS | 7(70%) | 6(60%) | <2 | <16 | <4 | <32 |
| PA | 3 | Close-tip | PBS | 5(83%) | 3(50%) | <4.6666 | <37.333 | <6 | <48 |
| PA-S 1 | 3 | Close-tip | PBS | 5(83%) | 4(66%) | <4.5 | <36 | <2 | <16 |
| PA | 5 | Close-tip | PBS | 5(100%) | 5(100%) | NA | NA | NA | NA |
| PA | 1 | Close-tip | P + H(30) | 7(70%) | 3(30%) | <3.833 | <30.6667 | <7 | <56 |
| PA | 3 | Close-tip | P + H(30) | 5(50%) | 3(30%) | <2.42 | <19.42 | <6 | <48 |
| PA-S | 3 | Close-tip | P + H(30) | 12(60%) | 4(20%) | 3.875 | 31 | <6 | <48 |
| PA | 5 | Close-tip | P + H(30) | 5(100%) | 5(100%) | NA | NA | NA | NA |
| PA | 1 | Close-tip | P + H(150) | 2(20%) | 0(0%) | <2.1 | <16.8 | <4 | <32 |
| PA | 3 | Close-tip | P + H(150) | 6(60%) | 1(10%) | <3.5555 | <28.444 | <6 | <48 |
| PA-S | 3 | Close-tip | P + H(150) | 10(50%) | 1(5%) | 3.57 | 28 | <6 | <48 |
| PA | 5 | Close-tip | P + H(150) | 5(100%) | 5(100%) | NA | NA | NA | NA |
| Material | Thickness (μm) | Type | Solution | 3-day | 7-day | AST (Day) | AEST (Day) | LST (Day) | LEST (Day) |
|---|---|---|---|---|---|---|---|---|---|
| SiO2 | 1 | Open-tip | PBS | 1(10%) | 0(0%) | <1.3 | <10.4 | <4 | <32 |
| Si3N4 | 1 | Open-tip | PBS | 2(20%) | 2(20%) | <1 | <8 | <1 | <8 |
| PA | 1 | Open-tip | PBS | 10(100%) | 10(100%) | NA | NA | NA | NA |
| SiO2 | 1 | Open-tip | P + H (30) | 0(0%) | 0(0%) | <1 | <8 | <1 | <8 |
| Si3N4 | 1 | Open-tip | P + H (30) | 0(0%) | 0(0%) | <1 | <8 | <1 | <8 |
| PA | 1 | Open-tip | P + H (30) | 0(0%) | 0(0%) | <1.7 | <13.6 | <2 | <16 |
| SiO2 | 1 | Open-tip | P + H(150) | 0(0%) | 0(0%) | <1 | <8 | <1 | <8 |
| Si3N4 | 1 | Open-tip | P + H(150) | 0(0%) | 0(0%) | <1 | <8 | <1 | <8 |
| PA | 1 | Open-tip | P + H(150) | 0(0%) | 0(0%) | <1 | <8 | <1 | <8 |
| SiO2 | 1 | Close-tip | PBS | 0(0%) | 0(0%) | <1 | <8 | <1 | <8 |
| Si3N4 | 1 | Close-tip | PBS | 7(70%) | 4(40%) | <3 | <24 | <6 | <48 |
| PA | 1 | Close-tip | PBS | 7(70%) | 6(60%) | <2 | <16 | <4 | <32 |
| SiO2 | 1 | Close-tip | P + H (30) | 0(0%) | 0(0%) | <1 | <8 | <1 | <8 |
| Si3N4 | 1 | Close-tip | P + H (30) | 8(80%) | 2(20%) | <3.625 | <29 | <5 | >40 |
| PA | 1 | Close-tip | P + H (30) | 7(70%) | 3(30%) | <3.833 | <30.6667 | <7 | <56 |
| SiO2 | 1 | Close-tip | P + H(150) | 0(0%) | 0(0%) | <1 | <8 | <1 | <8 |
| Si3N4 | 1 | Close-tip | P + H(150) | 6(60%) | 2(20%) | <4 | <32 | <7 | <56 |
| PA | 1 | Close-tip | P + H(150) | 2(20%) | 0(0%) | <2.1 | <16.8 | <4 | <32 |
| SiO2 + PA | 1.1 | Open-tip | PBS | 0(0%) | 0(0%) | <1.2 | <9.6 | <3 | <24 |
| Si3N4 + PA | 1.1 | Open-tip | PBS | 4(20%) | 0(0%) | 2.8 | 22.4 | <7 | <56 |
| SiO2 + PA | 1.1 | Open-tip | P + H (30) | 0(0%) | 0(0%) | <1 | <8 | <1 | <8 |
| Si3N4 + PA | 1.1 | Open-tip | P + H (30) | 0(0%) | 0(0%) | <1 | <8 | <1 | <8 |
| SiO2 + PA | 1.1 | Open-tip | P + H(150) | 0(0%) | 0(0%) | <1 | <8 | <1 | <8 |
| Si3N4 + PA | 1.1 | Open-tip | P + H(150) | 0(0%) | 0(0%) | <1 | <8 | <1 | <8 |
© 2020 by the authors. Licensee MDPI, Basel, Switzerland. This article is an open access article distributed under the terms and conditions of the Creative Commons Attribution (CC BY) license (http://creativecommons.org/licenses/by/4.0/).
Share and Cite
Gong, Y.; Liu, W.; Wang, R.; Brauer, M.H.; Zheng, K.; Li, W. Stability Performance Analysis of Various Packaging Materials and Coating Strategies for Chronic Neural Implants under Accelerated, Reactive Aging Tests. Micromachines 2020, 11, 810. https://doi.org/10.3390/mi11090810
Gong Y, Liu W, Wang R, Brauer MH, Zheng K, Li W. Stability Performance Analysis of Various Packaging Materials and Coating Strategies for Chronic Neural Implants under Accelerated, Reactive Aging Tests. Micromachines. 2020; 11(9):810. https://doi.org/10.3390/mi11090810
Chicago/Turabian StyleGong, Yan, Wentai Liu, Runyu Wang, Matthew Harris Brauer, Kristine Zheng, and Wen Li. 2020. "Stability Performance Analysis of Various Packaging Materials and Coating Strategies for Chronic Neural Implants under Accelerated, Reactive Aging Tests" Micromachines 11, no. 9: 810. https://doi.org/10.3390/mi11090810
APA StyleGong, Y., Liu, W., Wang, R., Brauer, M. H., Zheng, K., & Li, W. (2020). Stability Performance Analysis of Various Packaging Materials and Coating Strategies for Chronic Neural Implants under Accelerated, Reactive Aging Tests. Micromachines, 11(9), 810. https://doi.org/10.3390/mi11090810