A High Temperature Drop-On-Demand Droplet Generator for Metallic Melts


Abstract

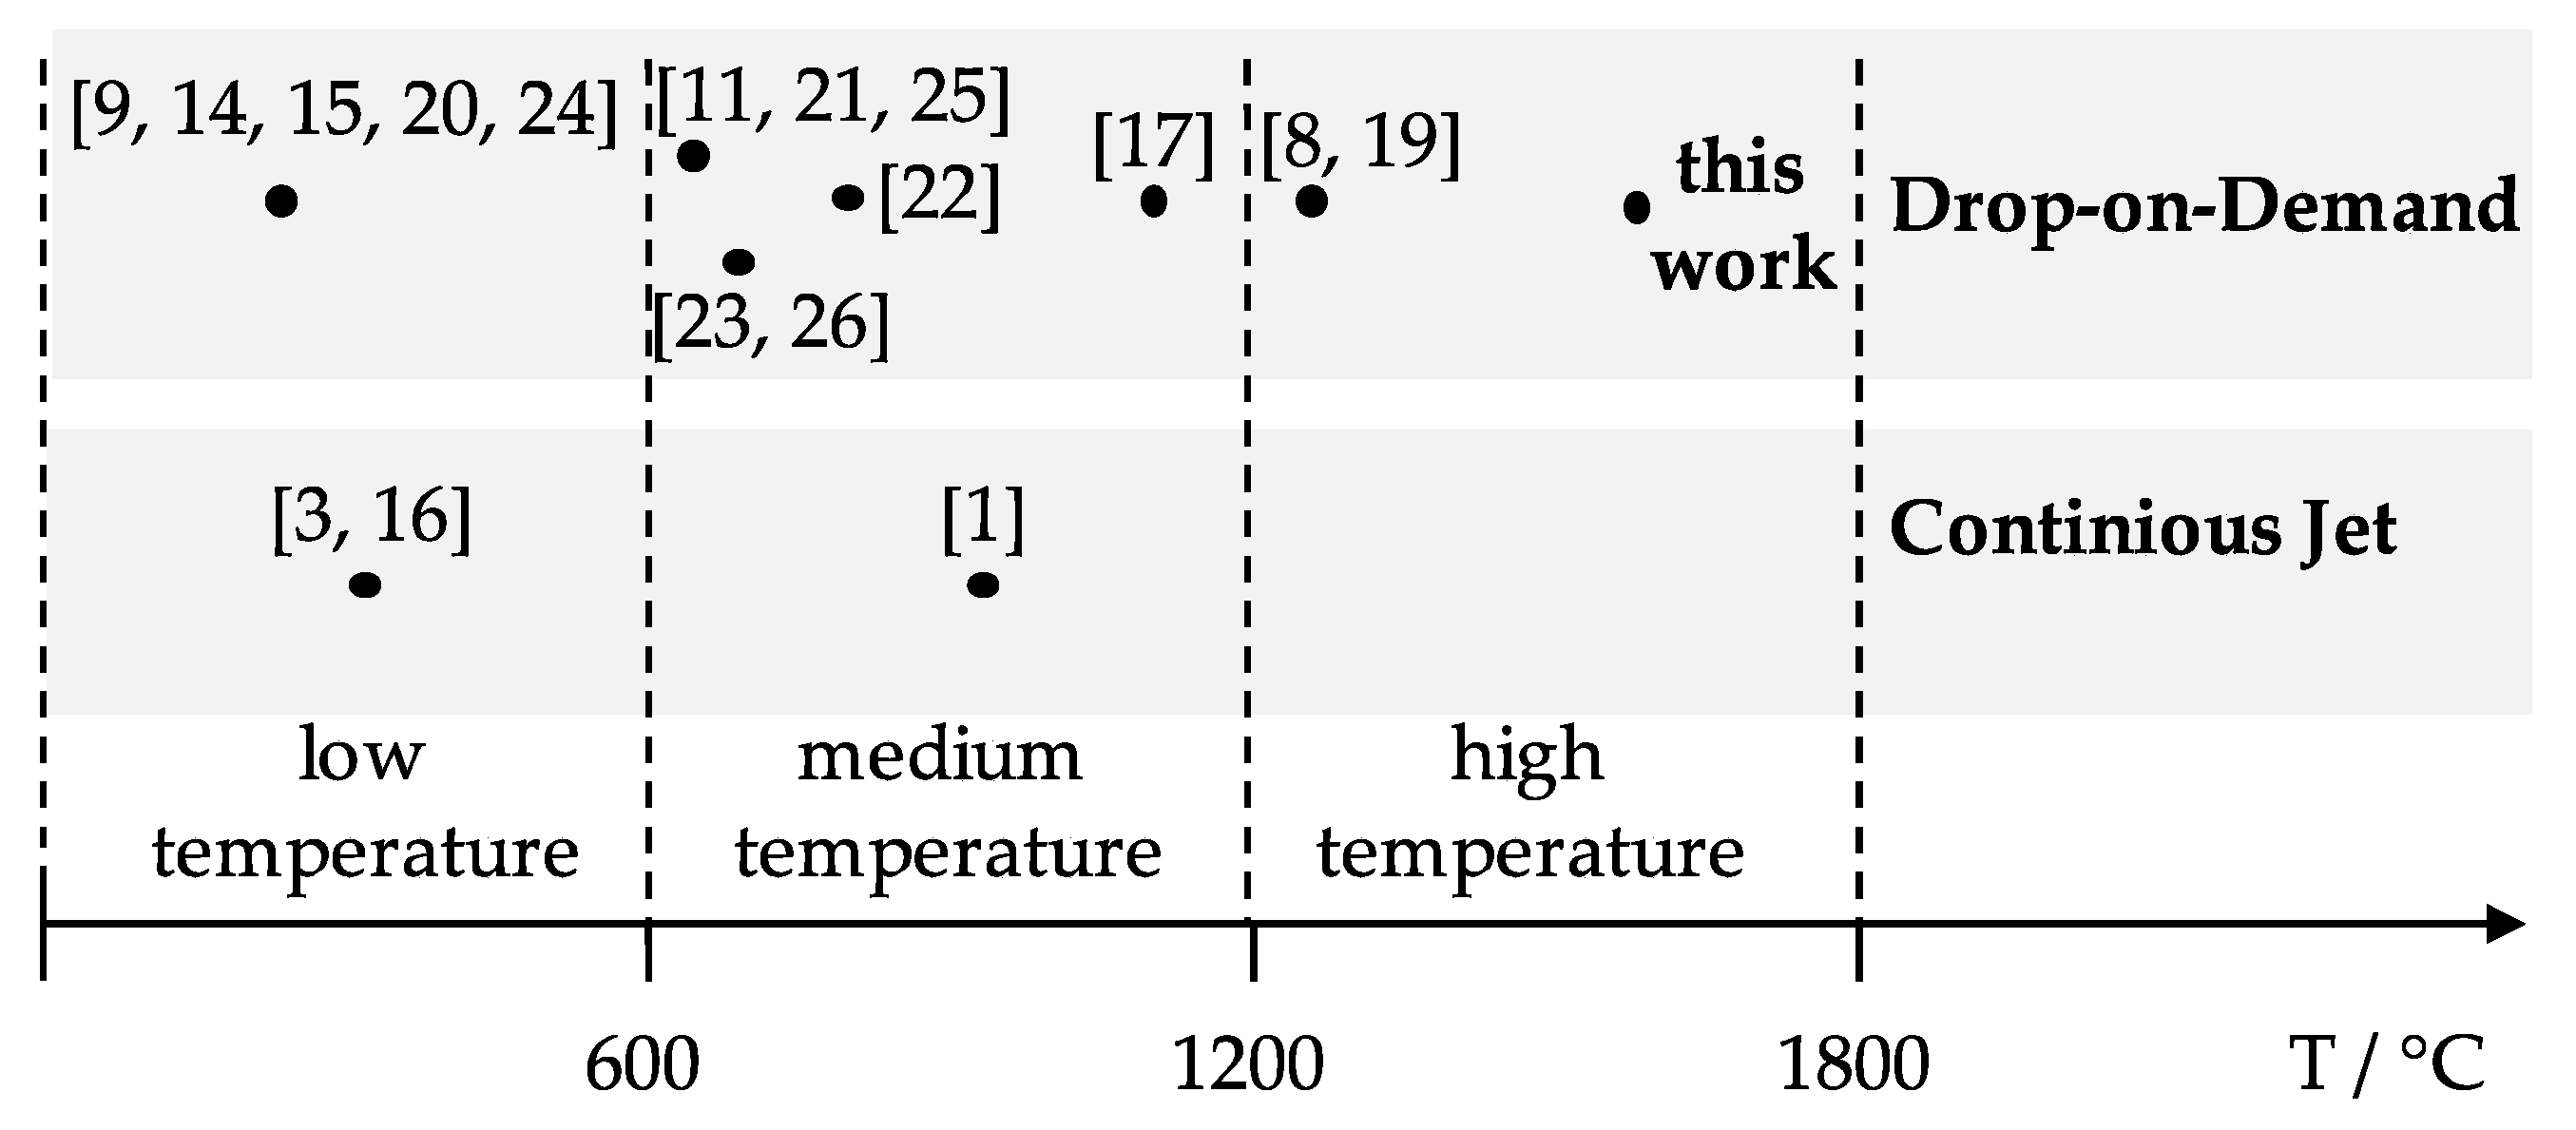
1. Introduction
2. Experiments
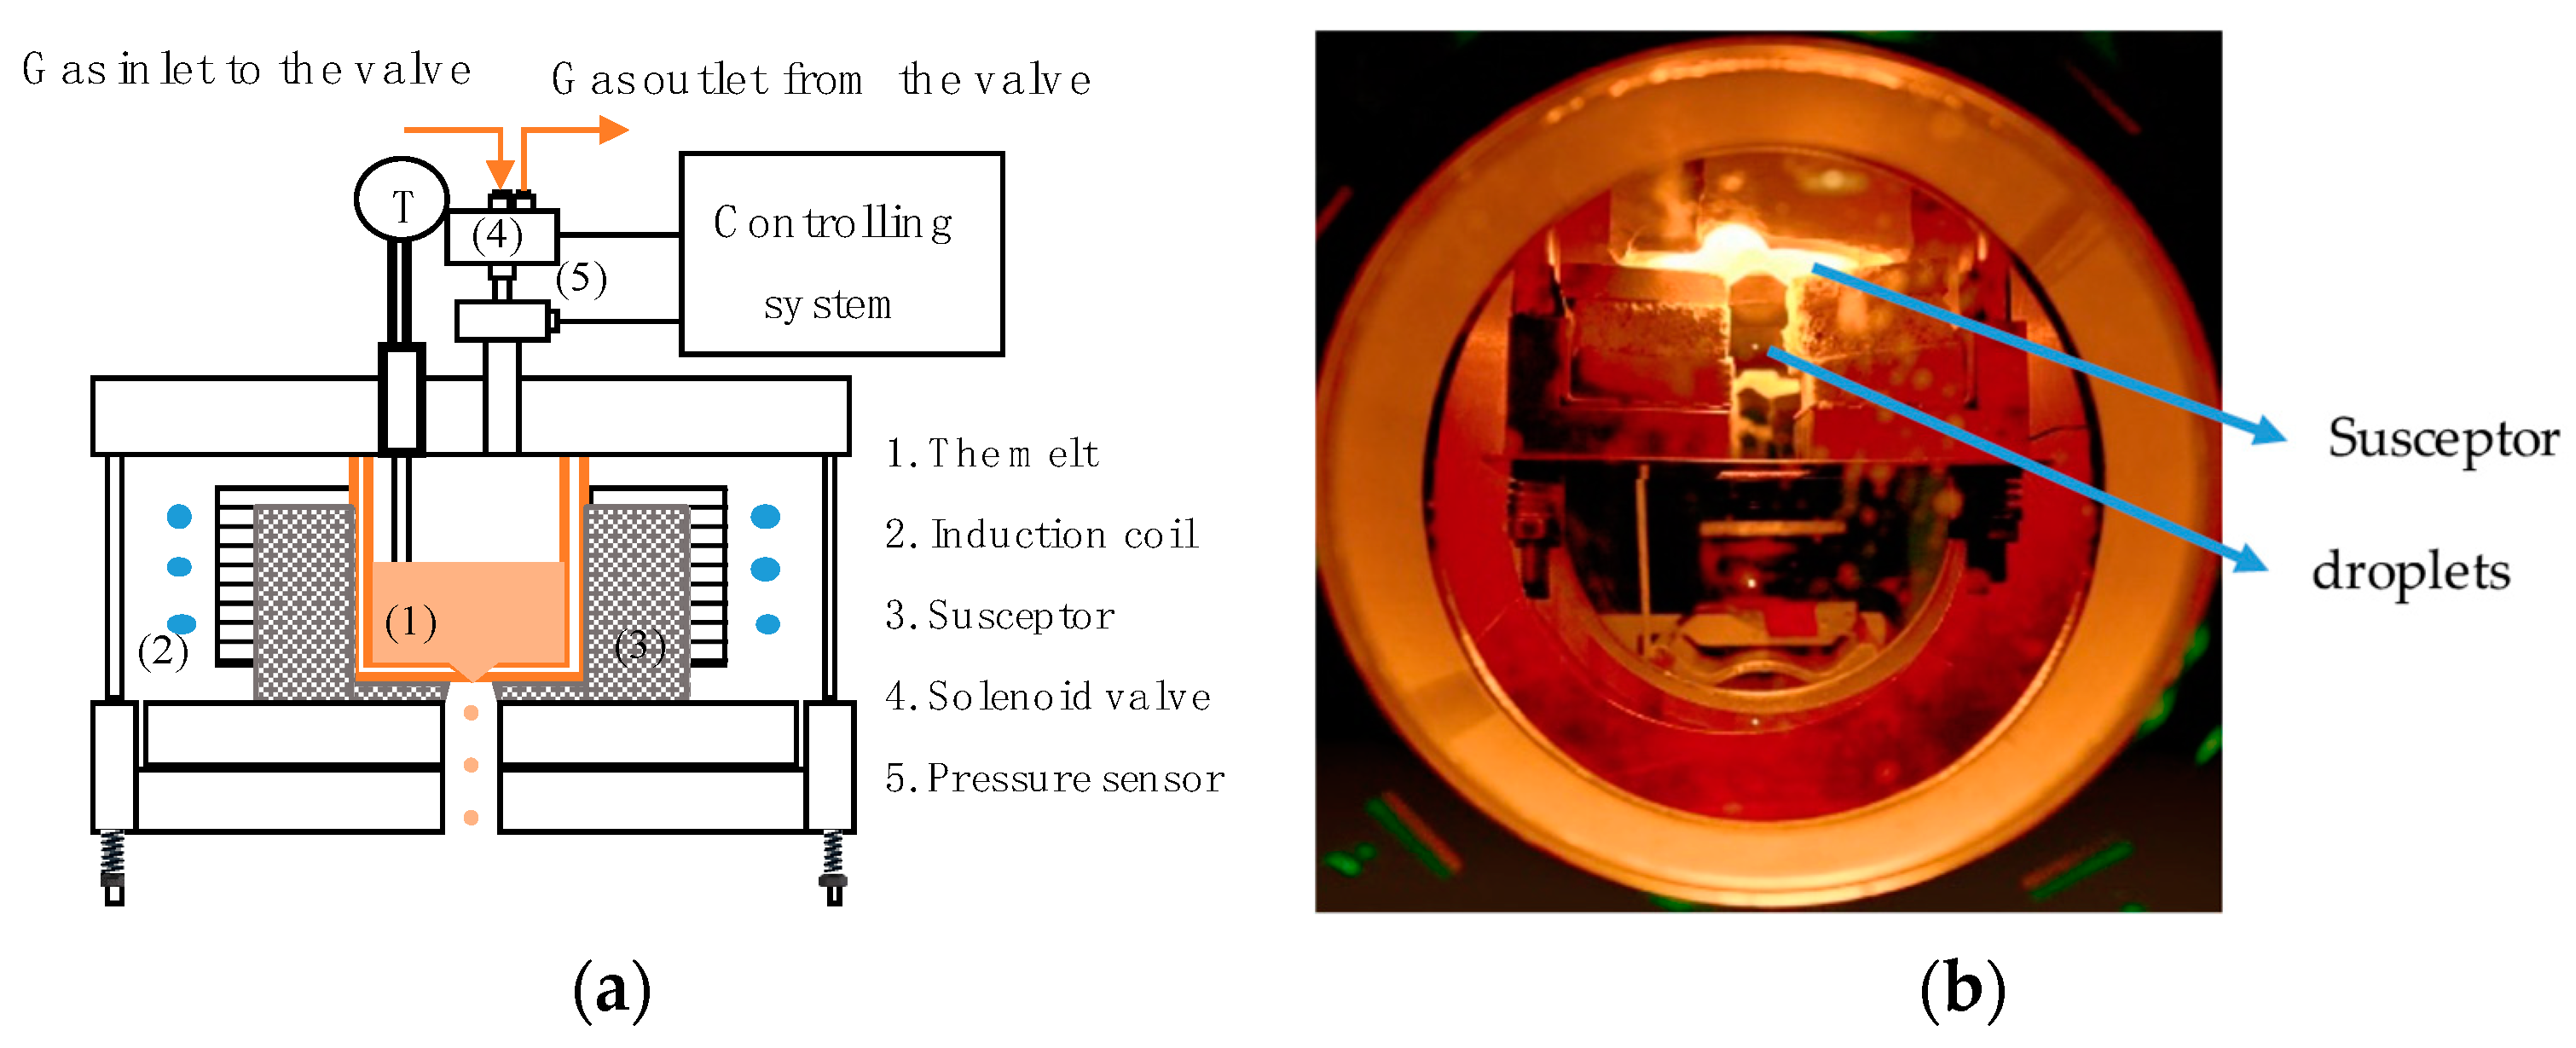
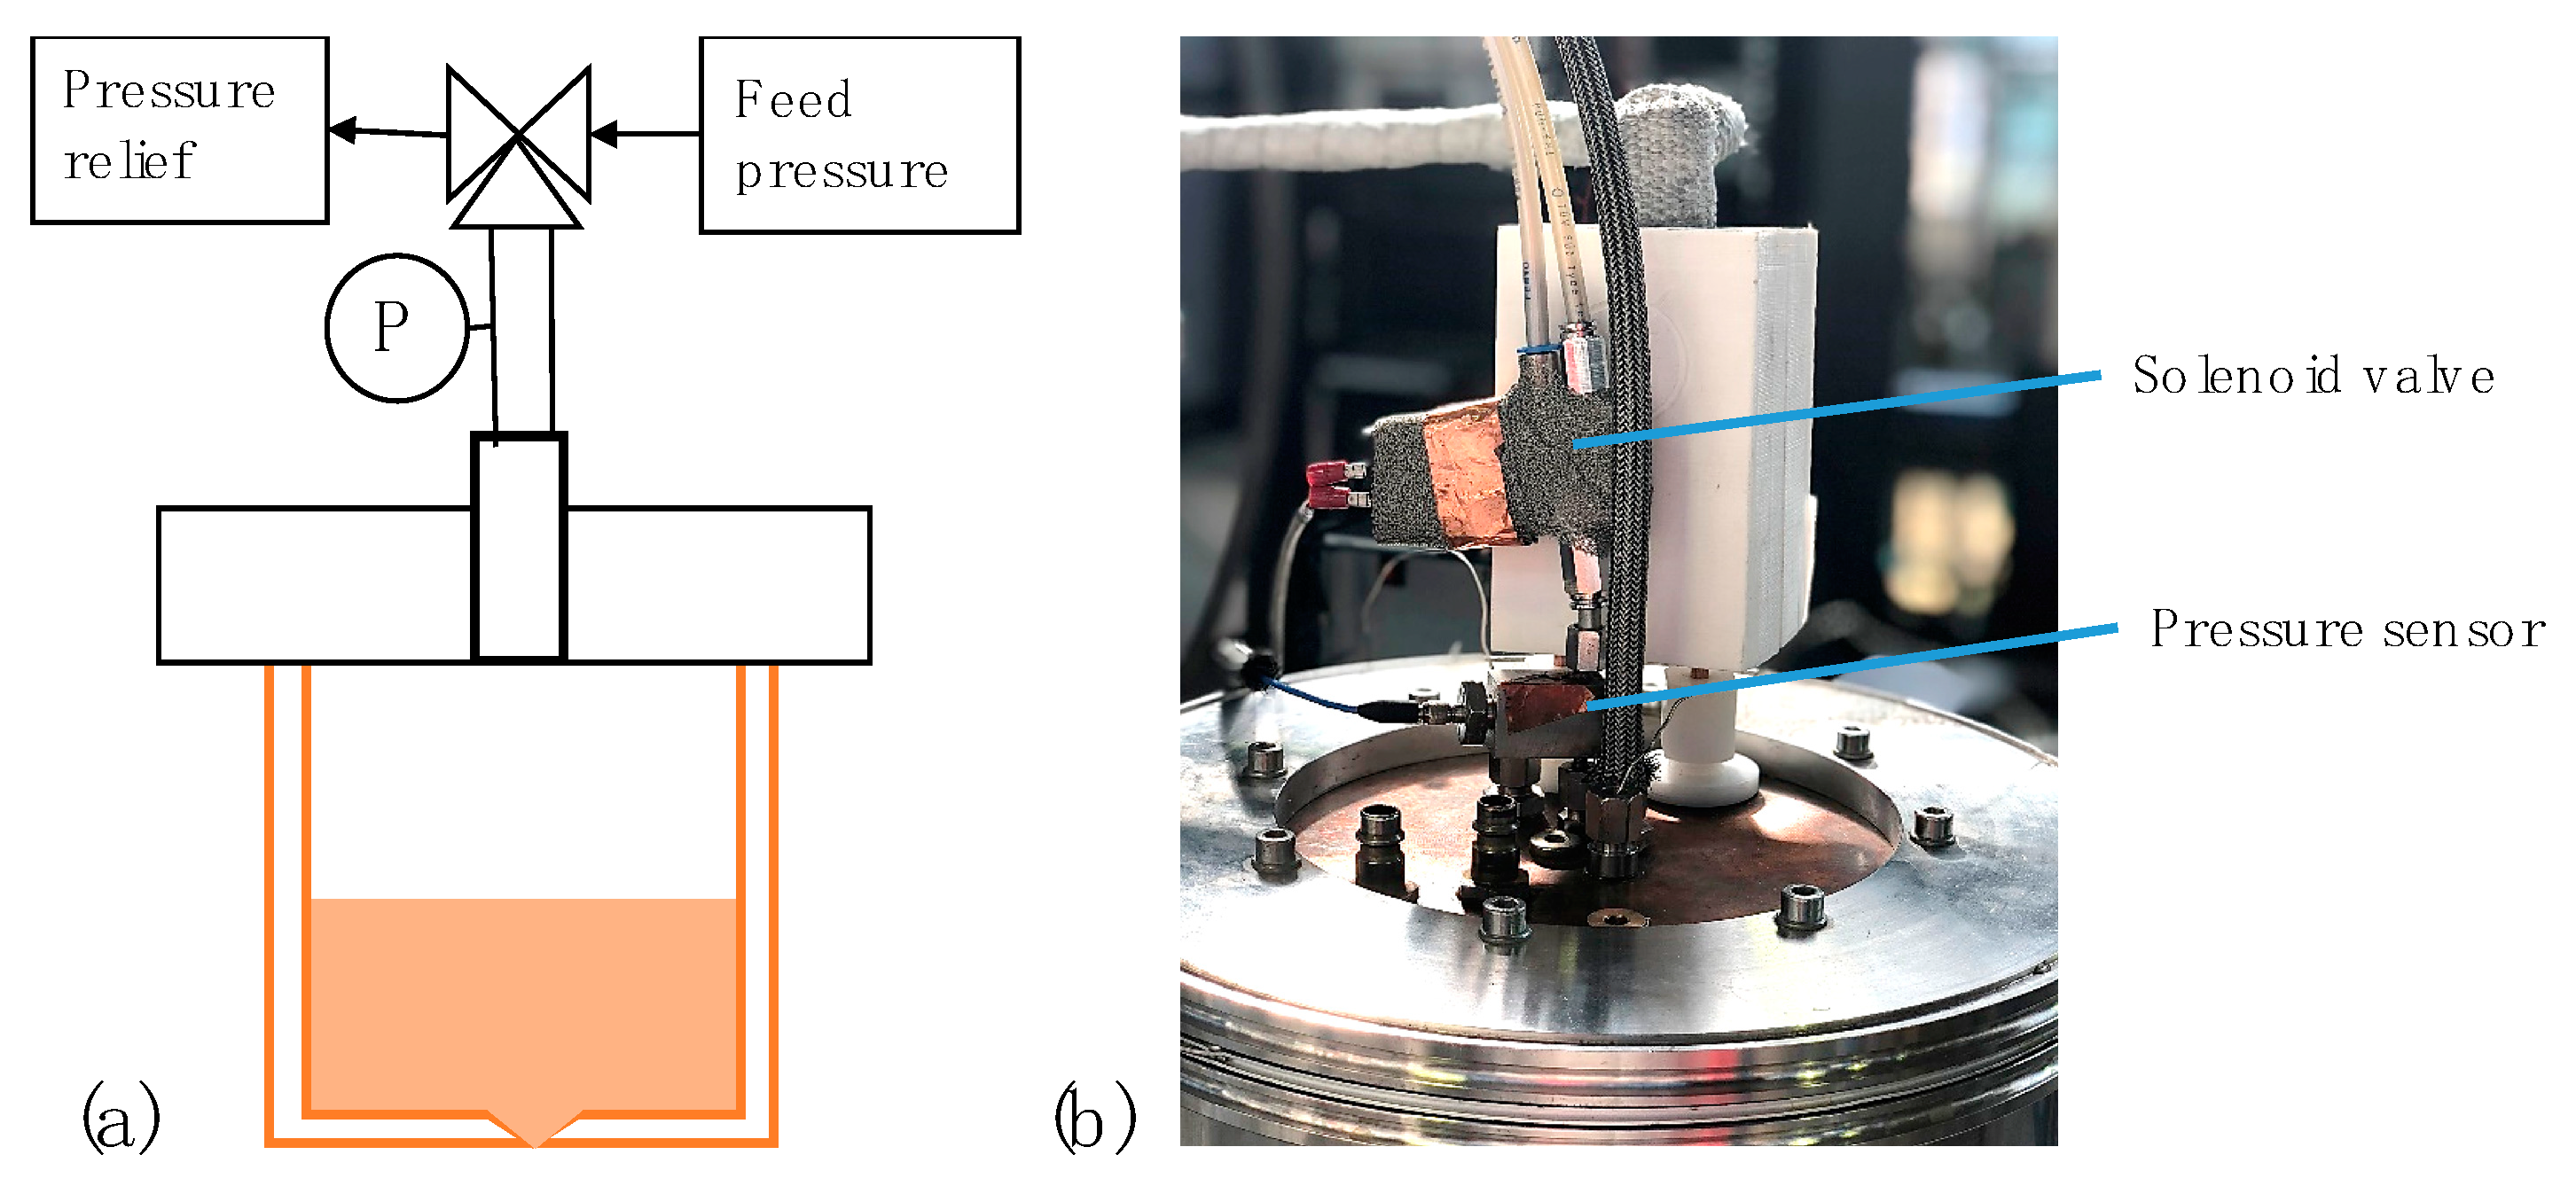
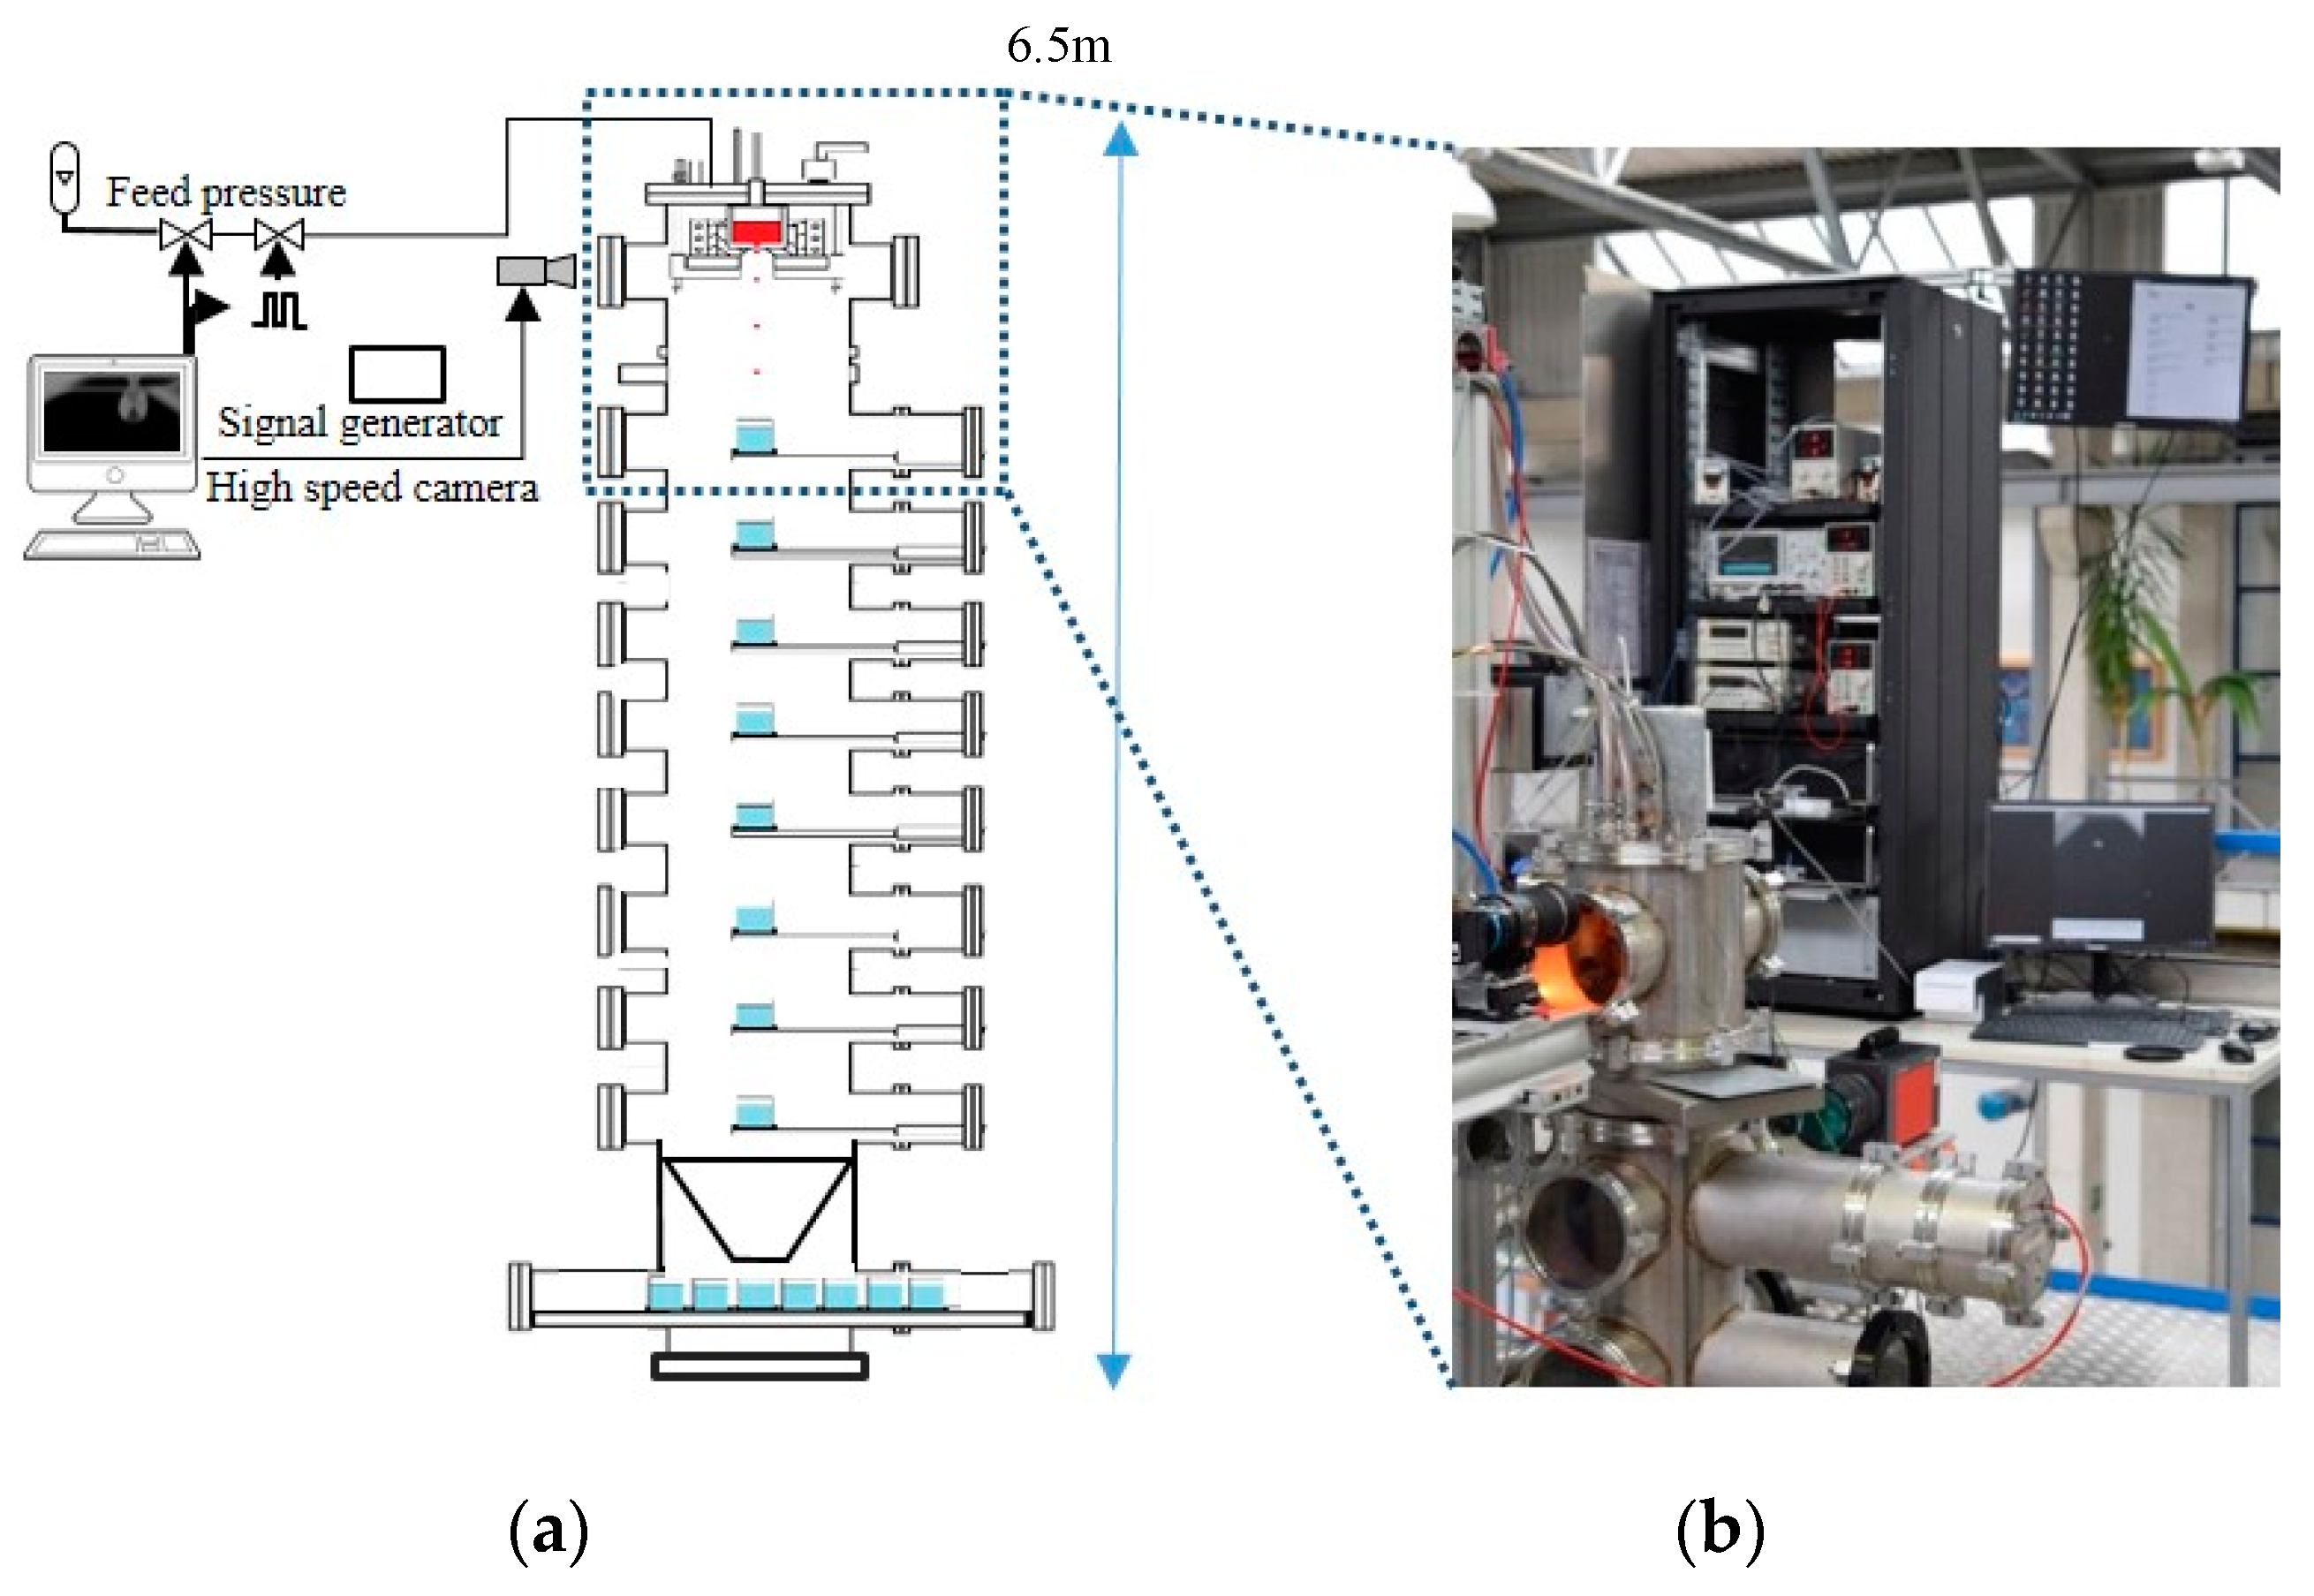
2.1. Experimental Setup
2.2. Experimental Parameters
3. Analyses
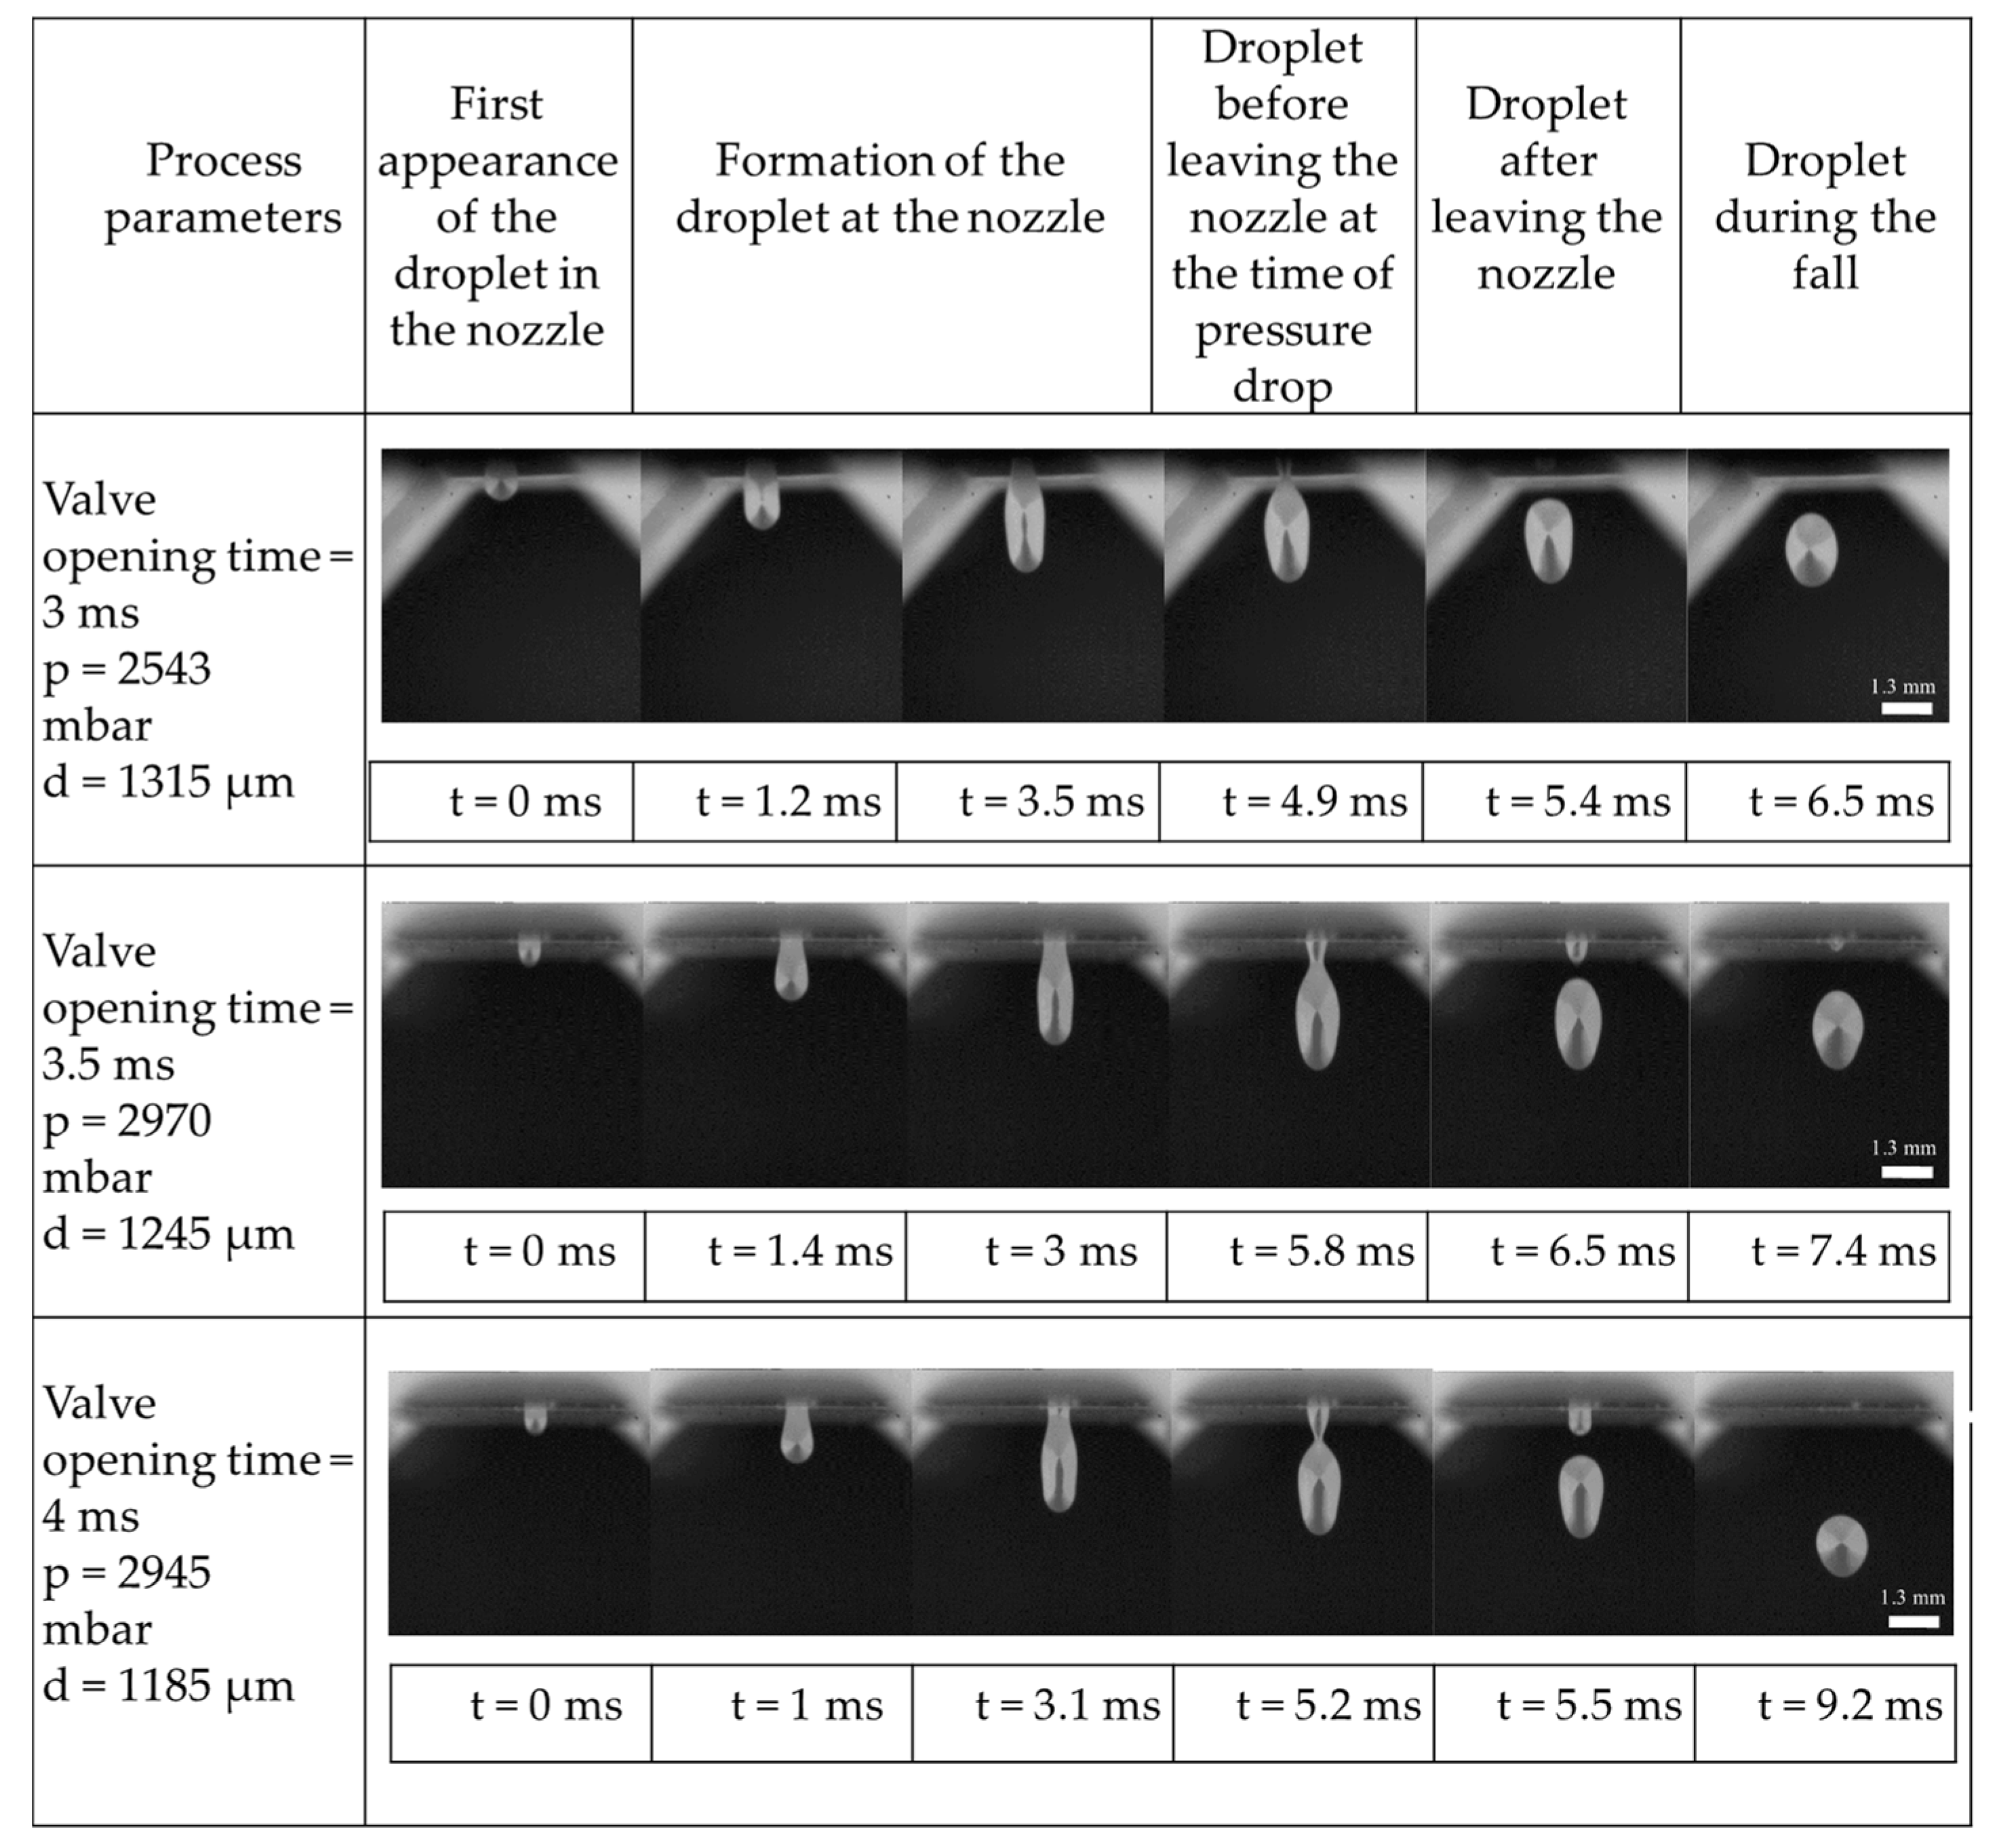
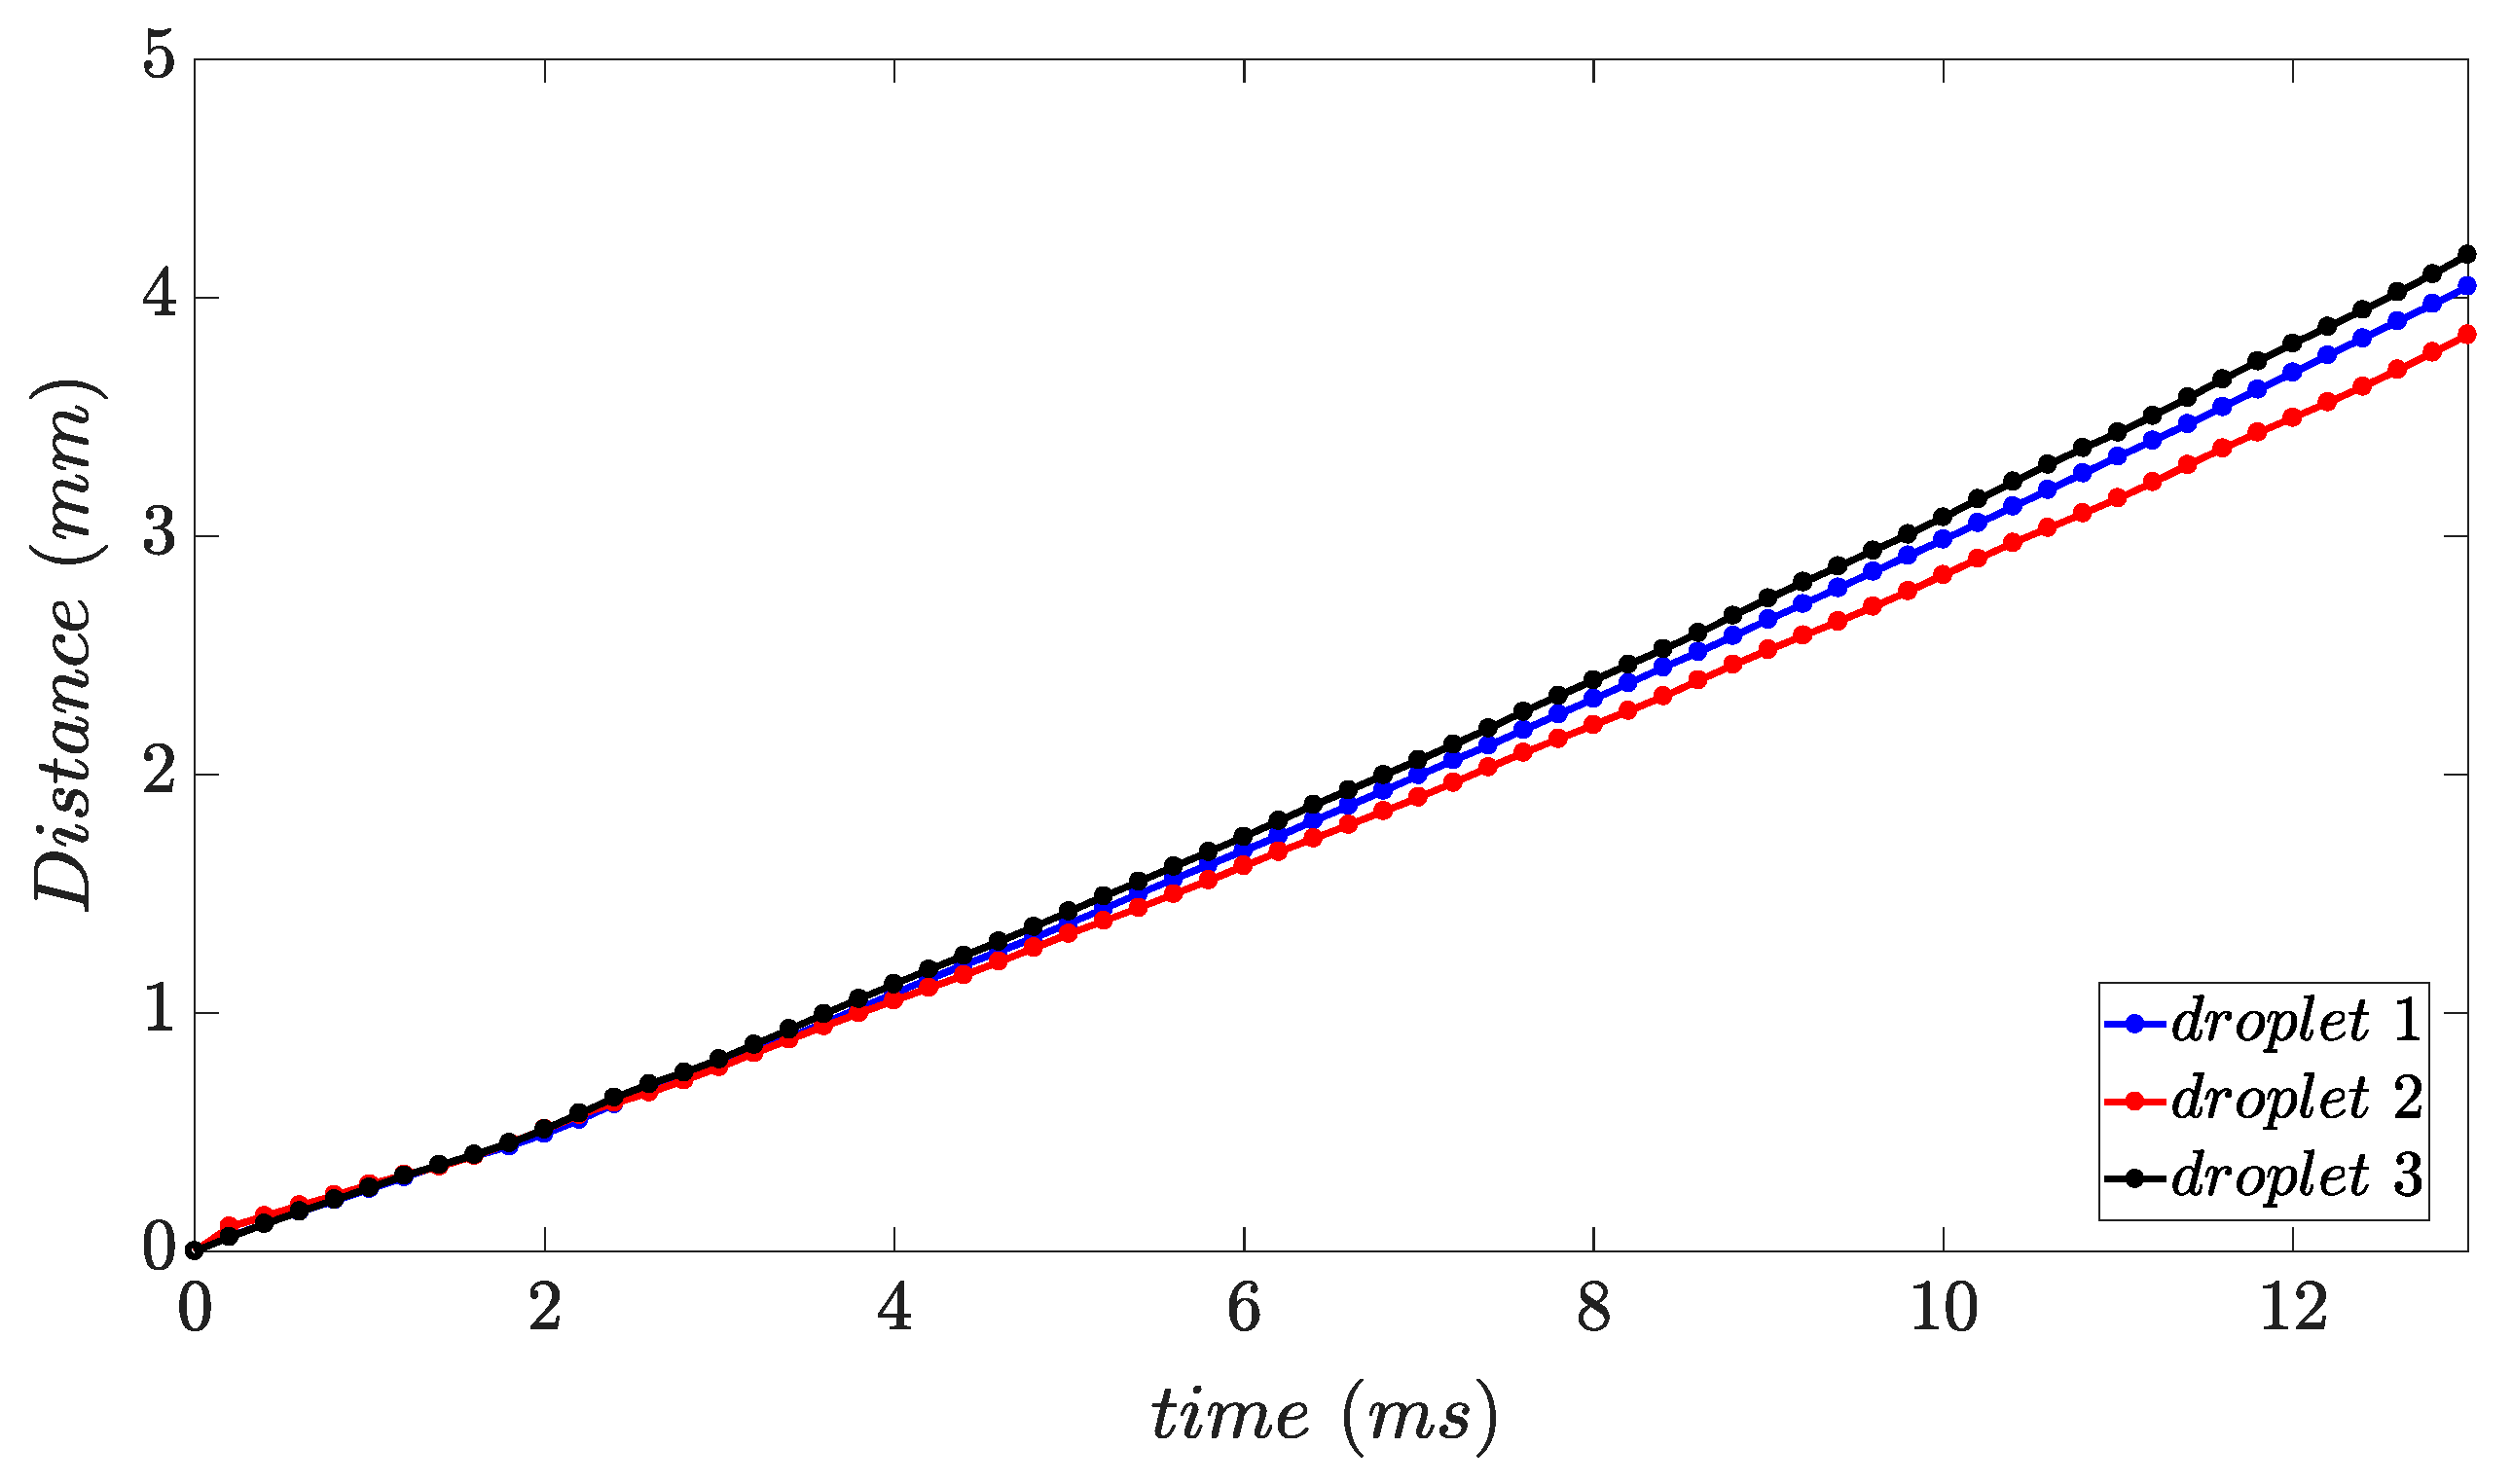
3.1. High-Speed Recording of Droplet Formation and Determination of Initial Velocity of the Droplets
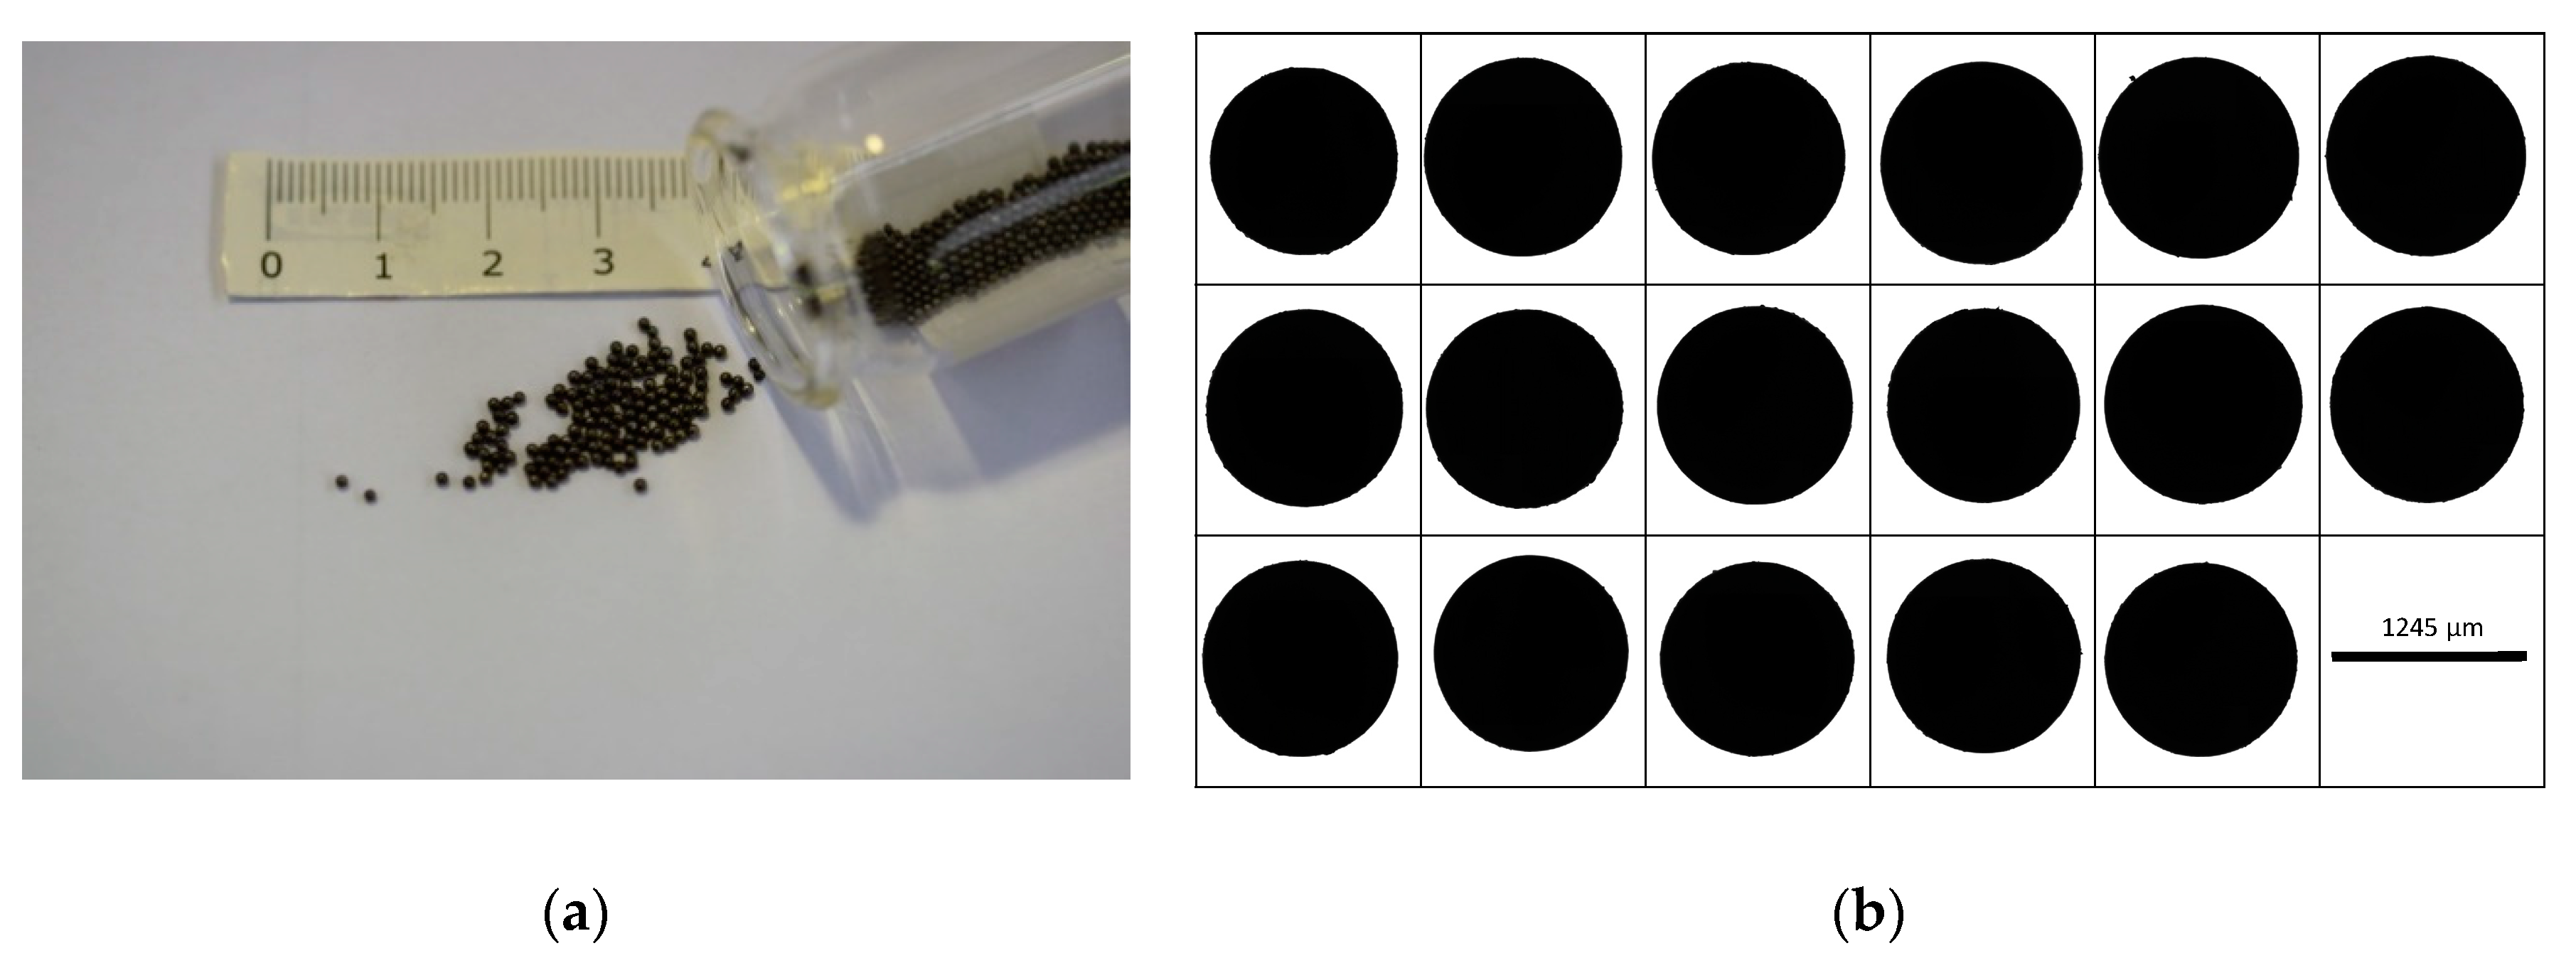
3.2. Static Image Analysis of Generated Particles
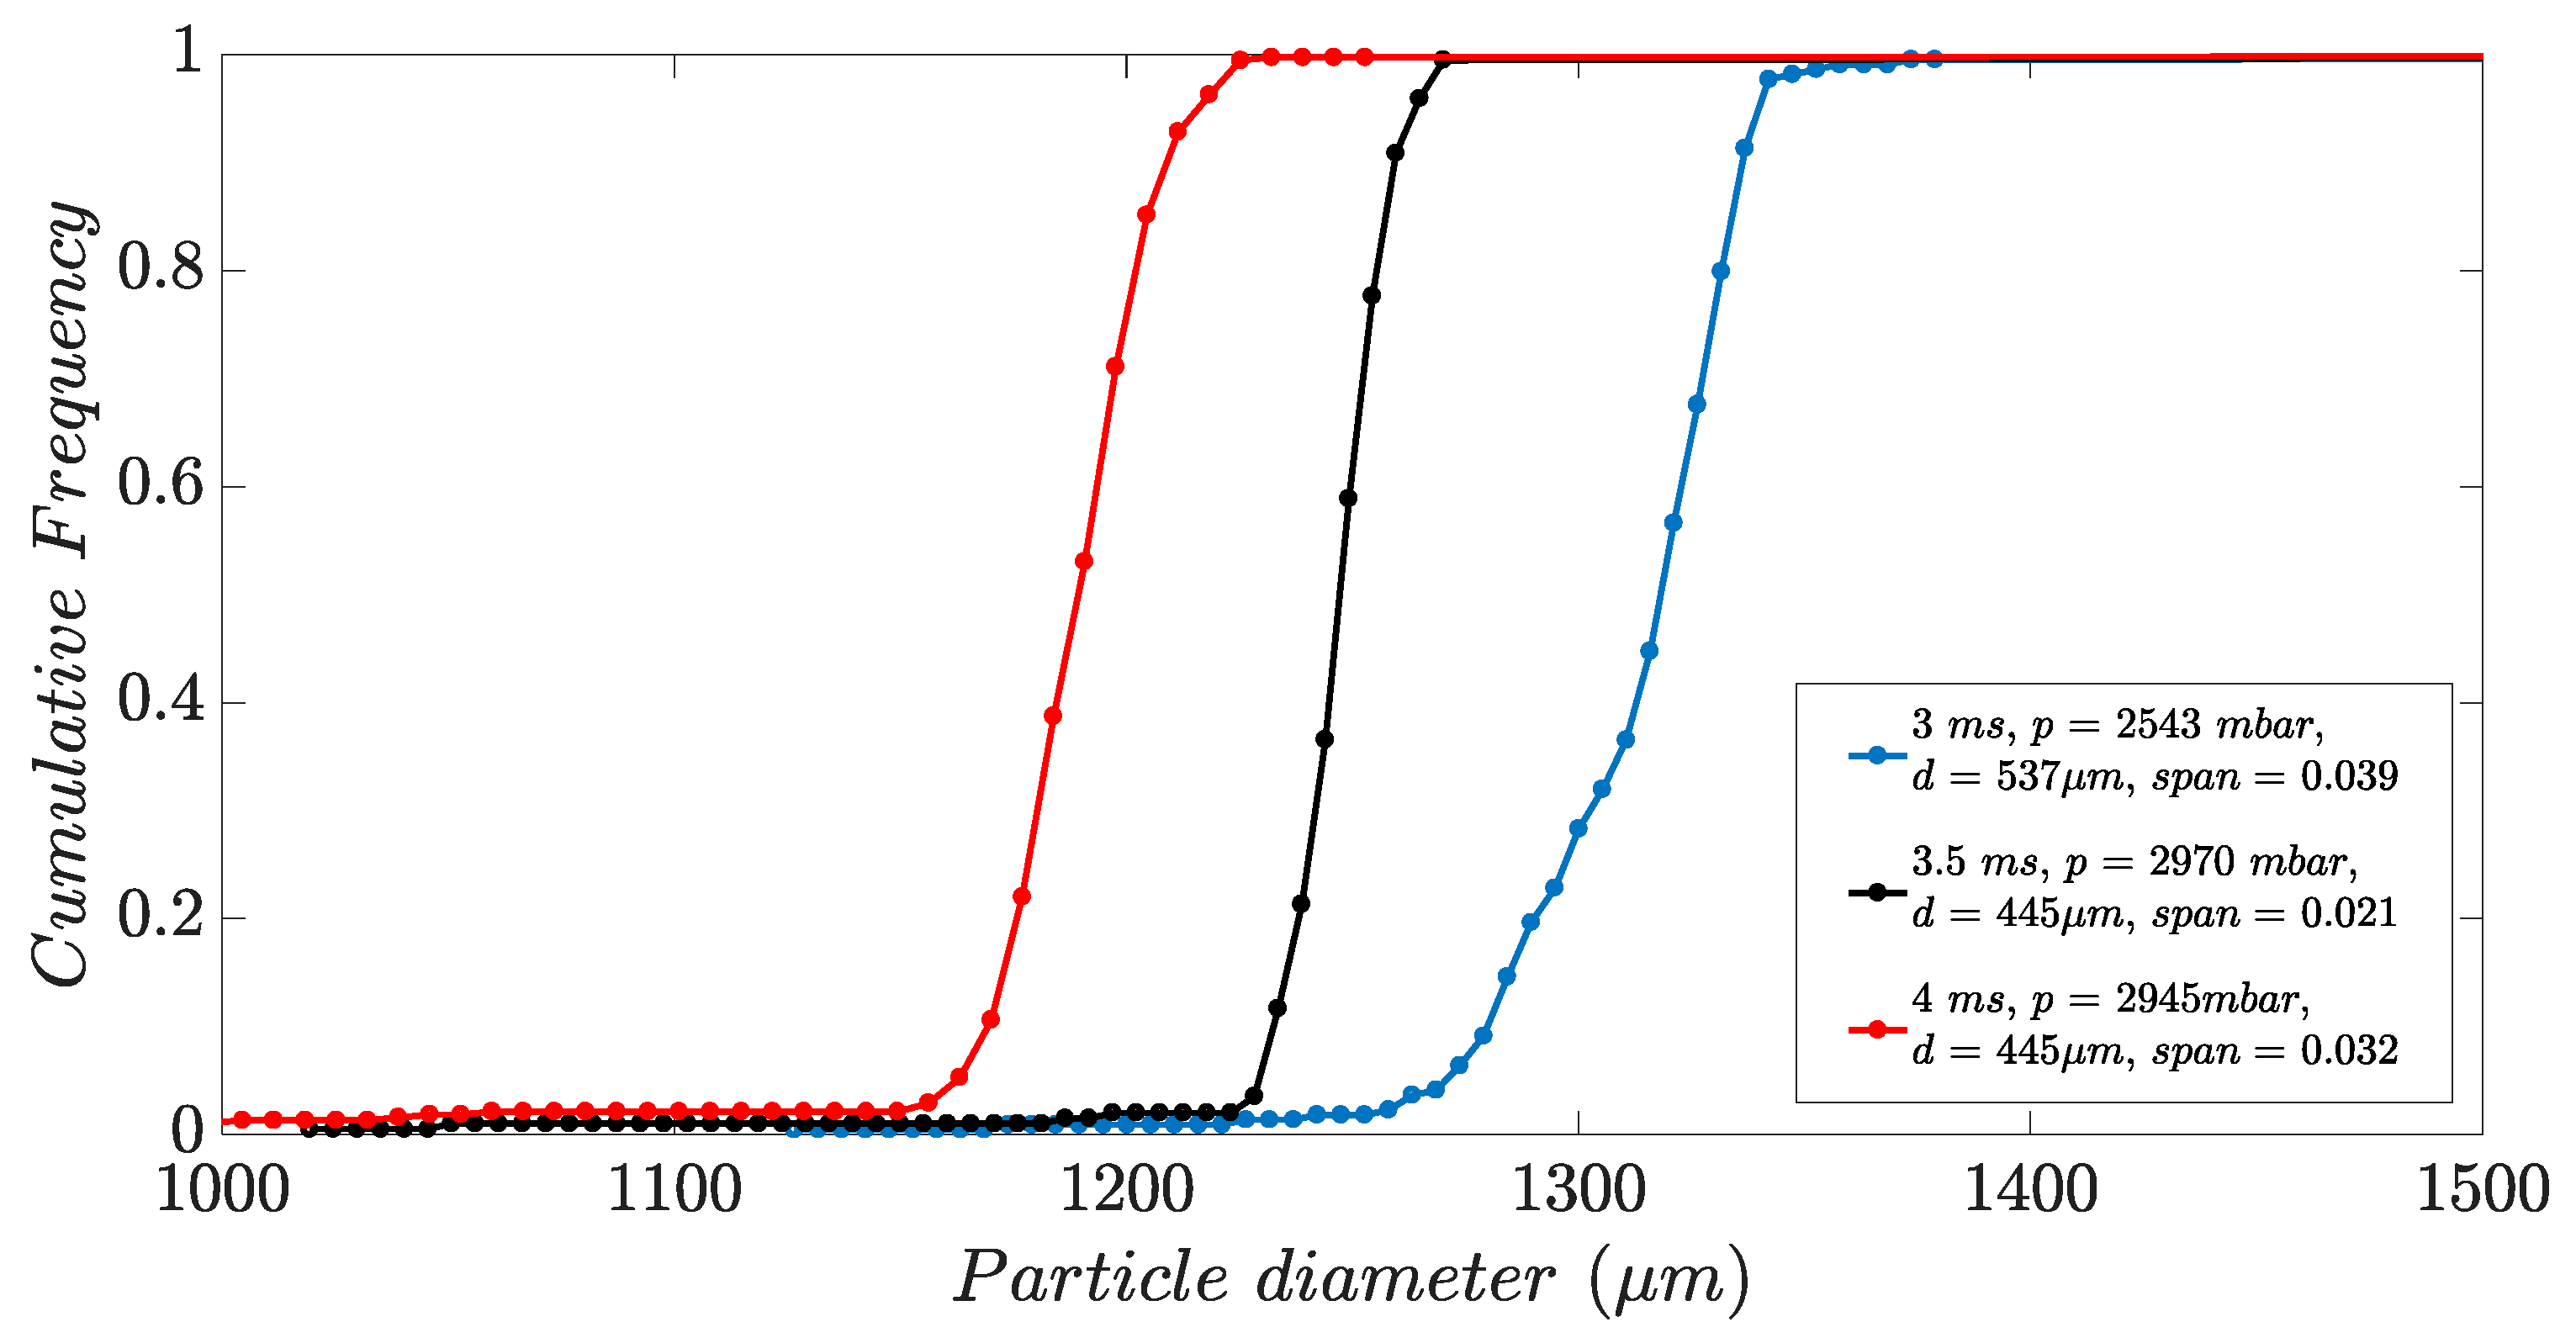
3.2.1. Circle Equivalent Diameter
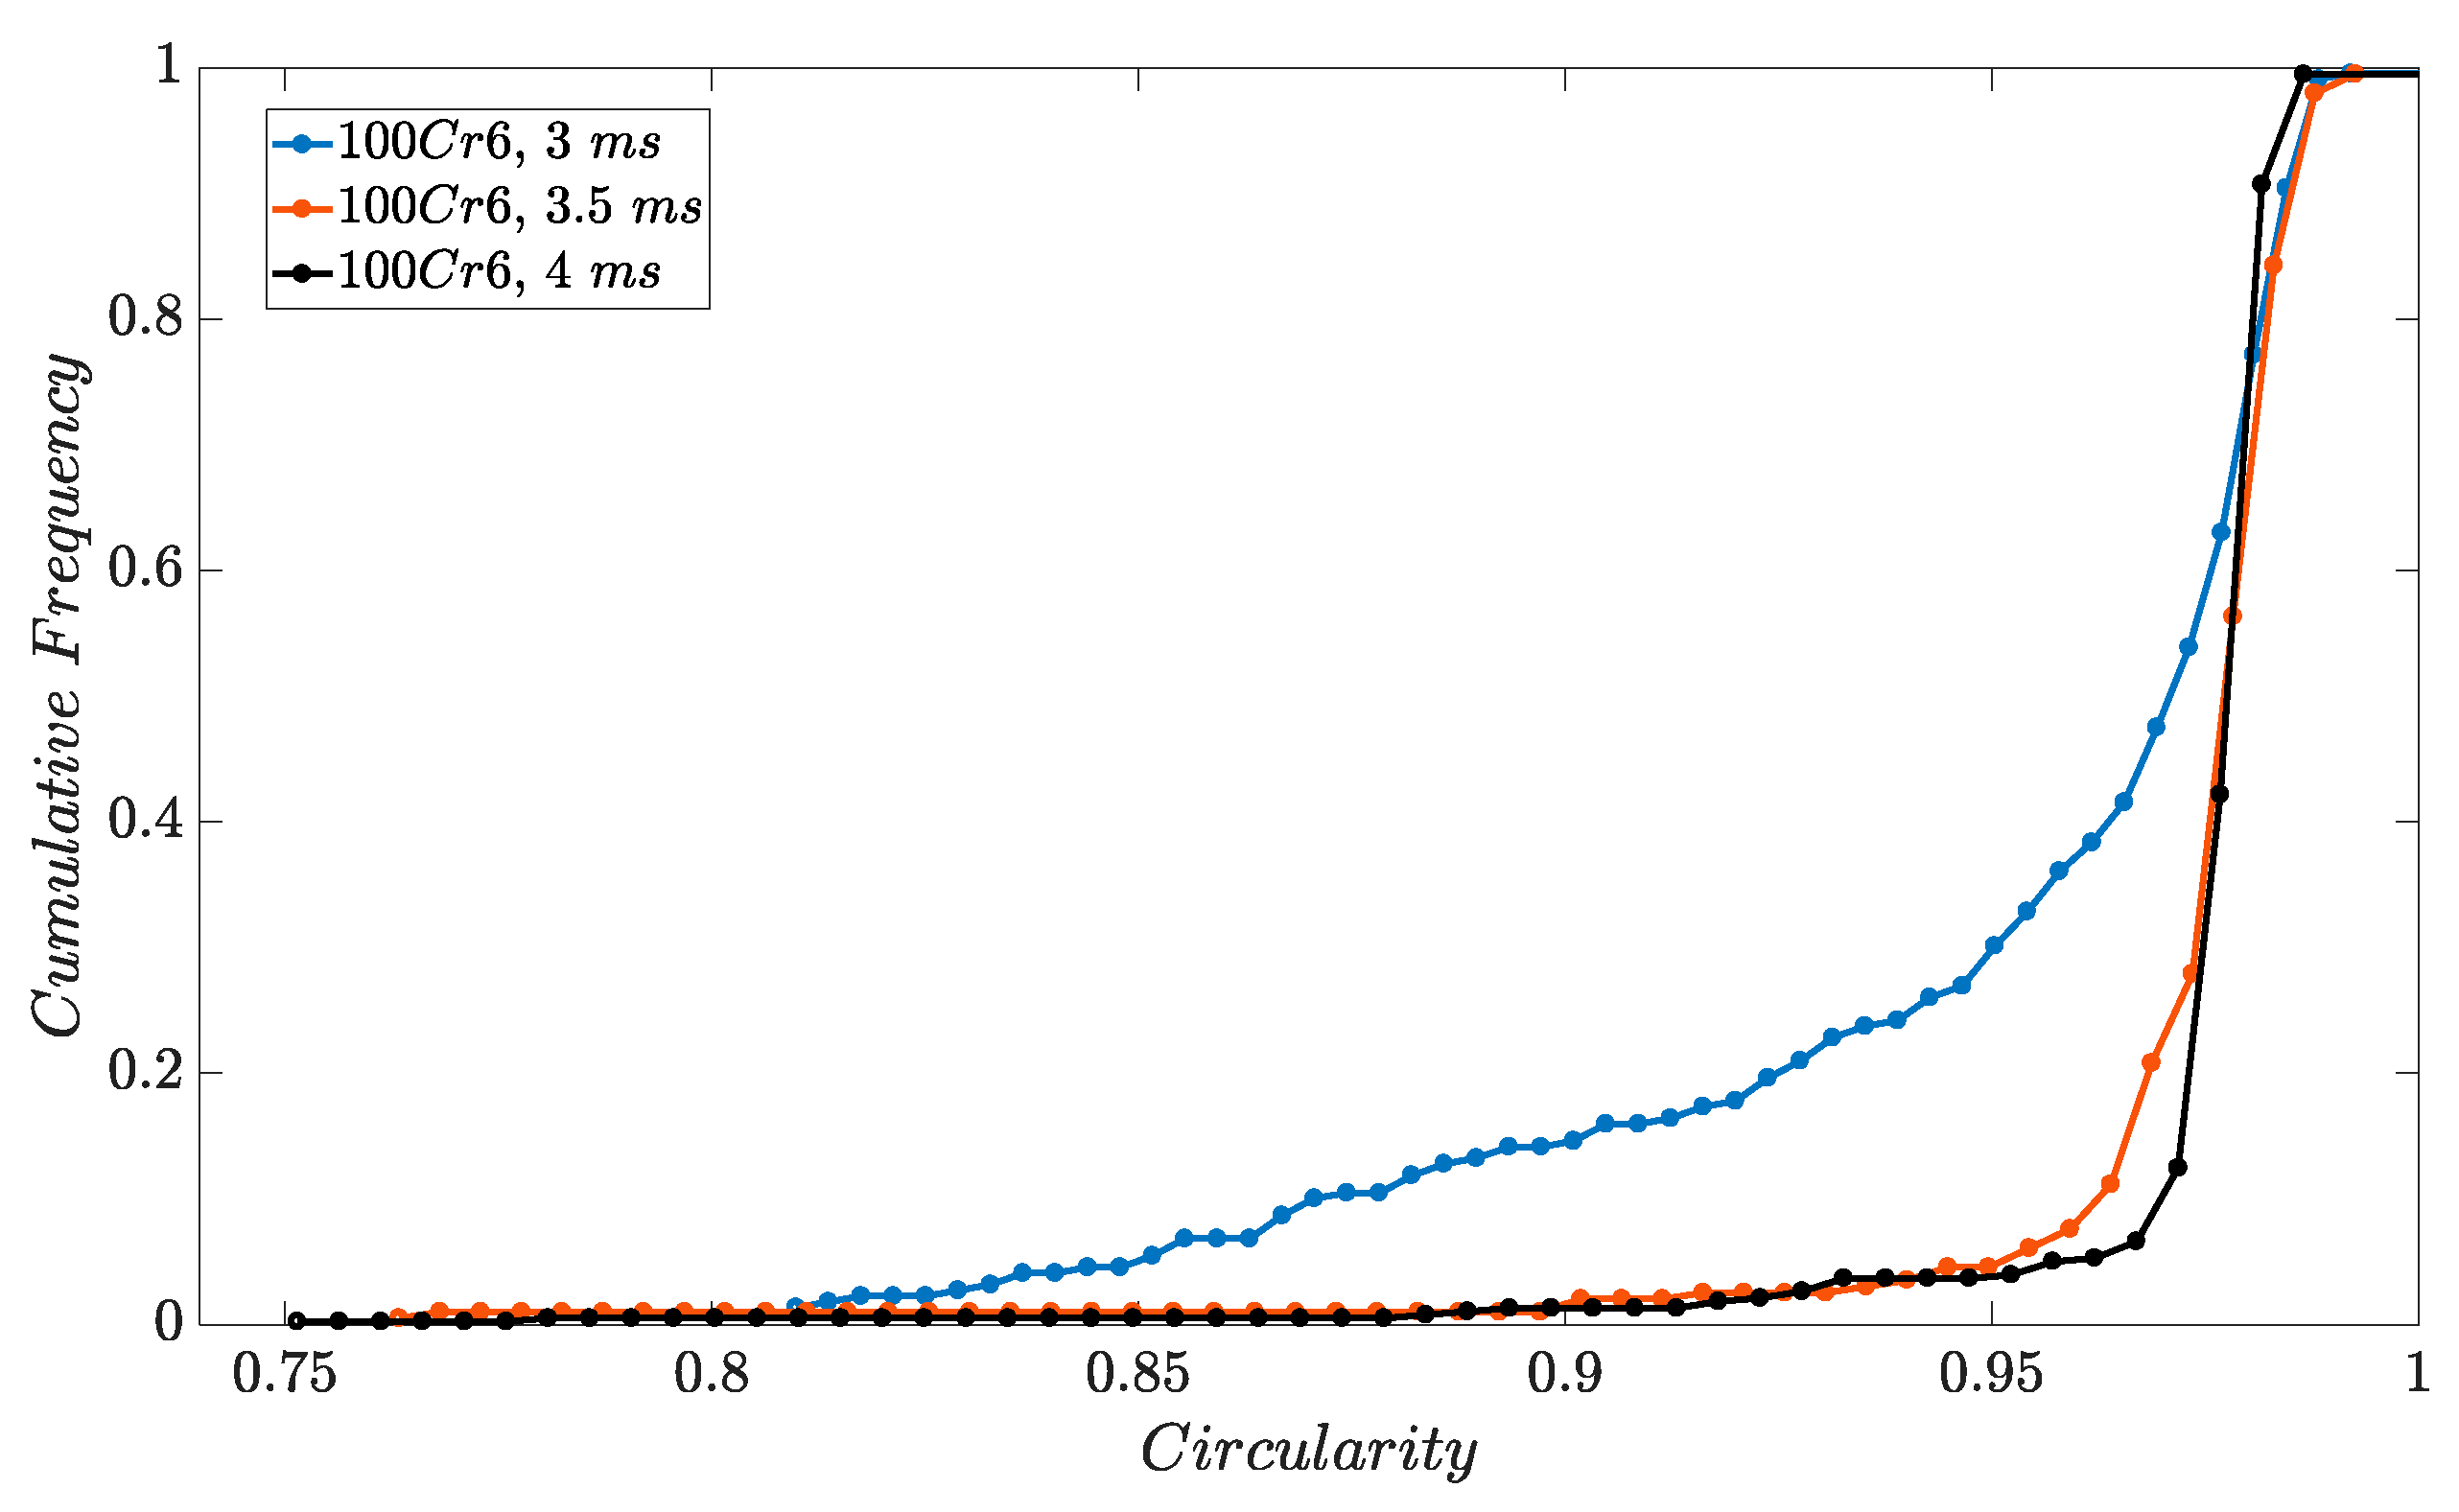
3.2.2. Circularity
4. Results and Discussion
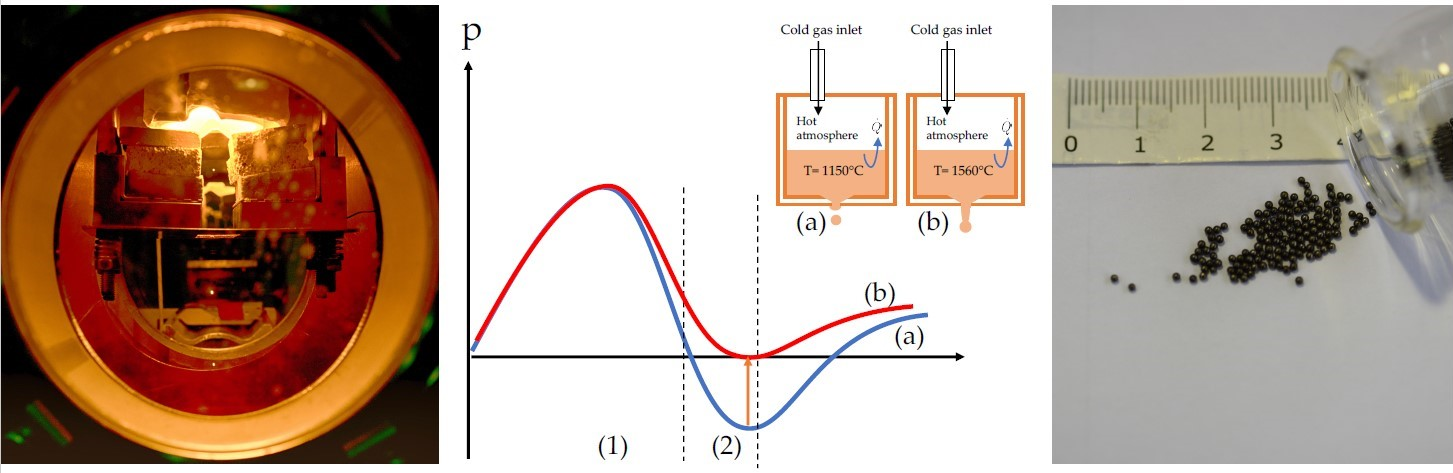
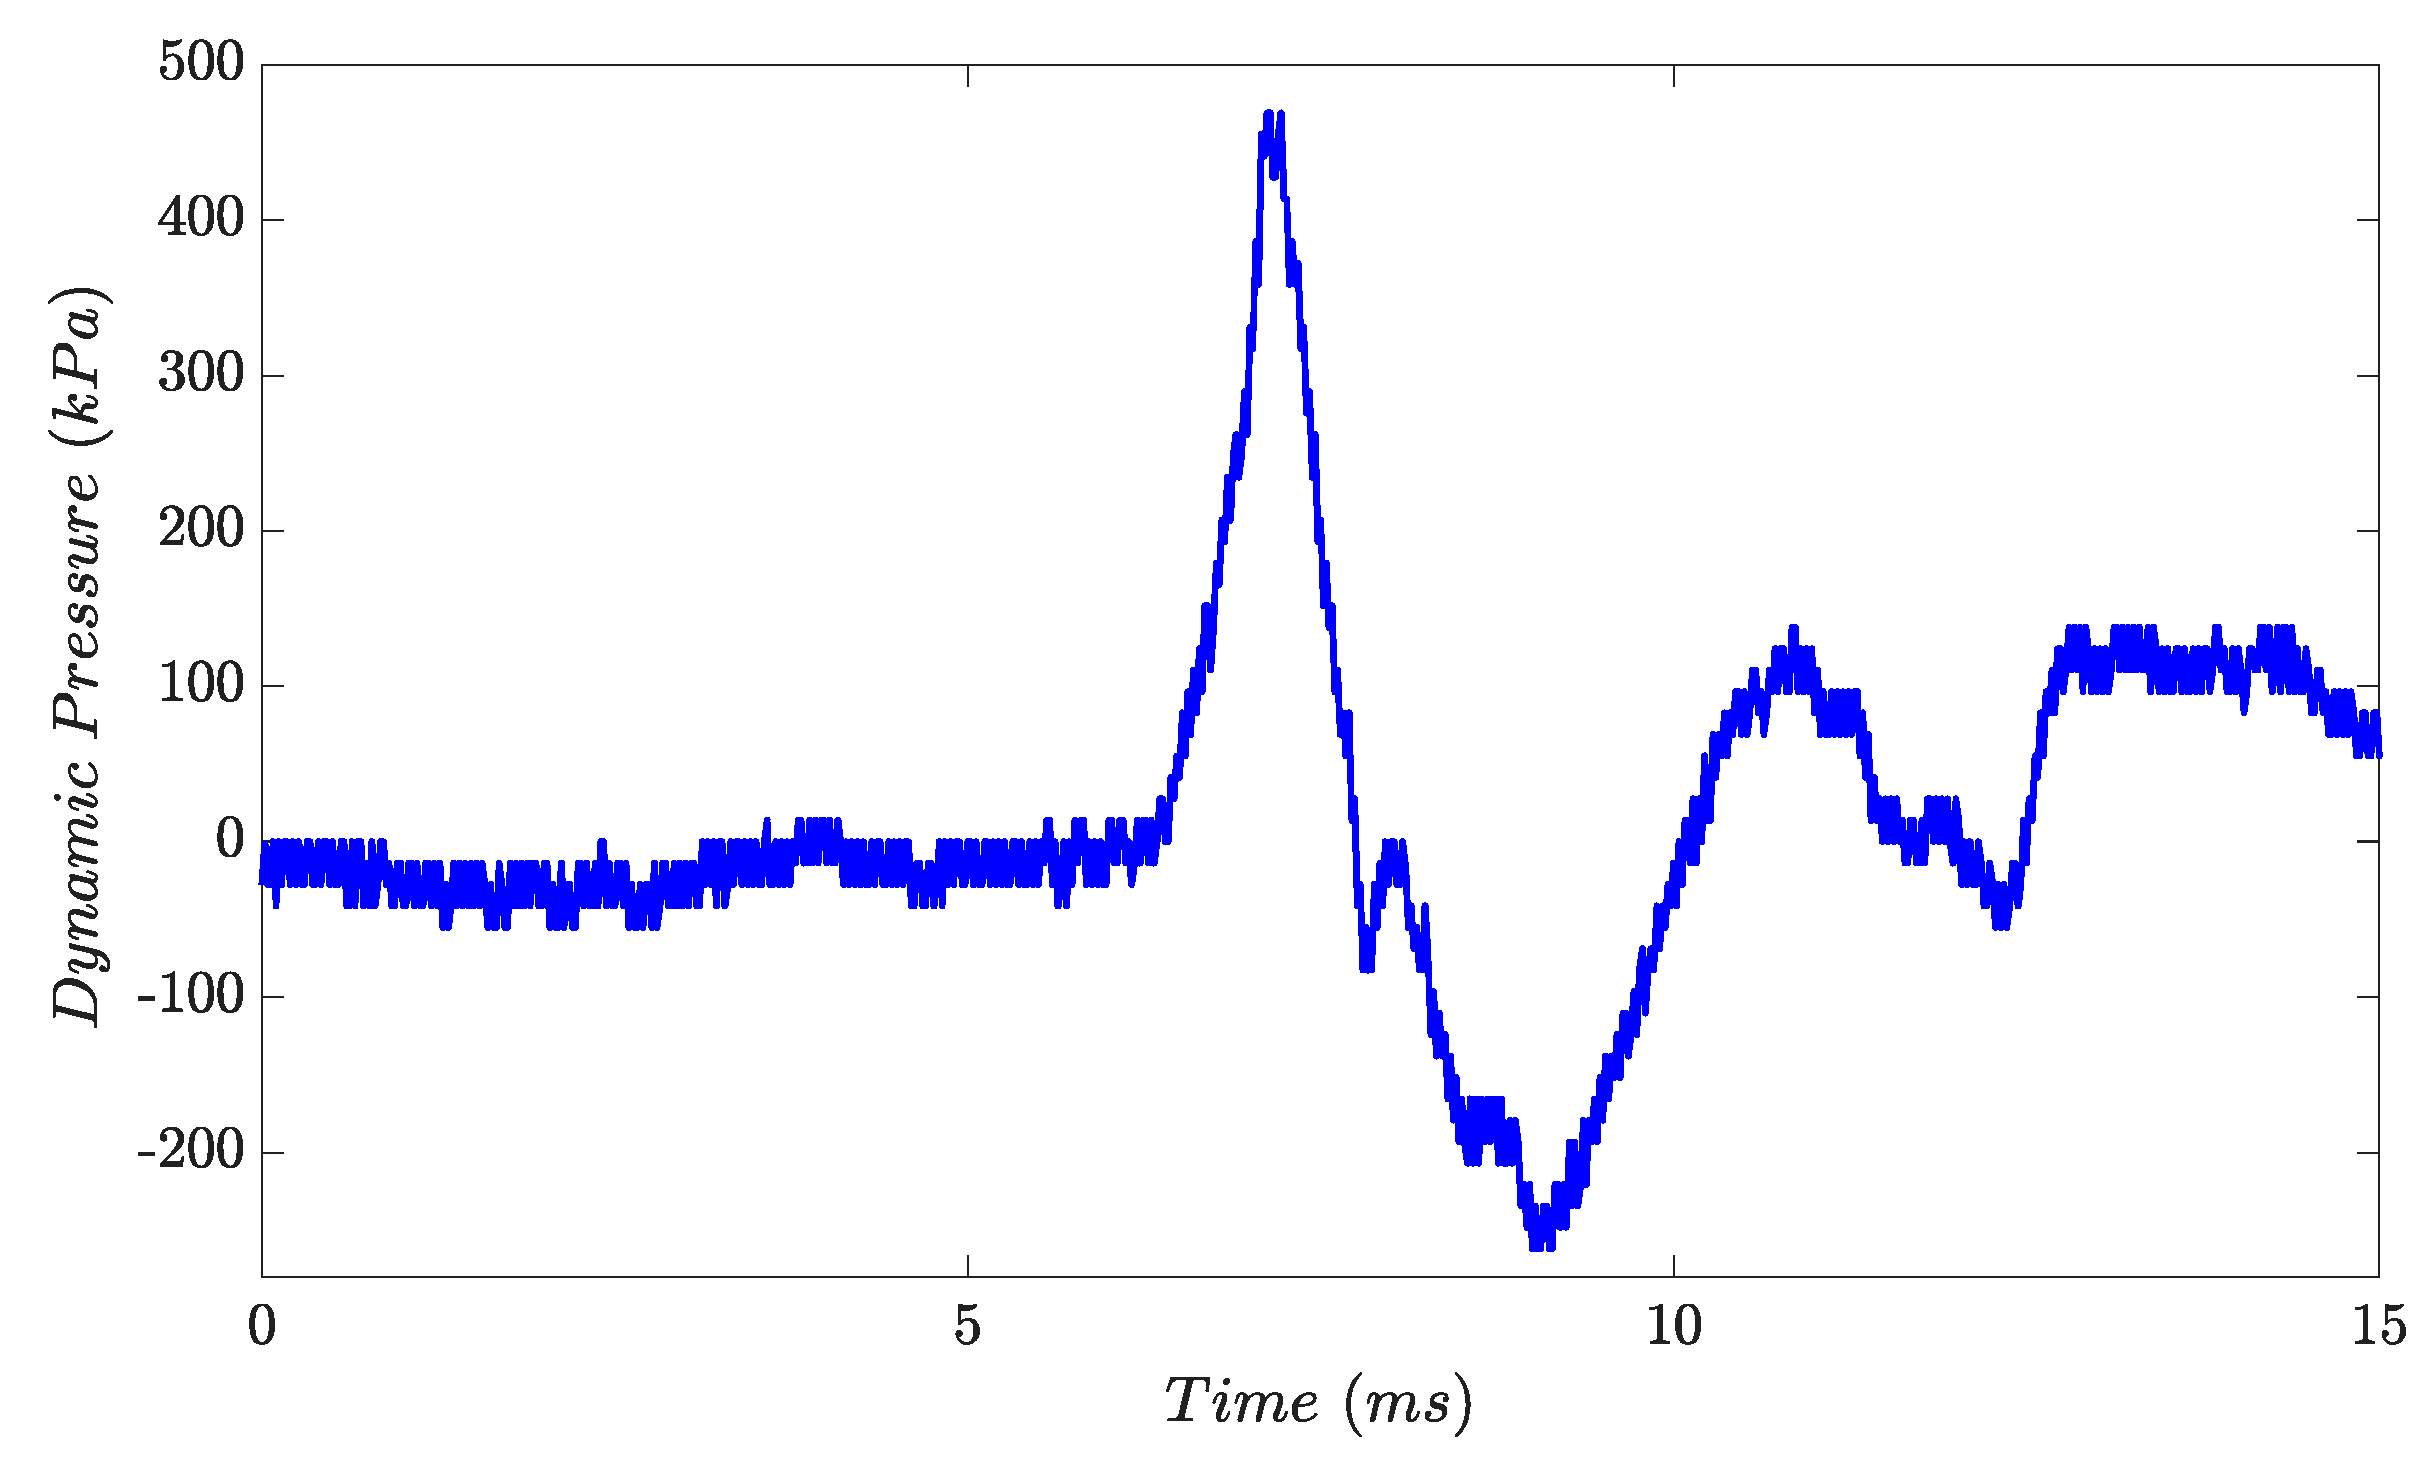
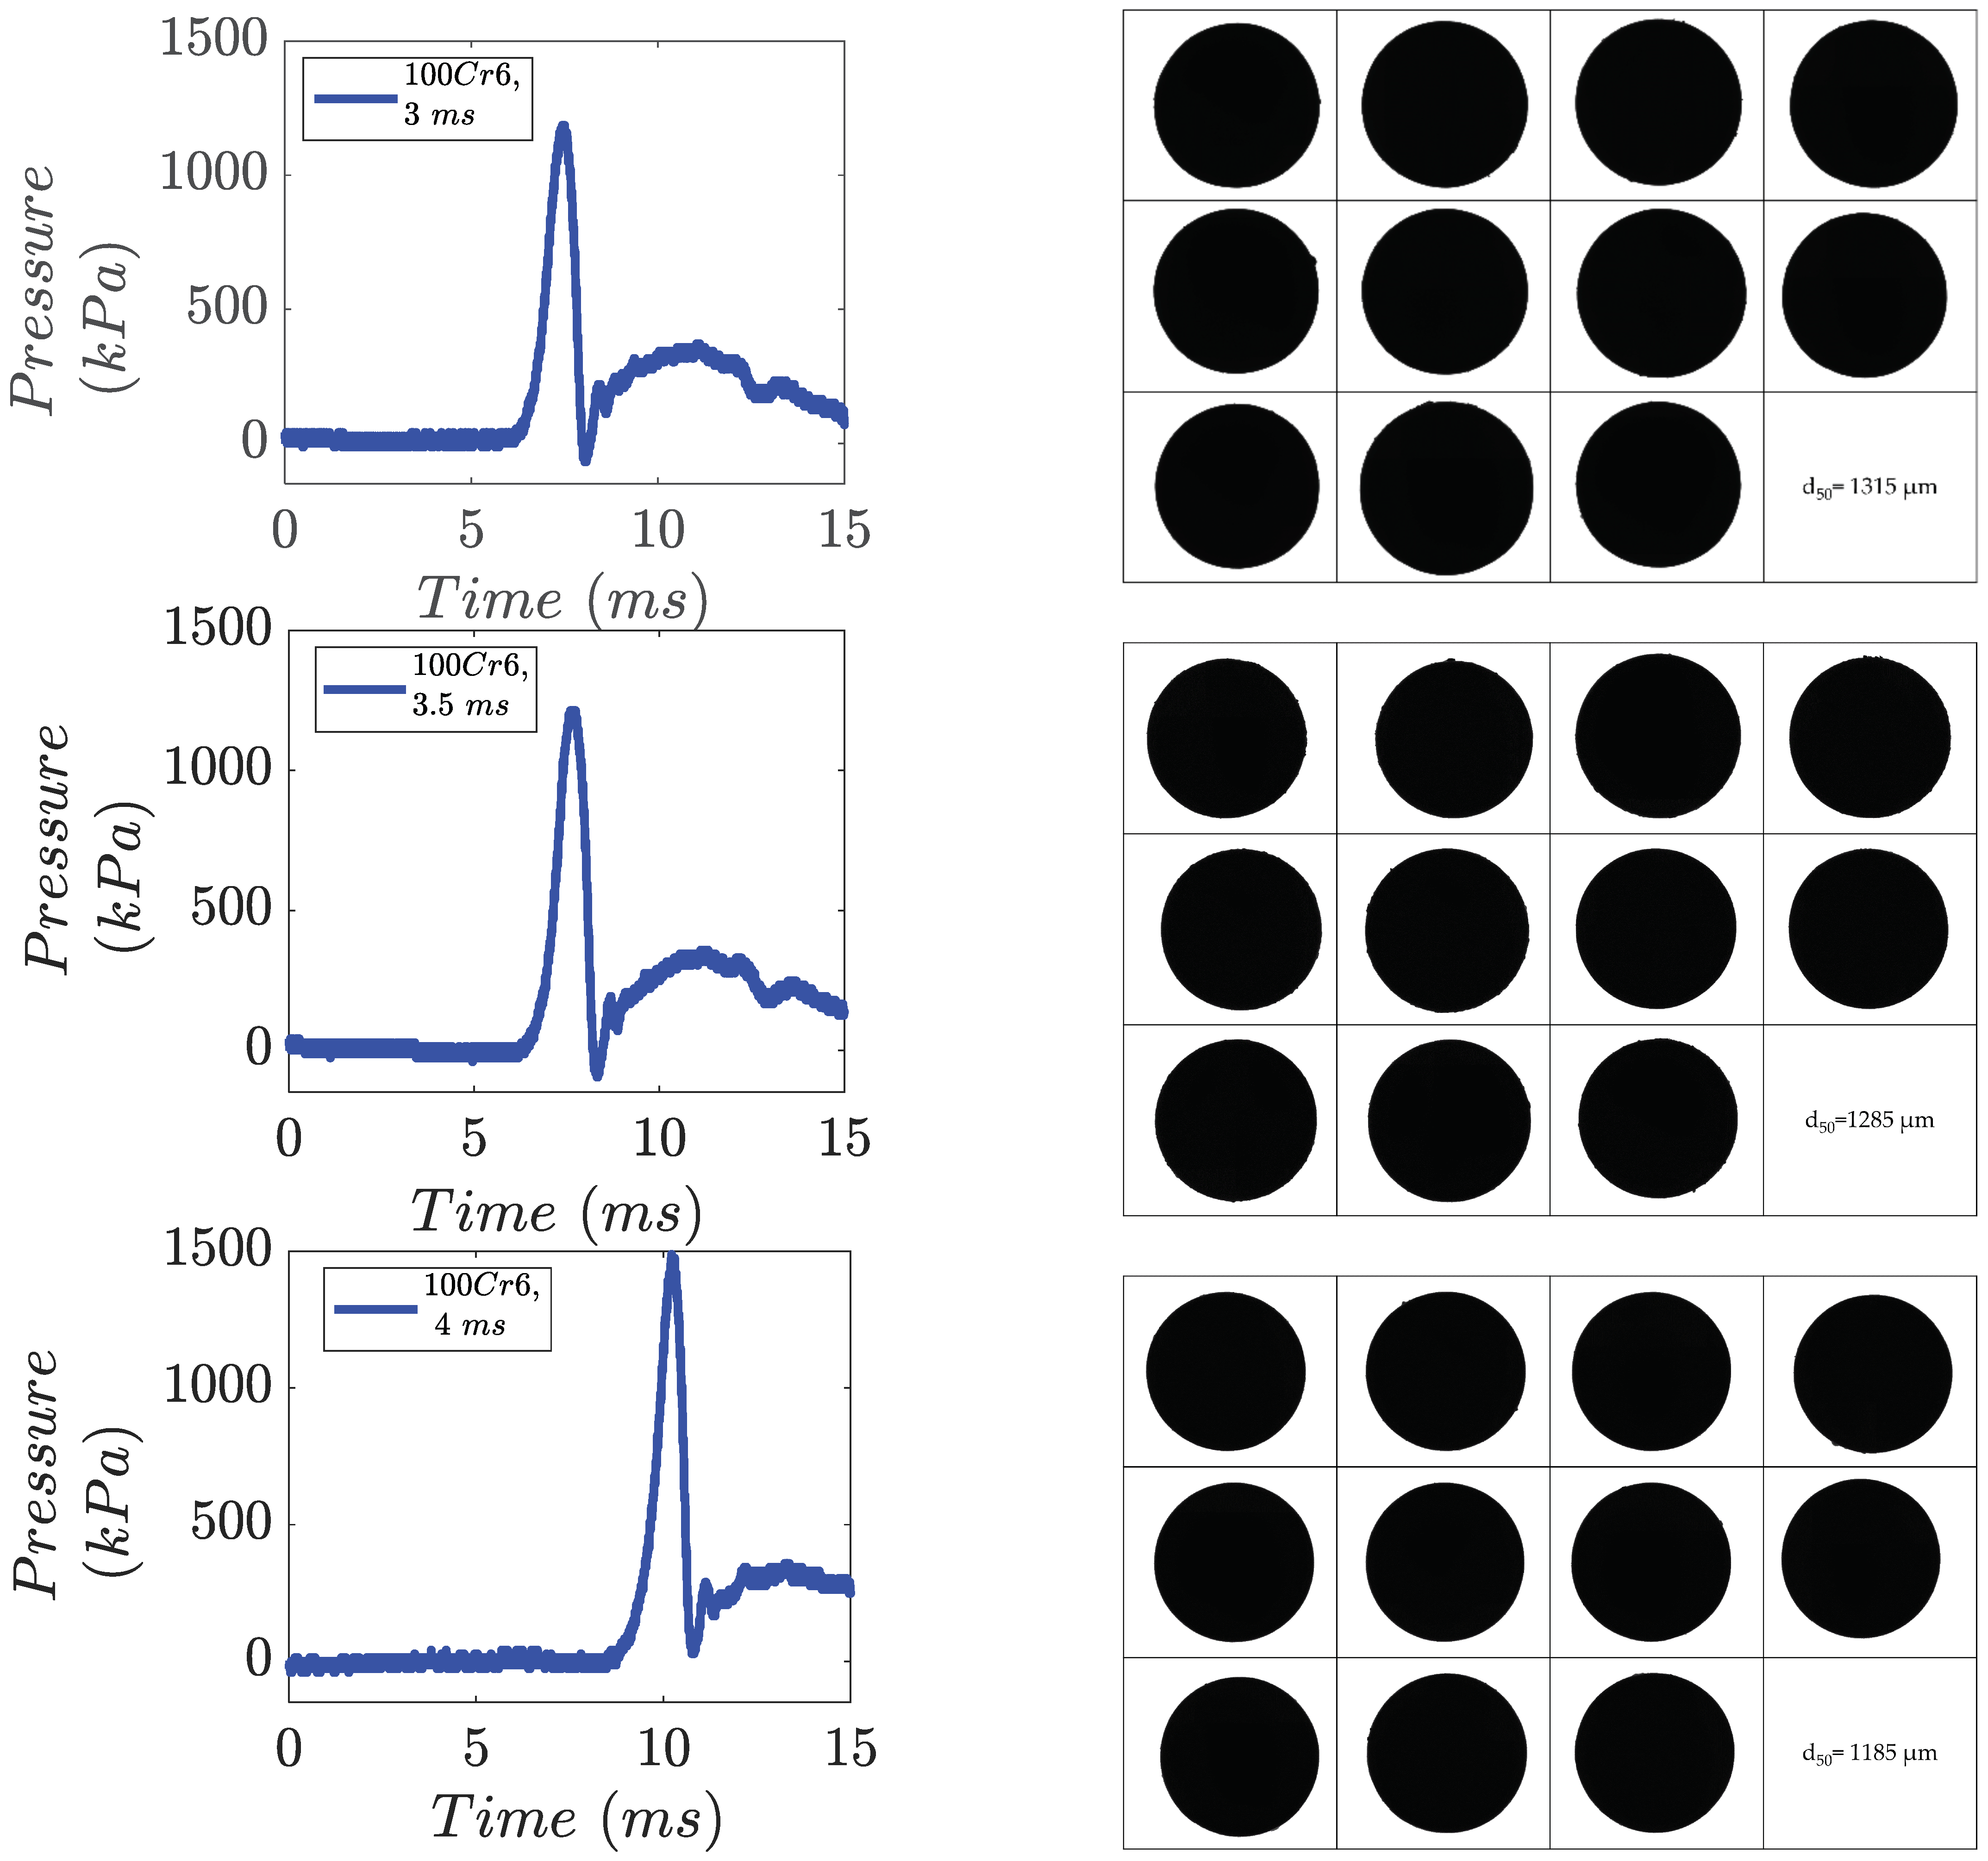
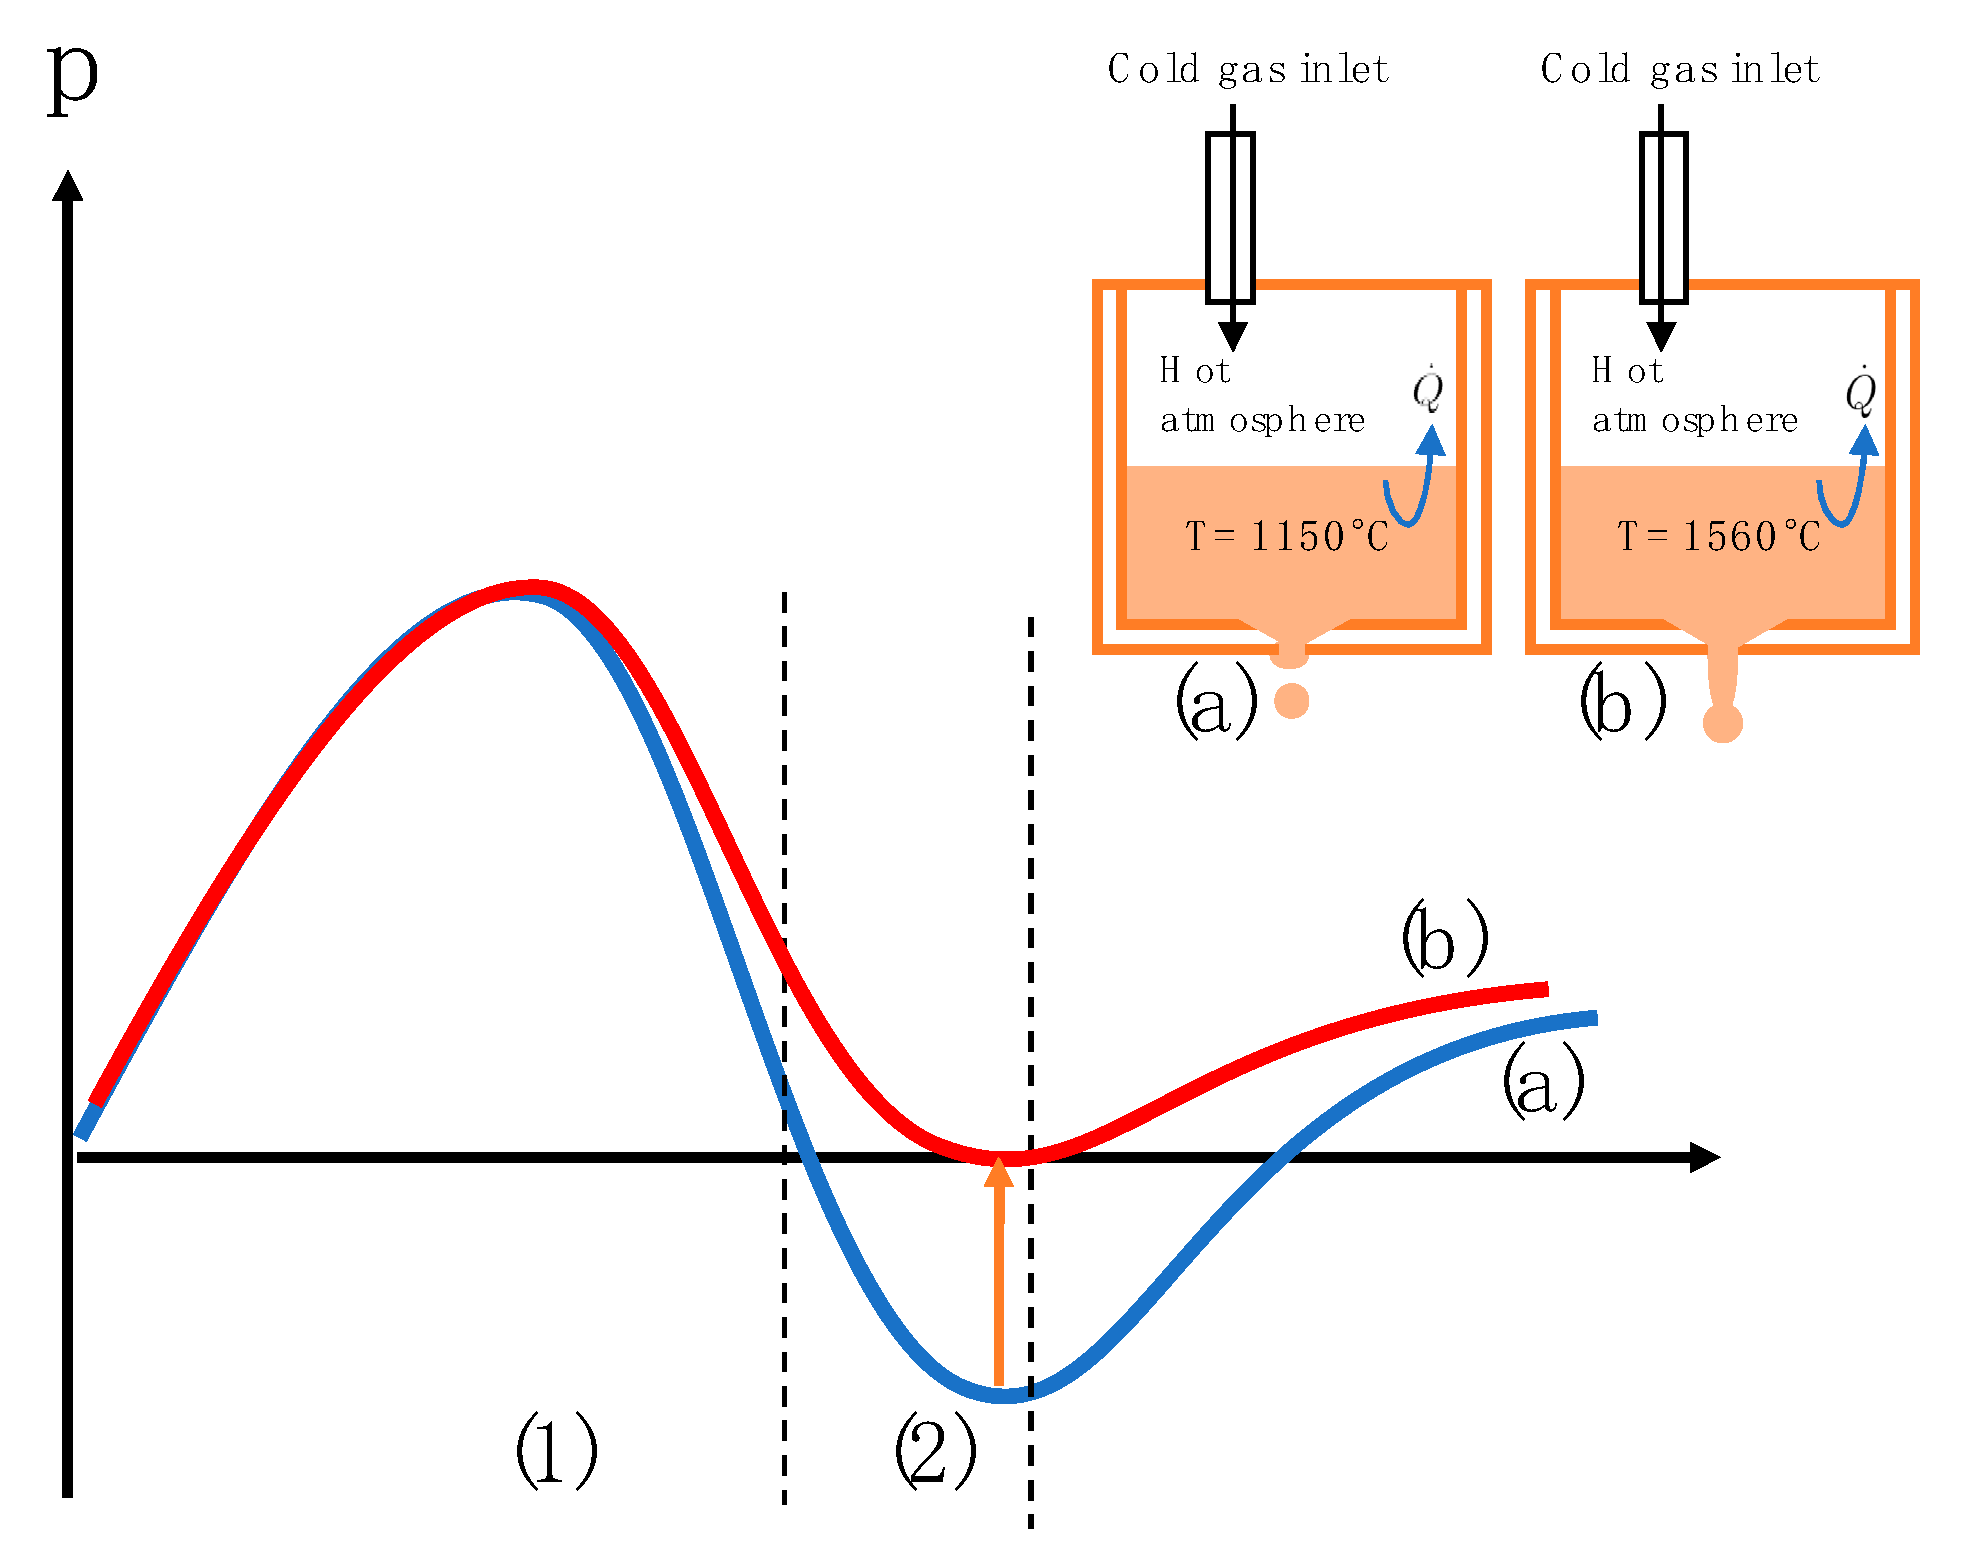
4.1. Determination of Pressure Wave
4.2. Droplet Formation
Image Analysis of High-Speed Recordings
4.3. Particle Size Distribution and Circularity
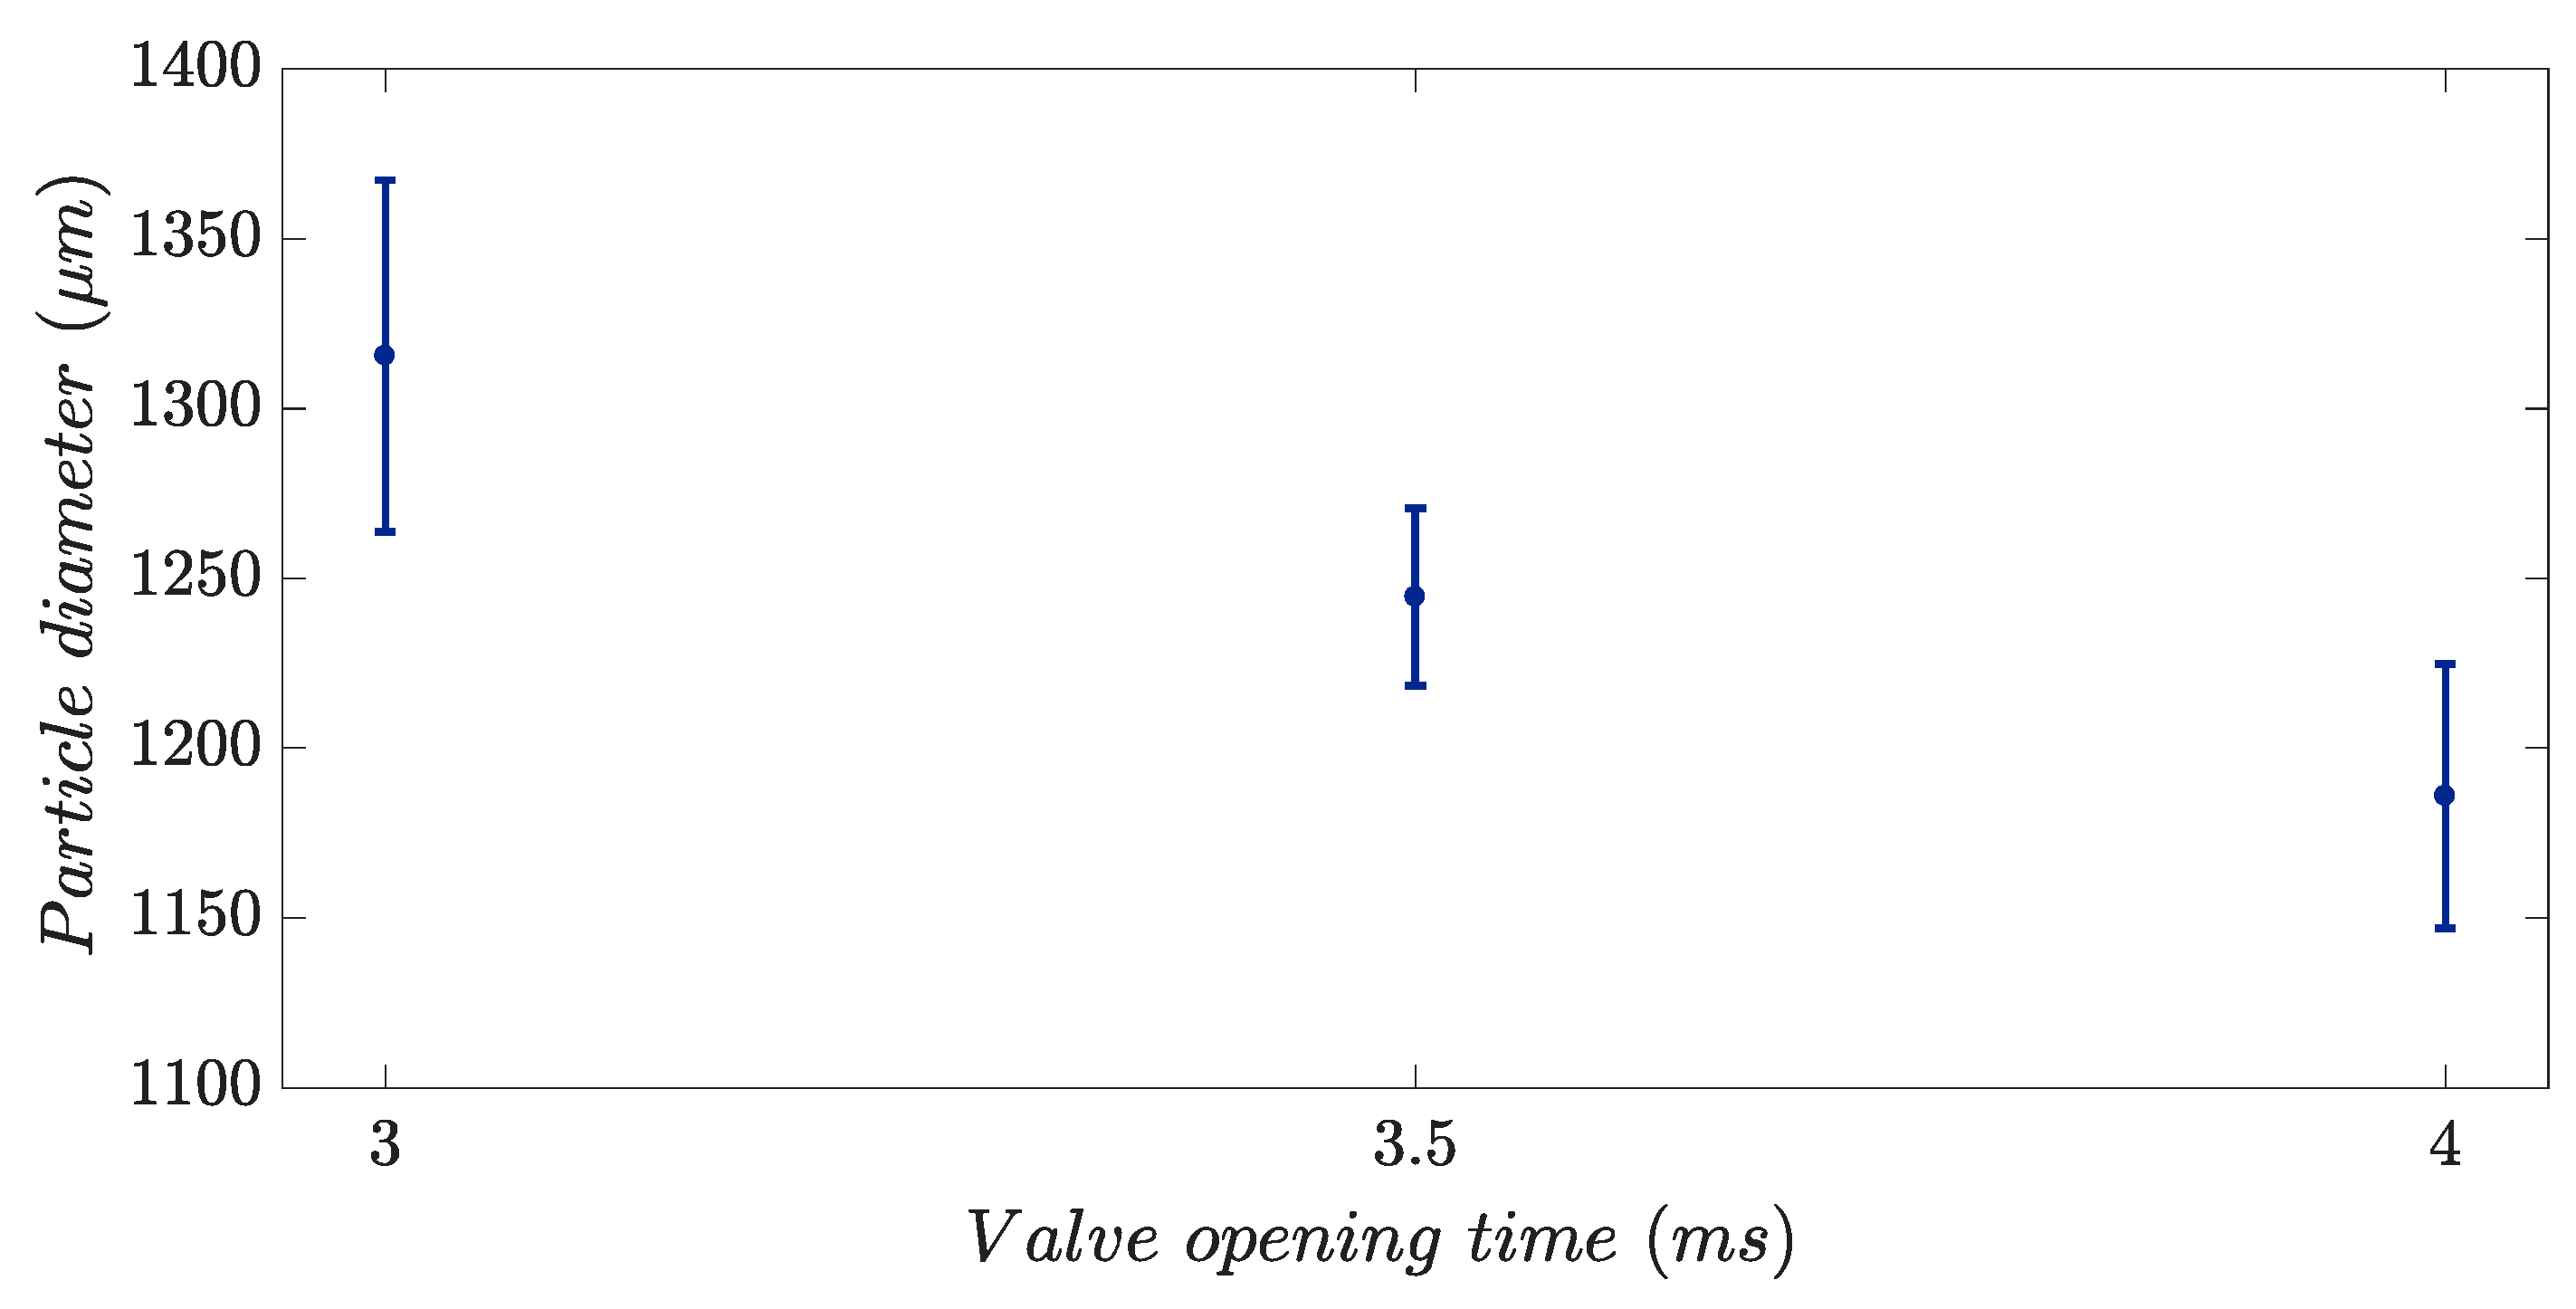
4.4. Process Window
5. Conclusions
Supplementary Materials
Author Contributions
Funding
Conflicts of Interest
References
- Coppola, S.; Nasti, G.; Vespini, V.; Marchesano, V.; Ferraro, P. On the Spraying Modality of Liquids by Pyroelectrohydrodynamics. ACS Omega 2018, 3, 17707–17716. [Google Scholar] [CrossRef]
- Lee, E.R. Microdrop Generation; CRC Press: Boca Raton, FL, USA, 2002. [Google Scholar]
- Liu, Q.; Orme, M. High precision solder droplet printing technology and the state-of-the-art. J. Mater. Process. Technol. 2001, 115, 271–283. [Google Scholar] [CrossRef]
- Smith, P.J.; Shin, D.H. Inkjet-Based Micromanufacturing; John Wiley & Sons: Hoboken, NJ, USA, 2012. [Google Scholar]
- Wang, P.; Li, H.; Qi, L.; Li, K.; Jun, L. Modeling of Generation of Uniform Metal Droplet During Drop-On-Demand Spray Forming. J. Comput. Theor. Nanosci. 2012, 9, 1408–1412. [Google Scholar] [CrossRef]
- Chandra, S.; Jivraj, R. Apparatus and Method for Generating Droplets. U.S. Patent No. 6,446,878, 10 September 2002. [Google Scholar]
- Amirzadeh Goghari, A.; Chandra, S. Producing droplets smaller than the nozzle diameter by using a pneumatic drop-on-demand droplet generator. Exp. Fluids 2008, 44, 105–114. [Google Scholar] [CrossRef]
- Miura, A.; Dong, W.; Fukue, M.; Yodoshi, N.; Takagi, K.; Kawasaki, A. Preparation of Fe-based monodisperse spherical particles with fully glassy phase. J. Alloy. Compd. 2011, 509, 5581–5586. [Google Scholar] [CrossRef]
- Gao, F.; Sonin, A.A. Precise Deposition of Molten Microdrops: The Physics of Digital Microfabrication. Proc. R. Soc. A: Math. Phys. Eng. Sci. 1994, 444, 533–554. [Google Scholar] [CrossRef]
- He, P.; Liu, Y.; Qiao, R. Fluid dynamics of the droplet impact processes in cell printing. Microfluid. Nanofluidics 2015, 18, 569–585. [Google Scholar] [CrossRef]
- Luo, J.; Qi, L.; Tao, Y.; Ma, Q.; Visser, C.W. Impact-driven ejection of micro metal droplets on-demand. Int. J. Mach. Tools Manuf. 2016, 106, 67–74. [Google Scholar] [CrossRef]
- Chen, Y.S.; Huang, Y.L.; Kuo, C.-H.; Chang, S.-H. Investigation of design parameters for droplet generators driven by piezoelectric actuators. Int. J. Mech. Sci. 2007, 49, 733–740. [Google Scholar] [CrossRef]
- Cheng, S.; Chandra, S. A pneumatic droplet-on-demand generator. Exp. Fluids 2003, 34, 755–762. [Google Scholar] [CrossRef]
- Cheng, S.X.; Li, T.; Chandra, S. Producing molten metal droplets with a pneumatic droplet-on-demand generator. J. Mater. Process. Technol. 2005, 159, 295–302. [Google Scholar] [CrossRef]
- Lass, N.; Riegger, L.; Zengerle, R.; Koltay, P. Enhanced Liquid Metal Micro Droplet Generation by Pneumatic Actuation Based on the StarJet Method. Micromachines 2013, 4, 49–66. [Google Scholar] [CrossRef]
- Orme, M.; Muntz, E.P. New technique for producing highly uniform droplet streams over an extended range of disturbance wavenumbers. Rev. Sci. Instrum. 1987, 58, 279–284. [Google Scholar] [CrossRef]
- Zhong, S.Y.; Qi, L.H.; Luo, J.; Xiao, Y. Parameters Study on Generation of Uniform Copper Droplet by Pneumatic Drop-on-Demand Technology. Adv. Mater. Res. 2012, 430–432, 781–784. [Google Scholar]
- Ellendt, N.; Mädler, L. High-Throughput Exploration of Evolutionary Structural Materials. HTM J. Heat Treat. Mater. 2018, 73, 3–12. [Google Scholar] [CrossRef]
- Ellendt, N.; Ciftci, N.; Goodreau, C.; Uhlenwinkel, V.; Madler, L. Solidification of Single Droplets under Combined Cooling Conditions; IOP Publishing: Bristol, UK, 2016; p. 012057. [Google Scholar]
- Ellendt, N.; Uhlenwinkel, V.; Ahmetovic, A.; Boddez, L.; Henein, H. Quality of Sn-Ag powders produced by drop-on-demand technique. In Proceedings of the Advances in powder metallurgy & particulate materials - 2008, Washington, DC, USA, 8–12 June 2008. [Google Scholar]
- Heichal, Y.; Chandra, S. Predicting Thermal Contact Resistance between Molten Metal Droplets and a Solid Surface. J. Heat Transf. 2005, 127, 1269–1275. [Google Scholar] [CrossRef]
- Rumschoettel, D.; Griebel, B.; Irlinger, F.; Lueth, T.C. A Fast Pneumatic Droplet Generator for the Ejection of Molten Aluminum. In Proceedings of the 2017 Pan Pacific Microelectronics Symposium (Pan Pacific), Kauai, HI, USA, 6–9 February 2017; pp. 1–8. [Google Scholar]
- Sukhotskiy, V.; Karampelas, I.H.; Garg, G.; Verma, A.; Tong, M.; Vader, S.; Vader, Z.; Furlani, E.P. Magnetohydrodynamic Drop-on-Demand Liquid Metal 3D Printing. In Proceedings of the Solid Freeform Fabrication 2017- An Additive Manufacturing Conference, Austin, TX, USA, 7–9 August 2017. [Google Scholar]
- Suter, M.; Weingartner, E.; Wegener, K. MHD printhead for additive manufacturing of metals. Procedia CIRP 2012, 2, 102–106. [Google Scholar] [CrossRef]
- Zhang, D.; Qi, L.; Luo, J.; Yi, H.; Xiong, W.; Mo, Y. Parametric mapping of linear deposition morphology in uniform metal droplet deposition technique. J. Mater. Process. Technol. 2019, 264, 234–239. [Google Scholar] [CrossRef]
- Luo, J.; Xu, Q.X.; Zhong, S.-Y.; Qi, L.H.; Xiong, W. Research on mechanism of generating aluminum droplets smaller than the nozzle diameter by pneumatic drop-on-demand technology. Int. J. Adv. Manuf. Technol. 2017, 93, 1771–1780. [Google Scholar]
- Zuo, H.S.; Li, H.J.; Qi, L.H.; Luo, J.; Zhong, S.Y.; Li, H.P. Effect of wetting behavior on generation of uniform aluminum droplets obtained by pneumatic drop-on-demand technique. J. Mater. Process. Technol. 2014, 214, 2566–2575. [Google Scholar] [CrossRef]
- De Jong, J.; De Bruin, G.; Reinten, H.; Berg, M.V.D.; Wijshoff, H.; Versluis, M.; Lohse, D. Air entrapment in piezo-driven inkjet printheads. J. Acoust. Soc. Am. 2006, 120, 1257. [Google Scholar] [CrossRef]
- Jennings, B.R.; Parslow, K. Particle Size Measurement: The Equivalent Spherical Diameter. In Proceedings of the Royal Society of London. Series A, Mathematical and Physical Sciences; Royal Society: London, UK, 1988; Volume 419, pp. 137–149. [Google Scholar]
- Barreiros, F.M.; Ferreira, P.J.; Figueiredo, M.M. Calculating Shape Factors from Particle Sizing Data. Part. Part. Syst. Charact. 1996, 13, 368–373. [Google Scholar] [CrossRef]
- Naito, M.; Hayakawa, O.; Nakahira, K.; Mori, H.; Tsubaki, J. Effect of particle shape on the particle size distribution measured with commercial equipment. Powder Technol. 1998, 100, 52–60. [Google Scholar] [CrossRef]
- Pons, M.N.; Vivier, H.; Delcour, V.; Authelin, J.R.; Paillères-Hubert, L. Morphological analysis of pharmaceutical powders. Powder Technol. 2002, 128, 276–286. [Google Scholar] [CrossRef]
- Xu, R.; Di Guida, O.A. Comparison of sizing small particles using different technologies. Powder Technol. 2003, 132, 145–153. [Google Scholar] [CrossRef]
- Li, M.; Wilkinson, D.; Patchigolla, K. Comparison of Particle Size Distributions Measured Using Different Techniques. Part. Sci. Technol. 2005, 23, 265–284. [Google Scholar] [CrossRef]


| Alloy | 100Cr6 (EN 1.3505) |
|---|---|
| Melt temperature (°C) | 1560 |
| Melt volume (cm3) | 4.74 |
| Crucible material | Al2O3 |
| Nozzle diameter (µm) | 537/445 |
| Inert gas | N2 |
| Type of quenchant | Quenching Oil Durixol WX61 |
| Frequency (Hz) | 10 |
| Feed pressure (mbar) | 2543, 2335, 2945 |
| Valve opening time (ms) | 3, 3.5, 4 |
| distance (m) | 6.581 |
© 2019 by the authors. Licensee MDPI, Basel, Switzerland. This article is an open access article distributed under the terms and conditions of the Creative Commons Attribution (CC BY) license (http://creativecommons.org/licenses/by/4.0/).
Share and Cite
Imani Moqadam, S.; Mädler, L.; Ellendt, N. A High Temperature Drop-On-Demand Droplet Generator for Metallic Melts. Micromachines 2019, 10, 477. https://doi.org/10.3390/mi10070477
Imani Moqadam S, Mädler L, Ellendt N. A High Temperature Drop-On-Demand Droplet Generator for Metallic Melts. Micromachines. 2019; 10(7):477. https://doi.org/10.3390/mi10070477
Chicago/Turabian StyleImani Moqadam, Saeedeh, Lutz Mädler, and Nils Ellendt. 2019. "A High Temperature Drop-On-Demand Droplet Generator for Metallic Melts" Micromachines 10, no. 7: 477. https://doi.org/10.3390/mi10070477
APA StyleImani Moqadam, S., Mädler, L., & Ellendt, N. (2019). A High Temperature Drop-On-Demand Droplet Generator for Metallic Melts. Micromachines, 10(7), 477. https://doi.org/10.3390/mi10070477