Process Fingerprint in Micro-EDM Drilling


Abstract
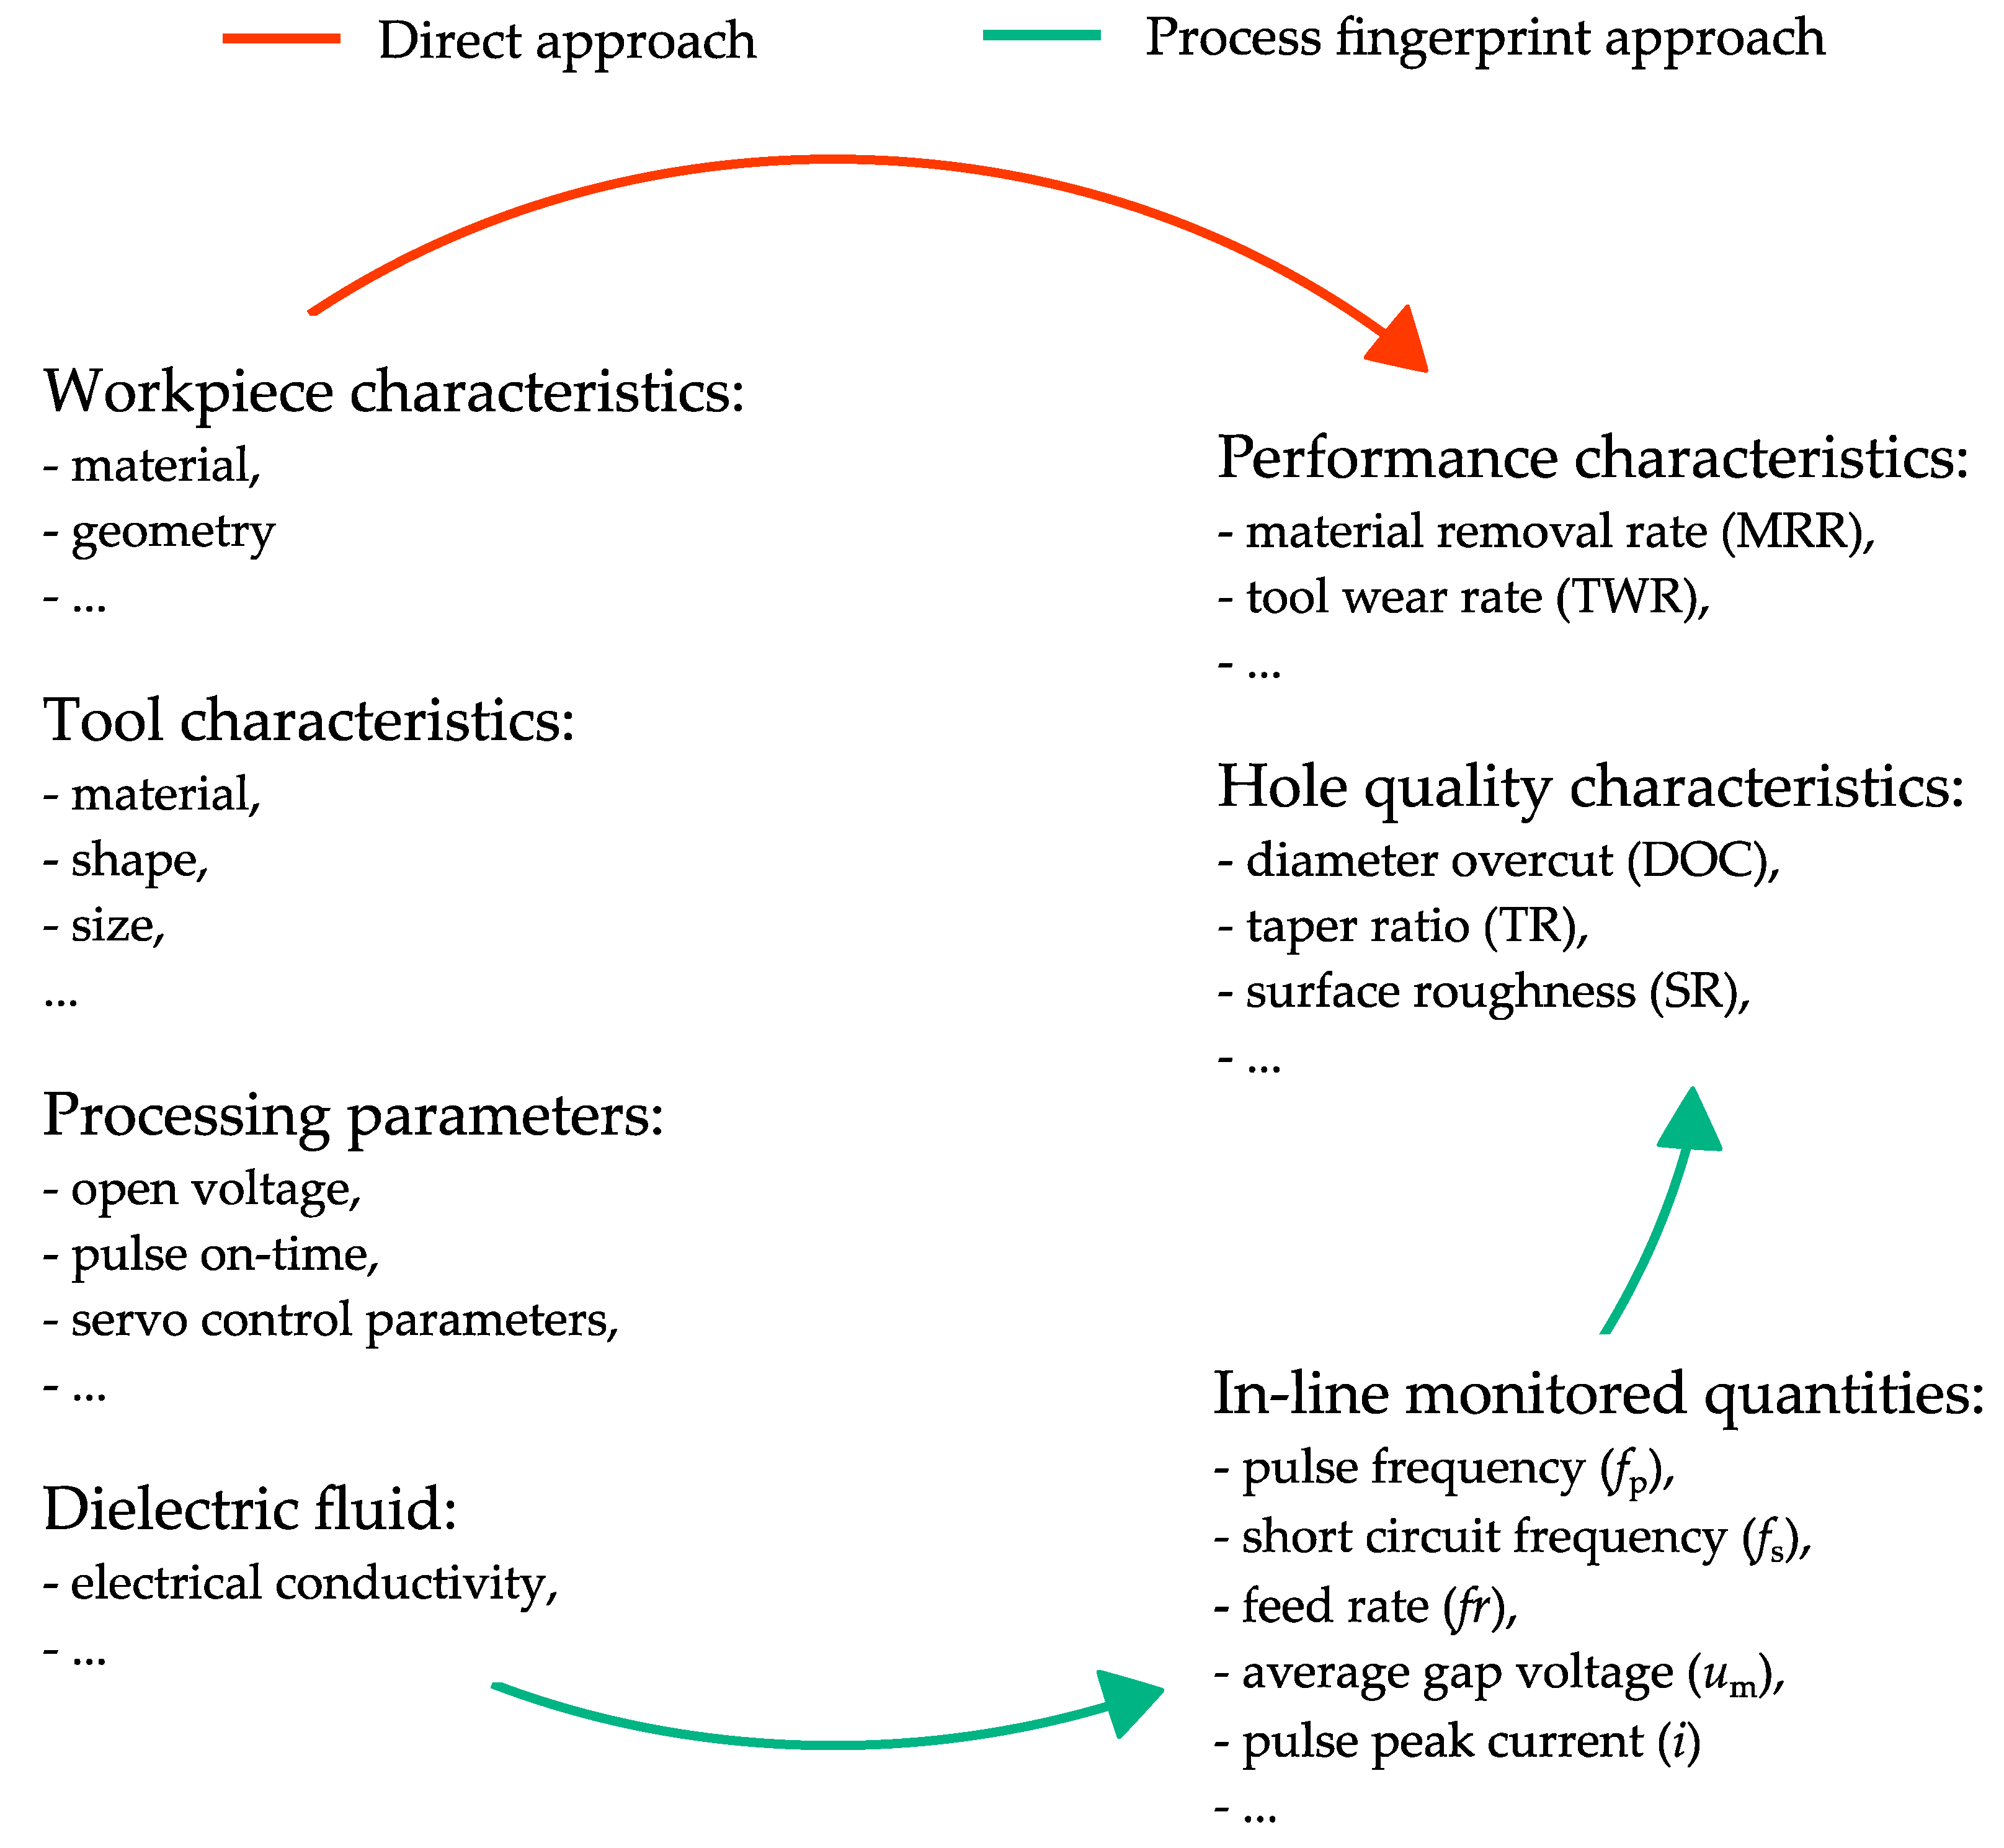
1. Introduction
2. Materials and Methods
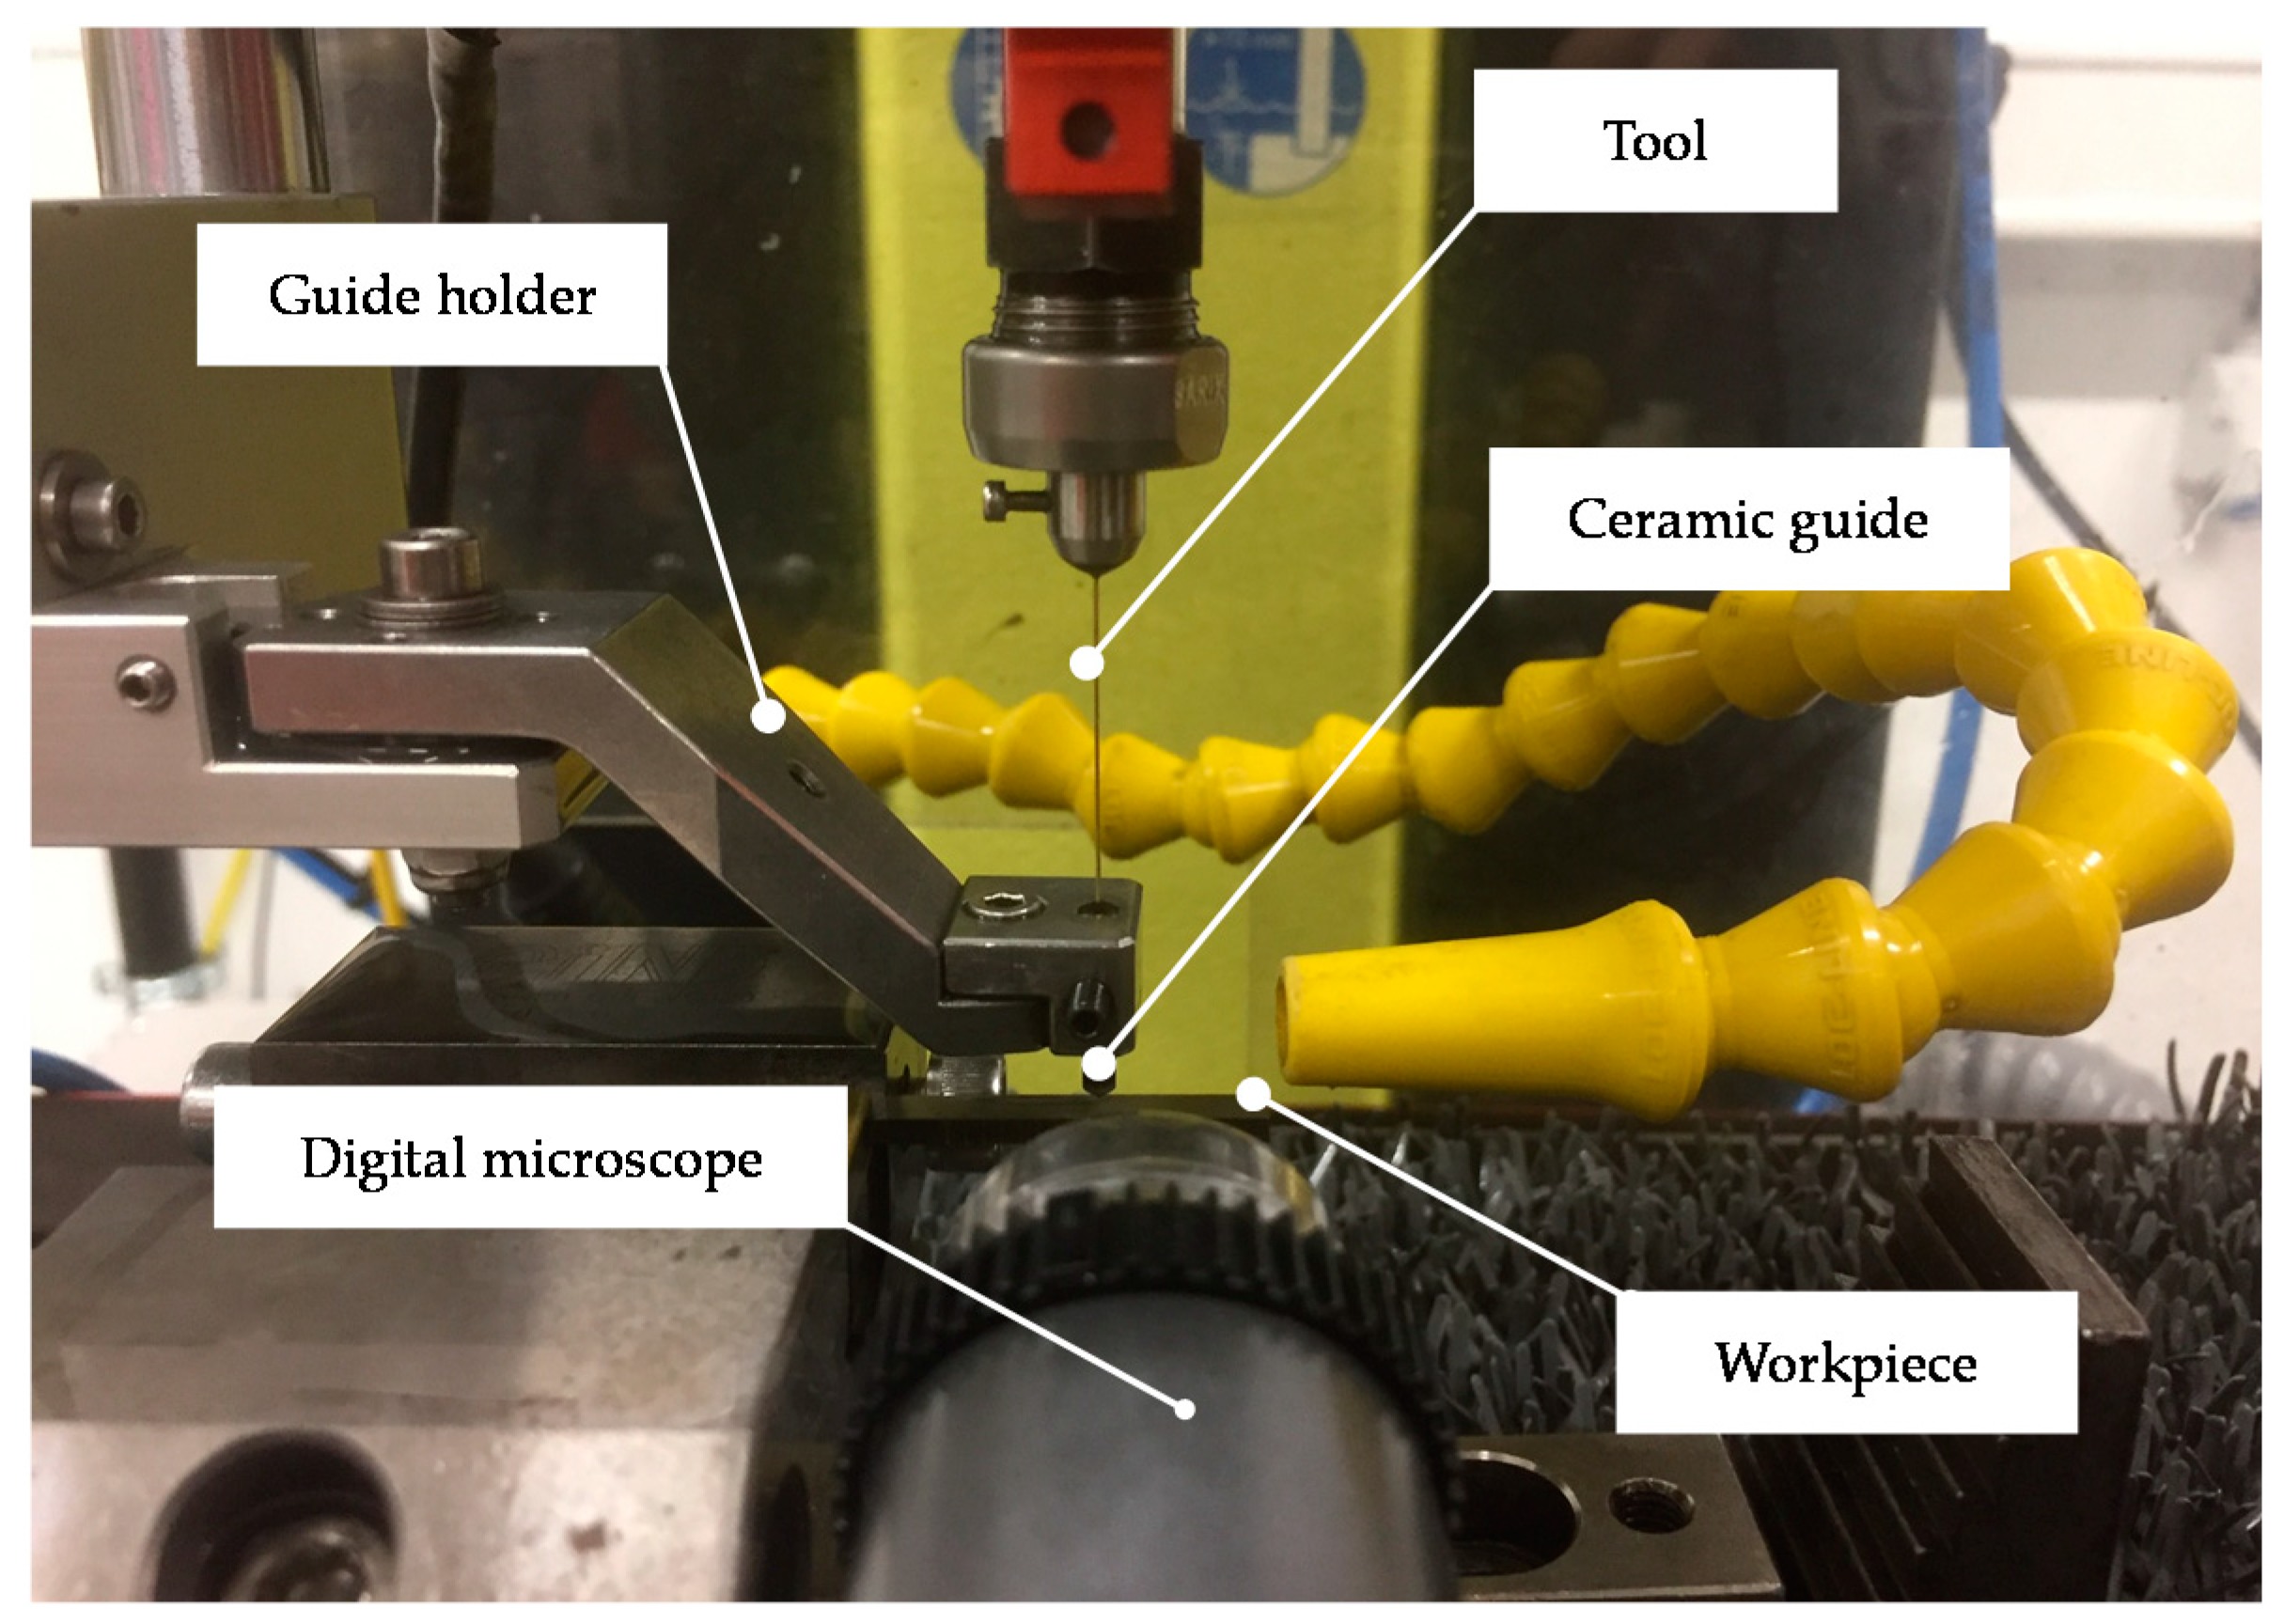
2.1. Experimental Setup
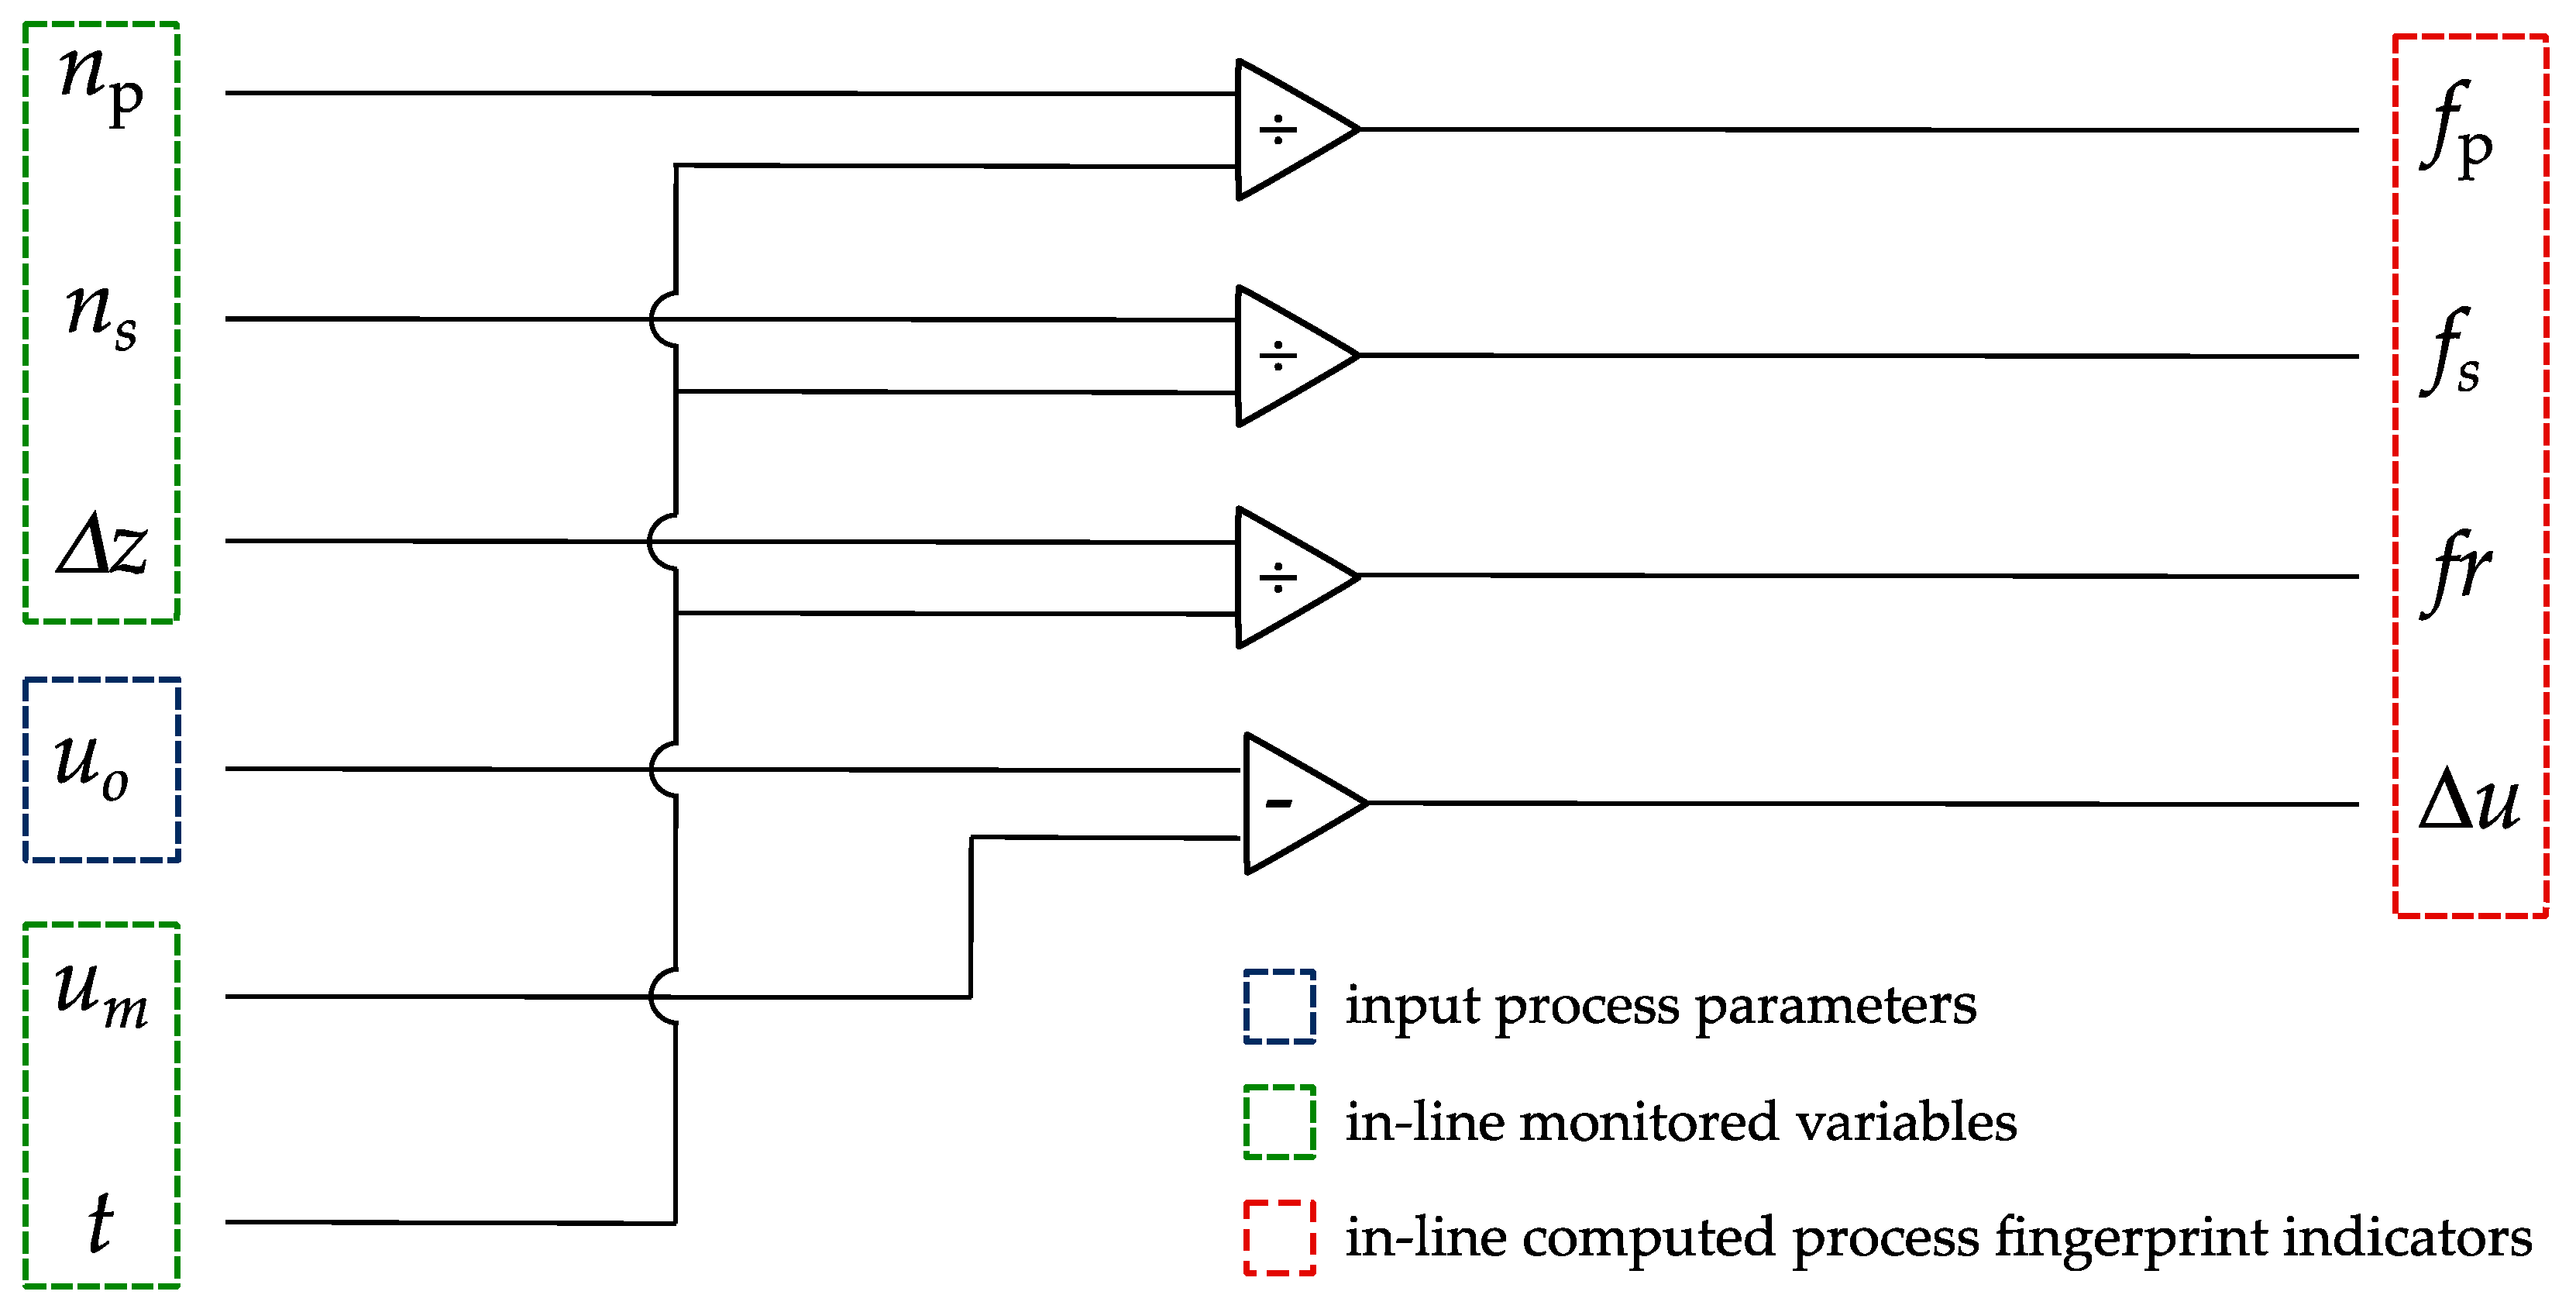
2.2. Process Monitoring
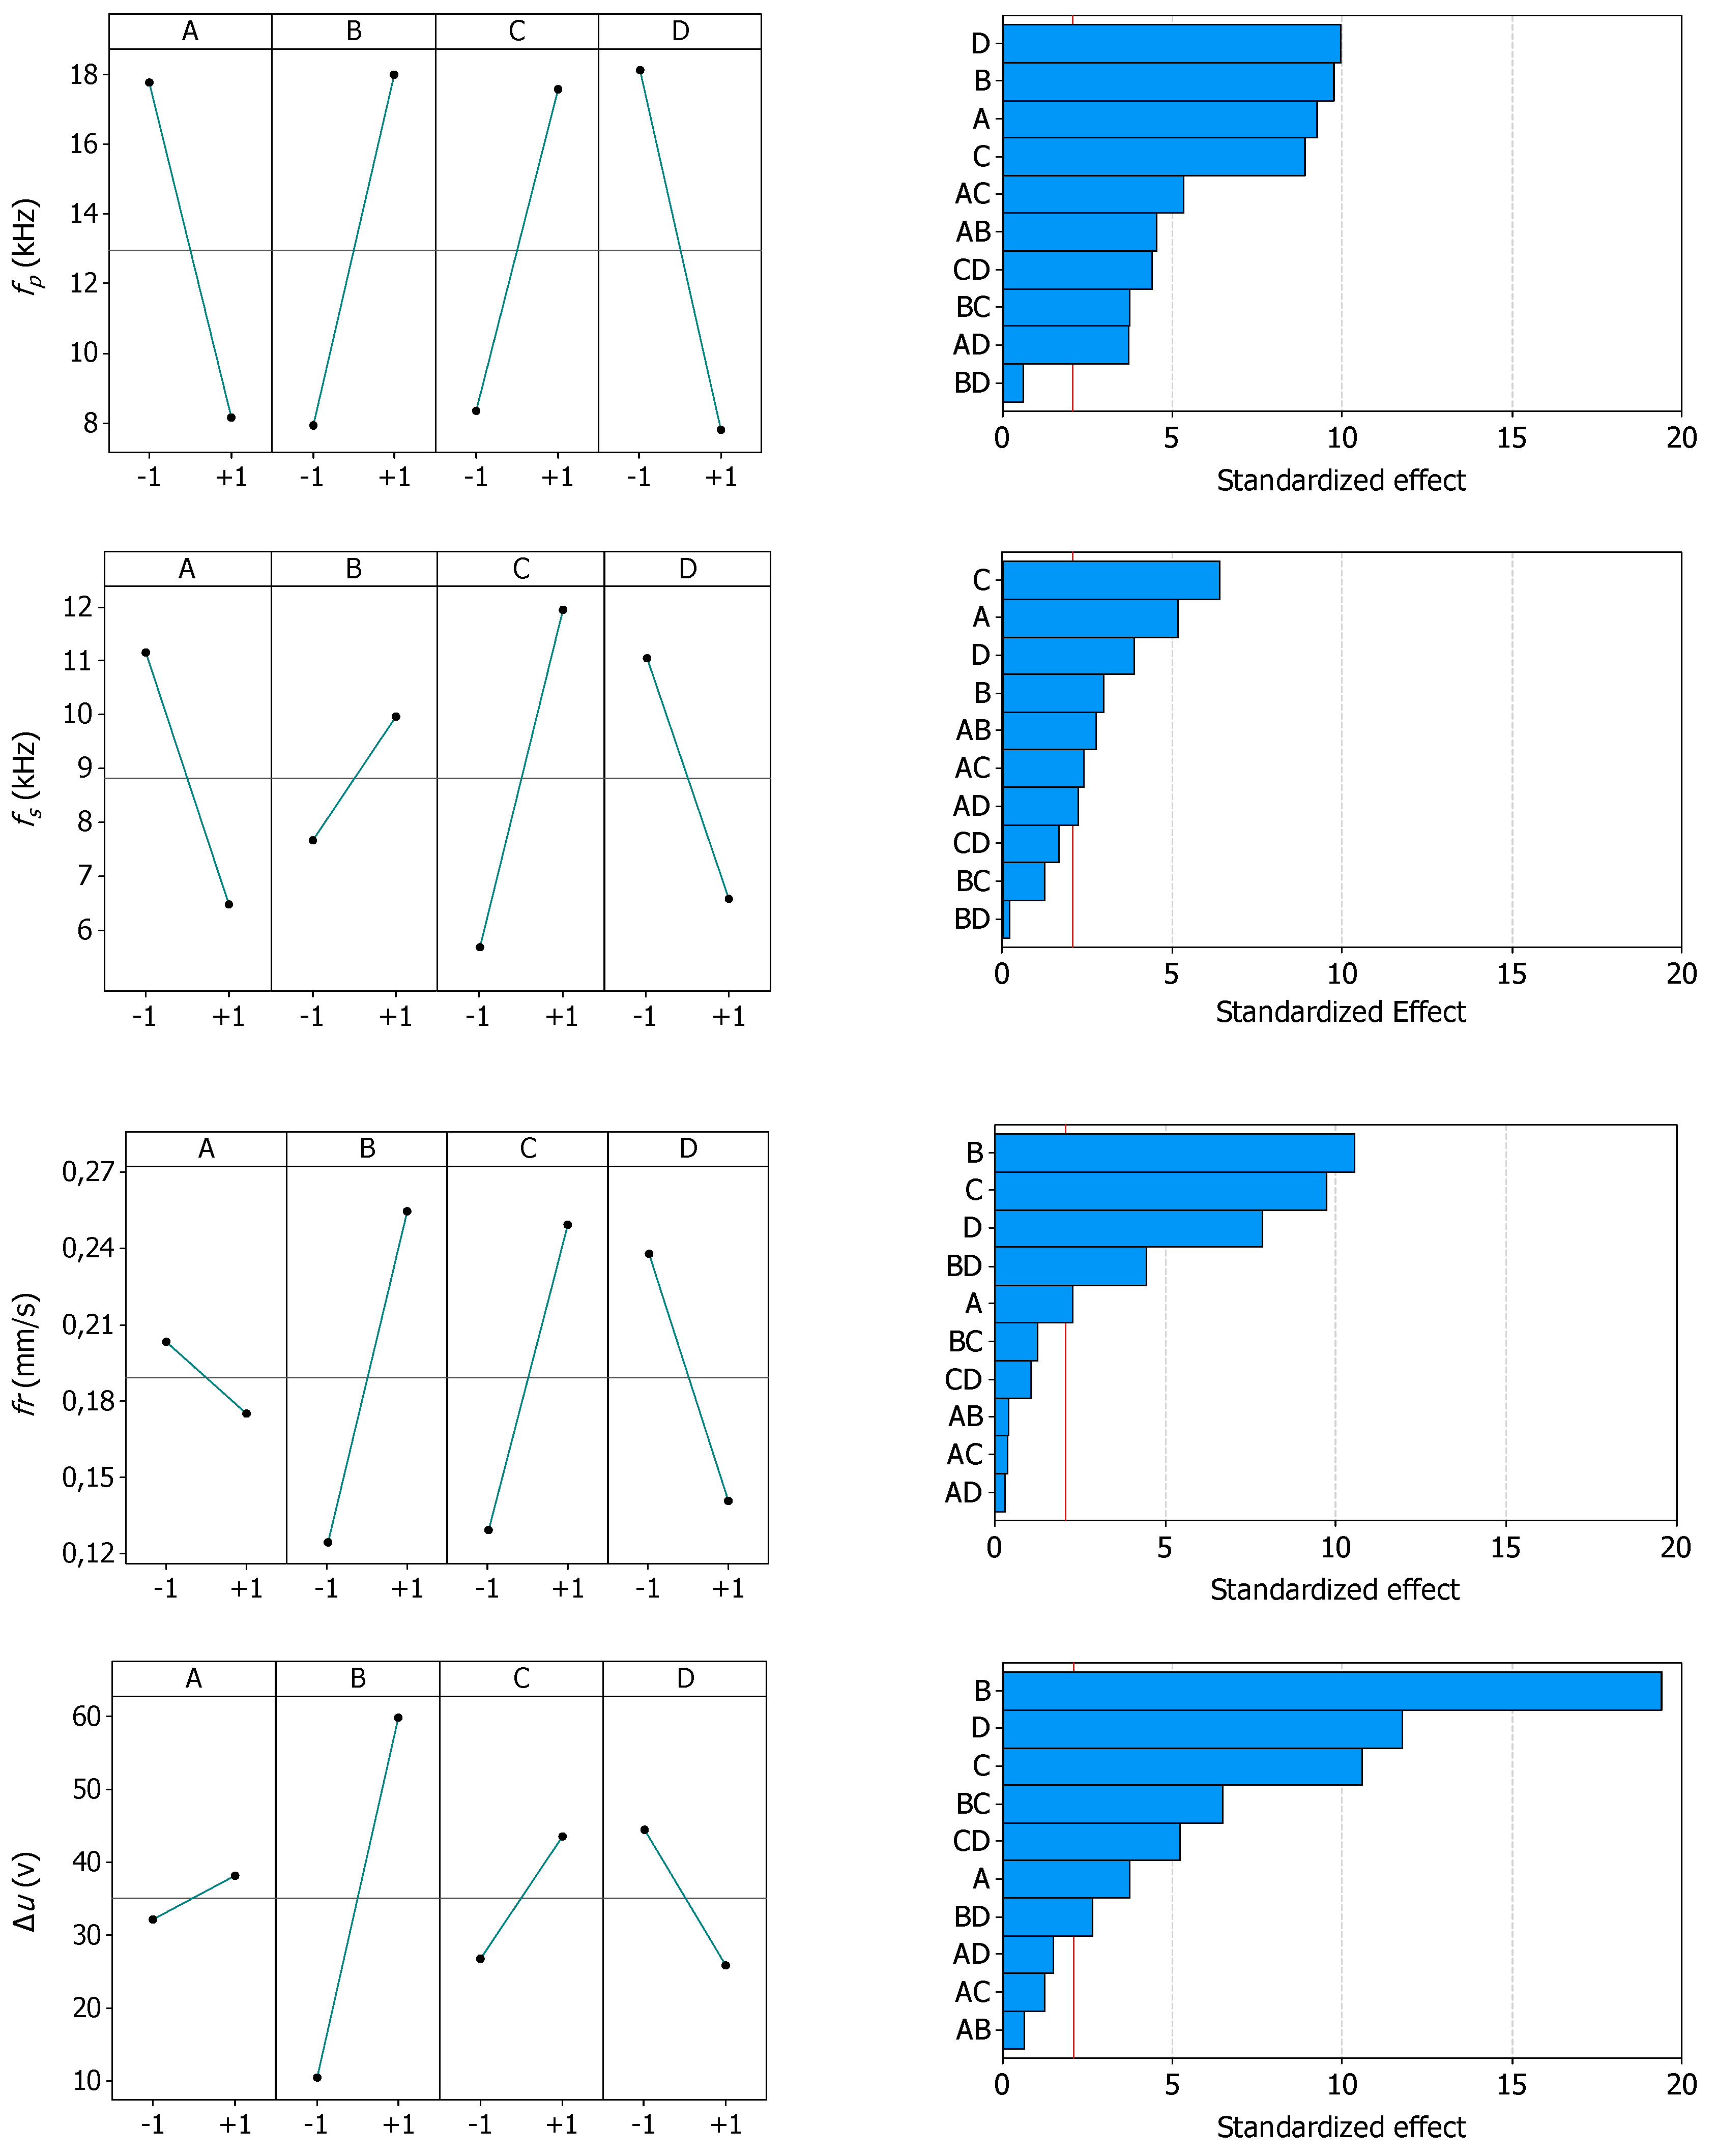
- Pulse frequency (fp): The amount of normal discharge pulses per time unit,
- Short circuit frequency (fs): The amount of short circuits and arcs per time unit,
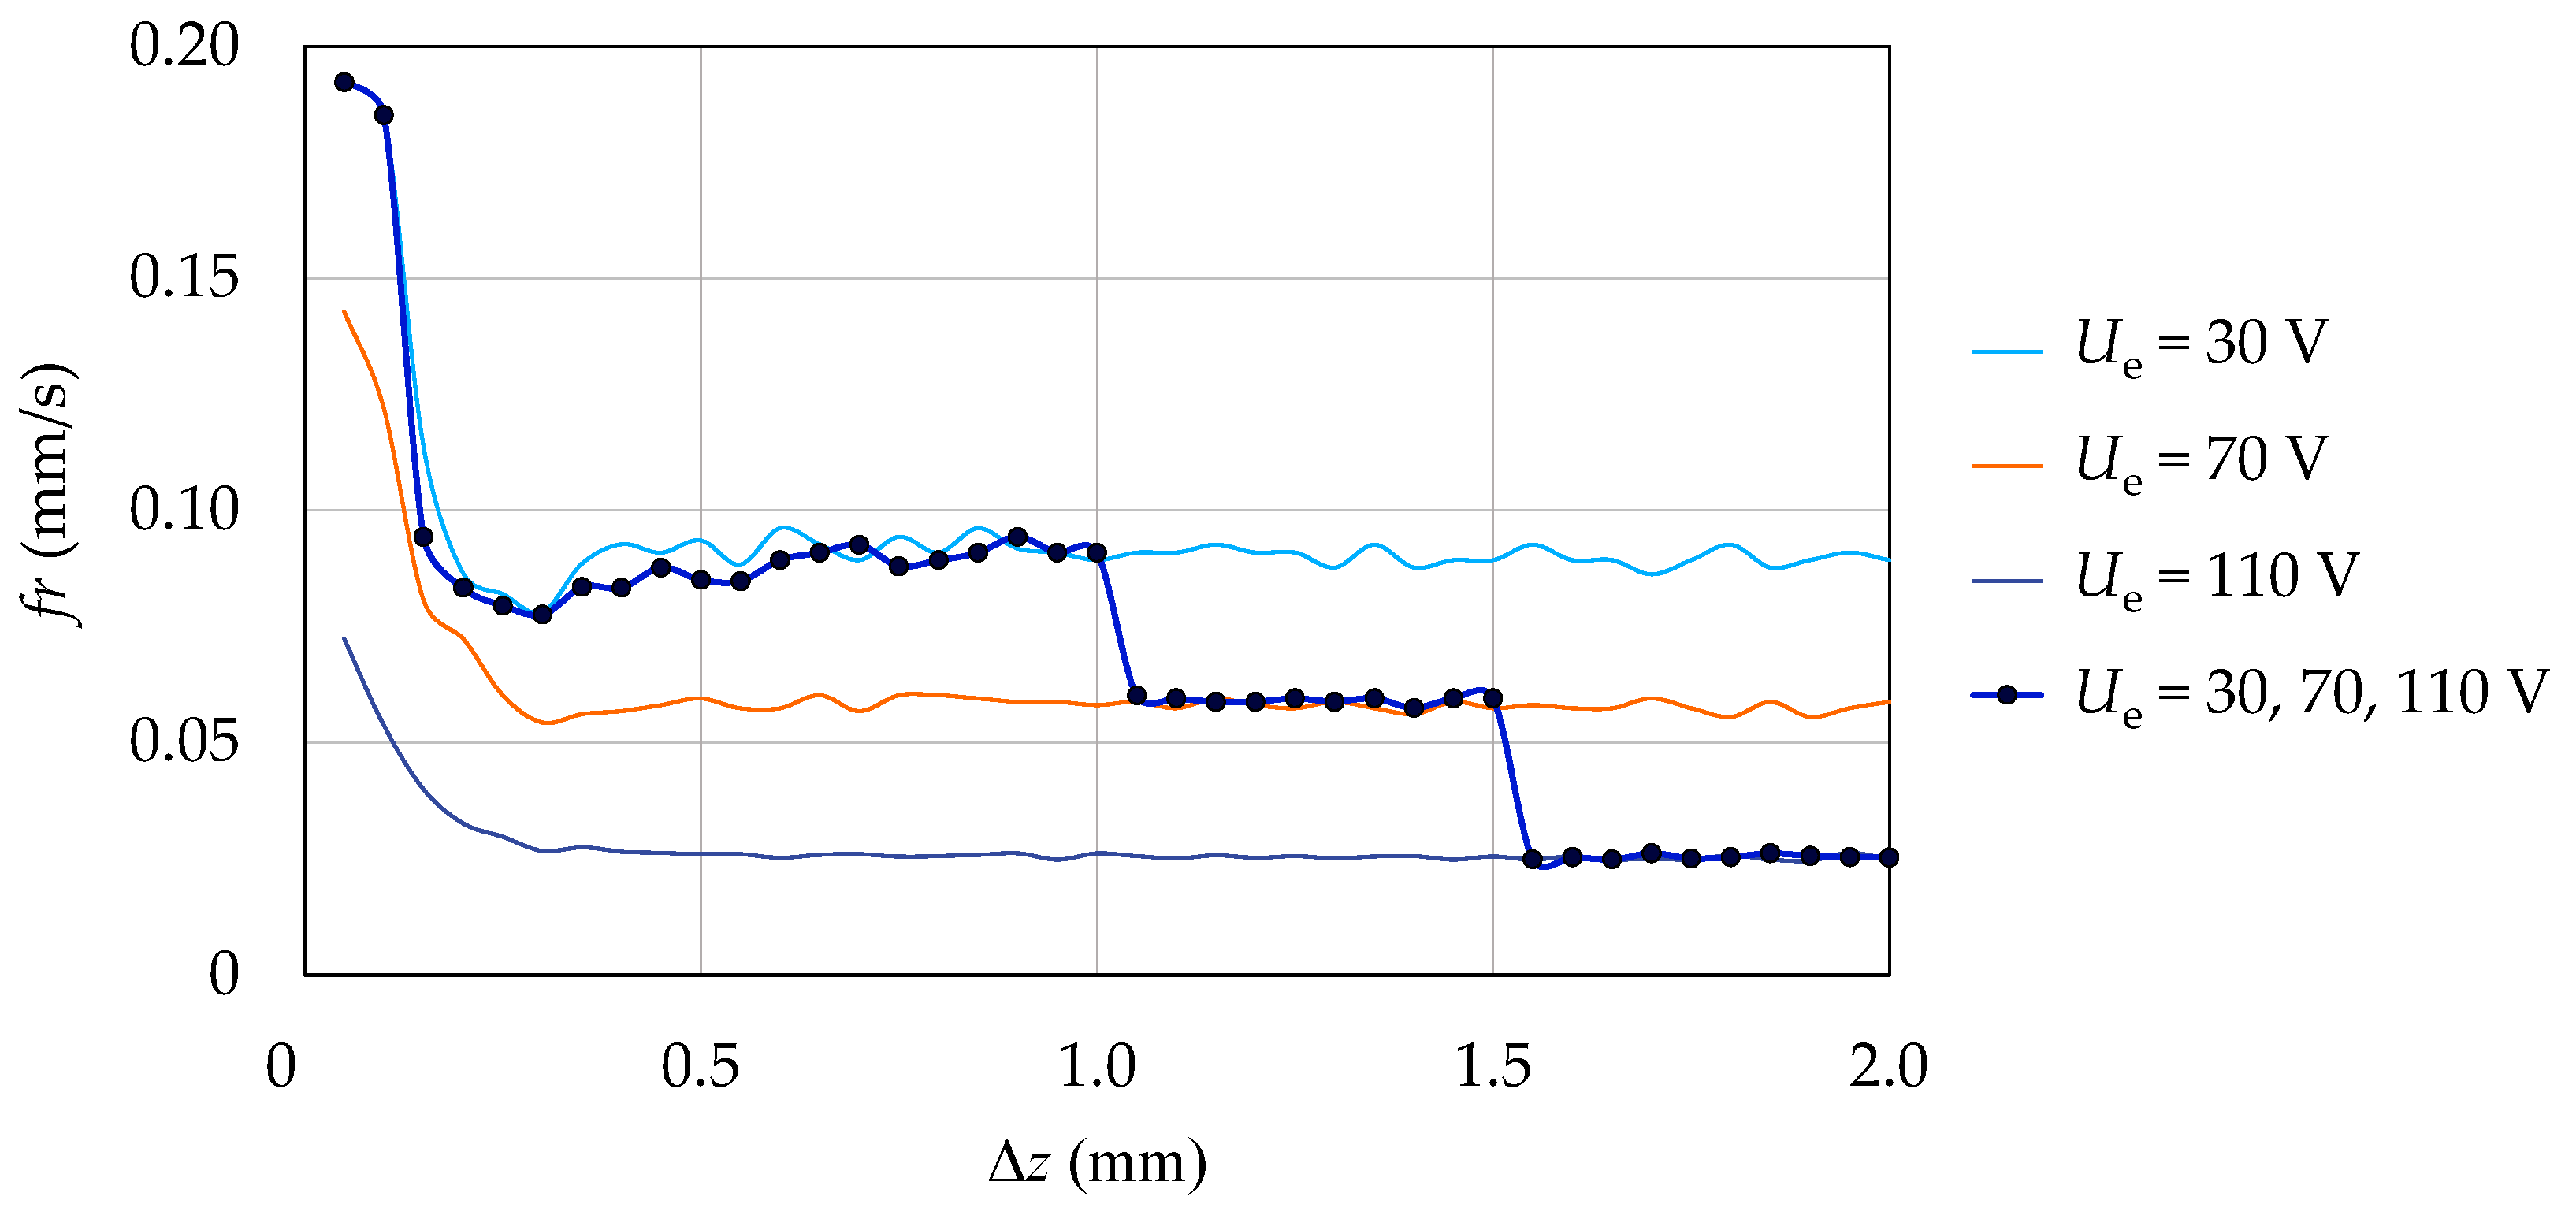
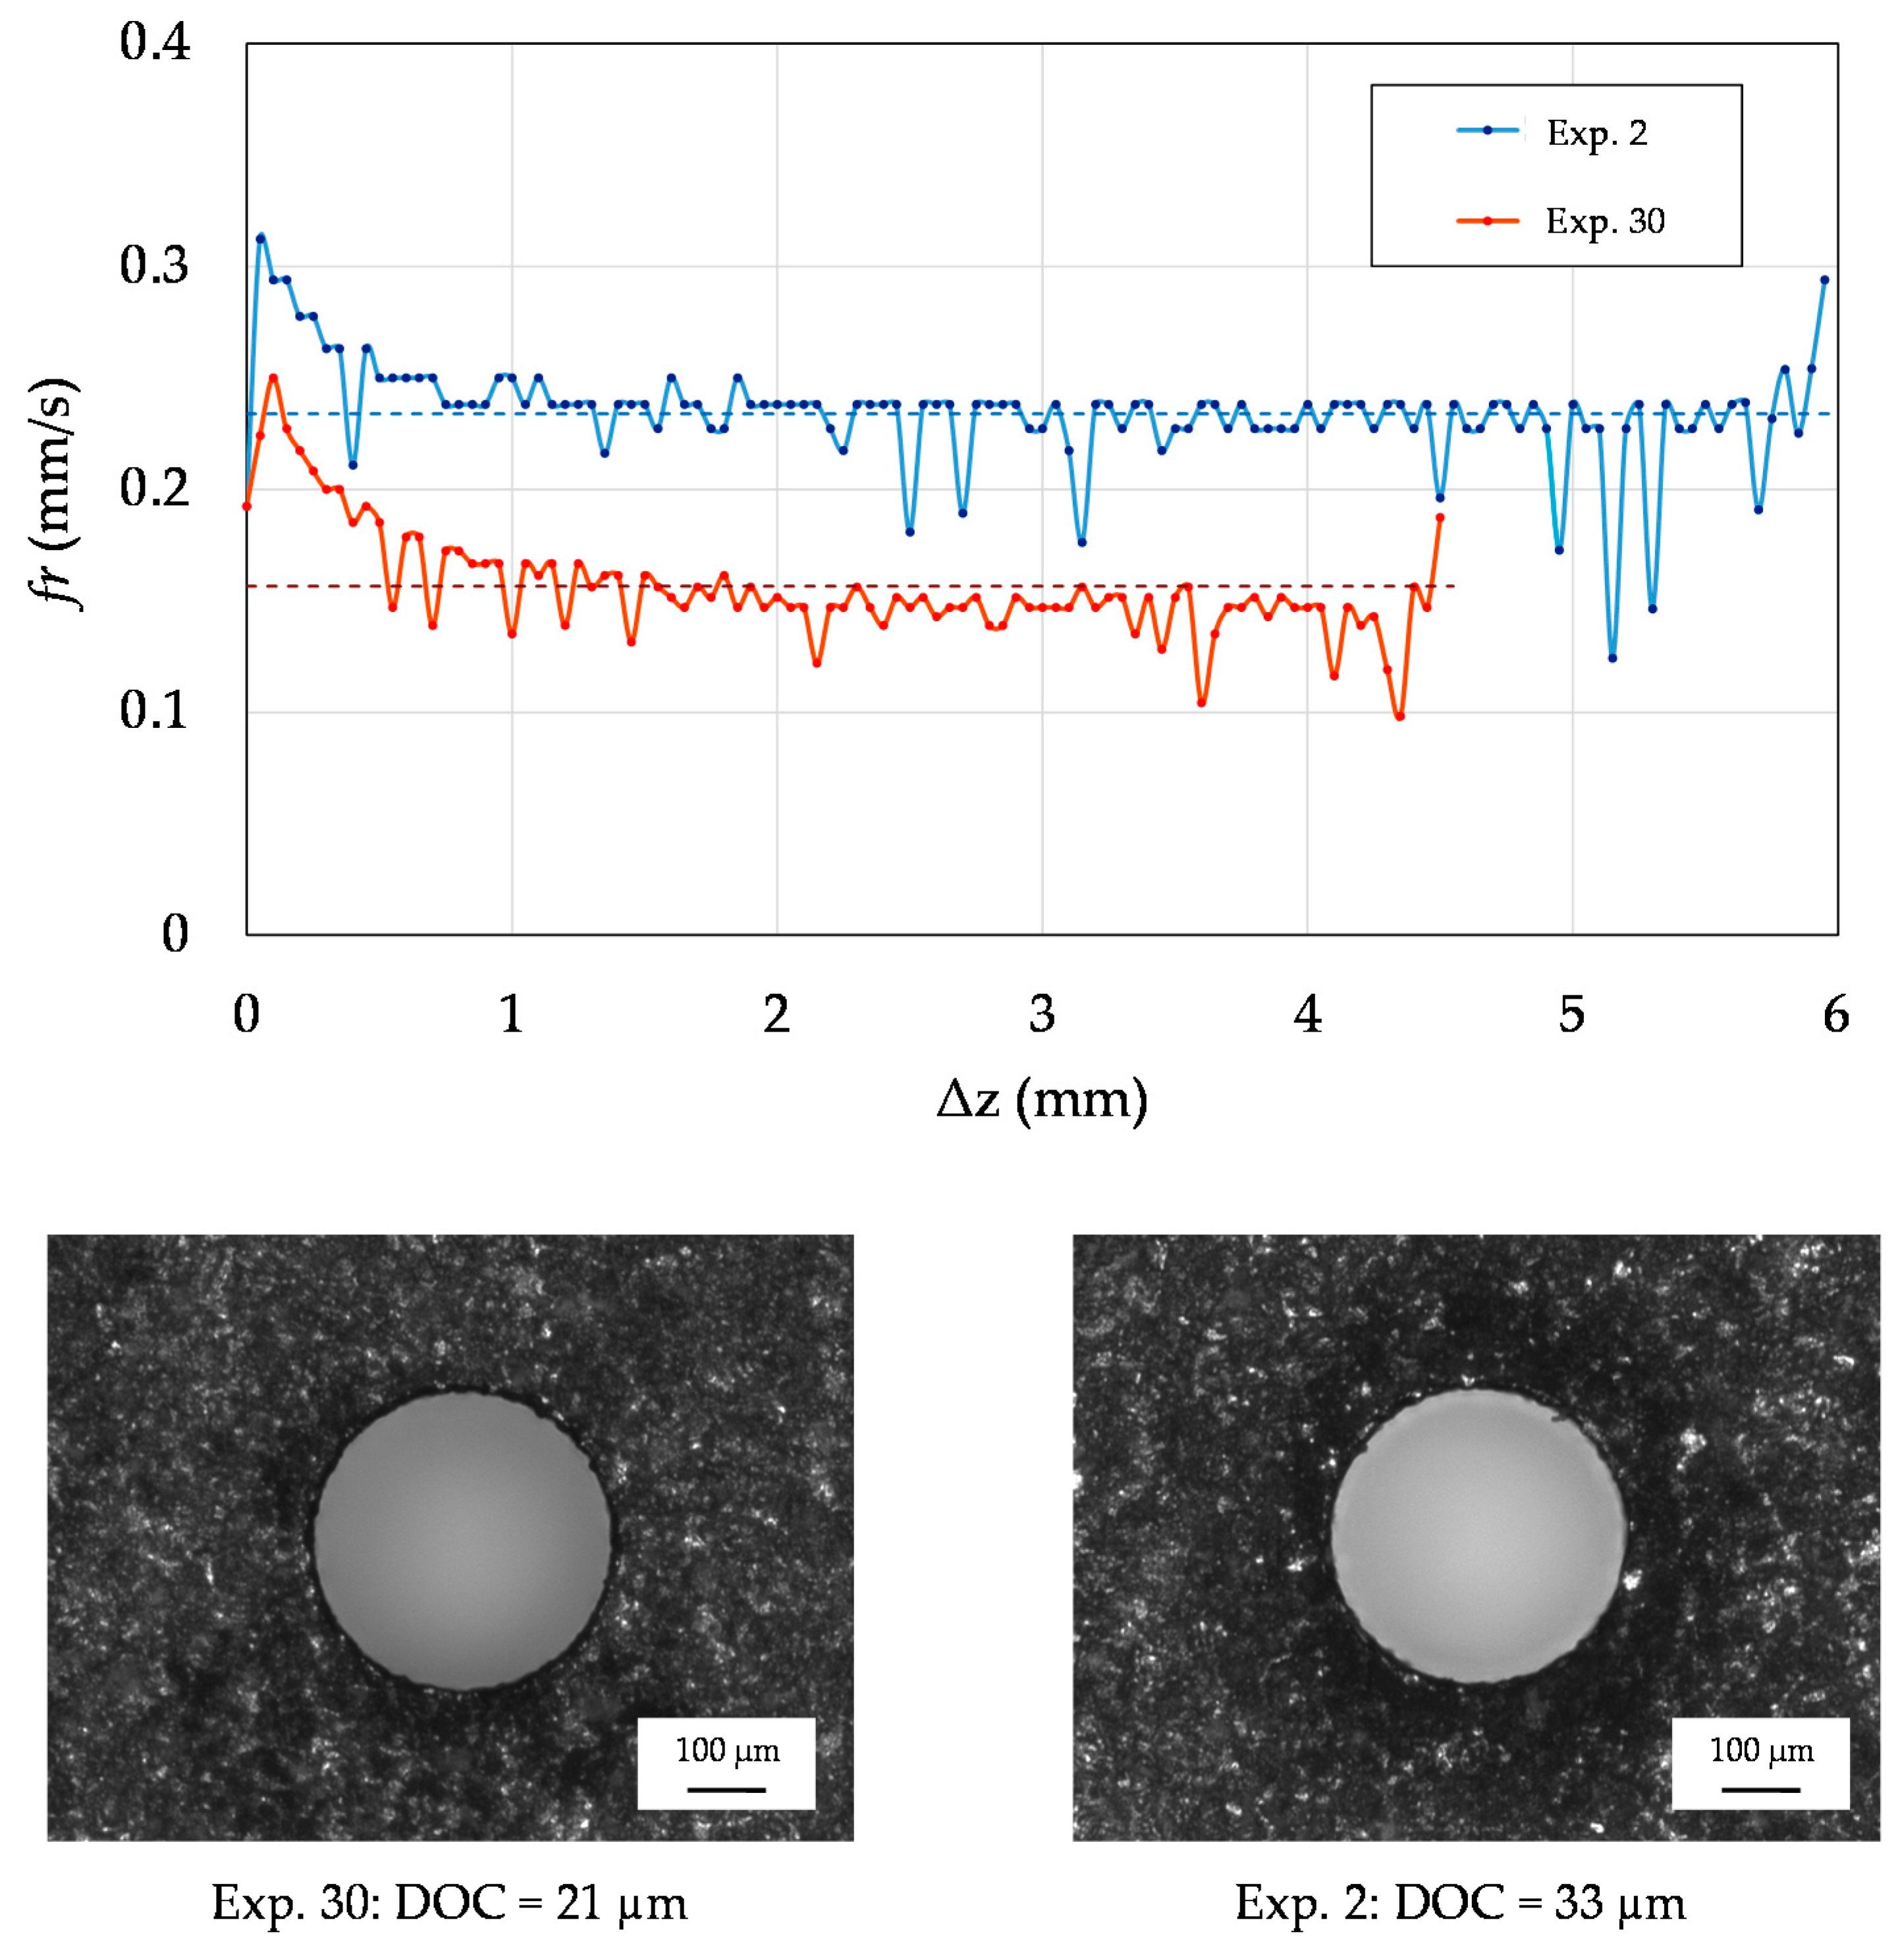
- Feed rate (fr): The speed at which the tool electrode is advanced into the workpiece, and
- Differential gap voltage (Δu): The difference between the open voltage and average gap voltage.
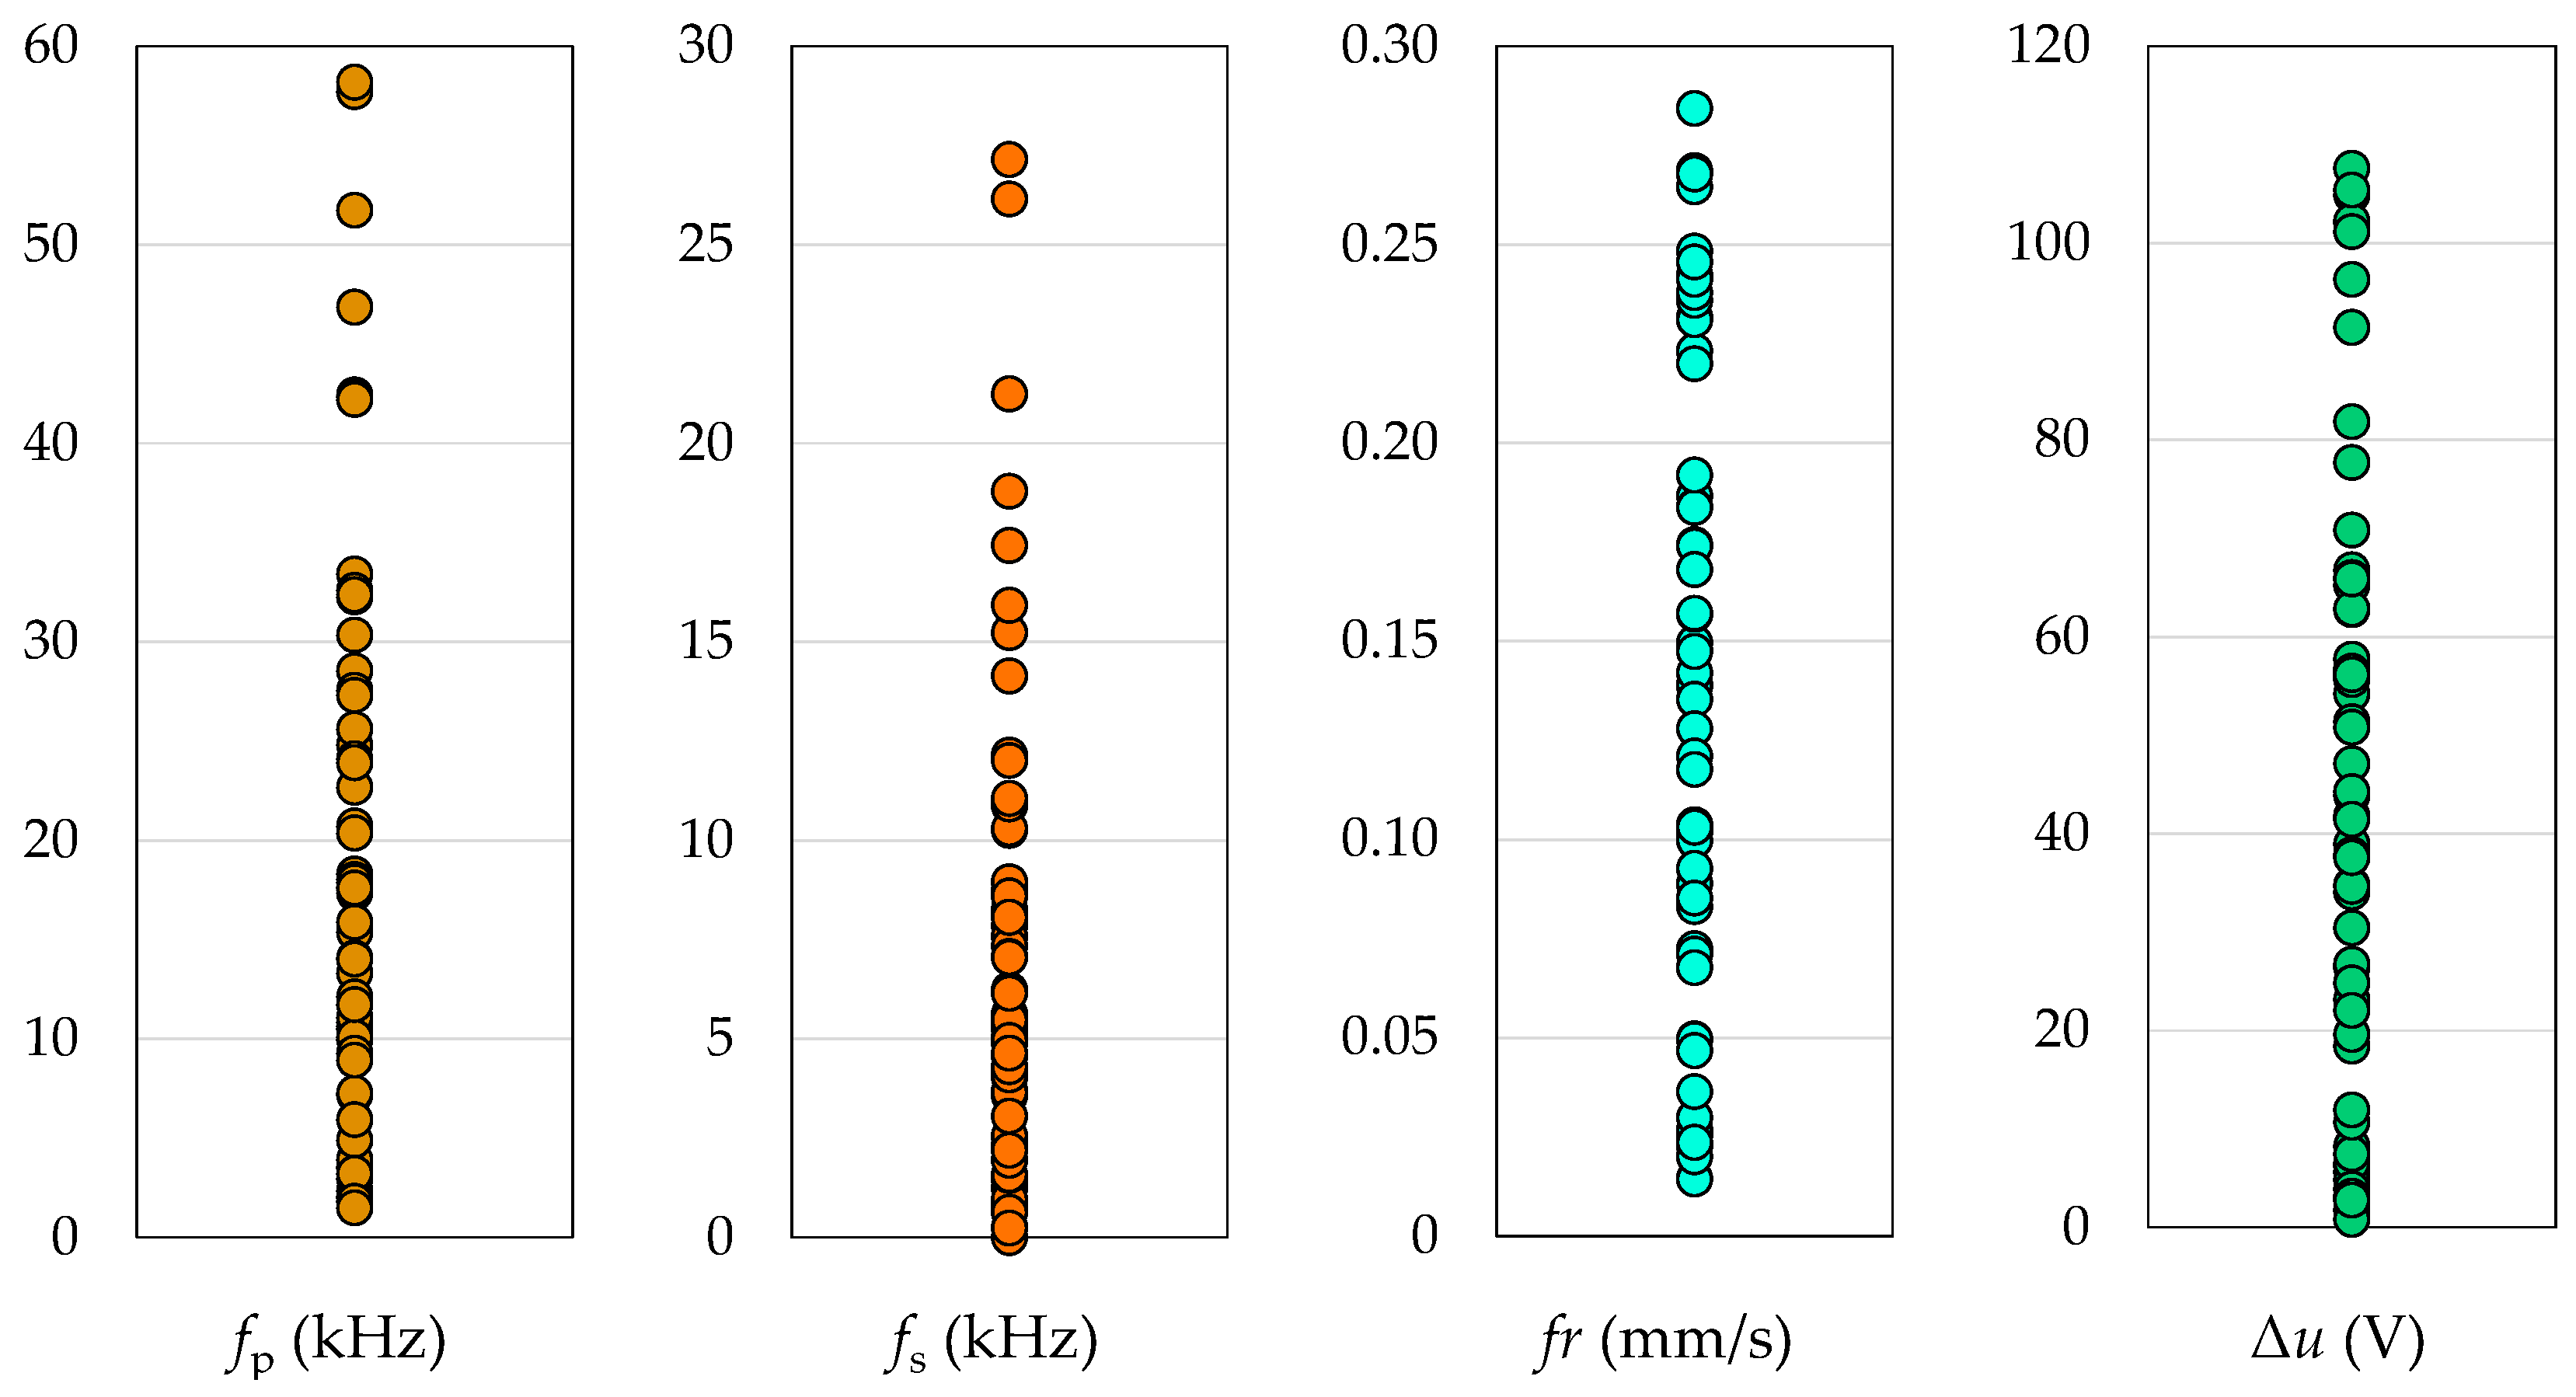
2.3. Process Fingerprint Analysis
3. Results and Discussion
3.1. Sensitivity to Changes to the Processing Parameters
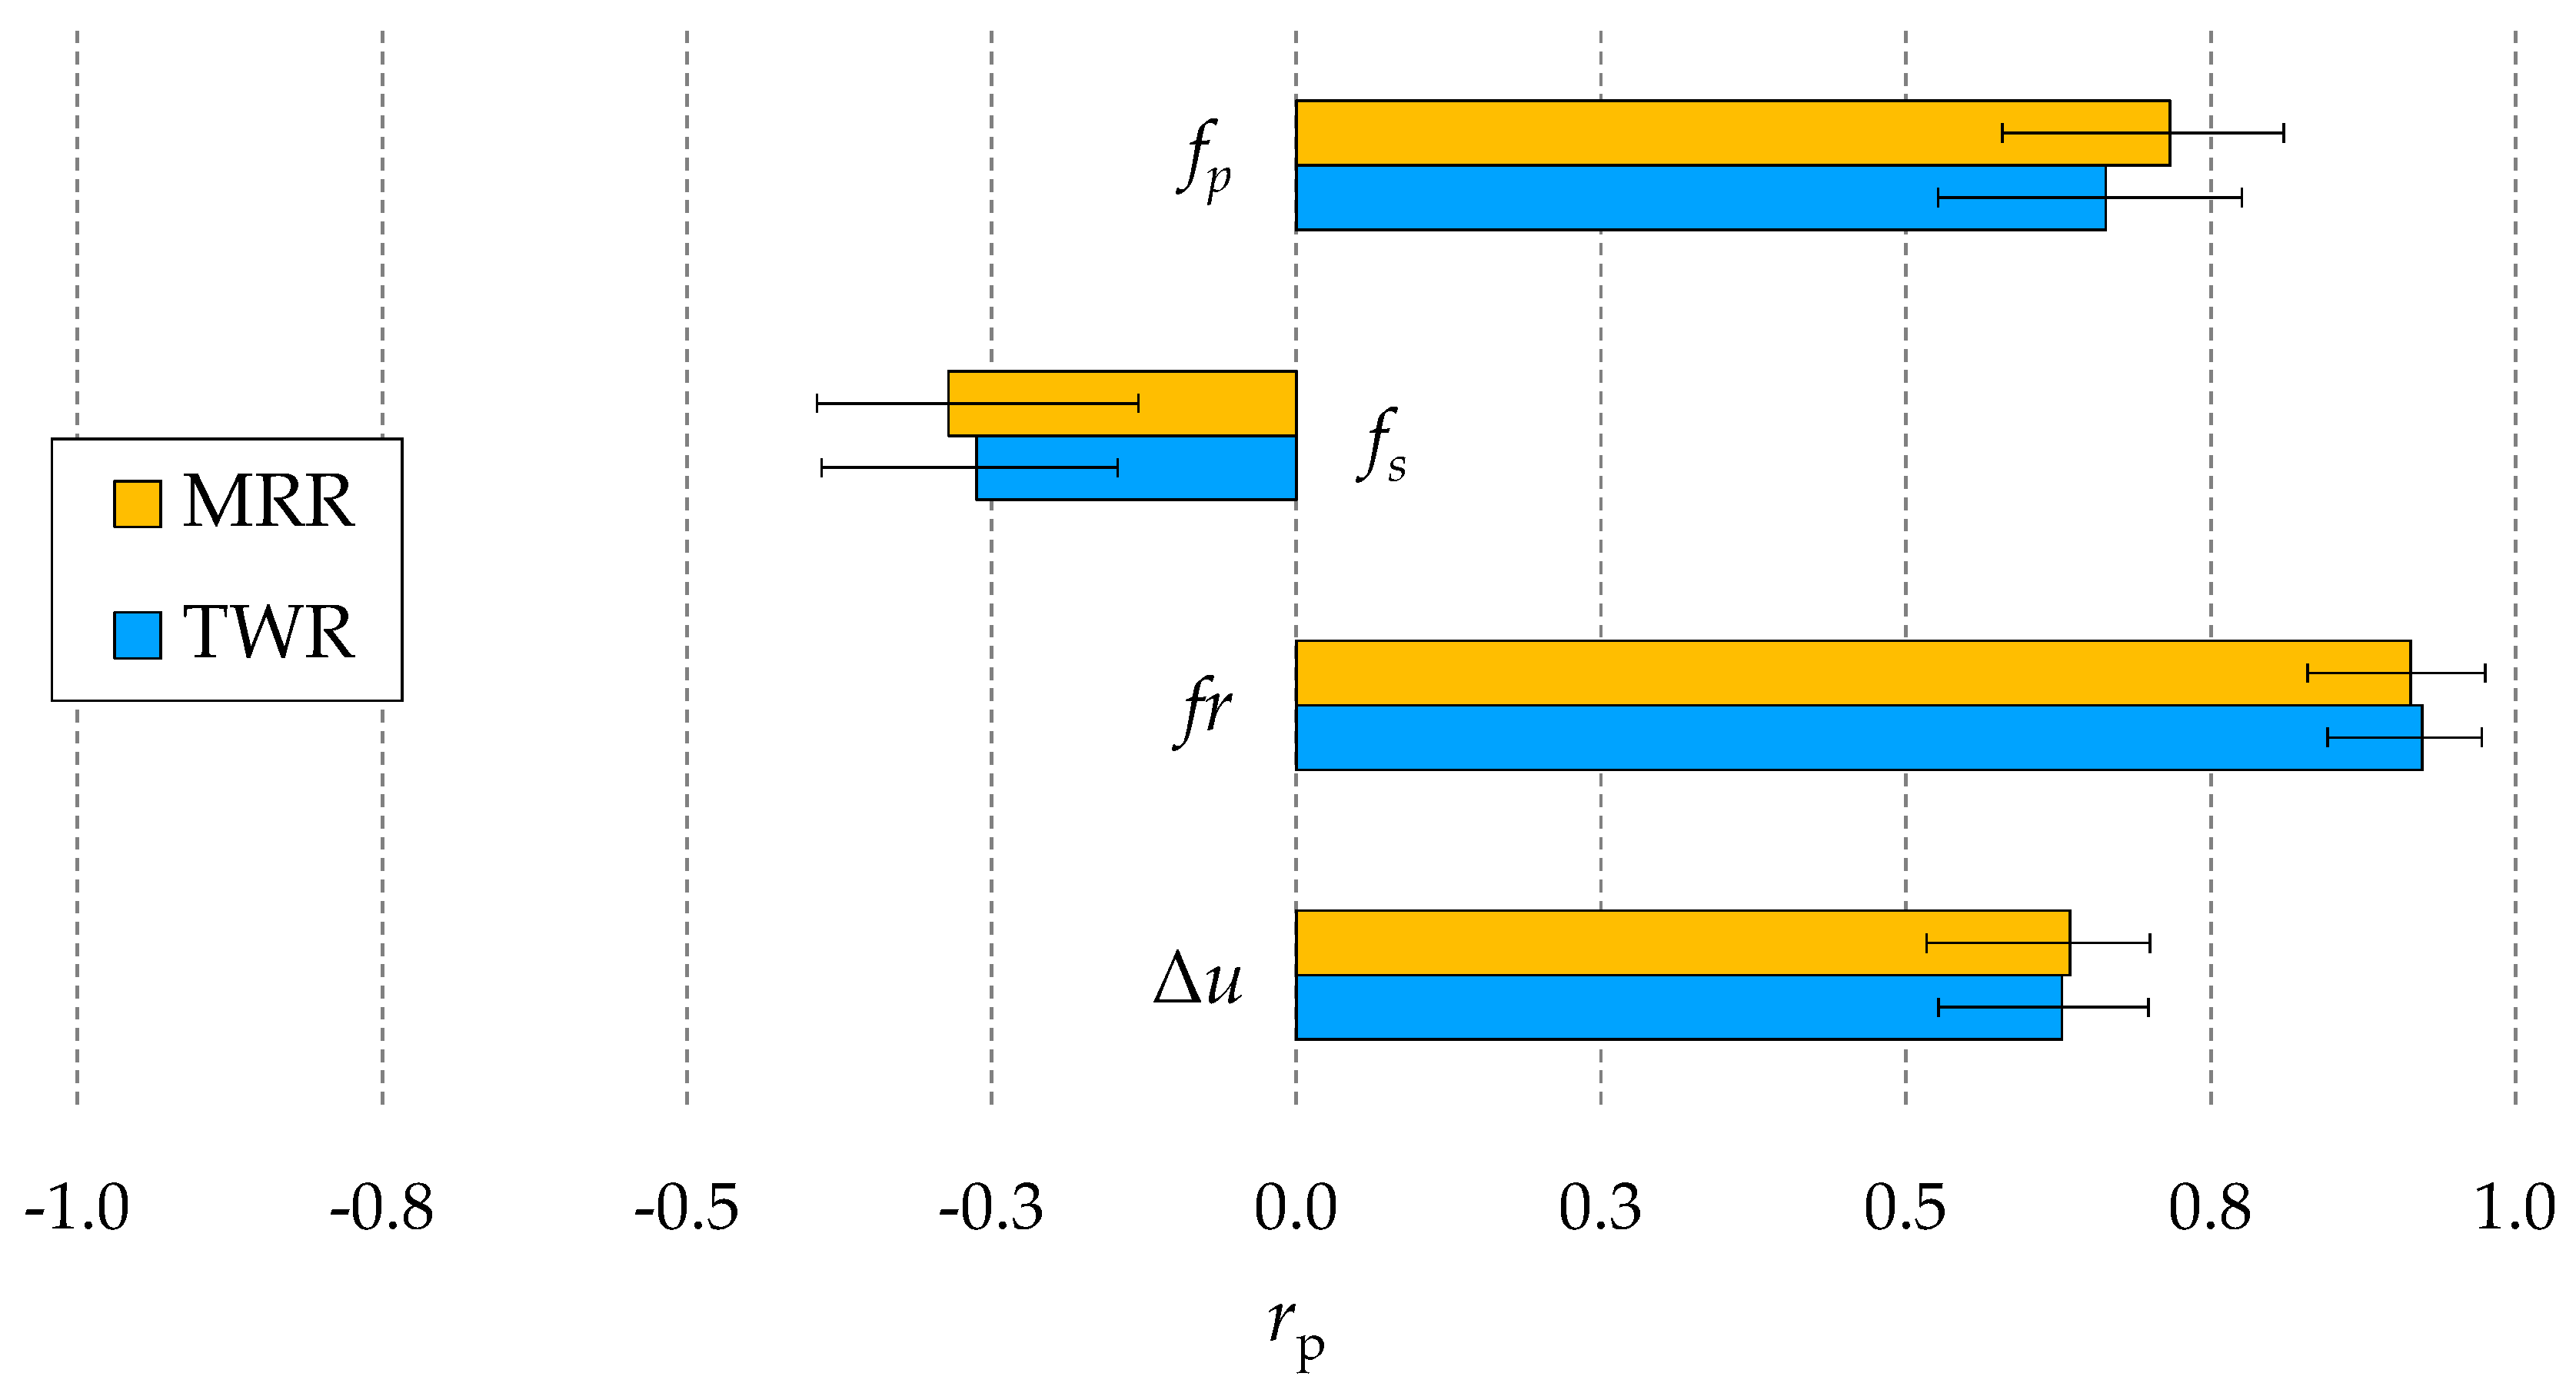
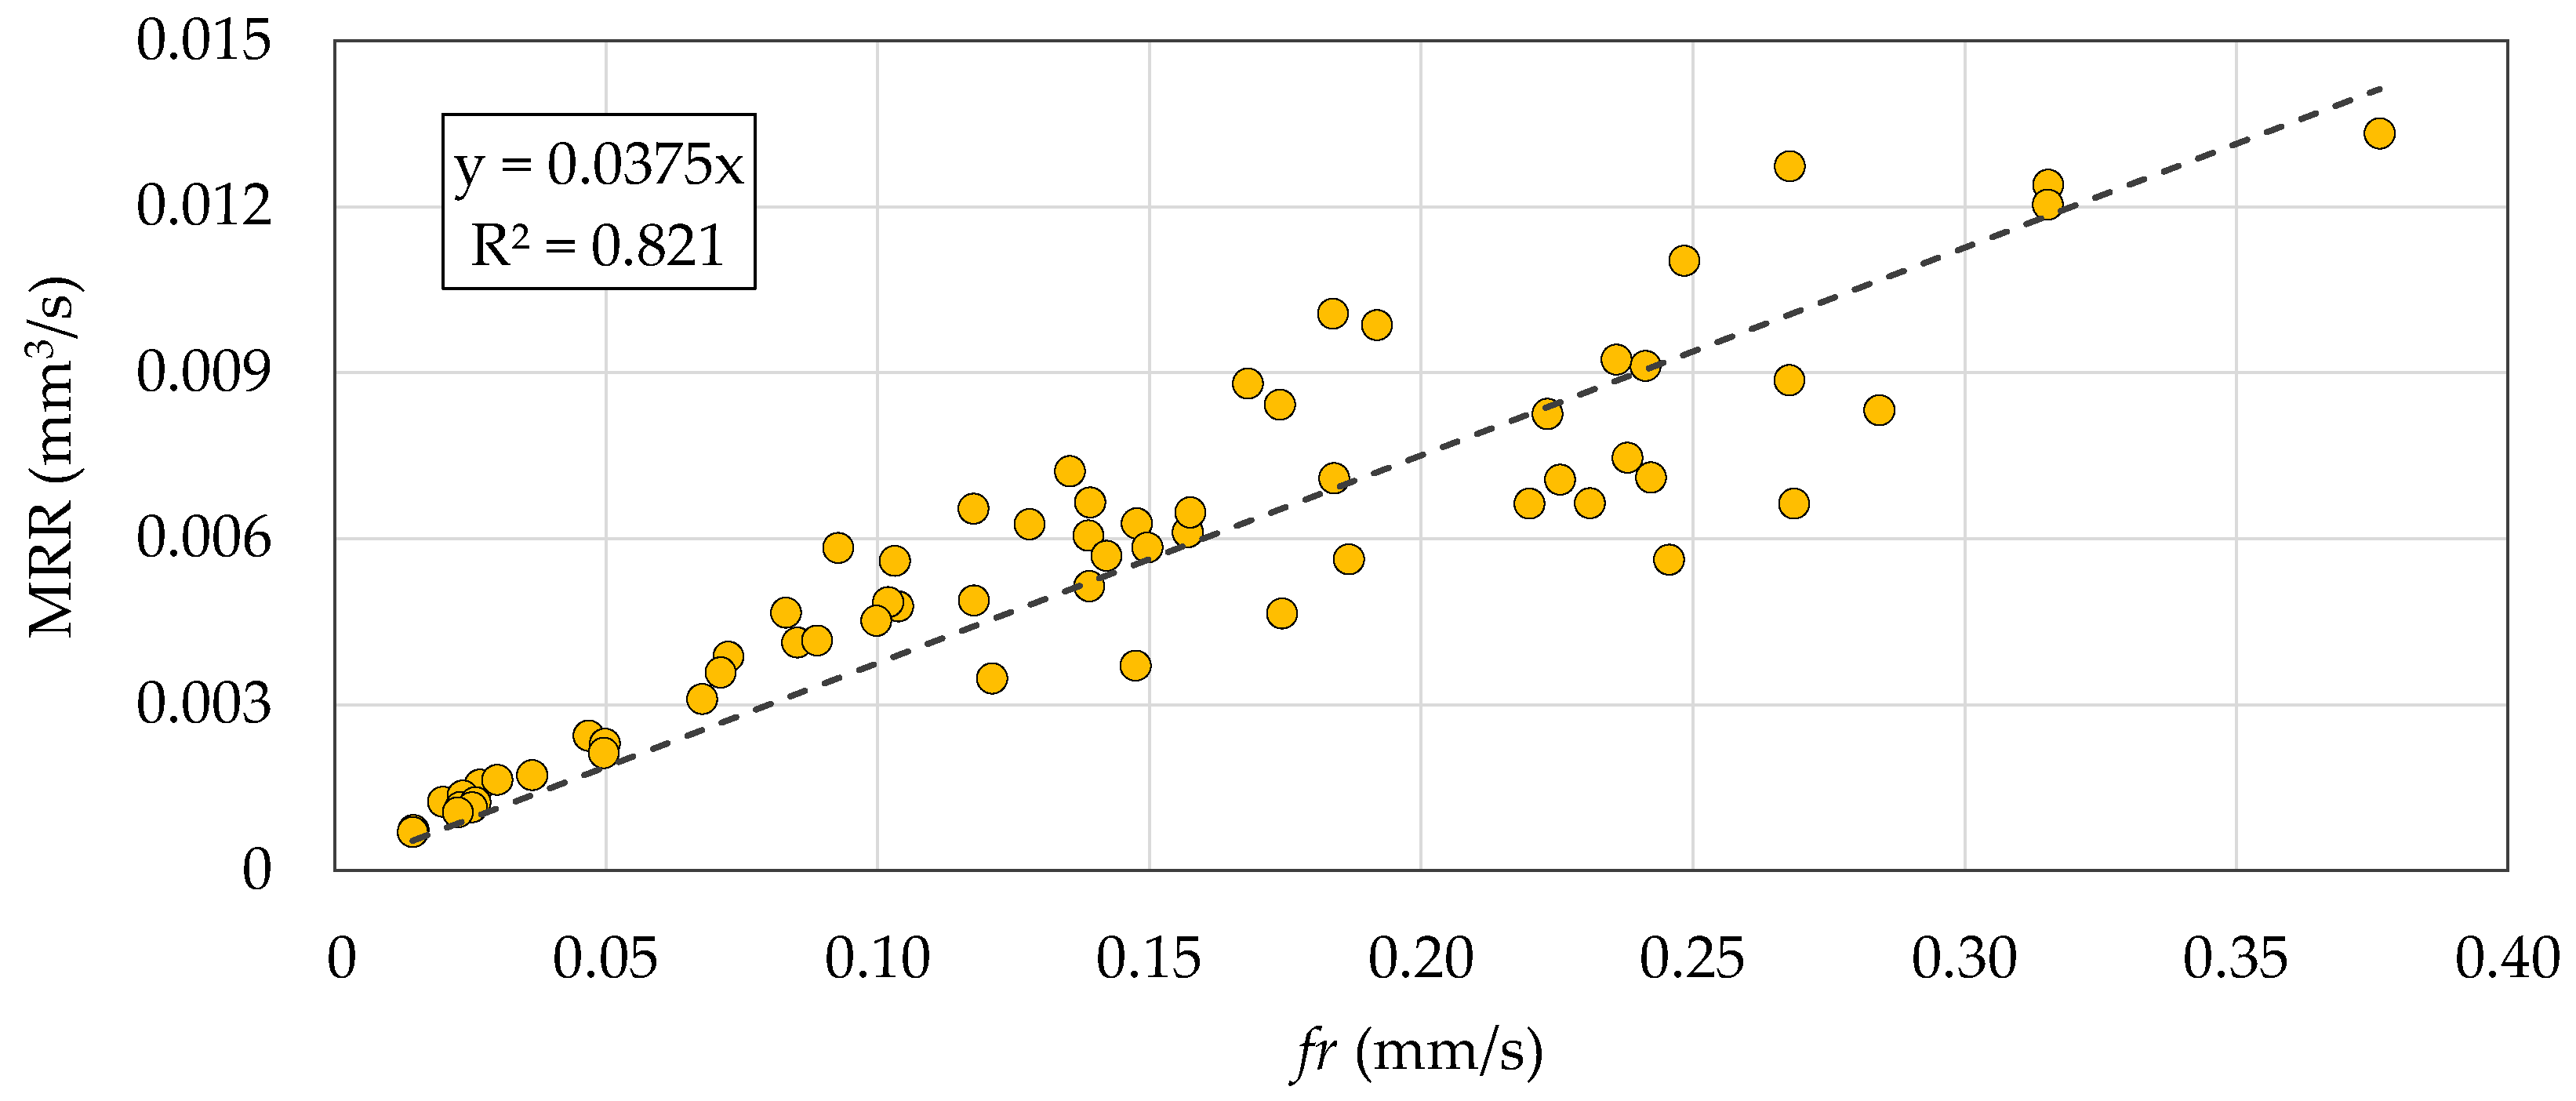
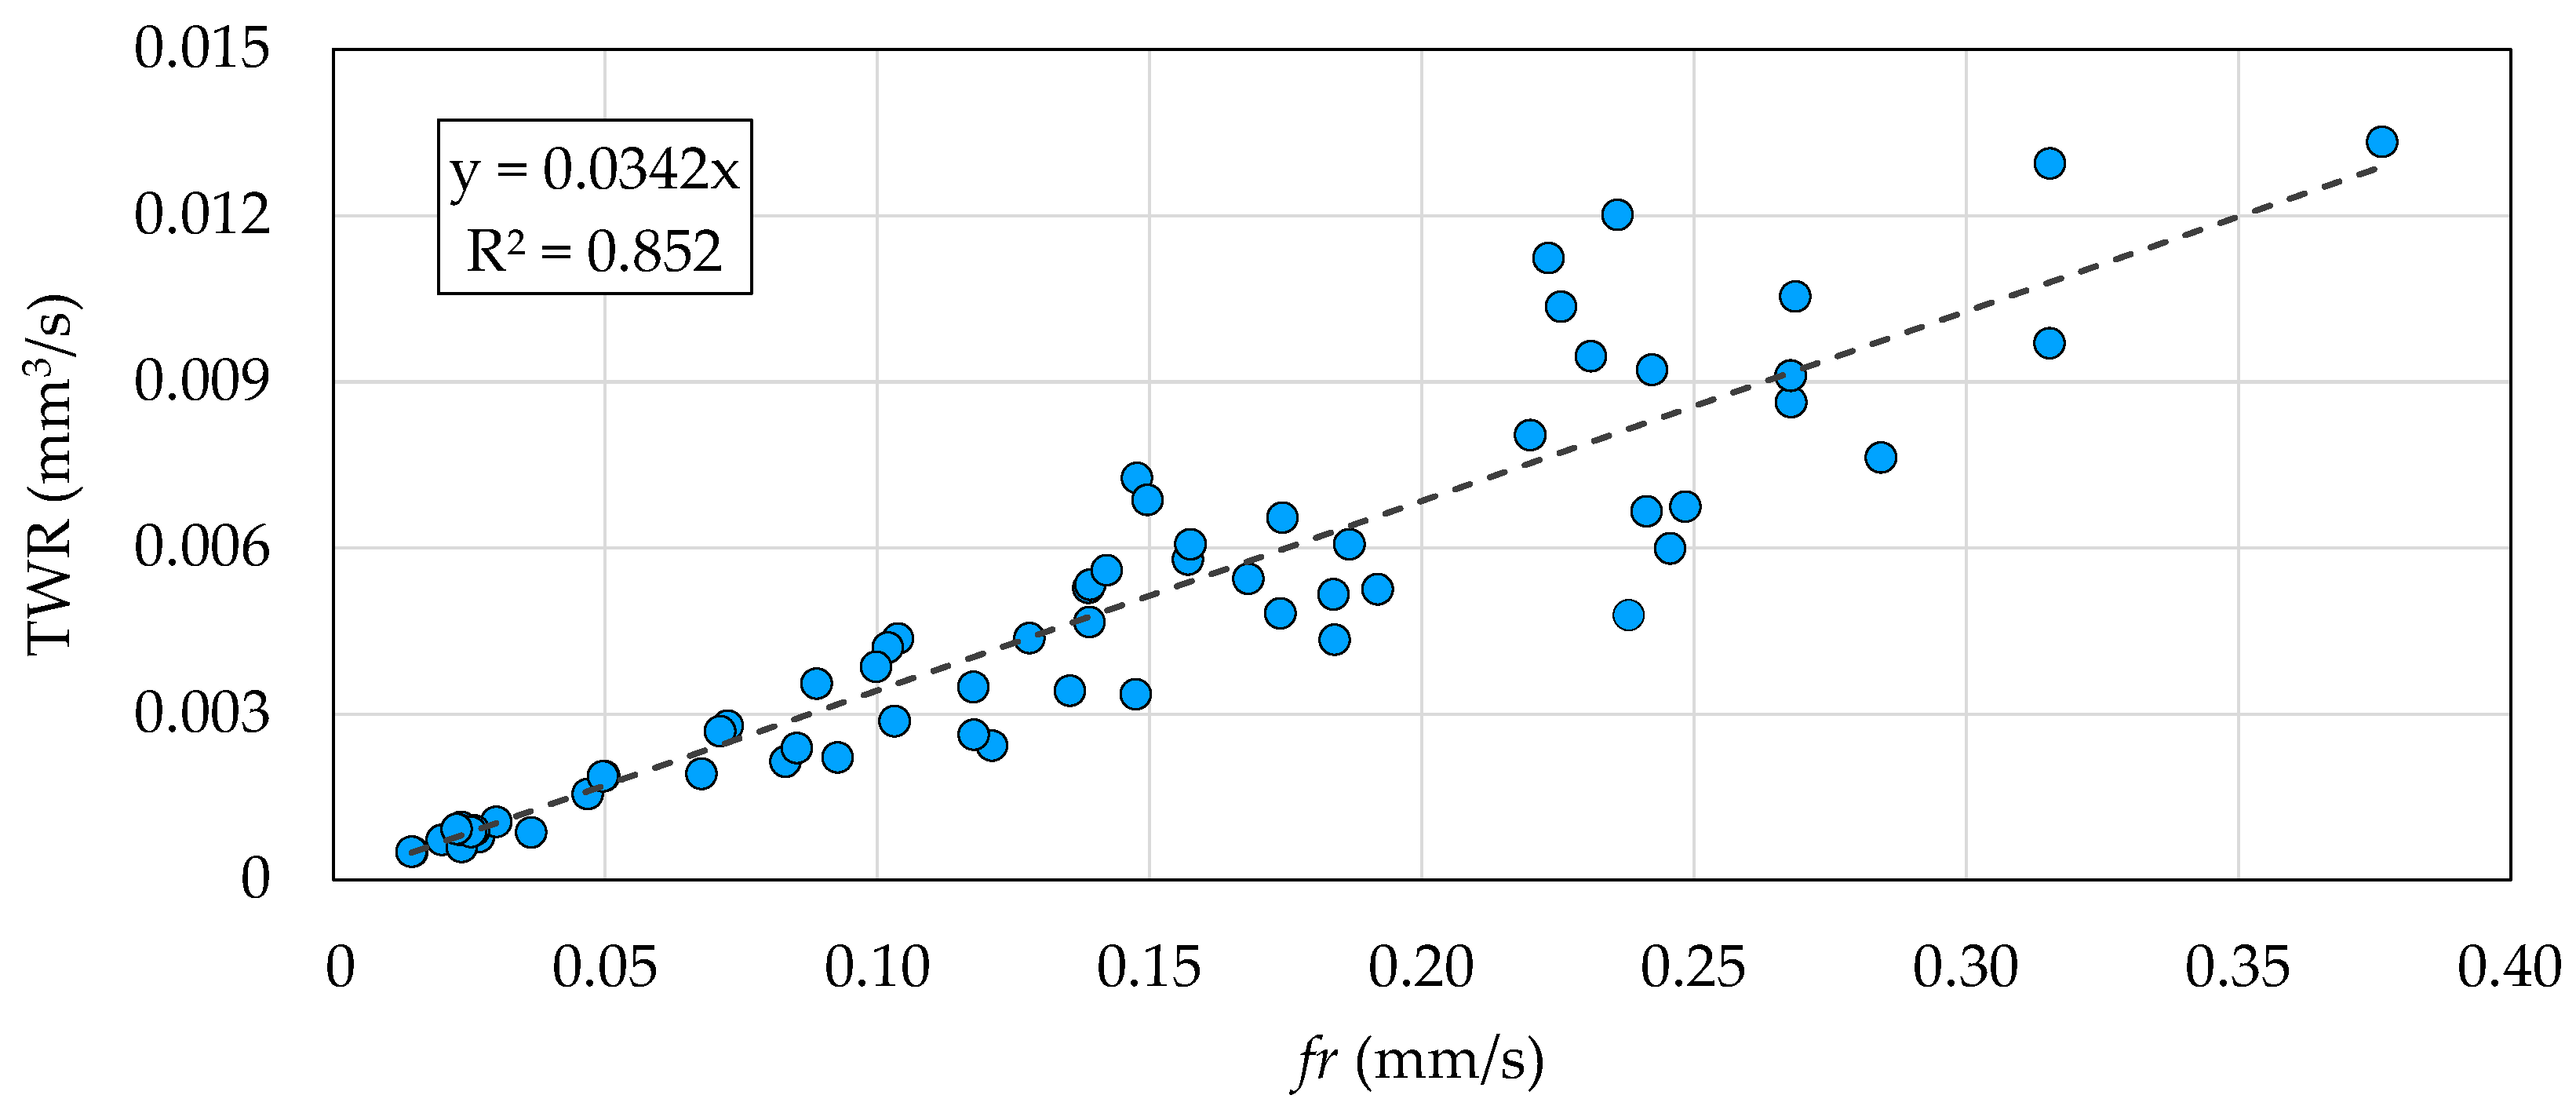
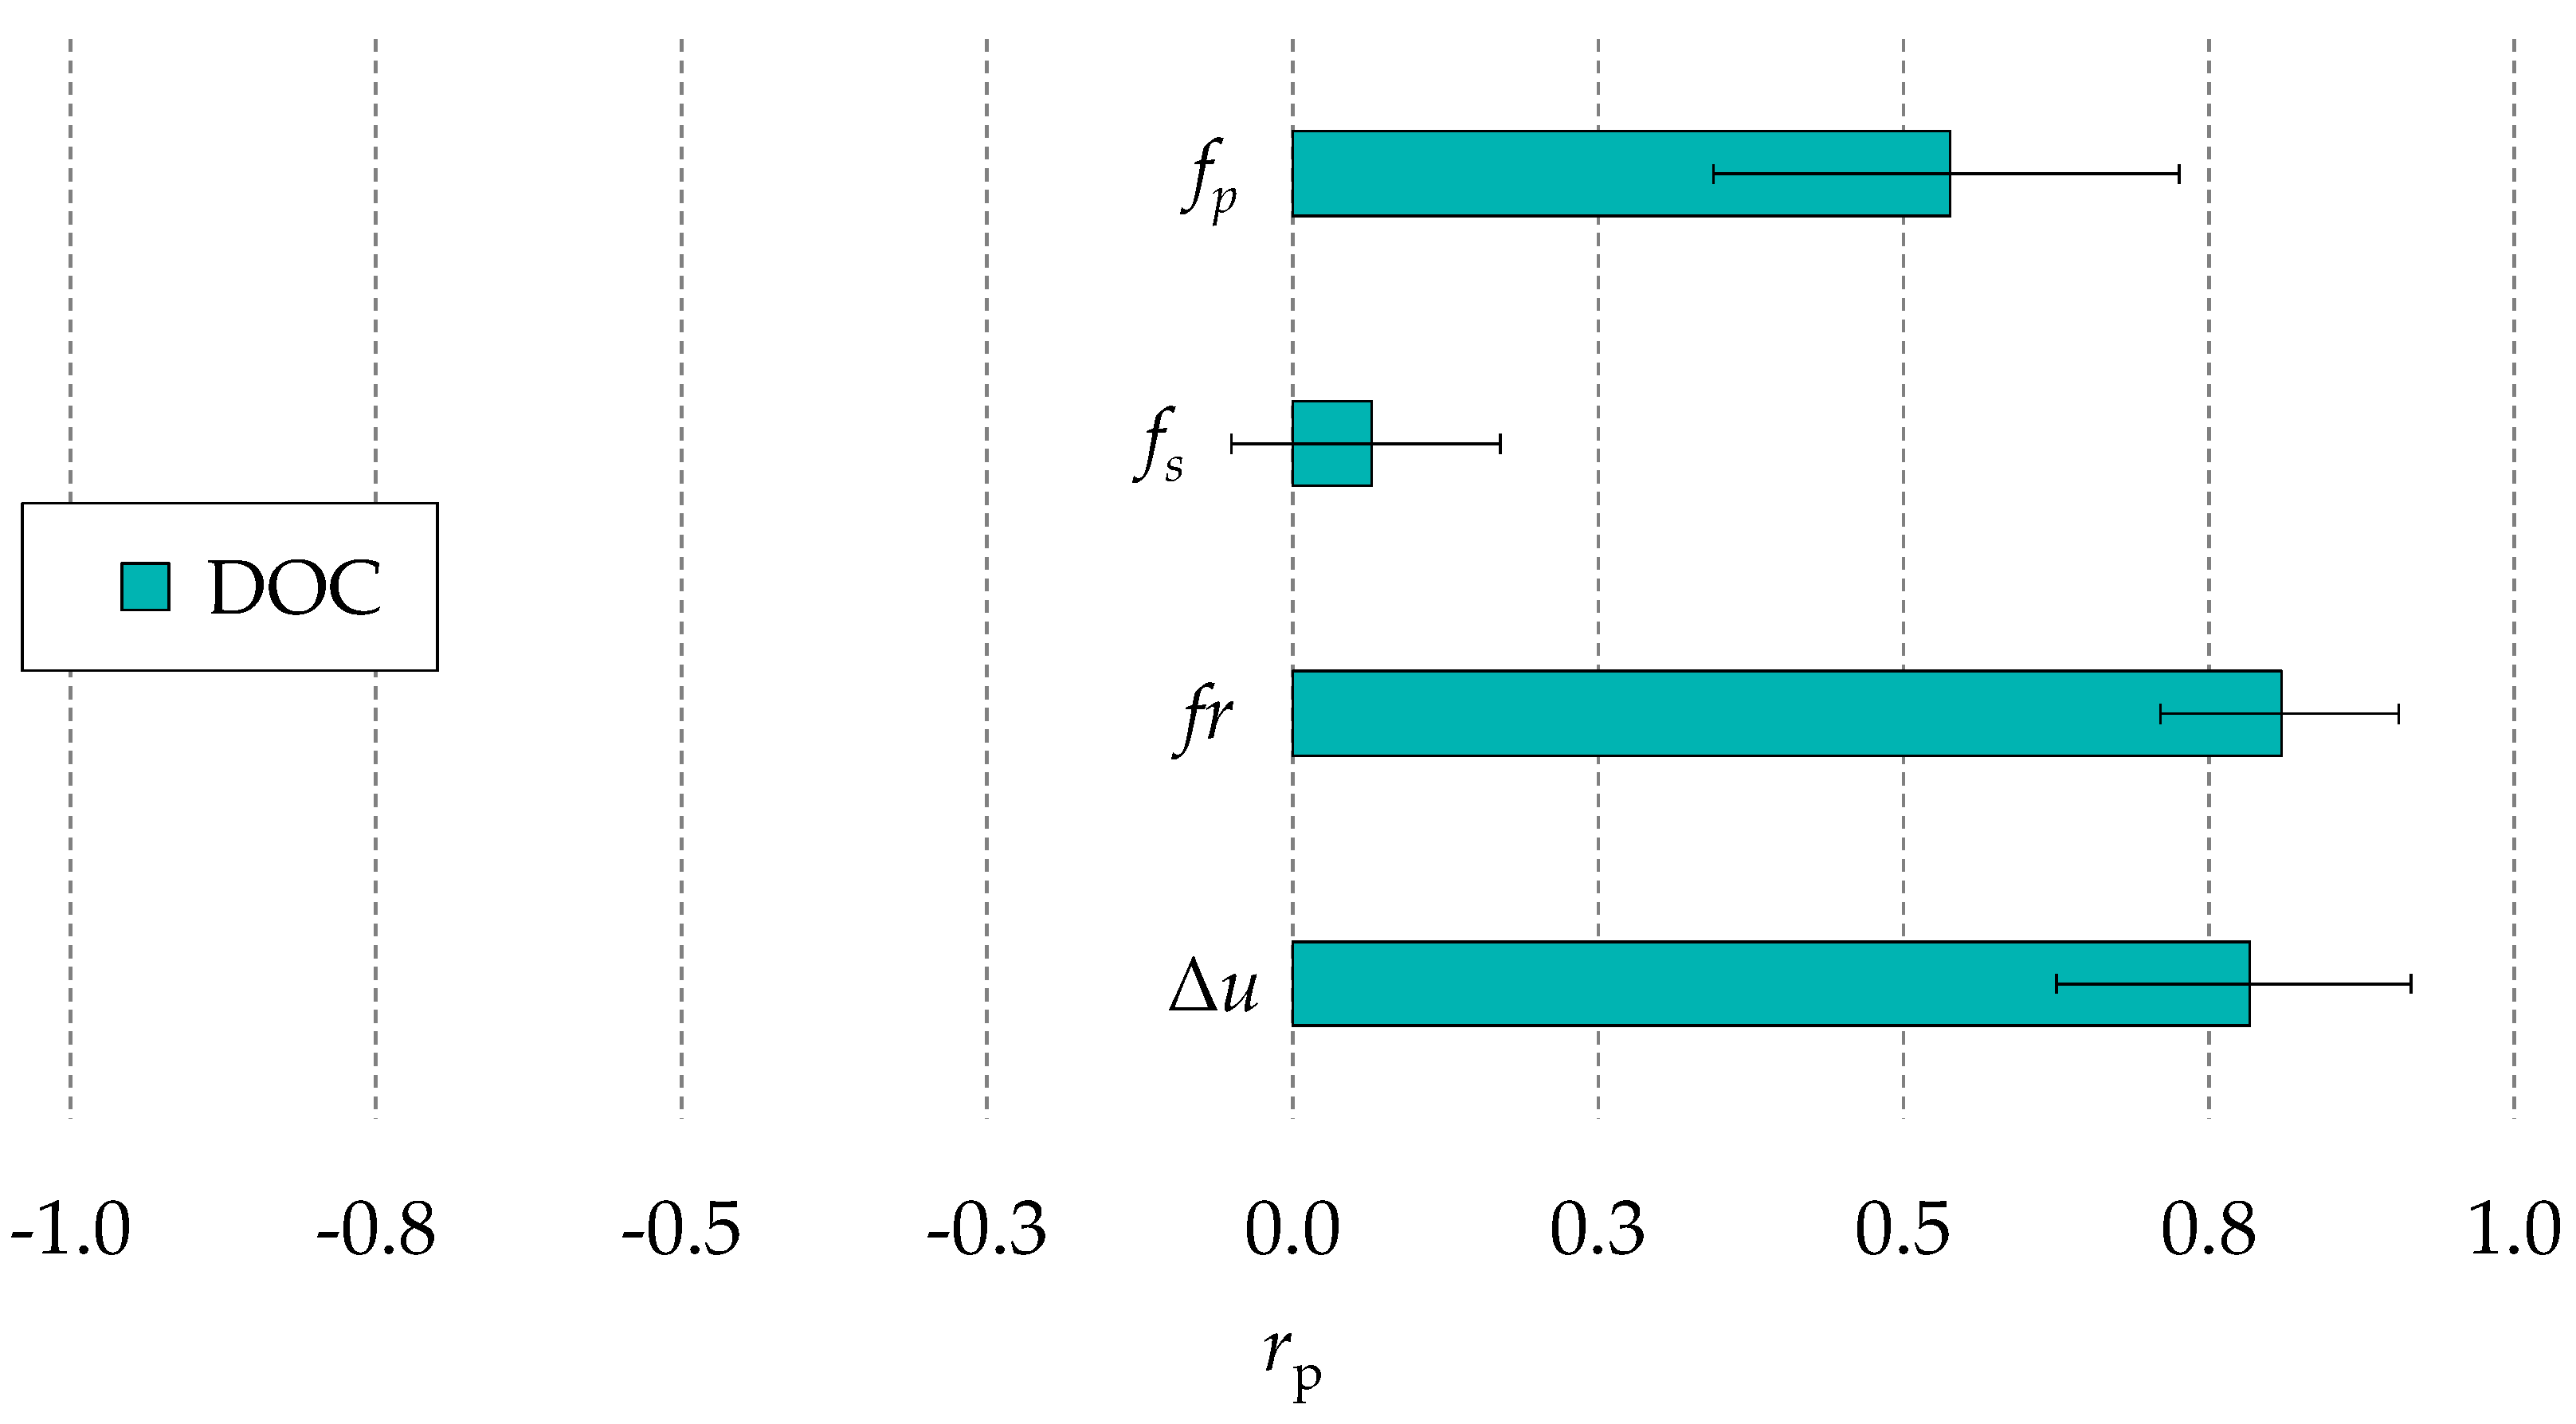
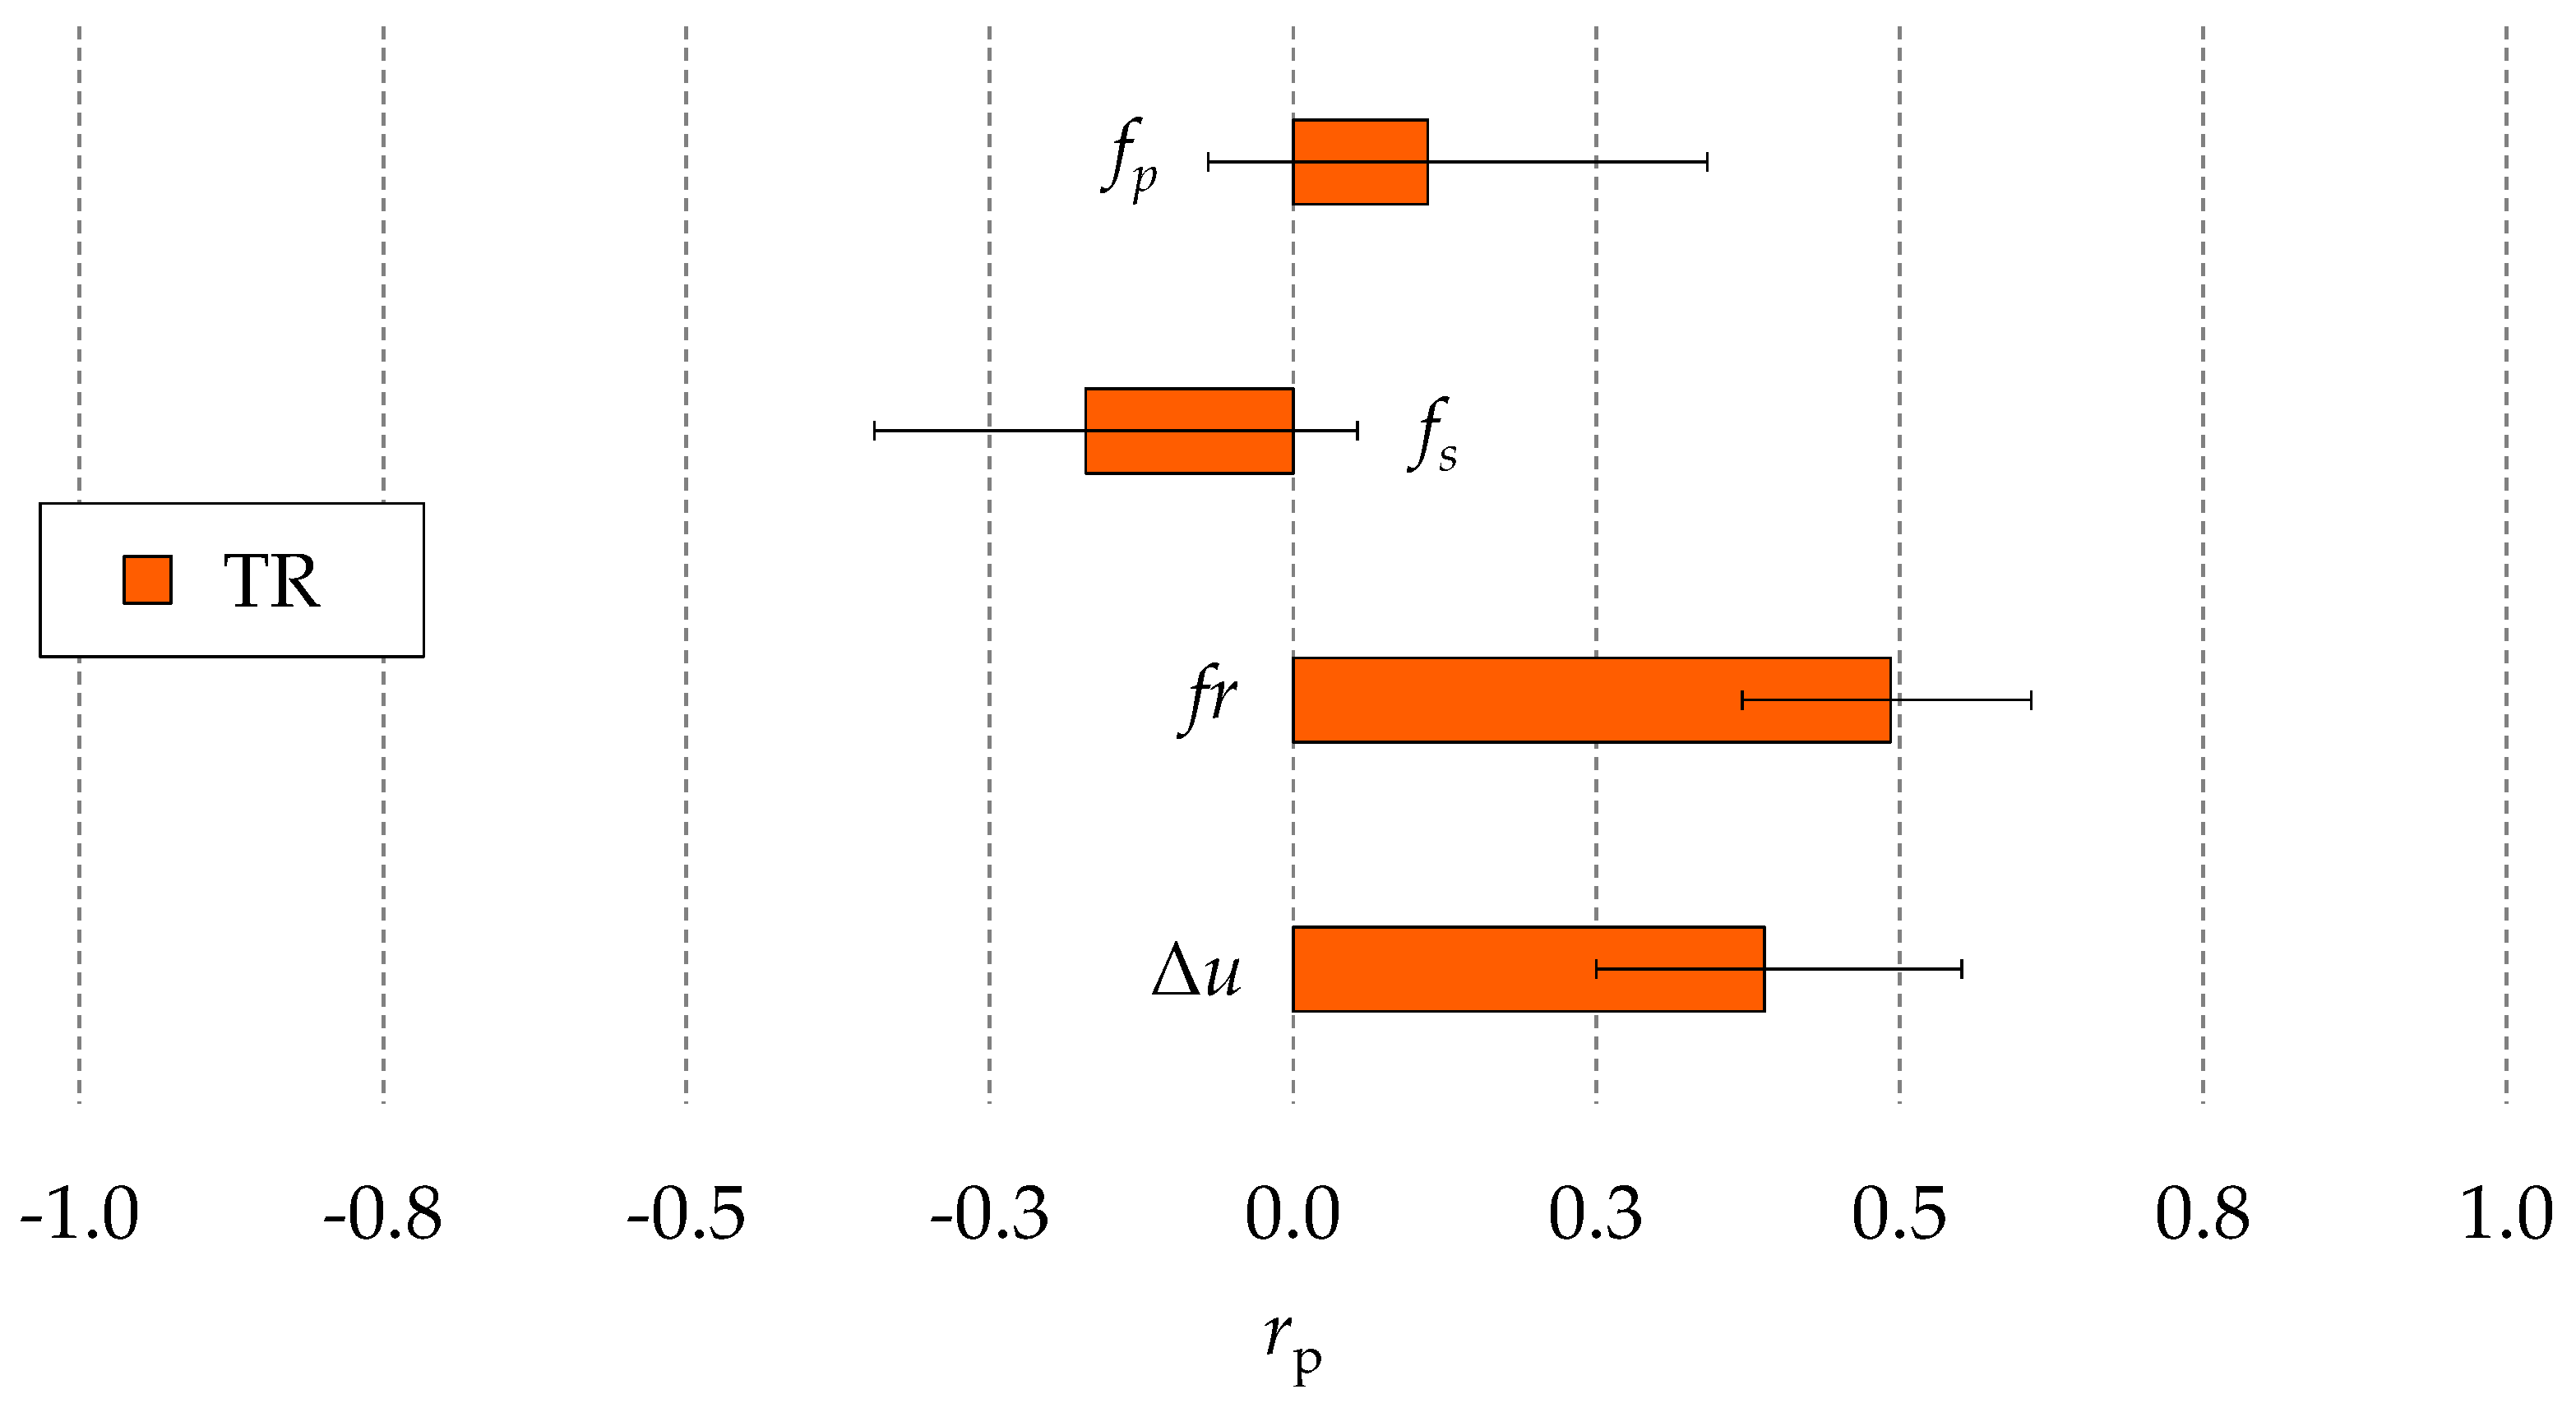
3.2. Correlation with Performance Characteristics
3.3. Correlation with the Hole Quality
4. Conclusions
Author Contributions
Acknowledgments
Conflicts of Interest
References
- Zhang, Y.; Xu, Z.; Zhu, D.; Qu, N.; Zhu, Y. Drilling of film cooling holes by a EDM/ECM in situ combined process using internal and side flushing of tubular electrode. Int. J. Adv. Manuf. Technol. 2016, 83, 505–517. [Google Scholar] [CrossRef]
- Tong, H.; Li, Y.; Zhang, L.; Li, B. Mechanism design and process control of micro EDM for drilling spray holes of diesel injector nozzles. Precis. Eng. 2013, 37, 213–221. [Google Scholar] [CrossRef]
- Yilmaz, O.; Okka, M.A. Effect of single and multi-channel electrodes application on EDM fast hole drilling performance. Int. J. Adv. Manuf. Technol. 2010, 51, 185–194. [Google Scholar] [CrossRef]
- Moses, M.D.; Jahan, M.P. Micro-EDM machinability of difficult-to-cut Ti-6Al-4V against soft brass. Int. J. Adv. Manuf. Technol. 2015, 81, 1345–1361. [Google Scholar]
- Sharp, M.; Ak, R.; Hedberg, T. A survey of the advancing use and development of machine learning in smart manufacturing. J. Manuf. Syst. 2018, 48, 170–179. [Google Scholar] [CrossRef]
- Maradia, U.; Benavoli, A.; Boccadoro, M.; Bonesana, C.; Klyuev, M.; Zaffalon, M.; Gambardella, L.; Wegener, K. EDM Drilling optimisation using stochastic techniques. Procedia CIRP 2018, 67, 350–355. [Google Scholar] [CrossRef]
- Lin, Y.C.; Tsao, C.C.; Hsu, C.Y.; Hung, S.K.; Wen, D.C. Evaluation of the characteristics of the microelectrical discharge machining process using response surface methodology based on the central composite design. Int. J. Adv. Manuf. Technol. 2012, 62, 1013–1021. [Google Scholar] [CrossRef]
- Jung, J.H.; Kwon, W.T. Optimization of EDM process for multiple performance characteristics using Taguchi method and Grey relational analysis. J. Mech. Sci. Technol. 2010, 24, 1083–1090. [Google Scholar] [CrossRef]
- Ay, M.; Caydas, U.; Haskalik, A. Optimization of micro-EDM drilling of inconel 718 superalloy. Int. J. Adv. Manuf. Technol. 2013, 66, 1015–1023. [Google Scholar] [CrossRef]
- D’Urso, G.; Maccarini, G.; Ravasio, C. Process performance of micro-EDM drilling of stainless steel. Int. J. Adv. Manuf. Technol. 2014, 72, 1287–1298. [Google Scholar]
- Jahan, M.P.; Wong, Y.S.; Rahman, M. A study on the quality micro-hole machining of tungsten carbide by micro-EDM process using transistor and RC-type pulse generator. J. Mater. Process. Technol. 2009, 209, 1706–1716. [Google Scholar] [CrossRef]
- Suganthi, X.H.; Natarajan, U.; Sathiyamurthy, S.; Chidambaram, K. Prediction of quality responses in micro-EDM process using an adaptive neuro-fuzzy inference system (ANFIS) model. Int. J. Adv. Manuf. Technol. 2013, 68, 339–347. [Google Scholar] [CrossRef]
- Brinksmeier, E.; Klocke, F.; Lucca, D.A.; Sölter, J.; Meyer, D. Process signatures—A new approach to solve the inverse surface integrity problem in machining processes. Procedia CIRP 2014, 13, 429–434. [Google Scholar] [CrossRef]
- Eppinger, S.D.; Huber, C.D.; Pham, V.H. A methodology for manufacturing process signature analysis. J. Manuf. Syst. 1995, 14, 20–34. [Google Scholar] [CrossRef]
- Sealy, M.P.; Liu, Z.Y.; Guo, Y.B.; Liu, Z.Q. Energy based process signature for surface integrity in hard milling. J. Mater. Process. Technol. 2016, 238, 284–289. [Google Scholar] [CrossRef]
- Klink, A. Process signatures of EDM and ECM processes—Overview from part functionality and surface modification point of view. Procedia CIRP 2016, 42, 240–245. [Google Scholar] [CrossRef]
- Annoni, M.; Rebaioli, L.; Semeraro, Q. Thin wall geometrical quality improvement in micromilling. Int. J. Adv. Manuf. Technol. 2015, 79, 881–895. [Google Scholar] [CrossRef]
- Baruffi, F.; Calaon, M.; Tosello, G. Micro-injection moulding in-line quality assurance based on product and process fingerprints. Micromachines 2018, 9, 293. [Google Scholar] [CrossRef]
- Yilmaz, O.; Bozdana, A.T.; Okka, M.A. An intelligent and automated system for electrical discharge drilling of aerospace alloys: Inconel 718 and Ti-6Al-4V. Int. J. Adv. Manuf. Technol. 2014, 74, 1323–1336. [Google Scholar] [CrossRef]
- Li, M.S.; Chi, G.X.; Wang, Z.L.; Wang, Y.K.; Dai, L. Micro electrical discharge machining of small hole in TC4 alloy. Trans. Nonferrous Met. Soc. China (Engl. Ed.) 2009, 19, s434–s439. [Google Scholar] [CrossRef]
- Qudeiri, J.E.A.; Mourad, A.I.; Ziout, A.; Abidi, M.H.; Elkaseer, A. Electric discharge machining of titanium and its alloys: Review. Int. J. Adv. Manuf. Technol. 2018, 96, 1319–1339. [Google Scholar] [CrossRef]
- Plaza, S.; Sanchez, J.A.; Perez, E.; Gil, R.; Izquierdo, B.; Ortega, N.; Pombo, I. Experimental study on micro EDM-drilling of Ti6Al4V using helical electrode. Precis. Eng. 2014, 38, 821–827. [Google Scholar] [CrossRef]
- Nirala, C.K.; Saha, P. Precise μEDM-drilling using real-time indirect tool wear compensation. J. Mater. Process. Technol. 2017, 240, 176–189. [Google Scholar] [CrossRef]
- Wang, J.; Qian, J.; Ferraris, E.; Reynaerts, D. In-situ process monitoring and adaptive control for precision micro-EDM cavity milling. Precis. Eng. 2017, 47, 261–275. [Google Scholar] [CrossRef]
- Bellotti, M.; Qian, J.; Reynaerts, D. Enhancement of the micro-EDM process for drilling through-holes. Procedia CIRP 2018, 68, 610–615. [Google Scholar] [CrossRef]
- Xia, W.; Wang, J.; Zhao, W. Break-out detection for high-speed small hole drilling EDM based on machine learning. Procedia CIRP 2018, 68, 569–574. [Google Scholar]
- Yang, F.; Bellotti, M.; Hua, H.; Yang, J.; Qian, J.; Reynaerts, D. Experimental analysis of normal spark discharge voltage and current with a RC-type generator in micro-EDM. Int. J. Adv. Manuf. Technol. 2018, 96, 2963–2972. [Google Scholar] [CrossRef]
- Kendall, M.; Stuart, A. The Advanced Theory of Statistics, Volume 2: Inference and Relationship; Charles Griffin and Company Limited: London, UK, 1973; ISBN 0-85264-215-6. [Google Scholar]
- Wang, D.; Ye, L.; Su, Z.; Lu, Y.; Li, F.; Meng, G. Probabilistic damage identification based on correlation analysis using guided wave signals in aluminum plates. Struct. Health Monit. 2010, 9, 133–144. [Google Scholar] [CrossRef]
- Chang, Y.; Yang, D.; Guo, Y. Laser ultrasonic damage detection in coating-substrate structure via Pearson correlation coefficient. Surf. Coat. Technol. 2018, 353, 339–345. [Google Scholar] [CrossRef]
- Natarajan, N.; Suresh, P. Experimental investigations on the microhole machining of 304 stainless steel by micro-EDM process using RC-type pulse generator. Int. J. Adv. Manuf. Technol. 2015, 77, 1741–1750. [Google Scholar] [CrossRef]
- Saxena, K.K.; Bellotti, M.; Qian, J.; Reynaerts, D. Characterization of circumferential surface roughness of micro-EDMed holes using replica technology. Procedia CIRP 2018, 68, 582–587. [Google Scholar] [CrossRef]
- Ali, M.Y.; Hamad, M.H.; Karim, A.I. Form characterization of microhole produced by microelectrical discharge drilling. Mater. Manuf. Process. 2009, 24, 683–687. [Google Scholar] [CrossRef]
- Zhang, Y.; Xu, Z.; Zhu, Y.; Zhu, D. Effect of tube-electrode inner structure on machining performance in tube-electrode high-speed electrochemical discharge drilling. J. Mater. Process. Technol. 2016, 231, 38–49. [Google Scholar] [CrossRef]
- Kao, C.-C.; Shih, A.J. Design and tuning of a fuzzy logic controller for micro-hole electrical discharge machining. J. Manuf. Process. 2009, 10, 61–73. [Google Scholar] [CrossRef]
- Spall, J.C. Introduction to Stochastic Search and Optimization; Wiley: Hoboken, NY, USA, 2003. [Google Scholar]


| Factor | Process Parameter | Unit | Level −1 | Level +1 |
|---|---|---|---|---|
| A | Pulse off-time | µs | 5 | 20 |
| B | Open voltage | V | 80 | 160 |
| C | Servo adjustment factor | – | 20 | 80 |
| D | Reference voltage | V | 30 | 70 |
© 2019 by the authors. Licensee MDPI, Basel, Switzerland. This article is an open access article distributed under the terms and conditions of the Creative Commons Attribution (CC BY) license (http://creativecommons.org/licenses/by/4.0/).
Share and Cite
Bellotti, M.; Qian, J.; Reynaerts, D. Process Fingerprint in Micro-EDM Drilling. Micromachines 2019, 10, 240. https://doi.org/10.3390/mi10040240
Bellotti M, Qian J, Reynaerts D. Process Fingerprint in Micro-EDM Drilling. Micromachines. 2019; 10(4):240. https://doi.org/10.3390/mi10040240
Chicago/Turabian StyleBellotti, Mattia, Jun Qian, and Dominiek Reynaerts. 2019. "Process Fingerprint in Micro-EDM Drilling" Micromachines 10, no. 4: 240. https://doi.org/10.3390/mi10040240
APA StyleBellotti, M., Qian, J., & Reynaerts, D. (2019). Process Fingerprint in Micro-EDM Drilling. Micromachines, 10(4), 240. https://doi.org/10.3390/mi10040240