
Modeling Growth and Toxin Production of Toxigenic Fungi Signaled in Cheese under Different Temperature and Water Activity Regimes

 ,
, 

Abstract
:1. Introduction
2. Results
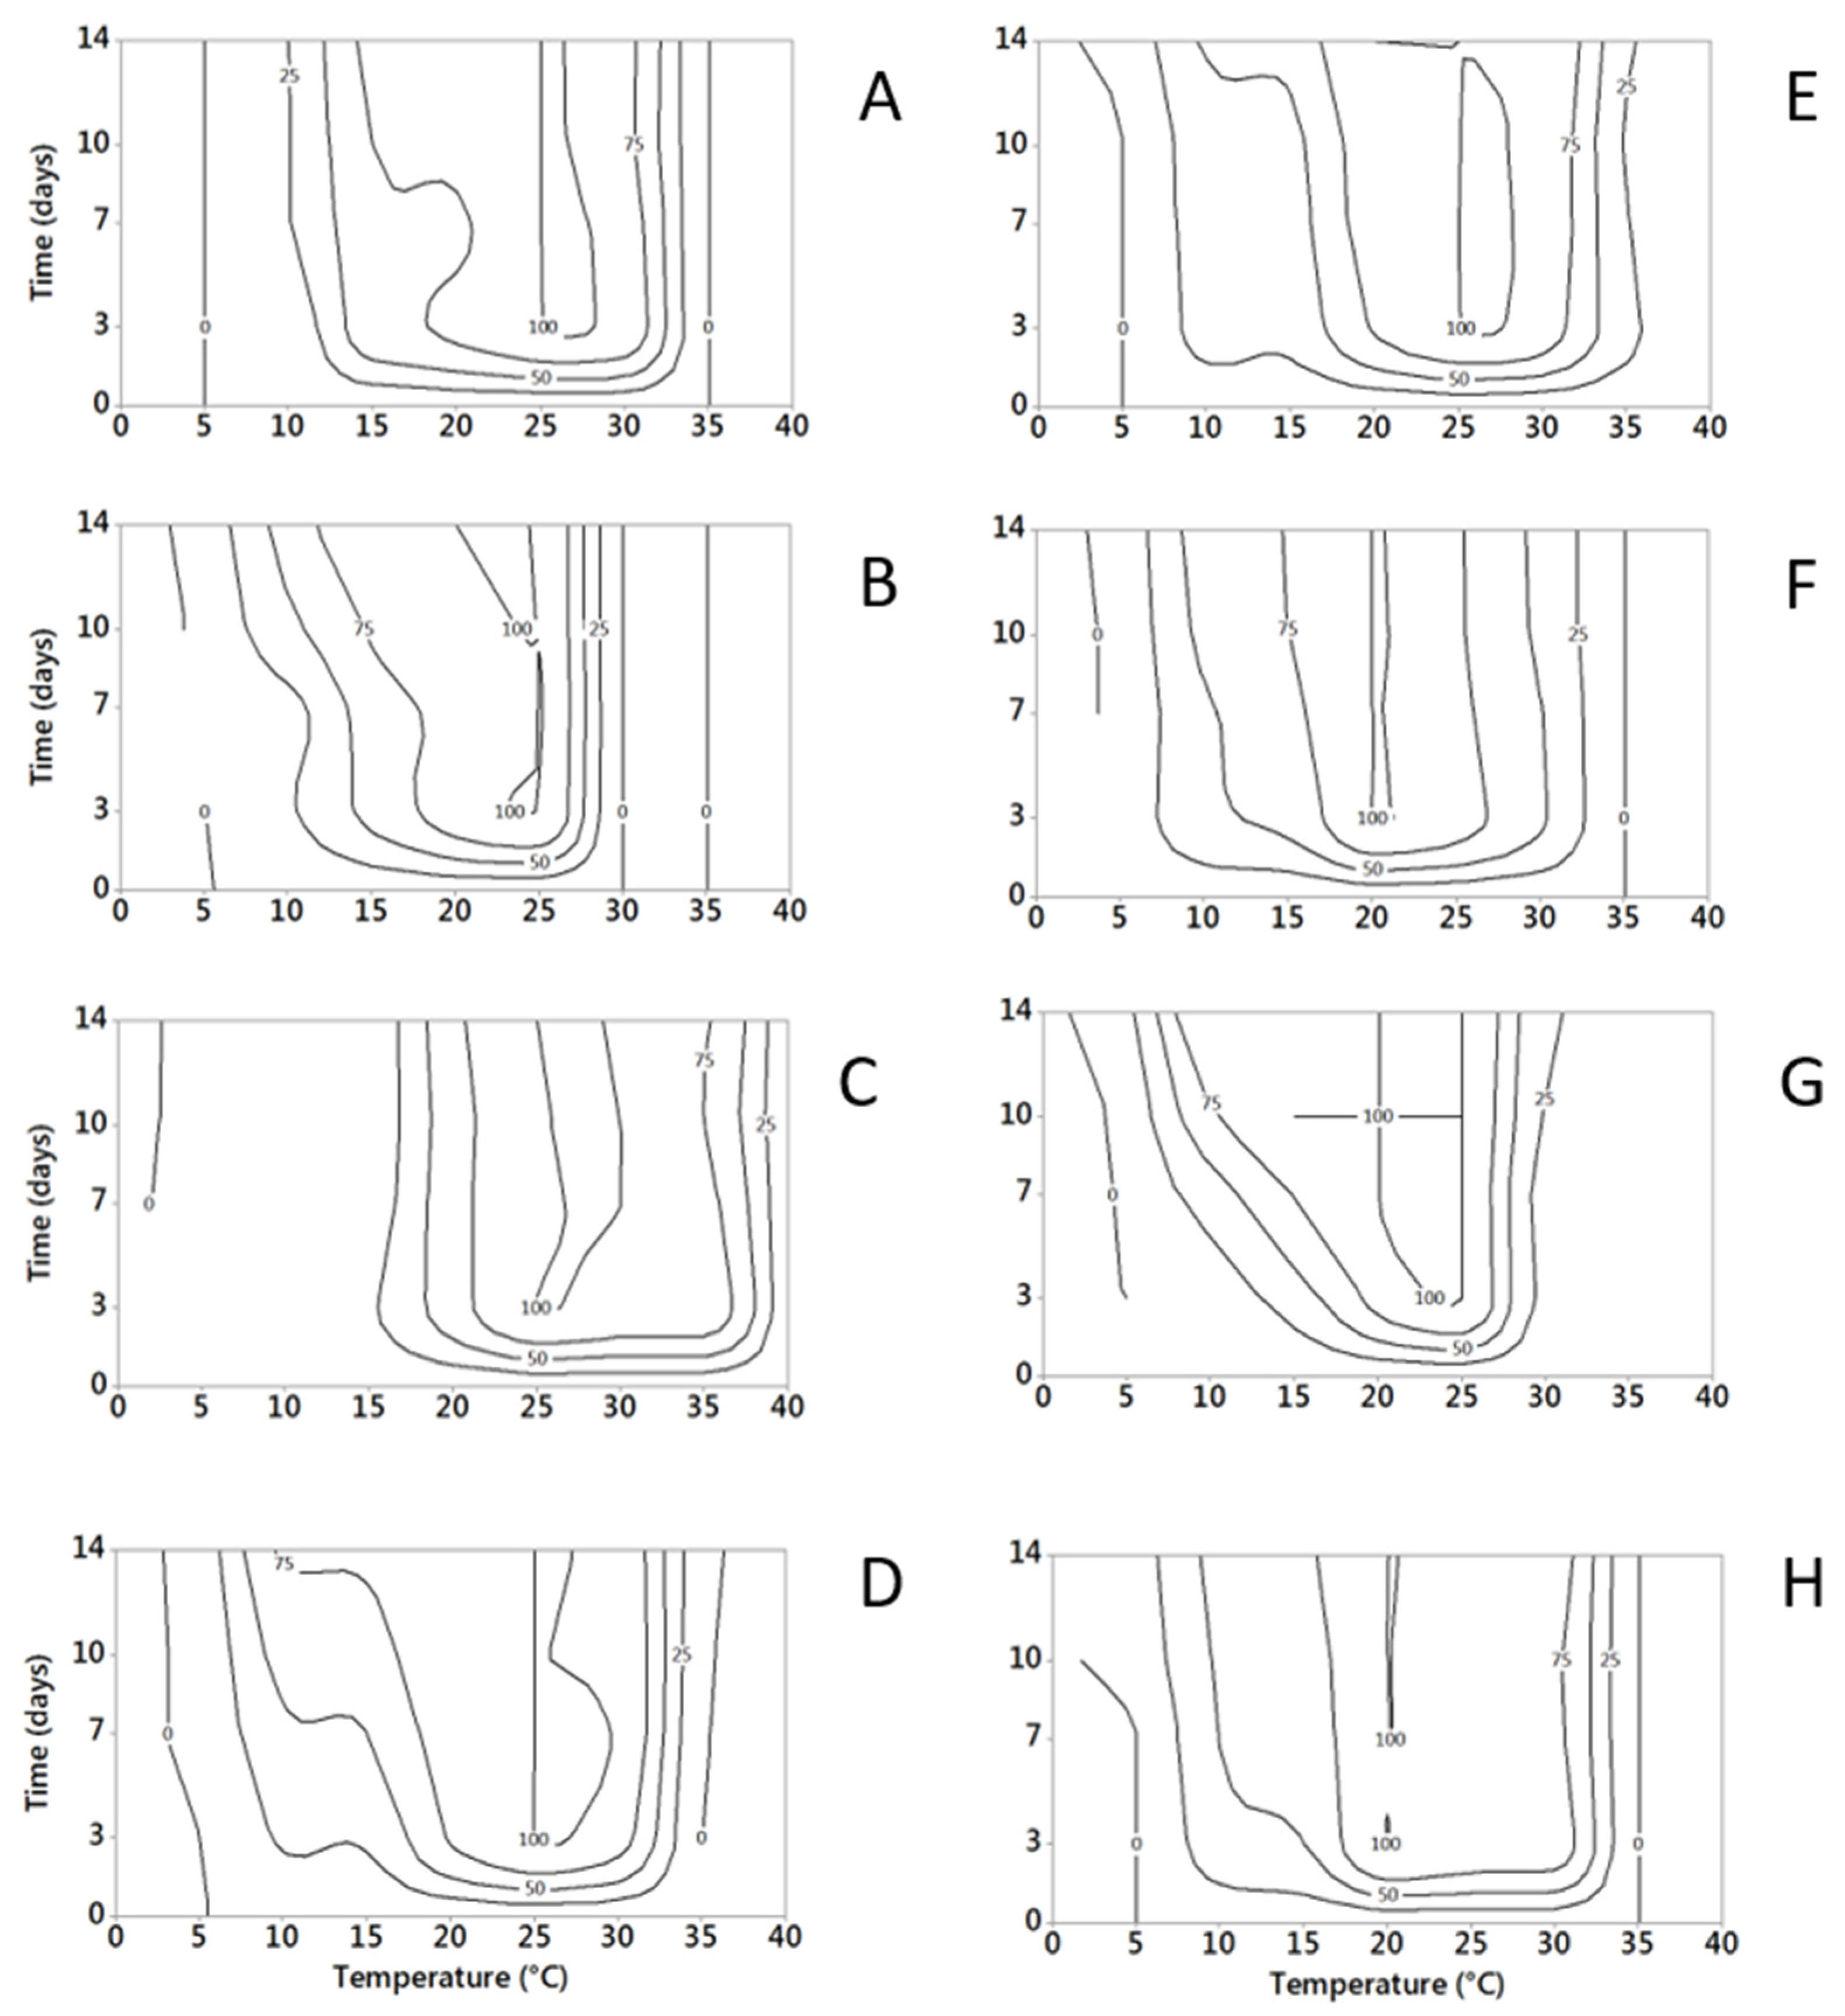
2.1. Role of Temperature, Water Activity and Incubation Time on Fungal Growth
2.1.1. Temperature
2.1.2. Water Activity
2.2. Modeling the Influence of Temperature and Water Activity on Mycelial Growth
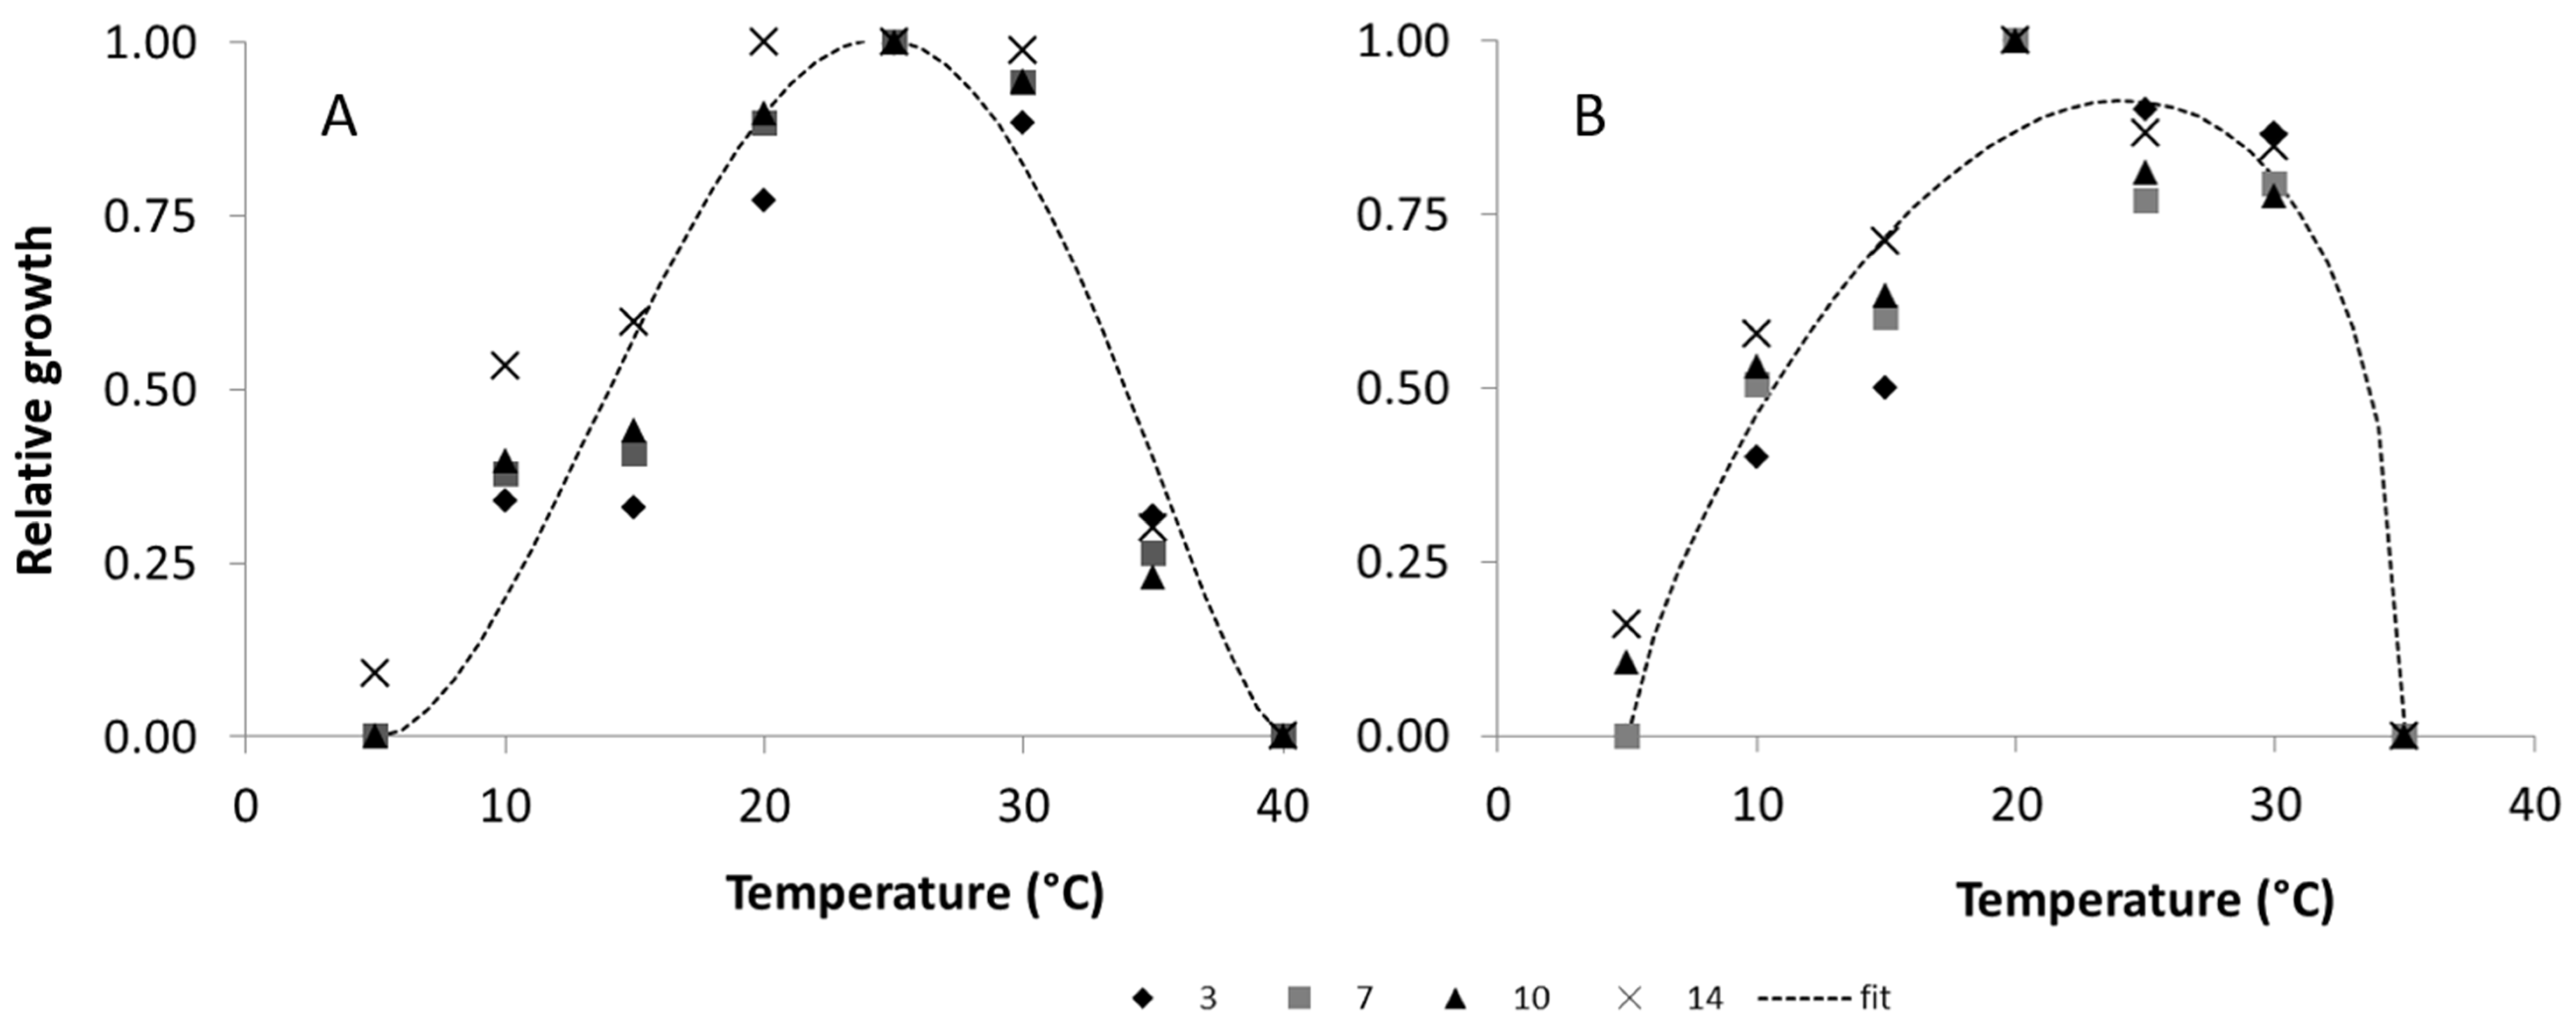
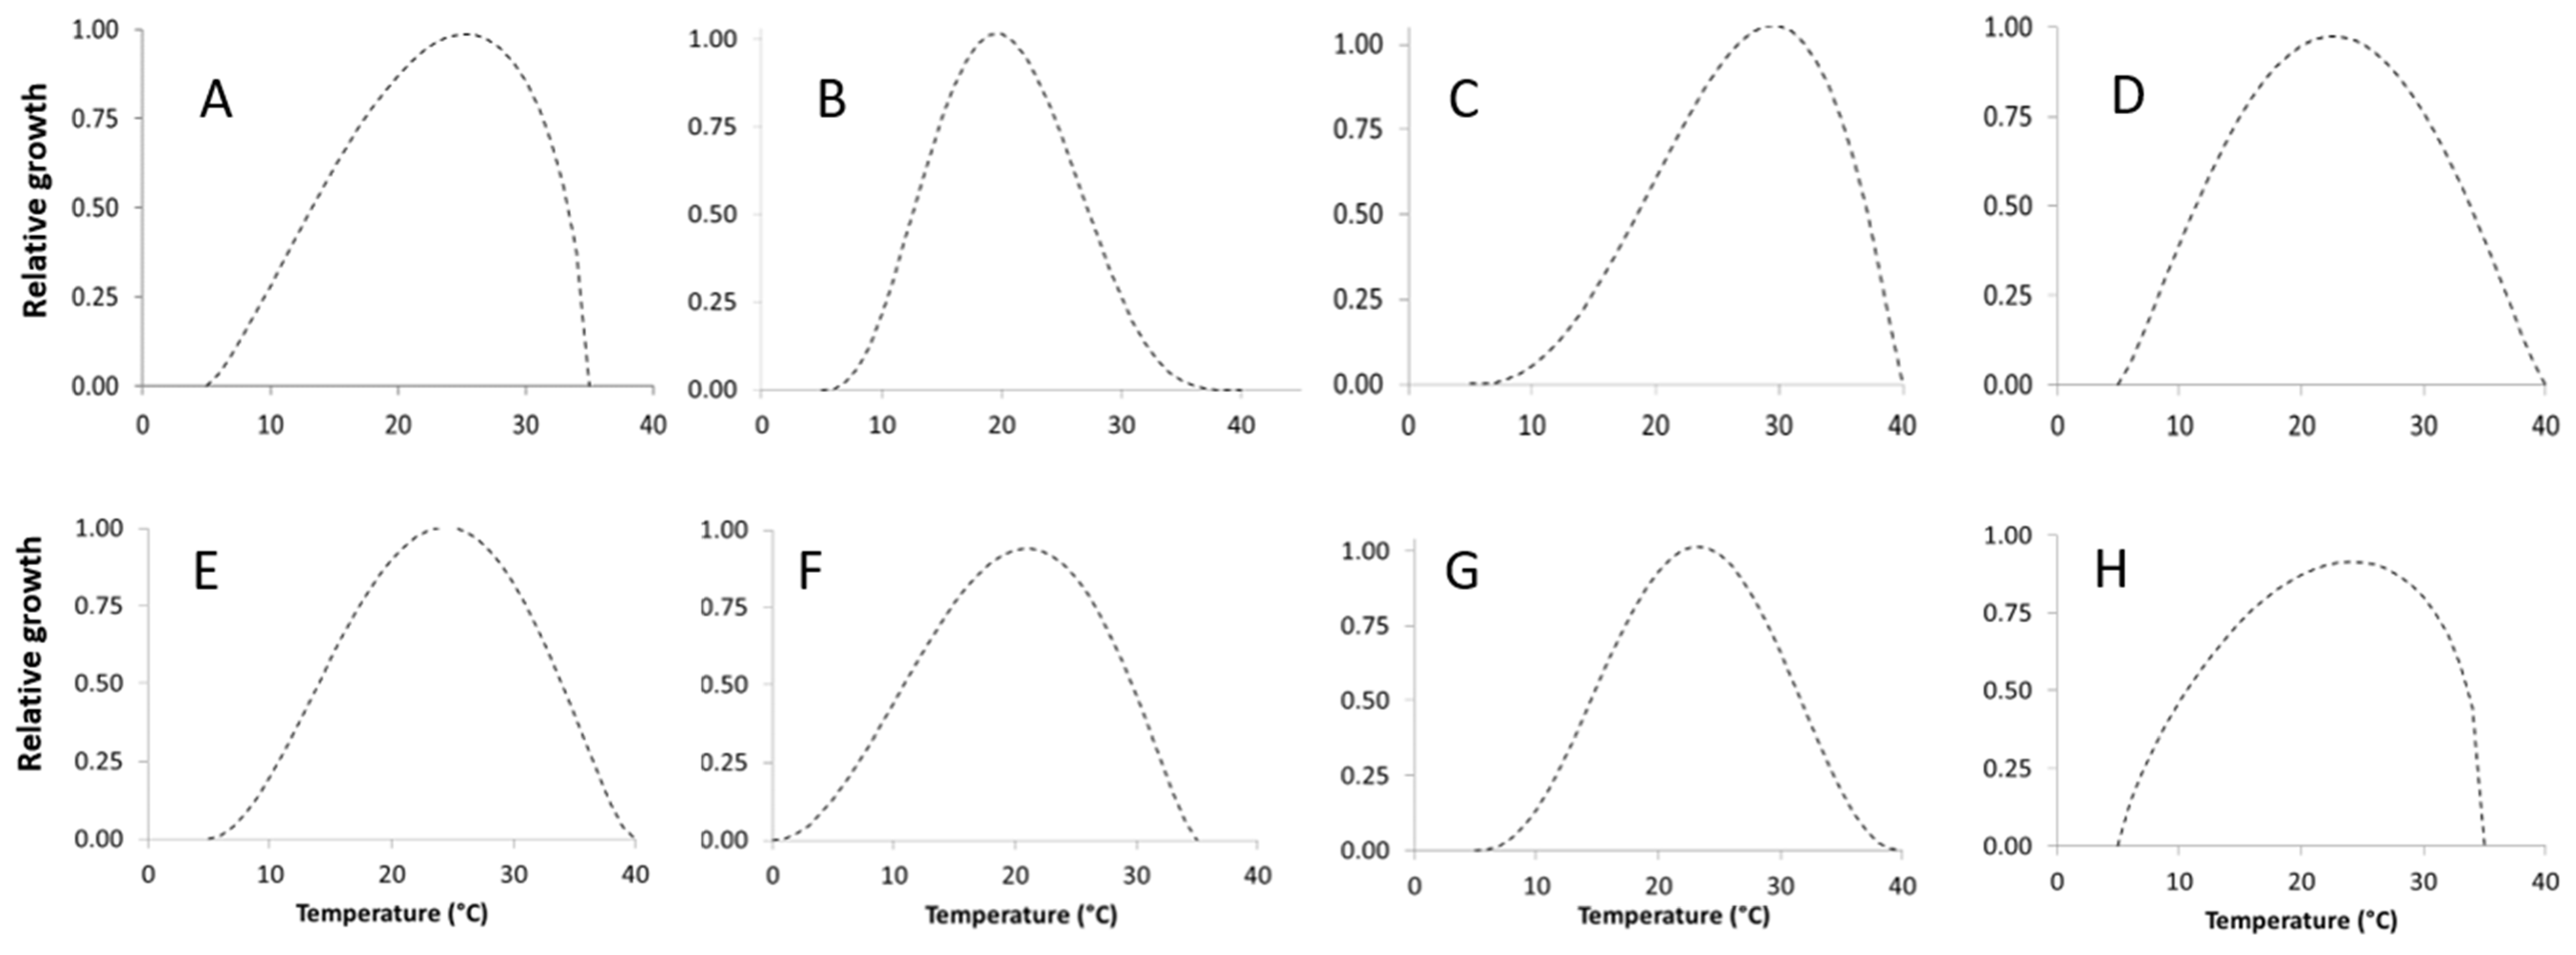
2.2.1. Temperature
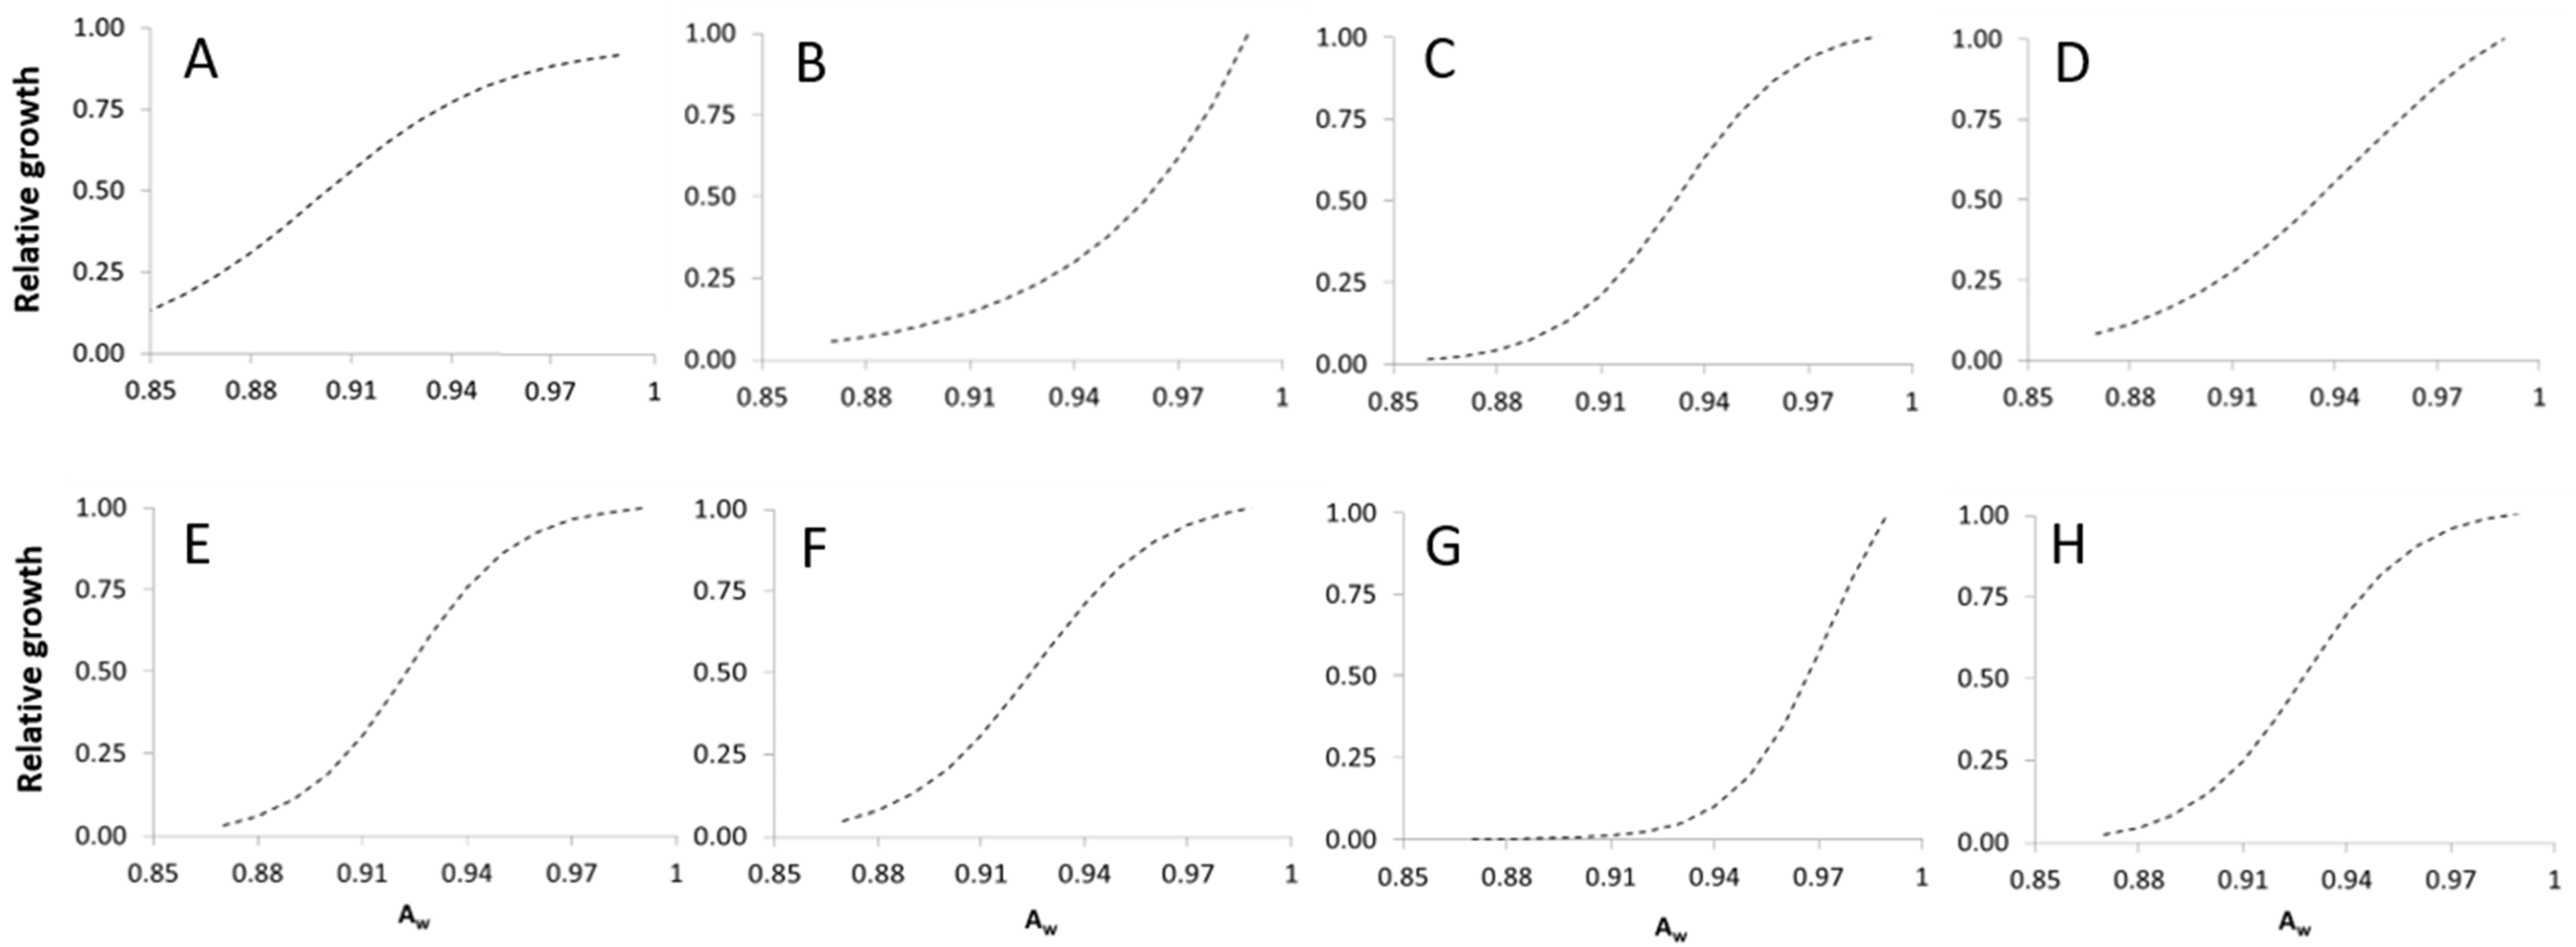
2.2.2. Water Activity
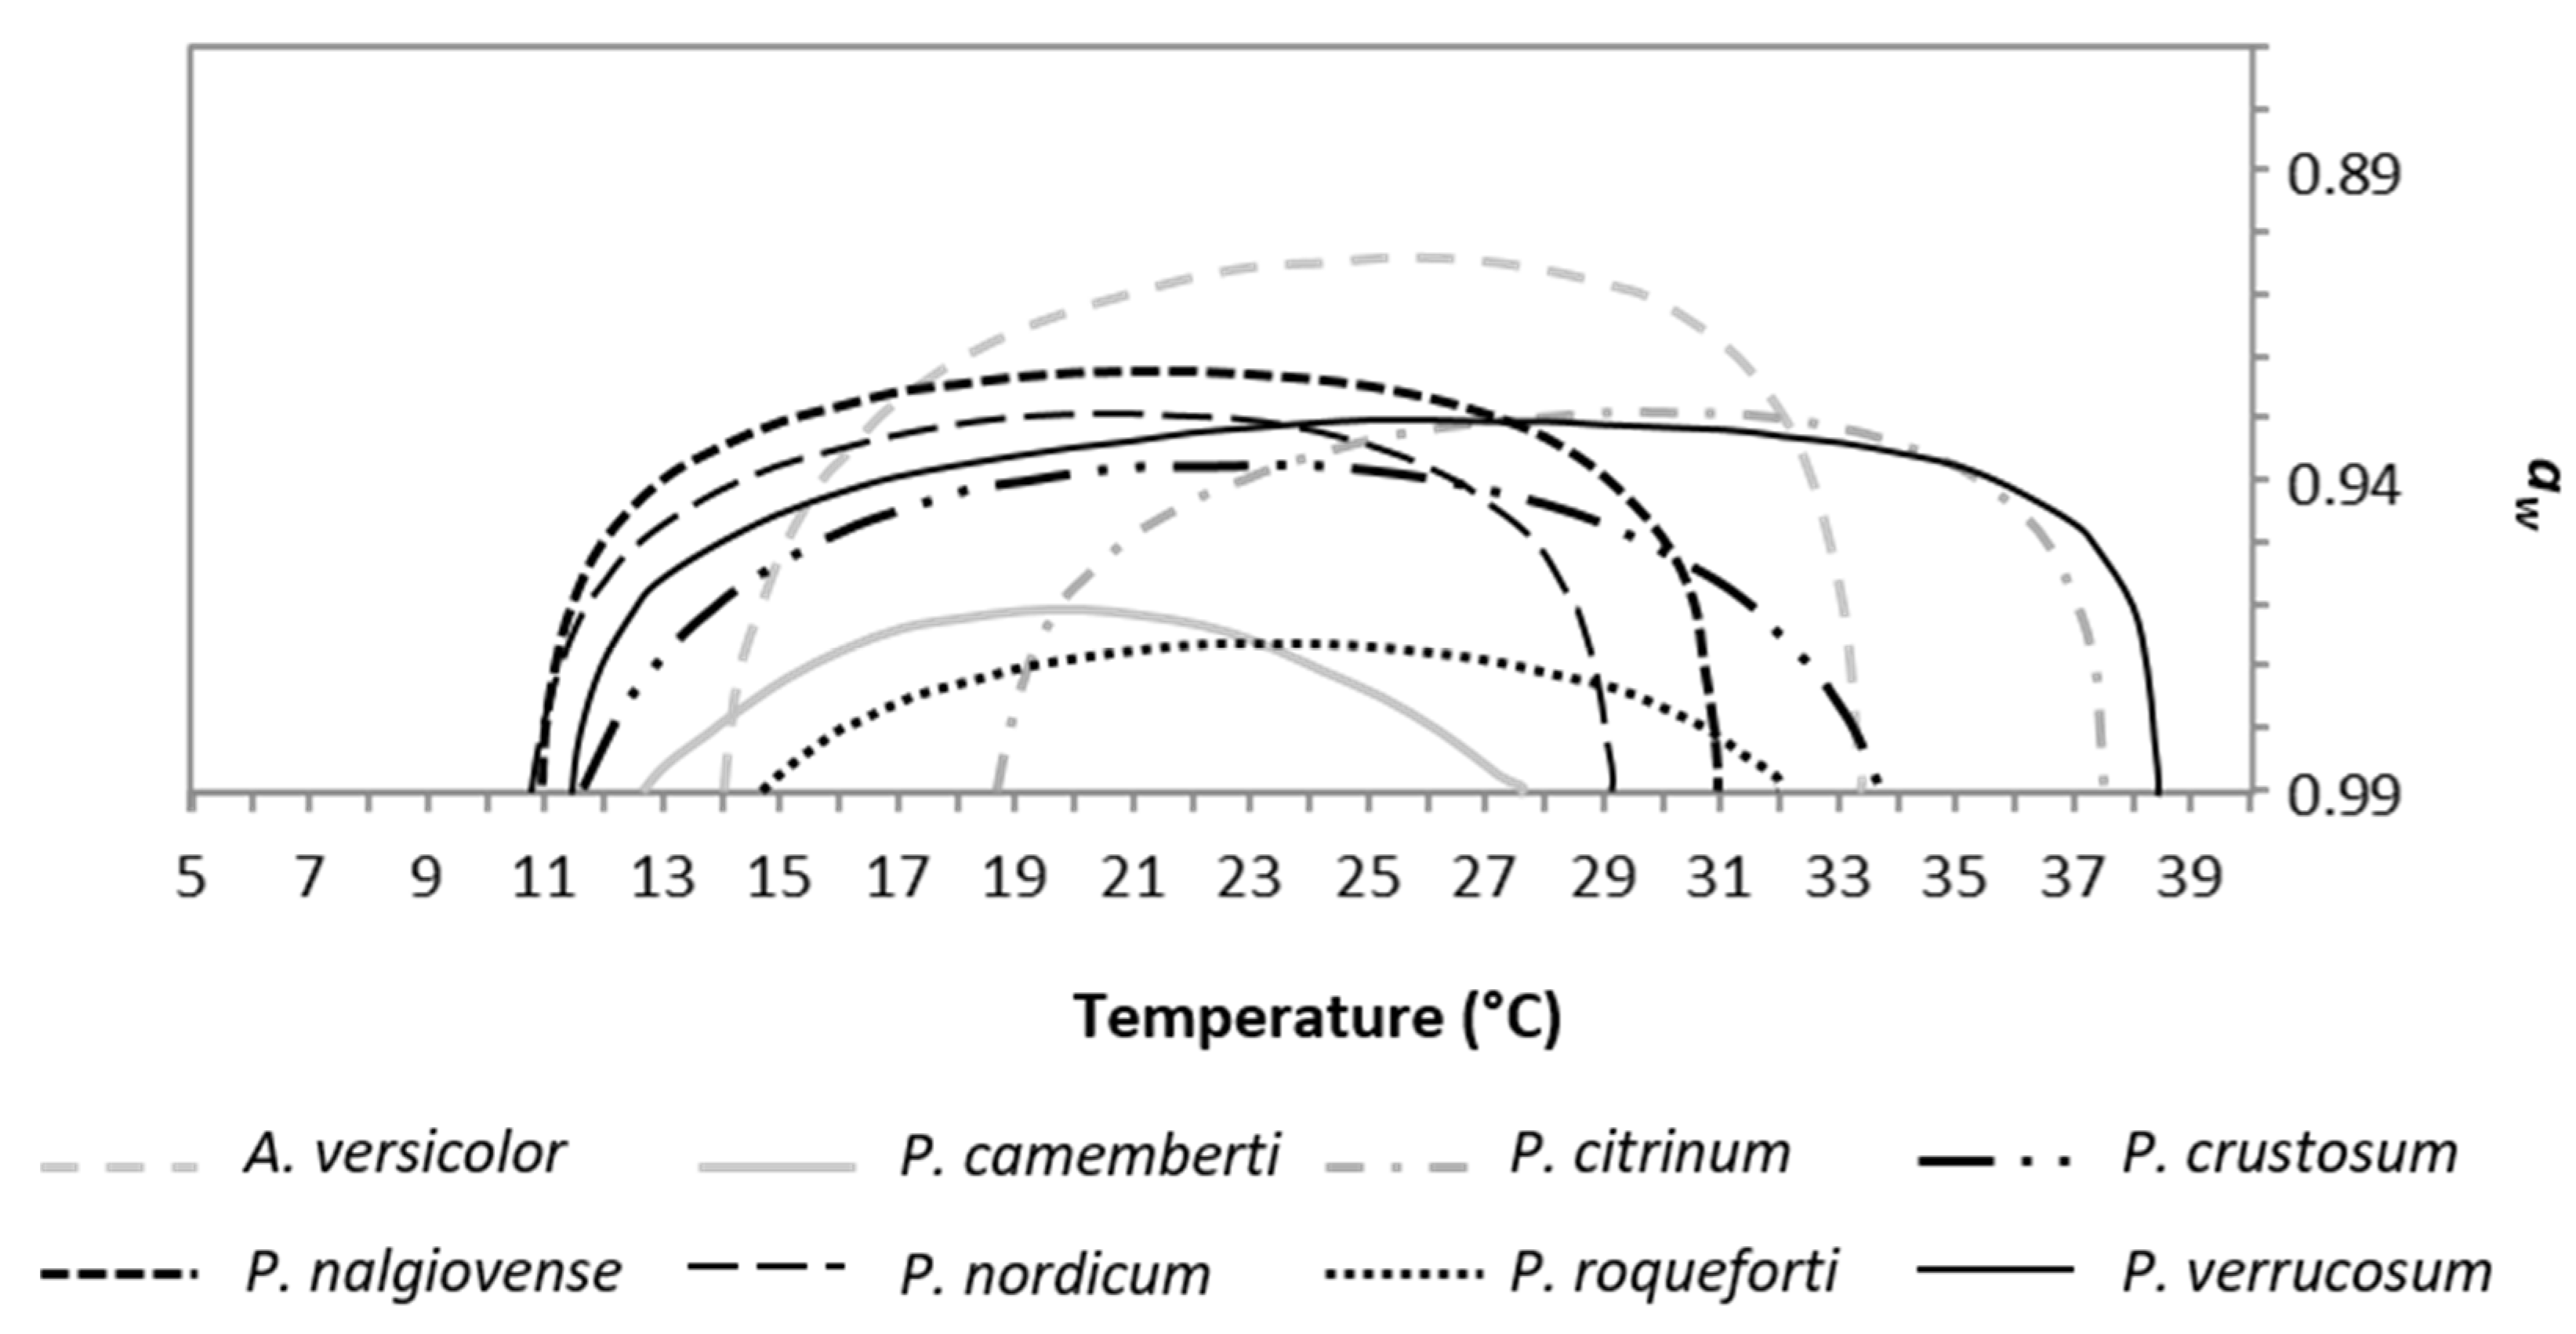
2.3. Modeling the Combined Effect of Temperature and Water Activity on Mycelial Growth
2.4. Influence of Temperature and Water Activity on Mycotoxin Production
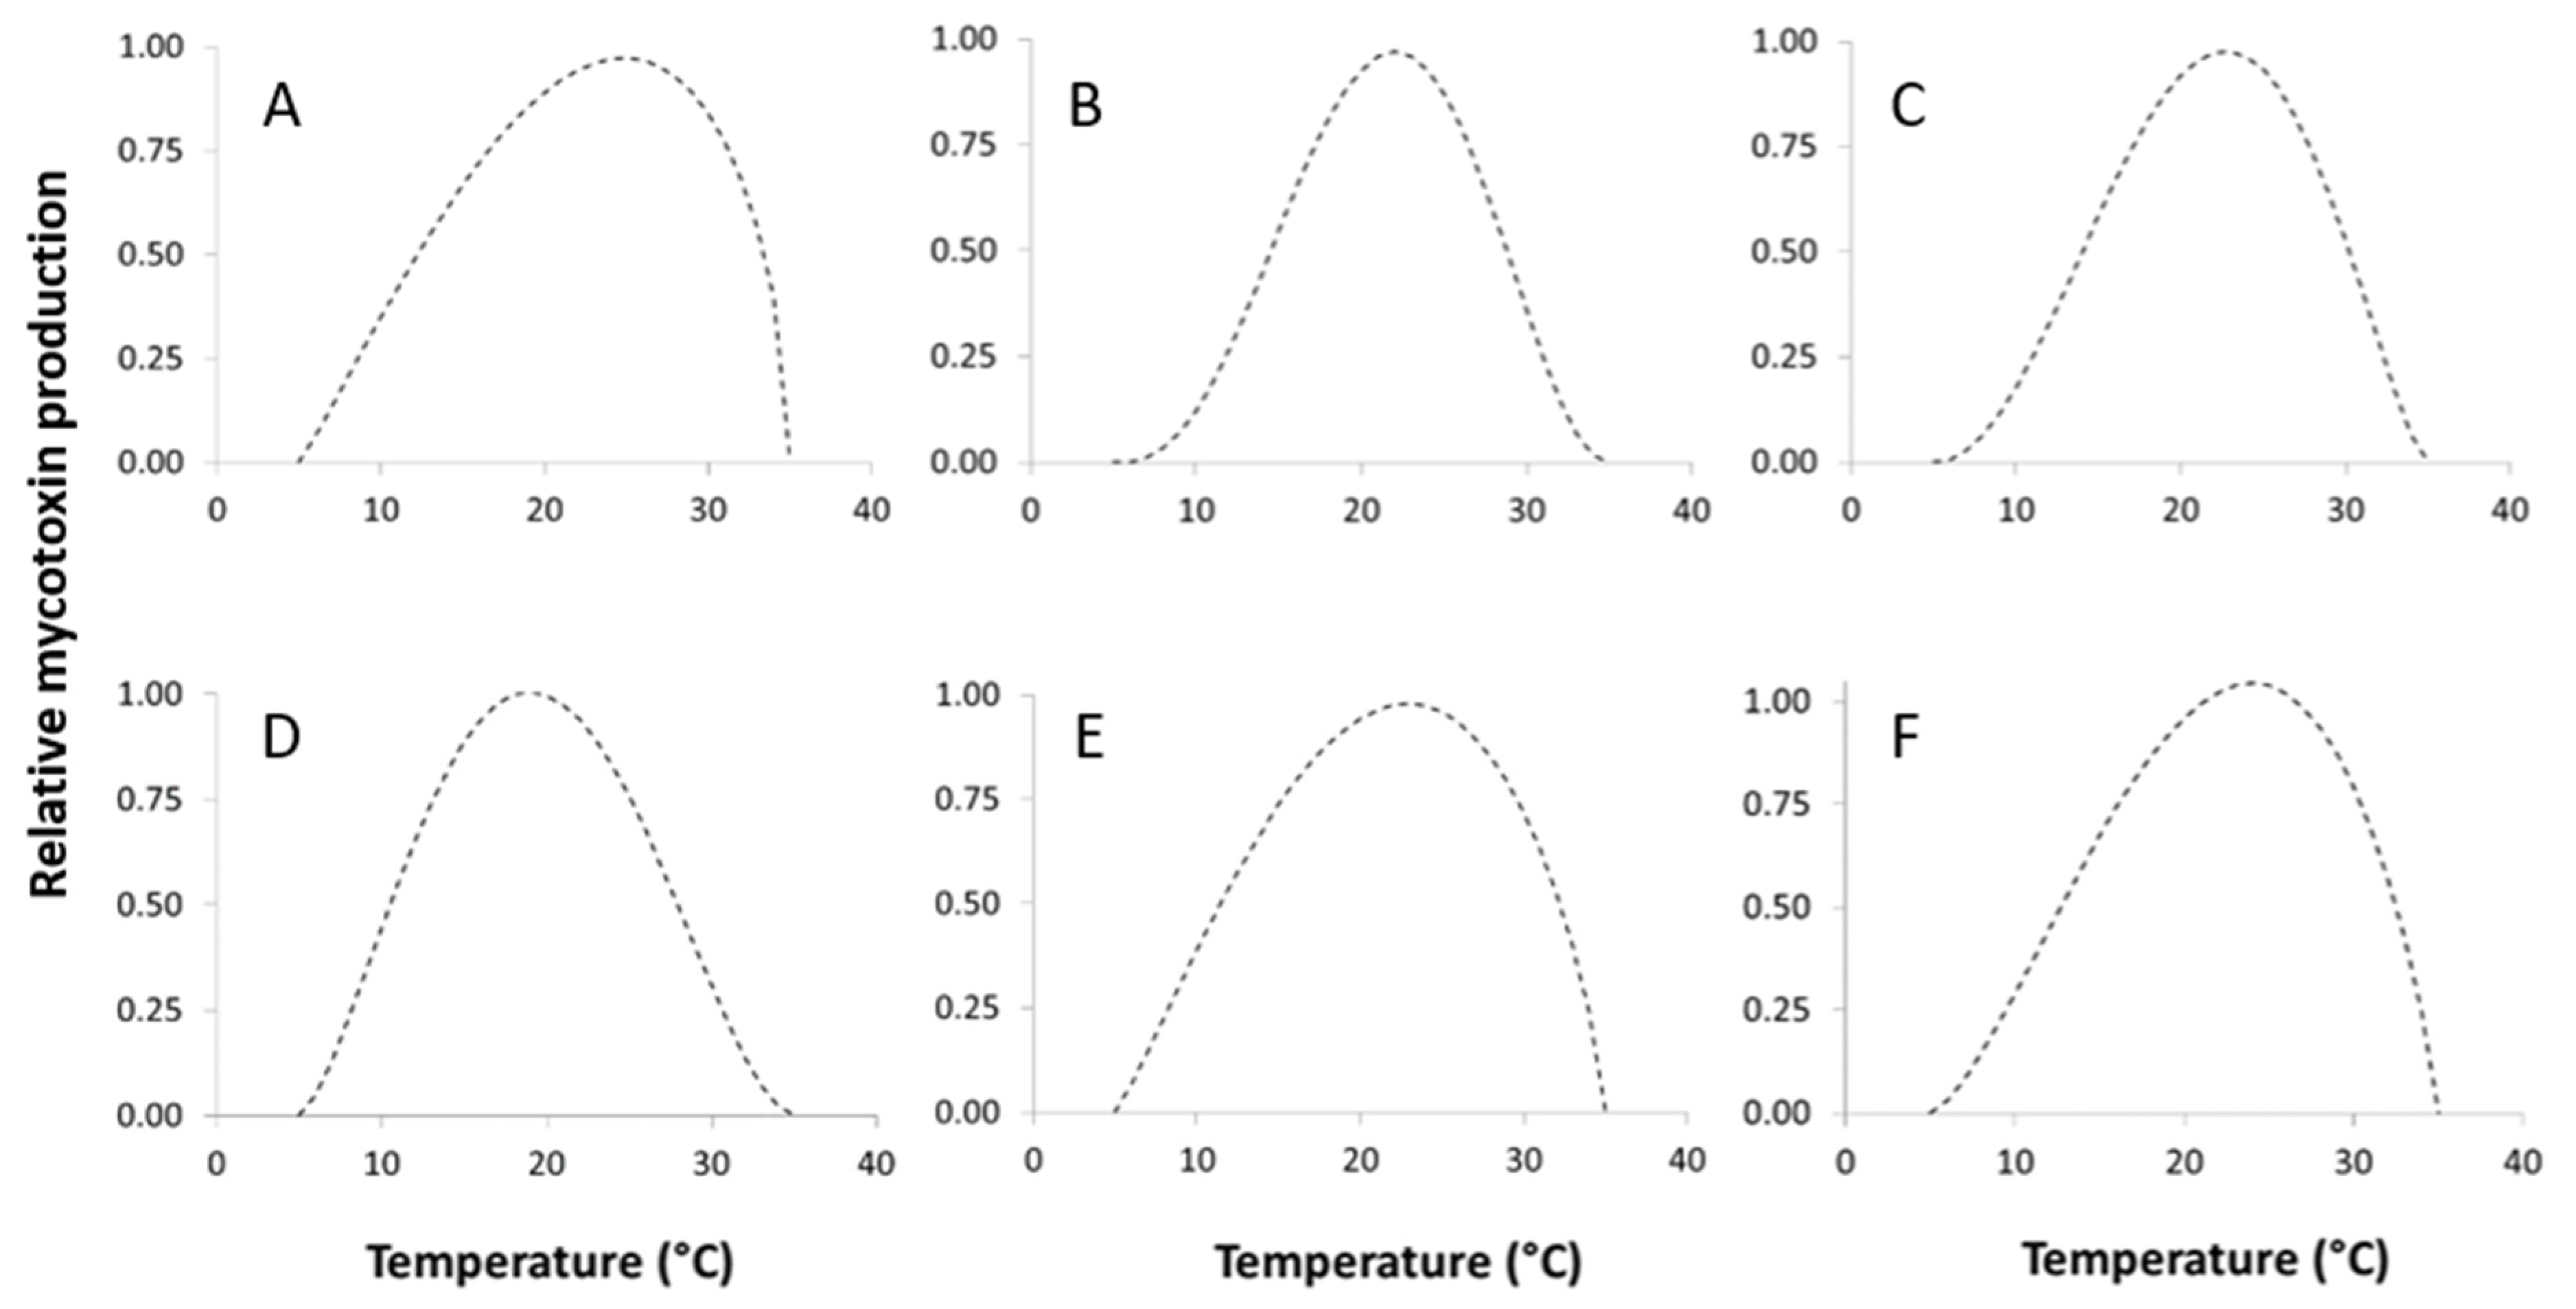
2.5. Modeling the Effect of Temperature and Water Activity on Toxin Production
2.5.1. Temperature
2.5.2. Water Activity
3. Discussion
4. Conclusions
5. Materials and Methods
5.1. Fungal Strains
5.2. Culture Media
5.3. Inoculum Preparation, Inoculation and Incubation
5.4. Fungal Growth Measurement
5.5. Mycotoxin Analysis
5.5.1. Reagents and Standards
5.5.2. Toxin Extraction
5.5.3. HPLC-MS/MS Analysis
5.6. Data Analyses
Acknowledgments
Author Contributions
Conflicts of Interest
References
- Banjara, N.; Suhr, M.J.; Hallen-Adams, H.E. Diversity of yeast and mold species from a variety of cheese types. Curr. Microbiol. 2015, 70, 792–800. [Google Scholar] [CrossRef] [PubMed]
- Gkatzionis, K.; Yunita, D.; Linforth, R.S.T.; Dickinson, M.; Dodd, C.E.R. Diversity and activities of yeasts from different parts of a Stilton cheese. Int. J. Food Microbiol. 2014, 107, 109–116. [Google Scholar] [CrossRef] [PubMed]
- Cogan, T.M.; Hill, C. Cheese starter cultures. In Cheese: Chemistry, Physics and Microbiology; Fox, P.F., Ed.; Springer: New York, NY, USA, 1993; Volume 1, pp. 193–255. [Google Scholar]
- De Santi, M.; Sisti, M.; Barbieri, E.; Piccoli, G.; Brandi, G.; Stocchi, V. A combined morphologic and molecular approach for characterizing fungal microflora from a traditional Italian cheese (Fossa cheese). Int. Dairy J. 2010, 20, 465–471. [Google Scholar] [CrossRef]
- Malacarne, M.; Summer, A.; Panari, G.; Pecorari, M. Caratterizzazione chimico-fisica della maturazione del Parmigiano-Reggiano. Sci. Tec. Latt. Casearia 2006, 57, 215–228. [Google Scholar]
- Cakmakci, S.; Gundogdu, E.; Hayaloglu, A.A.; Dagdemir, E.; Gurses, M.; Cetin, B.; Tahmas-Kahyaoglu, D. Chemical and microbiological status and volatile profiles of mouldy Civil cheese, a Turkish mould-ripened variety. Int. J. Food Sci. Technol. 2012, 47, 2405–2412. [Google Scholar] [CrossRef]
- Milani, E.; Shahidi, F.; Mortazavi, S.A.; Reza Vakili, S.A.; Ghoddusi, H.B. Microbiological, biochemical and rheological changes throughout ripening of kurdish cheese. J. Food Saf. 2014, 34, 168–175. [Google Scholar]
- Schiavano, G.F.; Barbieri, E.; Sisti, M.; Gioacchini, A.M.; de Santi, M.; Vallorani, L.; Casadei, L.; Piccoli, G.; Guescini, M.; Stocchi, V.; et al. Characterization of microflora and volatile organic compounds of Fossa (pit) cheese. Ind. Aliment. 2012, 51, 19–32. [Google Scholar]
- Gaborit, P.; Menard, A.; Morgan, F. Impact of ripening strains on the typical flavour of goat cheeses. Int. Dairy J. 2001, 11, 315–325. [Google Scholar]
- Gripon, J.C. Mould-ripened cheese. In Cheese Chemistry, Physics and Microbiology, Major Cheese Groups; Fox, P.F., Ed.; Elsevier Science Publisher Ltd.: Cambridge, UK, 1993; Volume 2. [Google Scholar]
- Panelli, S.; Buffoni, J.S.; Bonacina, C.; Feligini, M. Identification of moulds from the Taleggio cheese environment by the use of DNA barcodes. Food Control 2012, 28, 385–391. [Google Scholar] [CrossRef]
- Battilani, P.; Pietri, A.; Giorni, P.; Formenti, S.; Bertuzzi, T.; Toscani, T.; Virgili, R.; Kozakiewicz, Z. Penicillium population in dry-cured ham manufacturing plants. J. Food Prot. 2007, 70, 975–980. [Google Scholar] [CrossRef] [PubMed]
- Comi, G.; Chiesa, L.; Panseri, S.; Orlic, S.; Iacumin, L. Evaluation of different methods to prevent Penicillium nordicum growth on and ochratoxin A production in country-style sausages. World Mycotoxin J. 2013, 6, 411–418. [Google Scholar] [CrossRef]
- Rodríguez, A.; Rodríguez, M.; Martín, A.; Núñez, F.; Córdoba, J.J. Evaluation of hazard of aflatoxin B1, ochratoxin A and patulin production in dry-cured ham and early detection of producing moulds by qPCR. Food Control 2012, 27, 118–126. [Google Scholar] [CrossRef]
- Filtenborg, O.; Frisvad, J.C.; Thrane, U. Moulds in food spoilage. Int. J. Food Microbiol. 1996, 33, 85–102. [Google Scholar] [CrossRef]
- Hymery, N.; Vasseur, V.; Coton, M.; Mounier, J.; Jany, J.L.; Barbier, G.; Coton, E. Filamentous fungi and mycotoxins in cheese: A review. Compr. Rev. Food Sci. Food Saf. 2014, 13, 437–456. [Google Scholar] [CrossRef]
- Chang, S.C.; Wei, Y.H.; Wei, D.L.; Chen, Y.Y.; Jong, S.C. Factors affecting the production of eremofortin C and PR toxin in Penicillium roqueforti. Appl. Environ. Microbiol. 1991, 57, 2581–2585. [Google Scholar] [PubMed]
- Bailly, J.D.; Querin, A.; Le Bars-Bailly, S.; Benard, G.; Guerre, P. Citrinin production and stability in cheese. J. Food Prot. 2002, 65, 1317–1321. [Google Scholar] [CrossRef] [PubMed]
- Le Bars, J. Cyclopiazonic acid production by Penicillium camemberti thom and natural cccurrence of this mycotoxin in cheese. Appl. Environ. Microbiol. 1979, 6, 1052–1055. [Google Scholar]
- Taniwaki, M.H.; Hocking, A.D.; Pitt, J.I.; Fleet, G.H. Growth and mycotoxin production by fungi in atmospheres containing 80% carbon dioxide and 20% oxygen. Int. J. Food Microbiol. 2010, 143, 218–225. [Google Scholar] [CrossRef] [PubMed]
- Lund, F.; Filtenborg, O.; Frisvad, J.C. Associated mycoflora of cheese. Food Microbiol. 1995, 12, 173–180. [Google Scholar] [CrossRef]
- Wagener, R.E.; Davis, N.D.; Diener, U.L. Penitrem A and roquefortine production by Penicillium commune. Appl. Environ. Microbiol. 1980, 39, 882–887. [Google Scholar] [PubMed]
- Erdogan, A.; Sert, S. Mycotoxin-forming ability of two Penicillium roqueforti strains in blue moldy tulum cheese ripened at various temperatures. J. Food Prot. 2004, 67, 533–535. [Google Scholar] [CrossRef] [PubMed]
- Finoli, C.; Vecchio, A.; Galli, A.; Dragoni, I. Roquefortine C occurrence in blue cheese. J. Food Prot. 2001, 64, 246–251. [Google Scholar] [CrossRef] [PubMed]
- Taniwaki, M.H.; van Dender, A.G.F. Growth of fungi and mycotoxin production on cheese under modified atmospheres. Int. J. Food Microbiol. 2001, 68, 125–133. [Google Scholar] [CrossRef]
- Schmidt-Heydt, M.; Graf, E.; Stoll, D.; Rolf, G. The biosynthesis of ochratoxin A by Penicillium as one mechanism of adaptation to NaCl rich foods. Food Microbiol. 2012, 29, 233–241. [Google Scholar] [CrossRef] [PubMed]
- Samson, R.A.; Frisvad, J.C. Penicillium subgenus Penicillium: New taxonomy schemes and mycotoxins and other extrolites. Stud. Mycol. 2004, 49, 1–266. [Google Scholar]
- Altug, T. Introduction to Toxicology and Food; CRC Press: Boca Raton, FL, USA, 2003; pp. 1–168. [Google Scholar]
- Abd Alla, E.A.; Metwally, M.M.; Mehriz, A.M.; Abu Sree, Y.H. Sterigmatocystin—incidence, fate and production by A. versicolor in Ras cheese. Mycotoxin Res. 1997, 13, 61–66. [Google Scholar] [CrossRef]
- Metwally, M.; El-Sayed, A.A.; Mehriz, A.; Abu, S.Y. Toxigenic fungi isolated from Roquefort cheese. Mycopathologia 1979, 66, 187–190. [Google Scholar]
- Northolt, M.D.; Egmond, H.P.V.; Soentoro, P.; Deijll, E. Fungal growth and the presence of sterigmatocystin in hard cheese. J. Assoc. Off. Anal. Chem. 1980, 63, 115–119. [Google Scholar] [PubMed]
- Rank, C.; Nielsen, K.F.; Larsen, T.O.; Varga, J.; Samson, R.A.; Frisvad, J.C. Distribution of sterigmatocystin in filamentous fungi. Fungal Biol. 2011, 115, 406–420. [Google Scholar] [CrossRef] [PubMed]
- Engel, G.; von Milczewski, K.E.; Prokopek, D.; Teuber, M. Strain-specific synthesis of Mycophenolic acid by Penicillium roqueforti in blue-veined cheese. Appl. Environ. Microbiol. 1982, 43, 1034–1040. [Google Scholar] [PubMed]
- Lafont, P.; Siriwardana, M.G.; Lafont, J. Contamination of cheeses by mycotoxins. Med. Nutr. 1979, 15, 257–262. [Google Scholar]
- Zambonin, C.G.; Monaci, L.; Aresta, A. Determination of cyclopiazonic acid in cheese samples using solid-phase microextraction and high performance liquid chromatography. Food Chem. 2011, 75, 249–254. [Google Scholar] [CrossRef]
- Ammar, H.; Michailis, G.; Lisovsky, T. A screen of yeast respiratory mutants for sensitivity against the mycotoxin citrinin identifies the vascular ATPase as an essential factor for the toxicity mechanism. Curr. Genet. 2000, 37, 277–284. [Google Scholar] [CrossRef] [PubMed]
- Singh, N.D.; Sharma, A.K.; Dwivedi, P.; Patil, R.D.; Kumar, M. Citrinin and endosulfan induced maternal toxicity in pregnant wistar rats: Pathomorphological study. J. Appl. Toxicol. 2007, 27, 589–601. [Google Scholar] [CrossRef] [PubMed]
- Ostry, V.; Malir, F.; Ruprich, J. Producers and important dietary sources of ochratoxin A and citrinin. Toxins 2013, 5, 1574–1586. [Google Scholar] [CrossRef] [PubMed]
- Erdogan, A.; Gurses, M.; Sert, S. Isolation of moulds capable of producing mycotoxins from blue mouldy Tulum cheeses produced in Turkey. Int. J. Food Microbiol. 2003, 85, 83–85. [Google Scholar] [CrossRef]
- Fernandez-Bodega, M.A.; Mauriz, E.; Gomez, A.; Martin, J.F. Proteolytic activity, mycotoxins and andrastin A in Penicillium roqueforti strains isolated from Cabrales, Valdeon and Bejes-Tresviso local varieties of blue-veined cheeses. Int. J. Food Microbiol. 2009, 136, 18–25. [Google Scholar] [CrossRef] [PubMed]
- Cakmakci, S.; Gurses, M.; Hayaloglu, A.A.; Cetin, B.; Sekerci, P.; Dagdemir, E. Mycotoxin production capability of Penicillium roqueforti in strains isolated from mould-ripened traditional Turkish civil cheese. Food Addit. Contam. Part A 2015, 32, 245–249. [Google Scholar] [CrossRef] [PubMed]
- Siemens, K.; Zawistowski, J. Occurrence of PR imine, a metabolite of Penicillium roqueforti, in Blue cheese. J. Food Prot. 1993, 56, 317–319. [Google Scholar] [CrossRef]
- Minervini, F.; Monaci, L.; Montagna, M.T.; Dragoni, I. Assessment of mycotoxin production by Aspergillus and Penicillium fungi isolated from dairy products. Ind. Aliment. 2002, 41, 1336–1340. [Google Scholar]
- Dall’Asta, C.; De Dea Lindner, J.; Galaverna, G.; Dossena, A.; Neviani, E.; Marchelli, R. The occurrence of ochratoxin A in blue cheese. Food Chem. 2008, 106, 729–734. [Google Scholar] [CrossRef]
- Analytis, S. Über die relation zwischen biologischer entwicklung und temperatur bei phytopathogenen pilzen. J. Phytopathol. 1977, 90, 64–76. [Google Scholar] [CrossRef]
- Grimm, K.; Ram, N. Nonlinear growth curves in developmental research. Child Dev. 2011, 82, 1357–1371. [Google Scholar] [CrossRef] [PubMed]
- Marin, P.; Palmero, D.; Jurado, M. Effect of solute and matric potential on growth rate of fungal species isolated from cheese. Int. Dairy J. 2014, 36, 89–94. [Google Scholar] [CrossRef]
- Fontaine, K.; Hymery, N.; Lacroix, M.Z.; Puel, S.; Puel, O.; Rigalma, K.; Gaydou, V.; Coton, E.; Mounier, J. Influence of intraspecific variability and abiotic factors on mycotoxin production in Penicillium roqueforti. Int. J. Food Microbiol. 2015, 215, 187–193. [Google Scholar] [CrossRef] [PubMed]
- Giorni, P.; Magan, N.; Pietri, A.; Battilani, P. Growth and aflatoxin production of an Italian strain of Aspergillus flavus: Influence of ecological factors and nutritional substrates. World Mycotoxin J. 2011, 4, 425–432. [Google Scholar] [CrossRef]
- Manabe, M. Fermented foods and mycotoxins. Mycotoxins 2001, 51, 25–28. [Google Scholar] [CrossRef]
- Samson, R.A.; Houbraken, J.; Thrane, U.; Frisvad, J.C.; Andersen, B. Food and Indoor Fungi; CBS KNAW Biodiversity Center: Utrecht, The Netherlands, 2010; p. 390. [Google Scholar]
- Larsen, T.O.; Gareis, M.; Frisvad, J.C. Cell cytotoxicity and mycotoxin and secondary metabolite production by common penicillia on cheese agar. J. Agric. Food Chem. 2002, 50, 6148–6152. [Google Scholar] [CrossRef] [PubMed]
- Kokkonen, M.; Jestoi, M.; Rizzo, A. The effect of substrate on mycotoxin production of selected Penicillium strains. Int. J. Food Microbiol. 2005, 99, 207–214. [Google Scholar] [CrossRef] [PubMed]
- Eriksen, G.S.; Moldes-Anaya, A.; Faeste, C.K. Penitrem A and analogues: Toxicokinetics, toxicodynamics including mechanism of action and clinical significance. World Mycotoxin J. 2013, 6, 263–272. [Google Scholar] [CrossRef]
- Tancinova, D.; Mokry, M.; Barborakova, Z.; Maskova, Z. Mycobiota of spices and aromatic herbs. Potravin. Sci. J. Food Ind. 2014, 8, 172–177. [Google Scholar]
- Kokkonen, M.; Jestoi, M.; Rizzo, A. Determination of selected mycotoxins in mould cheeses with liquid chromatography coupled to tandem with mass spectrometry. Food Addit.Contam. 2005, 22, 449–456. [Google Scholar] [CrossRef] [PubMed]
- Polonsky, J.; Merrien, M.A.; Scott, P.M. Roquefortine and isofumigaclavine A, alkaloids from Penicillium roqueforti. Ann. Nutr. Aliment. 1977, 31, 963–968. [Google Scholar] [PubMed]
- Cheeseman, K.; Ropars, J.; Renault, P.; Dupont, J.; Gouzy, J.; Branca, A.; Abraham, A.L.; Ceppi, M.; Conseiller, E.; Debuchy, R.; et al. Multiple recent horizontal transfers of a large genomic region in cheese making fungi. Nat. Commun. 2014, 5, 2876. [Google Scholar] [CrossRef] [PubMed]
- Van Egmond, H.P. Mycotoxins in dairy products. Food Chem. 1983, 11, 289–307. [Google Scholar] [CrossRef]
- Schmidt-Heydt, M.; Magan, N.; Geisen, R. Stress induction of mycotoxin biosynthesis genes by abiotic factors. FEMS Microbiol. Lett. 2008, 284, 142–149. [Google Scholar] [CrossRef] [PubMed]
- Rossi, V.; Pattori, E.; Ravanetti, A.; Giosuè, S. Effect of constant and fluctuating temperature regimes on sporulation of four fungi causing head blight of wheat. J. Plant Pathol. 2002, 84, 95–105. [Google Scholar]
- Nazari, L.; Manstretta, V.; Rossi, V. A non-linear model for temperature-dependent sporulation and T-2 and HT-2 production of Fusarium langsethiae and Fusarium sporotrichioides. Fungal Biol. 2016, 120, 562–571. [Google Scholar] [CrossRef] [PubMed]
- Battilani, P.; Camardo Leggieri, M.; Rossi, V.; Giorni, P. AFLA-maize, a mechanistic model for Aspergillus flavus infection and aflatoxin B1 contamination in maize. Comput. Electron. Agric. 2013, 94, 38–46. [Google Scholar] [CrossRef]
- Battilani, P.; Camardo Leggieri, M. OTA-grapes, a mechanistic model to predict ochratoxin A risk in grapes, a step beyond the systems approach. Toxins 2015, 7, 3012–3029. [Google Scholar]
- Dantigny, P.; Guilmart, A.; Bensoussan, M. Basis of predictive mycology. Int. J. Food Microbiol. 2005, 100, 187–196. [Google Scholar] [CrossRef] [PubMed]
- Garcia, D.; Ramos, A.J.; Sanchis, V.; Marín, S. Modelling mould growth under suboptimal environmental conditions and inoculum size. Food Microbiol. 2010, 27, 909–917. [Google Scholar] [CrossRef] [PubMed]
- Rossi, V.; Giosuè, S.; Caffi, T. Modelling plant diseases for decision making in crop protection. In Precision Crop Protection—The Challenge and Use of Heterogeneity; Oerke, E.C., Gerhards, R., Menz, G., Sikora, R.A., Eds.; Springer: Dordrecht, The Netherlands, 2010; pp. 241–258. [Google Scholar]
- Giorni, P.; Camardo Leggieri, M.; Magan, N.; Battilani, P. Comparison of ecological needs for sporulation of Aspergillus flavus sclerotia on natural and artificial substrates. Fungal Biol. 2012, 116, 637–742. [Google Scholar] [CrossRef] [PubMed]
- Frisvad, J.C.; Smedsgaard, J.; Larsen, T.O.; Samson, R.A. Mycotoxins, drugs and other extrolites produced by species in Penicillium subgenus Penicillium. Stud. Mycol. 2004, 49, 201–241. [Google Scholar]
- Dallyn, H.; Fox, A. Spoilage of material of reduced water activity by xerophilic fungi. In Microbial Growth and Survival in Extremes of Environment; Gould, G.H., Corry, J.E.L., Eds.; Academic Press: London, UK, 1980; Volume 15, pp. 129–139. [Google Scholar]
- Pitt, J.I. The Genus Penicillium and Its Teleomorphic States Eupenicillium and Talaromyces; Academic Press Inc.: London, UK, 1979. [Google Scholar]


| Fungi | Mycotoxin | Toxic Effect | Reported By |
|---|---|---|---|
| Aspergillus spp. | Sterigmatocystin (STC) | Carcinogenic, mutagenic [28] | [29,30,31,32] |
| P. brevicompactum | Mycophenolic acid (MPA) | Mutagenic, possible acute toxicity [33] | [34] |
| P. camemberti | Cyclopiazonic acid | Neurotoxic, possible acute toxicity [28] | [19,35] |
| P. citrinum | Citrinin (CIT) | Nephrotoxic, teratogenic [36,37] | [18,38] |
| P. crustosum | Penitrem A (PA) | Neurotoxic [28] | [21] |
| P. expansum | Patulin | Carcinogenic, mutagenic, teratogenic, harmful to liver, possible acute toxicity [28] | [39,40] |
| P. roqueforti, P. crustosum | Roquefortine C (ROQ-C) | Neurotoxic [28] | [40,41] |
| P. roqueforti | PR Toxin | Mutagenic, Carcinogenic [42] | [39,43] |
| P. verrucosum, P. nordicum | Ochratoxin A (OTA) | Nephrotoxic, carcinogenic, hepatotoxic [28] | [44] |
| Species | Experiment 1. Temperature * | Experiment 2. Water Activity ** | ||
|---|---|---|---|---|
| Diameter Max (cm) | Temperature (°C) | Diameter Max (cm) | aw | |
| A. versicolor | 3.1 | 25 | 3.1 | 0.96 |
| P. camemberti | 4.3 | 25 | 4.0 | 0.99 |
| P. citrinum | 4.2 | 30 | 3.1 | 0.99 |
| P. crustosum | 5.1 | 25 | 5.0 | 0.99 |
| P. nalgiovense | 4.8 | 25 | 4.1 | 0.99 |
| P. nordicum | 3.7 | 20 | 3.3 | 0.99 |
| P. roqueforti | 5.5 | 25 | 5.5 | 0.99 |
| P. verrucosum | 4.0 | 20 | 4.0 | 0.99 |
| Fungi | Variable | Tmin/Tmax | Estimated Parameters (Standard Error) | |||
|---|---|---|---|---|---|---|
| a | b | c | R2 | |||
| Relative Growth | ||||||
| A. versicolor | T | 5/35 | 6.85 (0.353) * | 2.09 (0.122) | 0.63 (0.122) | 0.964 |
| aw | −32.719 (3.478) | −36.351 (3.958) | 0.953 (0.039) | 0.956 | ||
| P. camemberti | T | 5/40 | 3.22 (0.150) | 0.72 (0.049) | 4.10 (0.779) | 0.823 |
| aw | 29.12 (156.829) | −24.07 (11.615) | 198.77 (32,649.12) | 0.925 | ||
| P. citinum | T | 5/40 | 8.03 (0.387) | 2.33 (0.114) | 1.12 (0.132) | 0.961 |
| aw | 55.72 (8.565) | −59.74 (9.294) | 1.04 (0.053) | 0.966 | ||
| P. crustosum | T | 5/40 | 3.95 (0.379) | 1.01 (0.115) | 1.24 (0.274) | 0.798 |
| aw | 32.69 (8.161) | −34.57 (9.079) | 1.22 (0.233) | 0.927 | ||
| P. nalgiovense | T | 5/40 | 4.70 (0.245) | 1.25 (0.074) | 1.56 (0.209) | 0.899 |
| aw | 59.29 (9.254) | −64.24 (10.1) | 1.01 (0.044) | 0.970 | ||
| P. nordicum | T | 0/35 | 5.15 (0.200) | 1.50 (0.063) | 1.41 (0.14) | 0.900 |
| aw | 32.72 (3.478) | −36.35 (3.958) | 0.94 (0.039) | 0.956 | ||
| P. roqueforti | T | 5/40 | 4.26 (0.262) | 1.08 (0.083) | 2.45 (0.498) | 0.902 |
| aw | 73.08 (44.606) | −75.11 (47.168) | 1.28 (0.601) | 0.967 | ||
| P. verrucosum | T | 5/35 | 5.01 (0.573) | 1.80 (0.250) | 0.44 (0.043) | 0.936 |
| aw | 58.61 (8.441) | −63.15 (9.176) | 1.03 (0.043) | 0.979 | ||
| Relative Mycotoxin Production | ||||||
| A. versicolor STC | T | 5/35 | 6.31 (1.842) | 1.95 (0.659) | 0.57 (0.386) | 0.727 |
| P. crustosum PA | T | 5/35 | 4.78 (0.457) | 1.31 (0.145) | 2.19 (0.607) | 0.942 |
| P. crustosum ROQ-C | T | 5/35 | 5.14 (0.330) | 1.43 (0.103) | 1.53 (0.258) | 0.981 |
| P. nordicum OTA | T | 5/35 | 3.65 (0.138) | 0.87 (0.042) | 1.79 (0.185) | 0.991 |
| P. roqueforti ROQ-C | T | 5/35 | 5.19 (0.440) | 1.48 (0.139) | 0.79 (0.161) | 0.986 |
| P. verrucosum OTA | T | 5/35 | 6.30 (0.224) | 1.72 (0.066) | 0.87 (0.074) | 0.998 |
| A. versicolor | P. camemberti | P. citrinum | P. crustosum | P. nordicum | P. roqueforti | P. verrucosum | ||||||||||||||||
|---|---|---|---|---|---|---|---|---|---|---|---|---|---|---|---|---|---|---|---|---|---|---|
| T (°C) | aw | STC | CIT | CPA | CIT | PA | ROQ | OTA | MPA | ROQ | PR | CIT | OTA | |||||||||
| Temperature | ||||||||||||||||||||||
| 5 | 0.99 | <LOD # | a † | 1.1 | <LOD | a | 0.9 | a | 7.4 | b | 6.7 | a | <LOD | a | <LOD | a | <LOD | a | <LOD | <LOD | <LOD | a |
| 10 | 0.99 | 7.4 | bc | 1.0 | 0.5 | a | 66.8 | b | 31.7 | c | 237.4 | b | 0.2 | a | 0.9 | c | 112.3 | b | <LOD | <LOD | <LOD | a |
| 15 | 0.99 | 16.9 | c | 0.7 | 0.4 | a | 63.8 | b | 150.9 | e | 630.8 | bc | 4.0 | b | 1.7 | d | 246.9 | c | <LOD | <LOD | 0.8 | b |
| 20 * | 0.99 | 81 | d | 3.8 | 7.6 | b | 1187.8 | c | 152.7 | e | 679.5 | c | 9.0 | b | 0.4 | b | 324.9 | d | <LOD | <LOD | 4.6 | d |
| 25 | 0.99 | 91.4 | d | 0.5 | 20.3 | c | 1147.5 | c | 197.2 | e | 824.3 | c | 3.7 | b | <LOD | a | 282.0 | d | <LOD | <LOD | 12.6 | e |
| 30 | 0.99 | 284 | e | <LOD | <LOD | a | 1728.9 | c | 81.8 | d | 615.6 | bc | 0.1 | a | <LOD | a | 248.0 | c | <LOD | <LOD | 2.5 | c |
| 35 | 0.99 | 6.6 | b | <LOD | <LOD | a | 2918.1 | c | <LOD | a | <LOD | a | <LOD | a | <LOD | a | 0.1 | a | <LOD | <LOD | <LOD | a |
| Water activity | ||||||||||||||||||||||
| 20 | 0.93 | <LOD | <LOD | <LOD | 733 | 25. 6 | 149.0 | <LOD | <LOD | 68.2 | <LOD | <LOD | <LOD | |||||||||
| 20 | 0.96 | 4.4 | 1.0 | 0.3 | 100.2 | 59.6 | 644.9 | 0.8 | 21.1 | 335.5 | <LOD | <LOD | <LOD | |||||||||
| Species | Code | Mycotoxin (Abbreviation) |
|---|---|---|
| A. versicolor | CBS 108959 | Sterigmatocystin (STC) |
| P. camemberti | CBS 122399 | Citrinin (CIT), Cyclopyazonic Acid (CPA) |
| P. citrinum | CBS 122396 | CIT, CPA |
| P. crustosum | CBS 115503 | Penitrem A (PA), Roquefortine C (ROQ-C) |
| P. nalgiovense | CBS 109609 | # |
| P. nordicum | CBS 112573 | Ochratoxin A (OTA) |
| P. roqueforti | CBS 221.30 | Mycophenolic Acid (MPA), ROQ-C, PR Toxin (PR-TOXIN) |
| P. verrucosum | CBS 325.92 | CIT, OTA |
| NaCl (g/100 mL) | aw |
|---|---|
| 7.01 | 0.96 |
| 11.98 | 0.93 |
| 16.56 | 0.90 |
| 19.40 | 0.87 |
| 23.55 | 0.84 |
| 30.10 | 0.81 |
| 39.90 | 0.78 |
© 2016 by the authors; licensee MDPI, Basel, Switzerland. This article is an open access article distributed under the terms and conditions of the Creative Commons Attribution (CC-BY) license (http://creativecommons.org/licenses/by/4.0/).
Share and Cite
Camardo Leggieri, M.; Decontardi, S.; Bertuzzi, T.; Pietri, A.; Battilani, P. Modeling Growth and Toxin Production of Toxigenic Fungi Signaled in Cheese under Different Temperature and Water Activity Regimes. Toxins 2017, 9, 4. https://doi.org/10.3390/toxins9010004
Camardo Leggieri M, Decontardi S, Bertuzzi T, Pietri A, Battilani P. Modeling Growth and Toxin Production of Toxigenic Fungi Signaled in Cheese under Different Temperature and Water Activity Regimes. Toxins. 2017; 9(1):4. https://doi.org/10.3390/toxins9010004
Chicago/Turabian StyleCamardo Leggieri, Marco, Simone Decontardi, Terenzio Bertuzzi, Amedeo Pietri, and Paola Battilani. 2017. "Modeling Growth and Toxin Production of Toxigenic Fungi Signaled in Cheese under Different Temperature and Water Activity Regimes" Toxins 9, no. 1: 4. https://doi.org/10.3390/toxins9010004
APA StyleCamardo Leggieri, M., Decontardi, S., Bertuzzi, T., Pietri, A., & Battilani, P. (2017). Modeling Growth and Toxin Production of Toxigenic Fungi Signaled in Cheese under Different Temperature and Water Activity Regimes. Toxins, 9(1), 4. https://doi.org/10.3390/toxins9010004