Communication

A Rapid Assay to Detect Toxigenic Penicillium spp. Contamination in Wine and Musts

by
Simona Marianna Sanzani
1,*,
Monica Marilena Miazzi
1,
Valentina Di Rienzo
1,2,
Valentina Fanelli
1,2,
Giuseppe Gambacorta
1,
Maria Rosaria Taurino
3 and
Cinzia Montemurro
1,2
1
Dipartimento di Scienze del Suolo, della Pianta e degli Alimenti, Università degli Studi di Bari Aldo Moro, Via G. Amendola 165/A, 70126 Bari, Italy
2
Sinagri s.rl. Spin-off, Università degli Studi di Bari Aldo Moro, Via G. Amendola 165/A, 70126 Bari, Italy
3
Agro.Biolab Laboratory s.r.l., SP240 km 13,800, 70018 Rutigliano (BA), Italy
*
Author to whom correspondence should be addressed.
Toxins 2016, 8(8), 235; https://doi.org/10.3390/toxins8080235
Submission received: 5 July 2016 / Revised: 29 July 2016 / Accepted: 4 August 2016 / Published: 8 August 2016
(This article belongs to the Collection Understanding Mycotoxin Occurrence in Food and Feed Chains)

Abstract

:
Wine and fermenting musts are grape products widely consumed worldwide. Since the presence of mycotoxin-producing fungi may greatly compromise their quality characteristics and safety, there is an increasing need for relatively rapid “user friendly” quantitative assays to detect fungal contamination both in grapes delivered to wineries and in final products. Although other fungi are most frequently involved in grape deterioration, secondary infections by Penicillium spp. are quite common, especially in cool areas with high humidity and in wines obtained by partially dried grapes. In this work, a single-tube nested real-time PCR approach—successfully applied to hazelnut and peanut allergen detection—was tested for the first time to trace Penicillium spp. in musts and wines. The method consisted of two sets of primers specifically designed to target the β-tubulin gene, to be simultaneously applied with the aim of lowering the detection limit of conventional real-time PCR. The assay was able to detect up to 1 fg of Penicillium DNA. As confirmation, patulin content of representative samples was determined. Most of analyzed wines/musts returned contaminated results at >50 ppb and a 76% accordance with molecular assay was observed. Although further large-scale trials are needed, these results encourage the use of the newly developed method in the pre-screening of fresh and processed grapes for the presence of Penicillium DNA before the evaluation of related toxins.

1. Introduction

Wine is one of the major processed grape (Vitis vinifera L.) products, with a worldwide production of 26,404,435 tons [1], obtained by the total or partial alcoholic fermentation of grapes or musts [2]. Usually, red wines are produced from black grape musts, and fermentation occurs in presence of the grape skins, whereas white wines are produced by fermentation of the juice obtained by pressing crushed grapes. The process stops either naturally, when sugars are completely converted, or artificially, by lowering the temperature. Musts can also undergo “enrichment”—that is, an increase in the sugar concentration prior to fermentation—to gain a proper final level of alcohol in the wine. However, fermenting musts are not only an intermediate product, as they are directly consumed in wine-growing areas of Northern Europe (mainly Germany and Austria) during the autumn season [3], in particular by children [4]. Their overall quality is usually poor, as they represent the wastes of the production of quality-tested wine. Therefore, the risk of contamination by toxic metabolites produced by grape-contaminating fungi (e.g., Aspergillus spp., Penicillium spp., Alternaria spp.) is relevant. Although Aspergillus and ochratoxin A are considered the main genus and mycotoxin associated to grapes, respectively [5], Penicillium is emerging as a cause of postharvest decay. For instance, Diaz et al. [6] collected 132 isolates—mainly P. brevicompactum, P. expansum, and P. glabrum—from apparently healthy grape clusters and in the air of vineyards and wineries, detecting the mycotoxin patulin in Cabernet Sauvignon musts, although its concentration decreased with fermentation. Therefore, mycotoxins may represent a serious concern, especially if contamination takes place after fermentation in environments dedicated to wine storage and bottling and in wines obtained from partially dried grapes. Indeed, Picco and Rodolfi [7] found high fungal counts in the bottling areas of industrial wineries, including Penicillium species such as P. chrysogenum, P. citreonigrum, P. crustosum, and P. viridicatum, whose constant presence potentially contaminate wines and may be hazardous to human health.
The 58 species reported in Penicillium subgenus Penicillium produce a large number of bioactive extrolites (secondary metabolites), including several mycotoxins (ochratoxins, citrinin, patulin, penicillic acid, verrucosidin, penitrem A, cyclopazonic acid, etc.) [8]. However, among them, only certain species and related metabolites are present on grapes. A major role is played by P. expansum and the toxin patulin [9], which is mutagenic, neurotoxic, immunotoxic, genotoxic, and has deleterious gastrointestinal effects in rodents [10]. Due to its toxicity, the World Health Organization (WHO) established a provisional maximum tolerable daily intake (PMTDI) of 0.4 μg/kg body weight [11]. Moreover, the European Commission established a maximum concentration of 50 μg/kg of patulin in fruit juices and nectars, reconstituted fruit juices, spirit drinks, cider, and other fermented drinks derived from or containing apples; 25 μg/kg for solid apple products; and 10 μg/kg for baby food [12]. Finally, other Countries outside Europe also set up regulatory limits—e.g., in Japan, the Ministry of Health, Labour, and Welfare (MHLW) adopted the maximum level of 50 μg/kg for apple juices [13]. In contrast, no regulation for patulin content in grapes and wines exists worldwide.
Some conventional PCR assays have been reported for the detection of Penicillium spp. [14,15,16]. However, the advent of real-time PCR (qPCR) permitted the more-efficient detection and quantification of Penicillium DNA in a wide variety of food matrices. For instance, a qPCR assay based on the β-tubulin gene was proposed to monitor Penicillium development on apples [17]. More recently, the innovative High Resolution Melting (HRM) technique was applied successfully to detect Penicillium spp. from apples, sweet cherries, and table grapes [9]. Finally, qPCR assays have been set up targeting patulin biosynthetic genes in terms of presence and expression [18,19]. However, most of the molecular assays targeting pathogens in biological matrices suffer from difficulties in extracting DNA of good quality and quantity, and from low pathogen representation.
The combined use of nested PCR and qPCR in a single-tube assay might enhance both the sensitivity and specificity of pathogen detection in foods. In fact, nested PCR allows the production of fragments with two different sizes, increasing the initial template. The use of the fluorescent molecule SYBR Green during the qPCR assay enables the direct monitoring of fragment production. Their combination in a single-tube could help to reduce time and cost of analysis, without losing efficiency. Bergerová et al. [20] and Costa et al. [21,22] used a similar approach for the detection of peanut, hazelnut, and almond allergens in food, respectively.
The aim of this work was to set up a diagnostic tool based on single-tube nested qPCR for the detection and semi-quantification of Penicillium spp. in musts and wines, as a quick and sensitive pre-screening of the putative presence of mycotoxins with health significance for consumers and economic significance for retailers.

2. Results

2.1. Set up of Experimental Design

Two sets of primer pairs designed upon a portion of β-tubulin gene, with different annealing temperatures, were used to detect the presence of Penicillium spp. in extracted samples. The first set of primers (NESF-NESR) generating PCR fragments of 320 bp worked as the “outer” primers to delineate the chosen target sequence (Figure 1). This primer pair was selected to hybridize at a higher temperature (60 °C), conferring selectivity to the reaction. The second set of primers, HRMF-HRMR, producing PCR fragments of 96 bp, was defined to act as “inner” primers at lower hybridization temperatures (55 °C). In order to perform the single-tube nested real-time PCR approach, two independent temperature phases were established. During phase 1, PCR fragments of 320 bp were amplified, to serve as DNA template later on in the reaction, with no fluorescence acquisition. Phase 2 was planned to obtain PCR fragments of 96 bp using the 320 bp fragments as template, and the collection of fluorescence was performed at the end of each cycle. The number of cycles to be used in each phase was selected according to the best performance in nested qPCR trials: phase 1 was set at 15 cycles, whereas phase 2—with fluorescence signal acquisition—was carried out using 30 cycles.

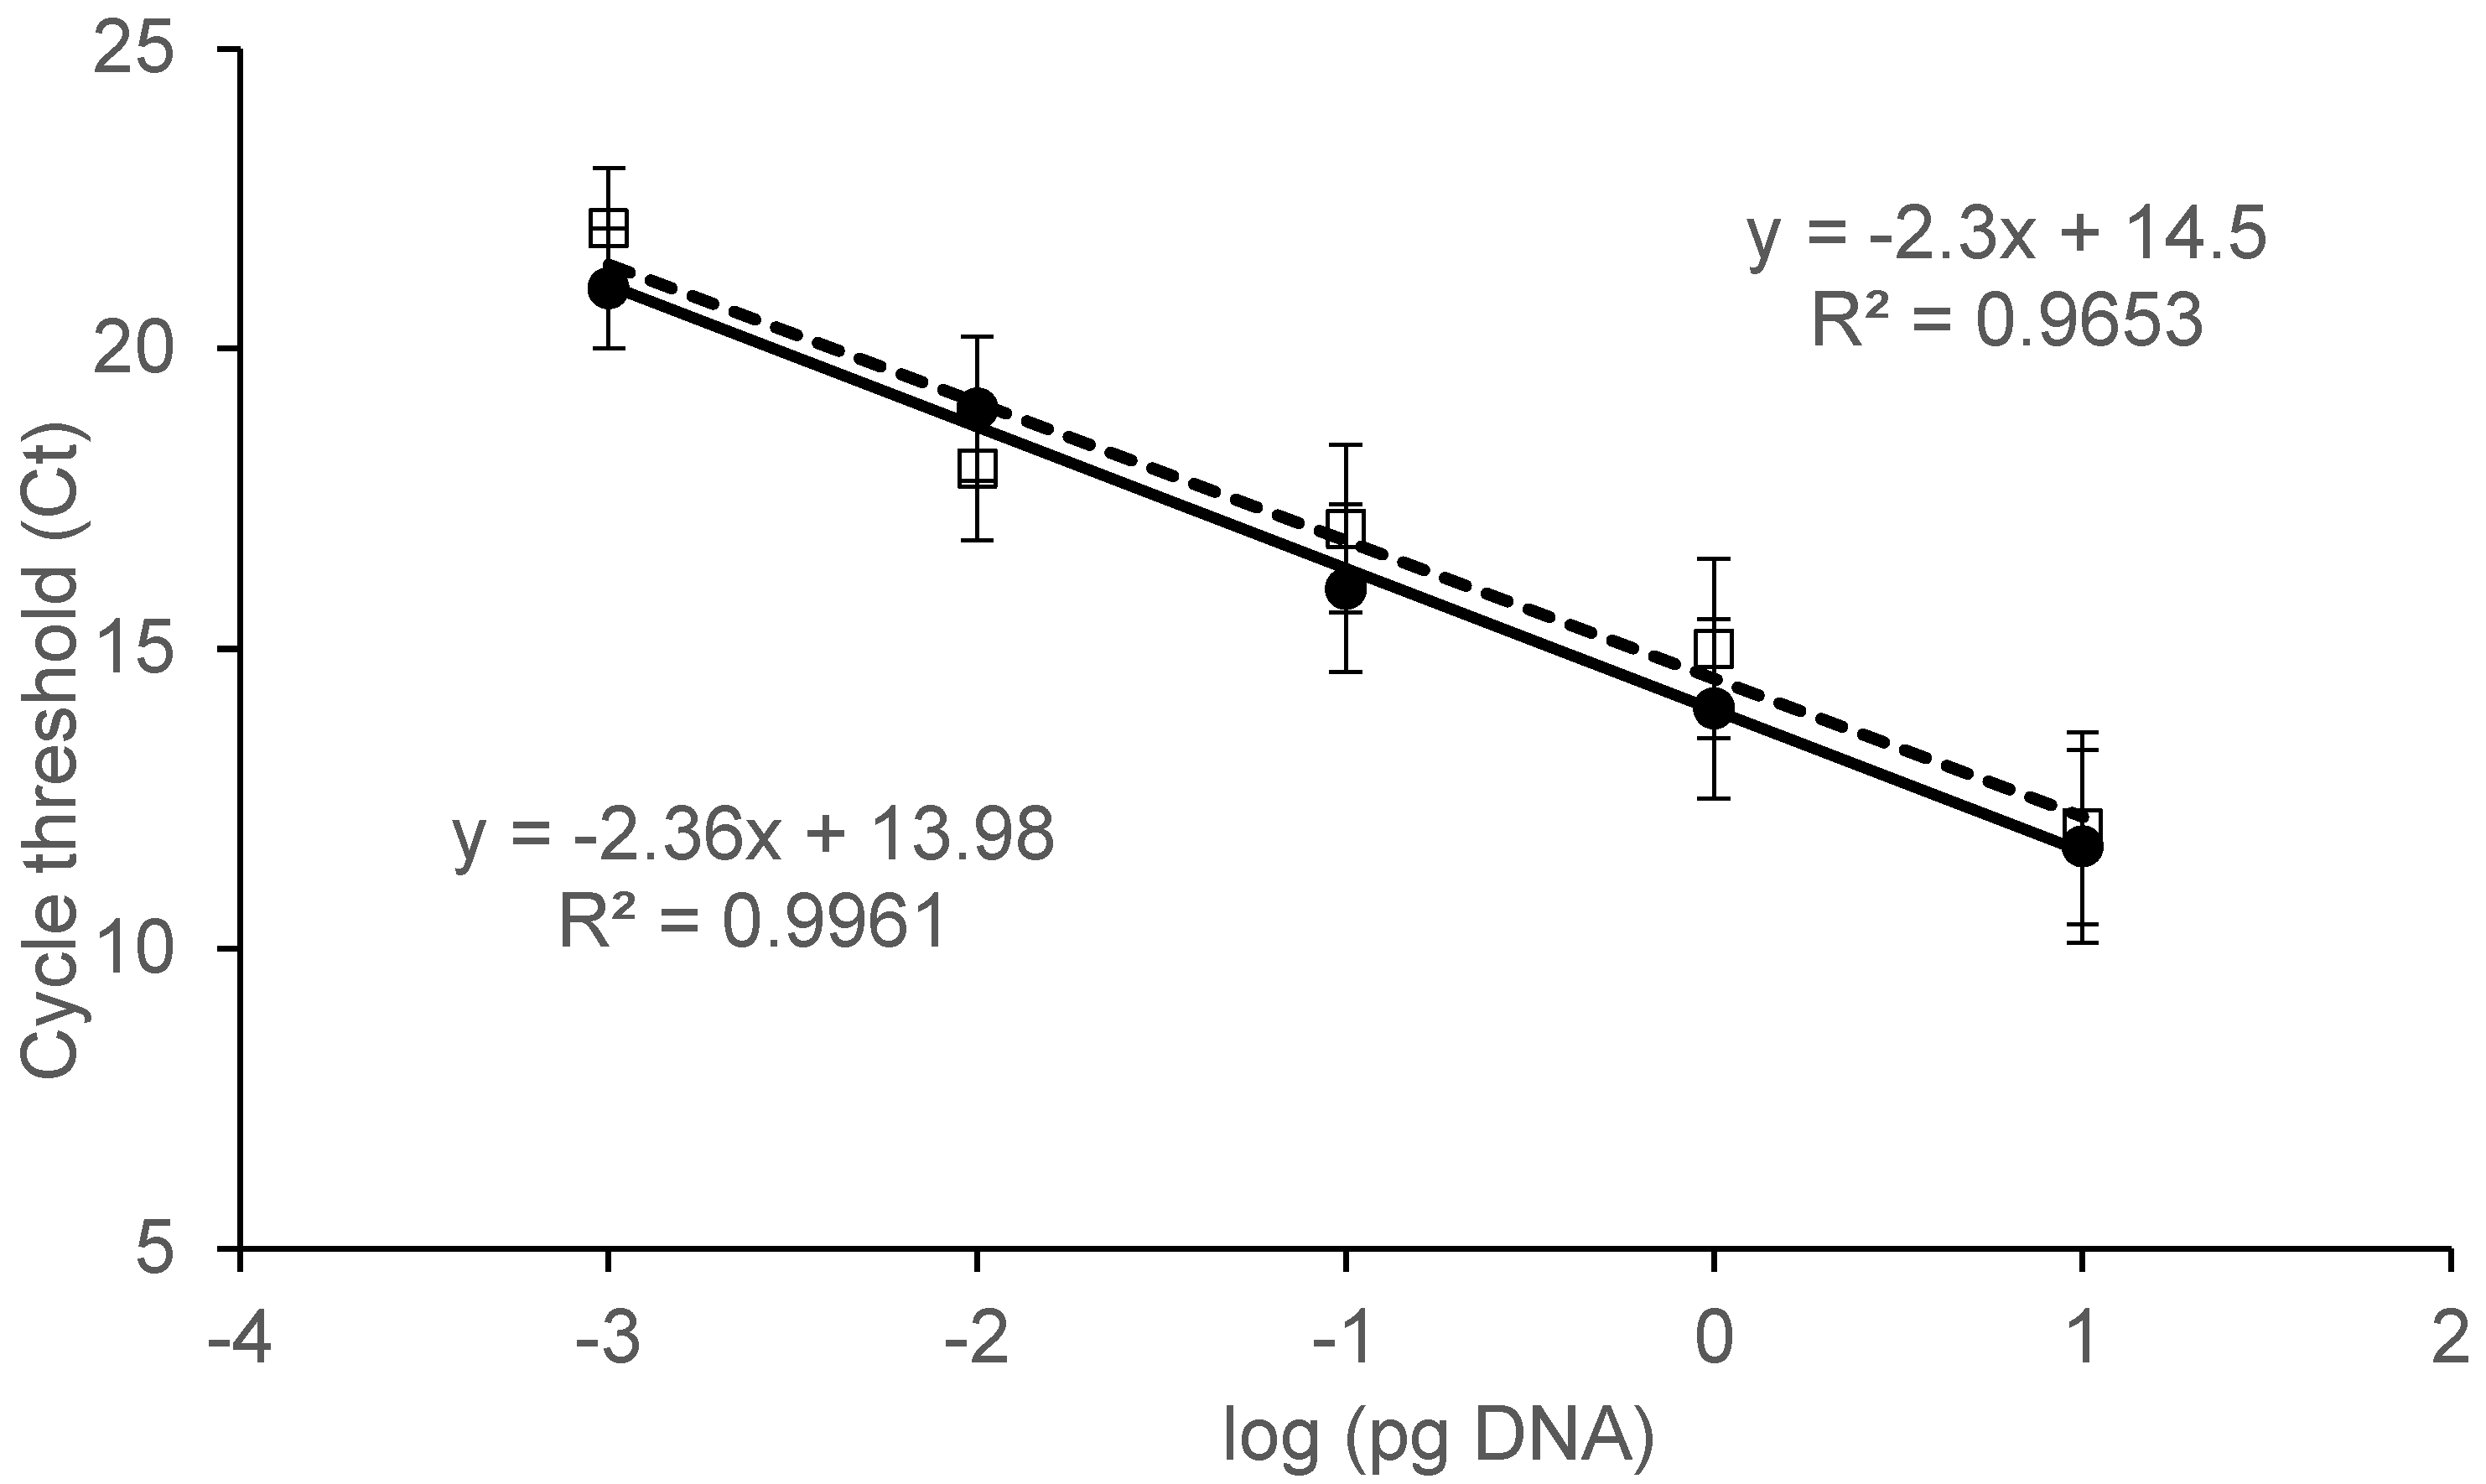
2.2. Specificity and Sensitivity Assay

In BLAST analyses, Penicillium primer sets did not match any of the available DNA sequences in international databases other than their reference genus. Moreover, specificity tests were conducted amplifying DNA from different fungal genera and species commonly associated to grape (Table 1). A positive amplification (increase of fluorescence) was obtained by the sole Penicillium strains. No cross-amplification with grape (Vitis vinifera) DNA was observed.
To evaluate the sensitivity of the reaction and to quantify Penicillium DNA, a standard curve was drawn (Figure 2). Five 10-fold dilutions in the range 100–0.001 pg/μL of P. expansum DNA were amplified. The standard curve showed a linear correlation (p ≤ 0.001) between input DNA and Ct values, with R2 = 0.9961. The system was able to efficiently amplify up to 1 fg of target DNA.
In order to evaluate the influence of grape extracts on the quantification of fungal DNA, the experiment was repeated, adding grape DNA to all serial dilutions. The obtained curve was not influenced by the presence of grape DNA, since an identical detection limit and very similar determination coefficient (R2 = 0.9653) were observed (Figure 2).

2.3. Penicillium Detection in Real Samples

Eighty-two musts and wines (whites and reds) were collected from private wineries in Southern Italy. They came from tanks (large resin-coated cement underground containers), cisterns (large circular stainless steel vessels on legs), and silos (small cisterns). Samples underwent DNA extraction, and, in order to prevent false-negatives, their suitability to PCR amplification was confirmed using grape-specific primers. Of the analysed samples, 38 (46%)—made up of 19 musts (6 whites and 13 reds) and 19 wines (7 whites and 12 reds)—were found positive for Penicillium contamination (Table 2). In particular, they came from 18 (out of 31, 58%) tanks, 5 (out of 22, 23%) cisterns, and 15 (out of 28, 54%) silos. Therefore, there was a significantly lower frequency of contamination among samples coming from cisterns (Kruskal–Wallis, p < 0.05). Penicillium DNA was found in the range 0.001–2.634 pg/μL, with the red must SS26 and white wine T40 containing the higher and lower quantity of Penicillium DNA, respectively. However, there were no significant differences between musts/wines and reds/whites.

2.4. Patulin Quantification in Real Samples

Patulin occurrence and concentration was estimated for the seventeen samples of red and white musts and wines that resulted positive for the presence of Penicillium (Table 3). Thirteen of the analysed samples resulted contaminated in the range 27–1911 μg/L, with white wines T17 and SS21 as the most and least contaminated samples, respectively. There were no significant differences in terms of toxin contamination between musts and wines, or reds and whites. A concordance between presence/absence of the fungus and of the toxin was observed for 13 samples (76%), whereas in four samples, Penicillium but not patulin was detected. There was no linear correlation between Penicillium DNA and patulin contamination extents.

3. Discussion

Penicillium species are ubiquitous fungi associated with organic matter in nature. Although mainly linked to other commodities, their presence as epiphytes on grapes has been reported, with the frequency increasing considerably as berries mature [6]. However, species of Penicillium are gaining attention not only as grapevine pathogens at harvest [23], but also during the postharvest phase and winemaking [9,24].
Fungi cause drastic chemical and enzymatic modifications depending on grape variety and production stage [25,26], leading to serious sensory defects and risks of contamination by toxic metabolites (including patulin) in wine. Consequently, there is an increasing interest in determining contamination by Penicillium spp. of grapes, musts, and wines—especially those obtained from partially dried grapes. For example, the withering process for the production of passito wines (e.g., Amarone, Sfurzat, Vin Santo, Recioto) lasts up to 5 months in specific thermo-hygrometric conditions, in which fungal contamination can take place [27].
The correct evaluation of the potential presence of pathogens/metabolites using molecular assays is highly dependent on numerous factors, such as the type of food matrix, the mycotoxin/DNA markers, and the chosen methodology, among others [28]. In this work, we present an alternative method based on the assembly of two DNA-based techniques (nested PCR and real-time PCR) for the detection of Penicillium DNA in wines and musts. The task was to set up an assay that is easily applicable on a large number of samples at once, thus representing a quick and efficient pre-screening before traditional chemical analyses.
Regarding the nested real-time PCR assay developed in this work, our system was able to detect the presence of Penicillium in 46% of the tested samples, with samples coming from cisterns showing the lowest contamination. The detection limit was 1 fg, a result particularly interesting, considering that the average weight of the haploid genome of Penicillium spp. is reported to be 31 fg [29]. Moreover, this sensitivity level is much better than levels reported in literature concerning Penicillium detection in food matrices [17,18,19]. Indeed, by the introduction of the nested approach, it was possible to enhance the performance of a traditional real-time PCR assay. The proposed new detection system presents the advantage of high specificity conferred by the use of two pairs of primers at different annealing temperatures. In particular, the empirical rule for single-tube nested real-time PCR system—Ta (inner primers) < Ta (outer primers)—used for the detection of Ara h 3 [20], hsp1 [21], and Pru du 6 [22] allergens, was followed. The single-tube nested real-time PCR approach presented high performance criteria and apparent robustness, since it was not affected by shifts in temperature, time, cycle number (despite the existence of two different reaction protocols within the same assay), or the coexistence of grape DNA. Moreover, the single-tube amplification could be particularly efficient in preventing the cross-contamination and false negative results that are the major drawbacks of a nested approach.
As confirmation of Penicillium contamination, patulin presence was evaluated in representative samples. The mycotoxin was found in 71% of analysed wines and musts. With one exception (SS21), it was above the EU regulatory limit of 50 μg/kg foreseen for fermented apple juices, since there are no specific regulatory limits for patulin in wines and musts. The huge amount of toxin recorded even in wines strongly evidences the risks for consumers’ health, stating the need to detect and control the presence of patulin-producing fungi such as Penicillium all through the winemaking chain. The issue of the presence of patulin in grape musts was already addressed in Austria, as it was detected (maximum values 23.6–750 μg/kg) in 86 of the 164 samples surveyed from 1996 to 2000 [30]. This finding was alarming, considering that fresh grape must is offered to children as a non-fermented and unheated drink in the Austrian wine-growing regions [30].
A 76% accordance between molecular and toxicological data was recorded, although it was not quantitative. Similarly, Majerus et al. [3] found that contamination of grape must with patulin did not necessarily correlate with the moulding of the product, and Fredlund et al. [31] reported that the levels of both deoxynivalenol and zearalenone did not correlate with the DNA levels of Fusarium culmorum or other Fusarium species. In four samples containing Penicillium DNA, no patulin was detected. This was not surprising, since not all Penicillium species reported on grape are able to produce patulin [8]. Moreover, 60-plus species of moulds encompassing over 30 genera (including Paecilomyces, Saccharomyces, Alternaria, Byssochlamys, and Aspergillus) [32]—many of which have been reported on grape—produce patulin. In a recent study, the presence of patulin biosynthetic gene patN proved to be not predictive for patulin contamination [33]. Finally, it has to be considered that Penicillium produces several other toxic compounds (e.g., citrinin, chaetoglobosins, etc.) that can affect the quality of and safety of the product [34], and thus have to be monitored.

4. Conclusions

In conclusion, the single-tube nested real-time PCR method presented in this work constitutes an alternative, quick, and reliable approach for the detection of Penicillium even at trace levels in grape-derived products. The interesting results obtained with this approach highlight the usefulness of this new tool and its potential for the identification of pathogens in food matrices, for which further research work is needed. Moreover, the high patulin levels found in analyzed samples suggest the need to pay for greater attention to Penicillium toxins in musts and wines.

5. Materials and Methods

5.1. Sample Collection

During autumn 2013 and spring 2014, 82 musts and wines (whites and reds) were collected from private local wineries in the Apulia region, Southern Italy (Table 1). After 10 min of stirring, 6 L of each sample were collected, divided in three bottles of 2 L each, and stored at 4 °C until use. Among them, 17 samples were analyzed for patulin content.

5.2. DNA Extraction

DNA extraction from musts and wines was performed according to the method of di Rienzo et al. [35]. The DNA was further purified using the HiYield™ Gel/PCR Fragments Extraction Kit (Real Genomics, Banqiao City, Taiwan) according to manufacturer instructions, performing two washing steps and recovering the DNA with the elution buffer pre-heated at 60 °C. The DNA concentration, purity, and integrity were determined both by the Nano-Drop™ 2000 Spectrophotometer (Thermo Scientific, Waltham, MA, USA) and electrophoresis on a 0.8% agarose Tris/Borate/EDTA (TBE) gel. In order to prevent false negatives, the suitability of extracted DNA to PCR amplification was evaluated using V. vinifera primers [36].

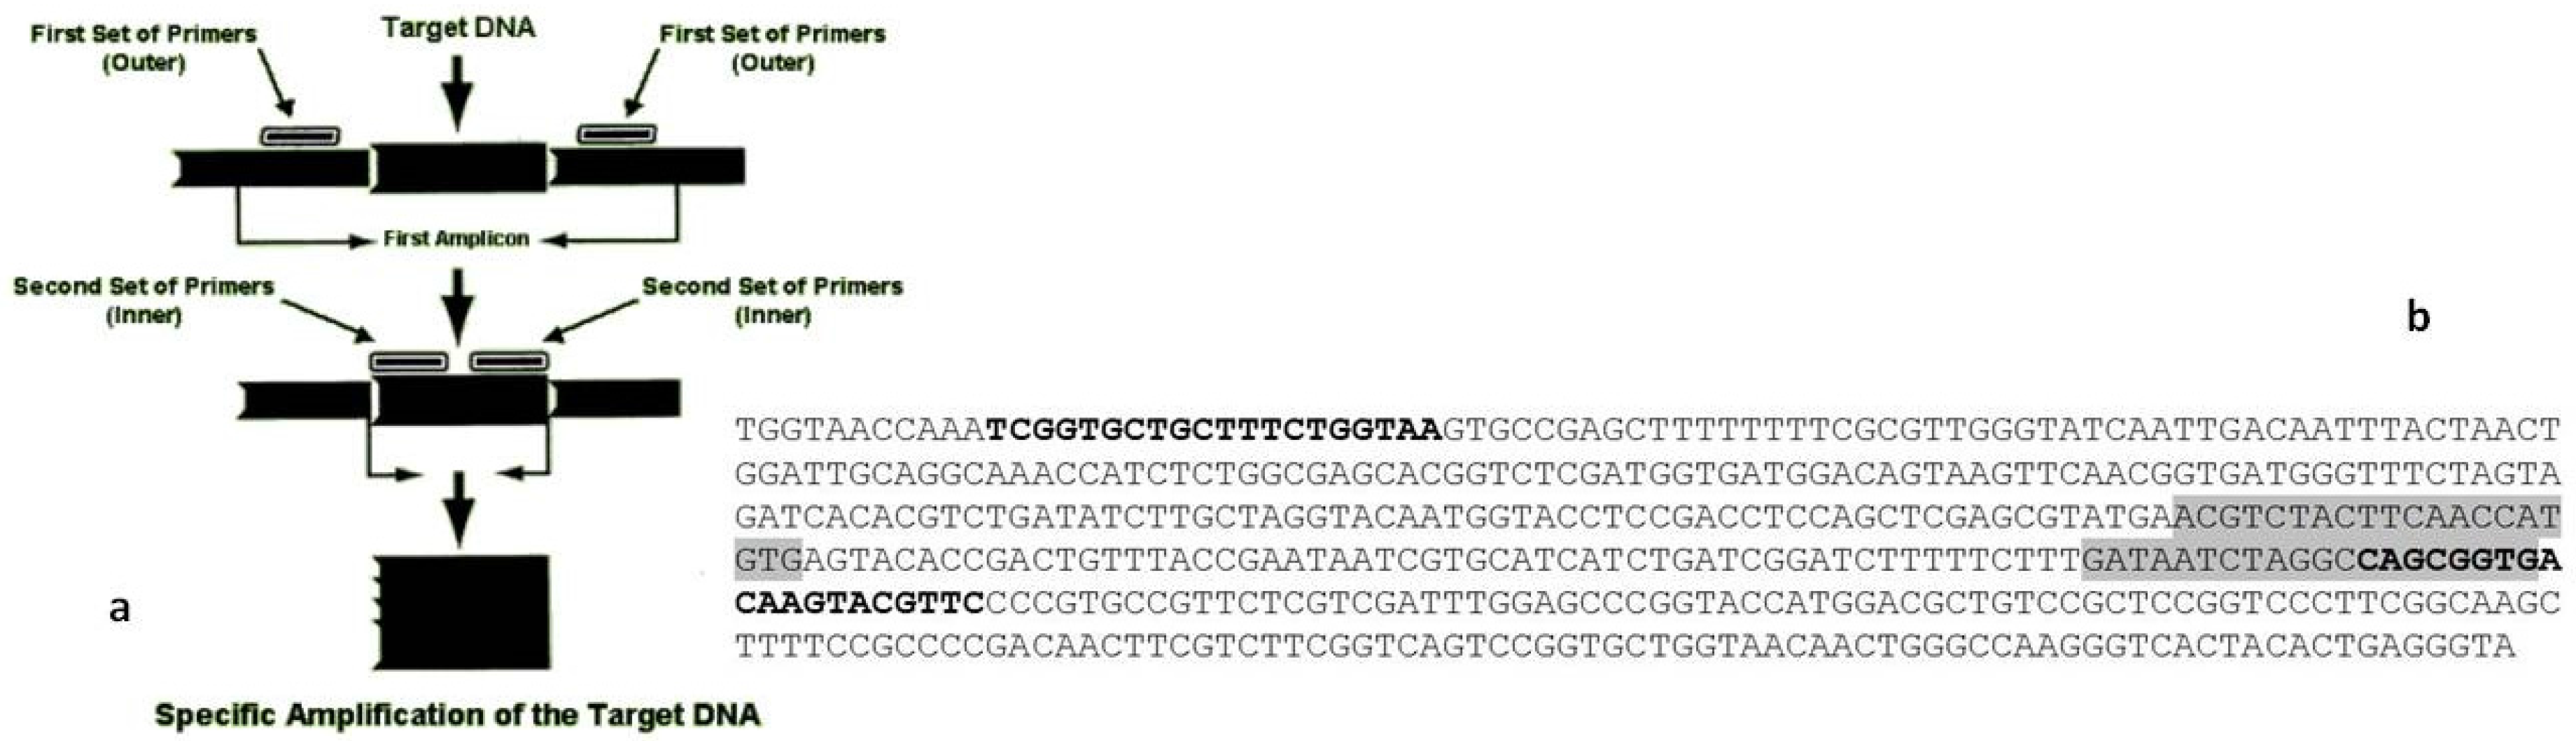
5.3. Penicillium Detection System

Two sets of primers designed upon a portion of β-tubulin gene were used to detect the presence of Penicillium spp. in extracted samples. The inner primers HRMF/HRMR were those reported by Sanzani et al. [9], whereas the outer primers were NESF (5′-TCGGTGCTGCTTTCTGGTAA-3′) and NESR (5′-GAACGTACTTGTCACCGCTG-3′).

5.4. Nested One-Tube Real-Time PCR Assays

Real-time PCR assays were performed in 10 μL of total reaction volume. For each reaction tube, 5 μL of DNA, 1× SYBR® Select Master Mix (Thermo Scientific), 300 nM of each inner primer HRMF1/HRMR1, and further 300 nM of each outer primer NESF/NESR were used. All real-time PCR assays were made on an iCycler iQ thermal cycler (BioRad, Hercules, CA, USA).
Nested real-time PCR assays were carried out with two different temperature programs: phase 1, performed without collecting fluorescence signal; and phase 2, with collection of the fluorescence signal at the end of each cycle. The number of cycles used in each phase was defined as follows: phase 1 from 5 to 15 cycles; phase 2 from 30 to 40 cycles. The following temperature protocol was used: 50 °C for 2 min, 95 °C for 2 min, 5–15 cycles at 95 °C for 15 s, 60 °C for 15 s (phase 1), and 30–40 cycles at 95 °C for 15 s, 55 °C for 15 s, and 72 °C for 15 s (phase 2). Fluorescence was acquired during the extension at 72 °C to further improve specificity and signal-to-noise ratio [37]. Data were collected and analyzed using the iCycler iQTM associated software (Real time Detection System Software, version 3.0, BioRad). Cycle threshold (Ct) values were calculated using the software at automatic threshold setting.

5.5. Specificity and Sensitivity Assay

To test the specificity of the reaction, the DNA of the most frequent fungal genera reported on grape, plus the DNA of grape and of Penicillium spp., was amplified as reported above.
Moreover, to assess the sensitivity of the assay, Penicillium DNA was serially diluted ten-fold with sterile water to yield final concentrations from 100 to 0.001 pg/μL, and amplified as described above. A standard curve was generated by plotting the DNA amounts [log (pg)] against the corresponding Ct value. Determination coefficient (R2) and linear equation were calculated. In order to evaluate the influence of co-extracted DNA on the efficiency of the two primer sets, a standard curve was drawn by adding 50 ng of V. vinifera DNA to each reaction mixture. Penicillium concentration in unknown samples was extrapolated from the standard curve.

5.6. Patulin Evaluation

For confirmation, the presence and concentration of patulin was evaluated in 17 samples positive to molecular assays.

5.6.1. Chemicals and Reagents

All reagents had a purity >98.0% and were purchased from (Sigma Aldrich, Milan, Italy). A patulin stock solution in methanol was prepared at a concentration of 607.6 mg/L and stored at −20 °C. A working solution of 6.08 mg/L was also prepared.

5.6.2. Extraction Procedure

An aliquot of 5 mL of wine/must was mixed with 5 mL of distilled water, 10 mL of acetonitrile, and 100 μL of internal standard (Dinoseb, (RS)-2,4-Dinitro-6-sec-butylphenol, 5 mg/L). The tube was shaken mechanically for 15 min. Then, a salt mixture (4 g MgSO4, 1 g NaCl, 1 g HOC(COONa)(CH2COONa)2·2H2O, and 0.5 g NaO2CCH2C(OH)(CO2H)CH2CO2Na·1·5H2O) was added to the tube, and a vigorous manual shaking was performed, followed by mechanical shaking for 15 min and centrifugation for 5 min at 3000× g. One mL of the raw extract was filtered on 0.22 μm regenerated cellulose filters (LLG Labware, Meckenheim, Germany) prior to liquid chromatography-tandem mass spectrometry (LC-MS/MS) analysis.

5.6.3. Chromatographic and Mass Spectrometric Conditions

Analyses were performed by a Liquid Chromatograph NEXERA X2 LC30AD System (Shimadzu, Milan, Italy), equipped with a binary solvent delivery system, degasser, autosampler, and column heater. The separation was performed on a LUNA C8 analytical column (150 mm × 2 mm I.D.), with 5 μm particles, from Phenomenex (Torrance, CA, USA). The detection system was an AB SCIEX LC/MS/MS Triple Quad 5500 System tandem mass spectrometer equipped with an electrospray ionization interface (ESI) operating in the negative ion mode, using multiple reaction monitoring (MRM). A gradient elution was performed using a mobile phase (flow rate 0.25 mL/min) constituted by water (1% CH3COOH and 5 mM C2H3O2NH4) and methanol (1% CH3COOH and 5 mM C2H3O2NH4), eluent A and B, respectively. The program started at 10% eluent B and ramped to 40% at 5 min and to 90% at 11 min. It remained constant for 4 min and then decreased linearly to 10% of eluent B. This condition was kept constant for 5 min, and the column was re-equilibrated to the initial mobile phase composition. The column temperature was kept at 40 °C. The mass spectrometer ion source parameters applied were: Curtain Gas 30.00 psi; Desolvation Gas Temperature 550.00 °C; GS1 (air) 60.00 psi; GS2 (air) 55.00 psi; Ion Spray −4500.00 V. Collision energy and cone voltage acquisition parameters are reported in Table 4. The instrument had a limit of detection (LOD) of 0.02 mg/L and a limit of quantitation (LOQ) of 0.05 mg/L. The recovery of the method was in the range 81%–92%. Unknown samples were analyzed comparing standard patulin retention time and ion ratio (within ±20%); quantification was performed by a six-point calibration curve (y = 5479.74x + 554.75, R2 > 0.99) obtained for the mass fragment 152.9 → 108.9.

5.7. Statistical Analysis

Data processing and correlation analyses were performed using the statistical software package Statistics for Windows (StatSoft, Tulsa, OK, USA). Values were tested independently for normality using the Shapiro–Wilk (SW) test. Given that samples did not come from normally-distributed populations (SW test, p < 0.01), nonparametric tests were chosen for downstream analyses. The two-ways Wilcoxon (W) test and the Kruskal–Wallis (KW) test were applied to compare samples from two and three or more classes, respectively.

Acknowledgments

The University of Bari-Project: Idea Giovani 2010/11, coordinated by Cinzia Montemurro, supported the research activities.

Author Contributions

S.M.S., M.M.M. and C.M. conceived and designed the experiments; S.M.S., M.M.M., V.d.R., V.F., M.R.T. performed the experiments; S.M.S. analyzed the data; G.G., M.R.T., C.M. contributed reagents/materials/analysis tools; S.M.S. wrote the paper; M.M.M., V.d.R., V.F., G.G., M.R.T. and C.M. edited the manuscript.

Conflicts of Interest

The authors declare no conflict of interest.

References

  1. FAOSTAT (The Food and Agriculture Organization Corporate Statistical Database). Statistics on Agriculture, Nutrition, Fisheries, Forestry, Food Aid, Land Use and Population. 2012. Available online: http://faostat.fao.org/ (accessed on 18 January 2016).
  2. European Commission. Regulation n. 479/2008. 2008. Available online: http://eur-lex.europa.eu/LexUriServ/LexUriServ.do?uri=OJ:L:2008:148:0001:0061:IT:PDF (accessed on 18 January 2016).
  3. Majerus, P.; Hain, J.; Kölb, C. Patulin in grape must and new, still fermenting wine (Federweißer). Mycotoxin Res. 2008, 24, 135–139. [Google Scholar] [CrossRef] [PubMed]
  4. Jørgensen, K. Occurrence of ochratoxin A in commodities and processed food—A review of EU occurrence data. Food Addit. Contam. 2005, 1, 26–30. [Google Scholar] [CrossRef] [PubMed]
  5. Sanzani, S.M.; Reverberi, M.; Fanelli, C.; Ippolito, A. Detection of ochratoxin A using molecular beacons and real-time PCR thermal cycler. Toxins 2015, 7, 812–820. [Google Scholar] [CrossRef] [PubMed]
  6. Díaz, G.A.; Yañez, L.; Latorre, B.A. Low occurrence of patulin-producing strains of Penicillium in grapes and patulin degradation during winemaking in Chile. Am. J. Enol. Vitic. 2011, 62, 542–546. [Google Scholar] [CrossRef]
  7. Picco, A.M.; Rodolfi, M. Assessments of indoor fungi in selected wineries of Oltrepo Pavese (Northern Italy) and Sottoceneri (Switzerland). Am. J. Enol. Vitic. 2004, 55, 355–362. [Google Scholar]
  8. Frisvad, J.C.; Smedsgaard, J.; Larsen, T.O.; Samson, R.A. Mycotoxins, drugs and other extrolites produced by species in Penicillium subgenus Penicillium. Stud. Mycol. 2004, 49, 201–241. [Google Scholar]
  9. Sanzani, S.M.; Montemurro, C.; di Rienzo, V.; Solfrizzo, M.; Ippolito, A. Genetic structure and natural variation associated with host of origin in Penicillium expansum strains causing blue mould. Int. J. Food Microbiol. 2013, 165, 111–120. [Google Scholar] [CrossRef] [PubMed]
  10. Hopkins, J. The toxicological hazards of patulin. BIBRA Bull. 1993, 32, 3–4. [Google Scholar]
  11. WHO. Evaluation of certain food additives and contaminants. In 44th Report of the Joint FAO/WHO Expert Committee on Food Additives; Technical Report Series; WHO: Geneva, Switzerland, 1995; Volume 859, pp. 36–38. [Google Scholar]
  12. European Commission. Commission Regulation (EC) No 1881/2006 setting maximum levels for certain contaminants in foodstuffs. Off. J. Eur. Union 2006, L364, 5–24. [Google Scholar]
  13. Ministry of Health, Labour and Welfare of Japan (MHLW). Notification No. 369 (26 November 2003). Available online: http://www.mhlw.go.jp/english/ (accessed on 20 January 2016).
  14. Paterson, R.R.M.; Archer, S.; Kozakiewicz, Z.; Lea, A.; Locke, T.; O’Grady, E. A gene probe for the patulin metabolic pathway with potential for use in patulin and novel disease control. Biocontrol Sci. Technol. 2000, 10, 509–512. [Google Scholar] [CrossRef]
  15. Paterson, R.R.M. The isoepoxydon dehydrogenase gene of patulin biosynthesis in cultures and secondary metabolites as candidate PCR inhibitors. Mycol. Res. 2004, 108, 1431–1437. [Google Scholar] [CrossRef] [PubMed] [Green Version]
  16. Dombrink-Kurtzman, M.A. The sequence of the isoepoxydon dehydrogenase gene of the patulin biosynthetic pathway in Penicillium species. Antonie van Leeuwenhoek 2007, 91, 179–189. [Google Scholar] [CrossRef] [PubMed]
  17. Sanzani, S.M.; Reverberi, M.; Punelli, M.; Ippolito, A.; Fanelli, C. Study on the role of patulin on pathogenicity and virulence of Penicillium expansum. Int. J. Food Microbiol. 2012, 153, 323–331. [Google Scholar] [CrossRef] [PubMed]
  18. Rodríguez, A.; Luque, M.I.; Andrade, M.J.; Rodríguez, M.; Asensio, M.A.; Córdoba, J.J. Development of real-time PCR methods to quantify patulin-producing molds in food products. Food Microbiol. 2011, 28, 1190–1199. [Google Scholar]
  19. Tannous, J.; Atoui, A.; El Khoury, A.; Kantar, S.; Chdid, N.; Oswald, I.P.; Puel, O.; Lteif, R. Development of a real-time PCR assay for Penicillium expansum quantification and patulin estimation in apples. Food Microbiol. 2015, 50, 28–37. [Google Scholar] [CrossRef] [PubMed]
  20. Bergerová, E.; Brežná, B.; Kuchta, T. A novel method with improved sensitivity for the detection of peanuts based upon single-tube nested real-time polymerase chain reaction. Eur. Food Res. Technol. 2011, 232, 1087–1091. [Google Scholar] [CrossRef]
  21. Costa, J.; Mafra, I.; Kuchta, T.; Oliveira, M.B.P.P. Single-tube nested real-time PCR as a new highly sensitive approach to trace hazelnut. J. Agric. Food Chem. 2012, 60, 8103–8110. [Google Scholar] [CrossRef] [PubMed]
  22. Costa, J.; Oliveira, M.B.P.P.; Mafra, I. Novel approach based on single-tube nested real-time PCR to detect almond allergens in foods. Food Res. Int. 2013, 51, 228–235. [Google Scholar] [CrossRef]
  23. Serey, R.A.; Torres, R.; Latorre, B.A. Pre- and post-infection activity of new fungicides against Botrytis cinerea and other fungi causing decay of table grapes. Cien. Investig. Agric. 2007, 34, 215–224. [Google Scholar] [CrossRef]
  24. Lorenzini, M.; Mainente, F.; Zapparoli, G.; Cecconi, D.; Simonato, B. Post-harvest proteomics of grapes infected by Penicillium during withering to produce Amarone wine. Food Chem. 2016, 199, 639–647. [Google Scholar] [CrossRef] [PubMed]
  25. Tosi, E.; Fedrizzi, B.; Azzolini, M.; Finato, F.; Simonato, B.; Zapparoli, G. Effects of noble rot on must composition and aroma profile of Amarone wine produced by the traditional grape withering protocol. Food Chem. 2012, 130, 370–375. [Google Scholar] [CrossRef]
  26. Lorenzini, M.; Azzolini, M.; Tosi, E.; Zapparoli, G. Postharvest grape infection of Botrytis cinerea and its interactions with other moulds under withering conditions to produce noble-rotten grapes. J. Appl. Microbiol. 2013, 114, 762–770. [Google Scholar] [CrossRef] [PubMed]
  27. Lachhab, N.; Sanzani, S.M.; Bahouaoui, M.A.; Boselli, M.; Ippolito, A. Effect of some protein hydrolysates against gray mould of table and wine grapes. Eur. J. Plant Pathol. 2015, 144, 821–830. [Google Scholar] [CrossRef]
  28. Schena, L.; Li Destri Nicosia, M.G.; Sanzani, S.M.; Faedda, R.; Ippolito, A.; Cacciola, S.O. Development of quantitative PCR detection methods for phytopathogenic fungi and oomycetes. J. Plant Pathol. 2013, 95, 7–24. [Google Scholar]
  29. Kullman, B.; Tamm, H.; Kullman, K. Fungal Genome Size Database. 2005. Available online: http://www.zbi.ee/fungal-genomesize (accessed on 18 January 2016).
  30. SCOOP-Report. Assessment of Dietary Intake of Patulin by Population of the EU Member States (Task 3.2.8). 2002. Available online: http://ec.europa.eu/food/fs/scoop/3.2.8_en.pdf (accessed on 22 January 2016).
  31. Fredlund, E.; Gidlund, A.; Sulyok, M.; Börjesson, T.; Krska, R.; Olsen, M.; Lindblad, M. Deoxynivalenol and other selected Fusarium toxins in Swedish oats—Occurrence and correlation to specific Fusarium species. Int. J. Food Microbiol. 2013, 167, 276–283. [Google Scholar] [CrossRef] [PubMed]
  32. Moake, M.M.; Padilla-Zakour, O.I.; Worobo, R.W. Comprehensive review of patulin control methods in foods. Compr. Rev. Food Sci. Food Saf. 2005, 4, 8–21. [Google Scholar] [CrossRef]
  33. Sanzani, S.M.; Susca, A.; Mastrorosa, S.; Solfrizzo, M. Patulin risk associated with blue mould of pome fruit marketed in southern Italy. Qual. Assur. Saf. Crops Food 2016. [Google Scholar] [CrossRef]
  34. Andersen, B.; Smedsgaard, J.; Frisvad, J.C. Penicillium expansum: Consistent production of patulin, chaetoglobosins, and other secondary metabolites in culture and their natural occurrence in fruit products. J. Agric. Food Chem. 2004, 52, 2421–2428. [Google Scholar] [CrossRef] [PubMed]
  35. Di Rienzo, V.; Miazzi, M.M.; Fanelli, V.; Savino, V.; Pollastro, S.; Colucci, F.; Miccolupo, A.; Blanco, A.; Pasqualone, A.; Montemurro, C. An enhanced analytical procedure to discover table grape DNA adulteration in industrial musts. Food Control 2016, 60, 124–130. [Google Scholar] [CrossRef]
  36. Sanzani, S.M.; Schena, L.; De Cicco, V.; Ippolito, A. Early detection of Botrytis cinerea latent infections as a tool to improve postharvest quality of table grapes. Postharvest Biol. Technol. 2012, 68, 64–71. [Google Scholar] [CrossRef]
  37. Mehndiratta, M.; Palanichamy, J.K.; Ramalingam, P.; Pal, A.; Das, P.; Sinha, S.; Chattopadhyay, P. Fluorescence acquisition during hybridization phase in quantitative real-time PCR improves specificity and signal-to-noise ratio. BioTechniques 2008, 45, 625–634. [Google Scholar] [CrossRef] [PubMed]
Figure 1. (a) Nested amplification scheme and (b) sequence of a portion of Penicillium expansum gene encoding β-tubulin (GenBank accession no. KC342829). “Outer” primers (NESF/NESR) in bold, and “inner” primers (HRMF/HRMR), shaded in grey, were designed on conserved portions.
Toxins 08 00235 g001
Figure 2. Linear relationship between Penicillium DNA concentration in the range 100–0.001 pg/μL and cycle threshold (Ct) given by the instrument. Standard curve, linear equation, and determination coefficient (R2) was determined by plotting Ct values against log (pg DNA) concentration (x-axis) in absence (●) and presence (□) of grape DNA. Error bars (indicating standard error of the mean, SEM) were obtained from three parallel experiments, in which each sample was run in triplicate.
Toxins 08 00235 g002
Table 1. Results of nested real-time PCR amplifications of gene applied to fungal genera more frequently reported on grapes. Penicillium spp. and grape DNA were included as controls.
Isolate CodeOrganismPresence of Amplification Product
Pex6Penicillium expansum+
Pex29Penicillium chrysogenum+
Pex30Penicillium crustosum+
A64Alternaria alternata-
FV52Botrytis cinerea-
FV509Monilia laxa-
FV139Phellinus ignarius-
FV366Sclerotinia sclerotiorum-
FV155Cladosporium spp.-
FV406Aspergillus spp.-
FV150Rhizopus stolonifer-
FV126Fusarium spp.-
VV1Vitis vinifera-
Table 2. Samples used in the experiments, with type, storage modality, and nested real-time PCR results for the detection of Penicillium DNA.
Sample CodeTypeStorageDNA Concentration (pg/μL)
C10White mustCistern-
C11aWhite wineCistern1.007
C11bWhite mustCistern-
C12aRed mustCistern0.010
C12bWhite mustCistern-
C13White mustCistern-
C14White mustCistern-
C15White mustCistern-
C19White mustCistern-
C21White mustCistern-
C22White mustCistern-
C23White mustCistern-
C35White wineCistern-
C43White mustCistern-
C47White mustCistern-
C48White mustCistern-
C52White mustCistern-
C53Red mustCistern-
C55Red mustCistern0.016
C56Red mustCistern-
C57Red mustCistern0.003
C59Red mustCistern0.006
SS5White mustSilos0.011
SS8Red mustSilos0.029
SS10Red wineSilos1.0074
SS13Red wineSilos-
SS14Red mustSilos0.010
SS15White mustSilos0.002
SS17Red wineSilos0.002
SS19Red wineSilos-
SS21White wineSilos0.002
SS25Red mustSilos1.96
SS26Red mustSilos2.634
SS27Red mustSilos-
SS28Red mustSilos-
SS29Red mustSilos0.014
SS33White mustSilos0.003
SS34White mustSilos0.010
SS36White wineSilos-
SS39White mustSilos0.056
SS42Red mustSilos-
SS44Red wineSilos-
SS45White wineSilos0.002
SS47Red wineSilos-
SS48Red wineSilos-
SS51Red mustSilos0.056
SS52Red mustSilos-
SS73White wineSilos-
SS75Red wineSilos-
SS77Red wineSilos-
T2Red wineTank0.034
T7Red mustTank0.183
T11Red mustTank-
T13Red mustTank0.034
T15Red mustTank-
T17White wineTank0.006
T20Red wineTank-
T21Red wineTank0.011
T23Red wineTank0.010
T24White wineTank-
T25Red wineTank-
T26Red wineTank-
T27Red wineTank-
T28Red wineTank0.065
T31Red wineTank0.070
T32White wineTank0.042
T33Red wineTank0.010
T35Red wineTank0.309
T36Red wineTank-
T38Red wineTank0.029
T40White wineTank0.001
T41White wineTank0.023
T44Red wineTank-
T45Red wineTank-
T48White wineTank0.014
T49Red wineTank-
T51Red wineTank-
T52Red mustTank-
T55Red mustTank0.016
T58Red wineTank0.010
T70Red wineTank0.070
Table 3. Liquid chromatography-tandem mass spectrometry (LC-MS/MS) analysis for presence of patulin in musts and wines samples resulted positive to Penicillium DNA.
Sample CodeTypePenicillium DNA Concentration (pg/μL)Patulin Concentration (μg/L)
SS8Red must0.0290
SS10Red wine1.0074173
SS14Red must0.010277
SS17Red wine0.002397
SS21White wine0.00227
SS29Red must0.014154
SS33White must0.003778
SS34White must0.0100
SS39White must0.05665
T13Red must0.03460
T17White wine0.0061911
T21Red wine0.011712
T35Red wine0.30982
T40White wine0.001681
T41White wine0.0230
T48White wine0.0140
T58Red wine0.010669
Table 4. Optimization of the collision energy and cone voltage for patulin by infusion of the mycotoxin directly into the LC effluent, and final acquisition parameters.
IDQ1 Mass (Da)Q3 Mass (Da)Dwell (msec)DPEPCECXP
Patulin 1152.9109.05.00−45.00−10.00−13.00−7.00
Patulin 2152.980.95.00−45.00−10.00−15.00−7.00
Dinoseb 1239.0133.95.00−120.00−8.00−58.68−10.00
Dinoseb 2239.0163.15.00−120.00−8.00−41.78−10.00
DP: declustering potential; EP: entrance potential; CE: collision energy; CXP: cell exit potential.

