
An Optical Method for Serum Calcium and Phosphorus Level Assessment during Hemodialysis

Abstract
:1. Introduction
2. Results


| Min | Max | Mean | SD | N | R | R2 | St. Error of Estimate | |
|---|---|---|---|---|---|---|---|---|
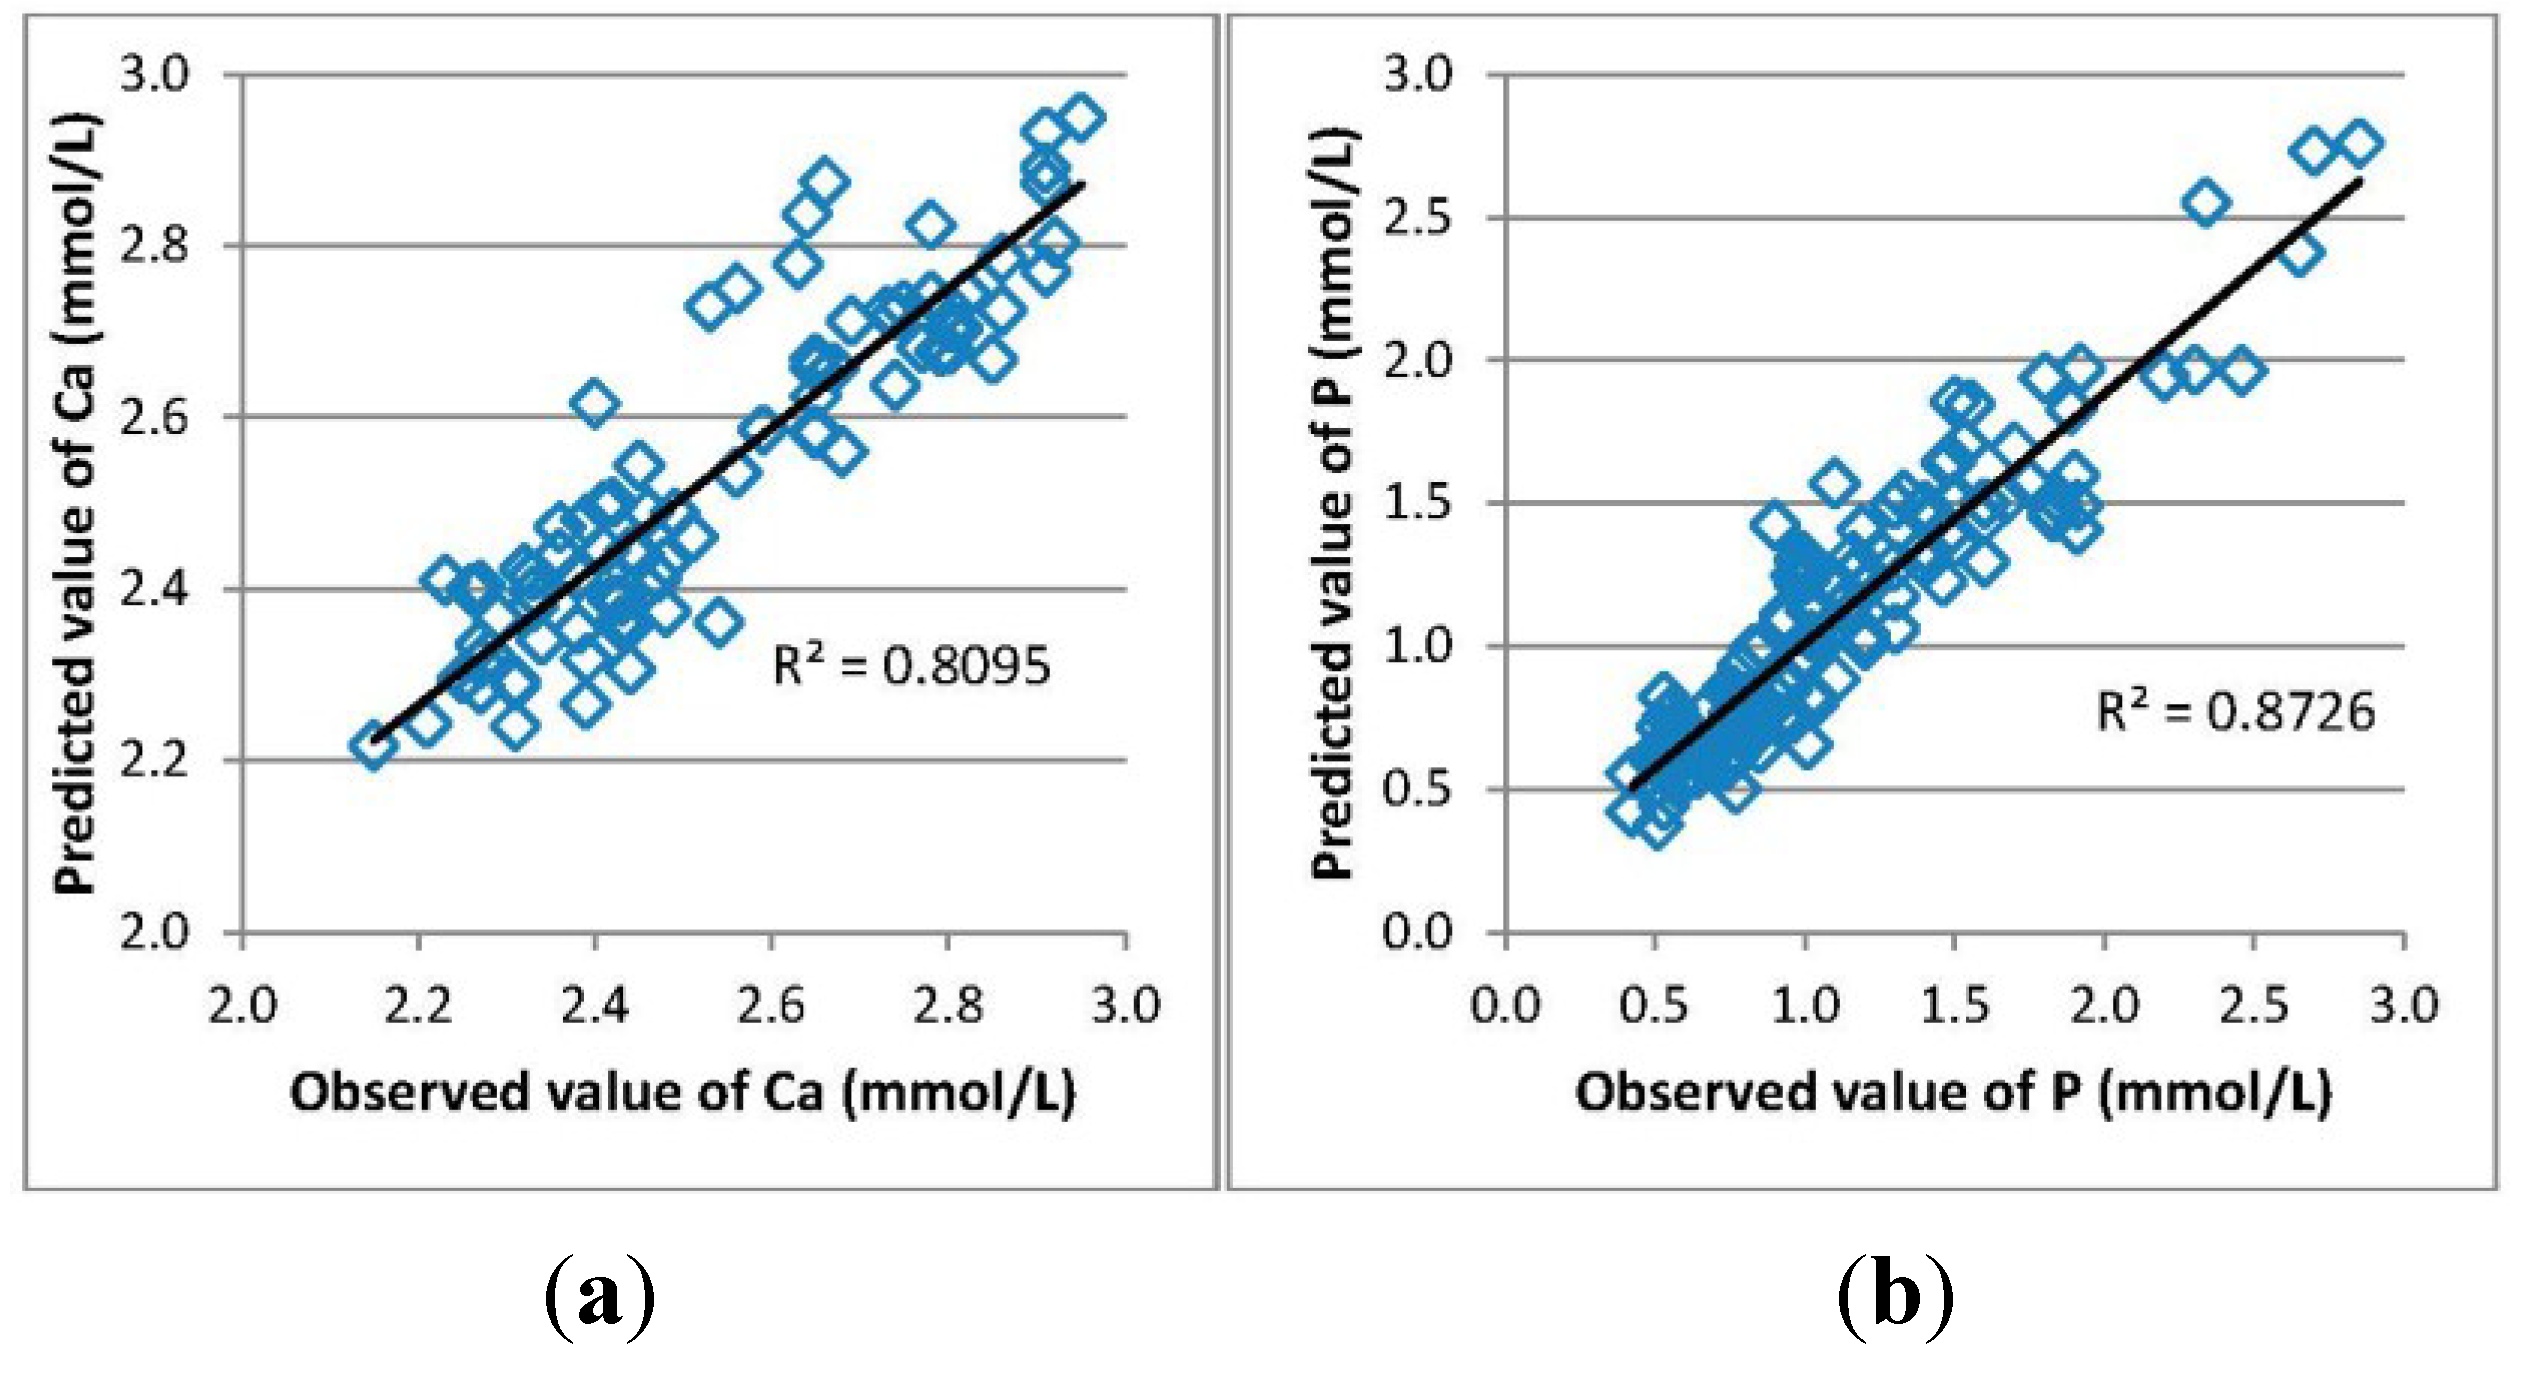
| Ca_Lab (mmol/L) | 2.15 | 2.95 | 2.54 | 0.21 | 83 | |||
| Ca_Opt (mmol/L) | 2.22 | 2.95 | 2.53 | 0.19 | 83 | 0.90 | 0.81 | 0.093 |
| P_Lab (mmol/L) | 0.42 | 2.85 | 1.08 | 0.51 | 142 | |||
| P_Opt (mmol/L) | 0.38 | 2.76 | 1.08 | 0.48 | 142 | 0.93 | 0.87 | 0.182 |

3. Discussion
4. Materials and Methods
| Patient | Kidney Disease | Age | Gender | BMI | Time on HD (months) | Dialyzer Type and Membrane Area | Dialysis Access | Procedure Type (HD/HDF) |
|---|---|---|---|---|---|---|---|---|
| 1 | Polycystic kidney disease | 83 | M | 23.5 | 109 | FX80-1.8 m2 | a/v fistula | HD and HDF |
| 2 | Atherosclerosis | 57 | M | 22.5 | 32 | FX80-1.8 m2 | a/v fistula | HD and HDF |
| 3 | Diabetic nephropathy | 85 | M | 18.7 | 36 | FX80-1.8 m2 | a/v fistula | HD and HDF |
| 4 | Hypertensive renal disease | 81 | F | 34.6 | 12 | FX80-1.8 m2 | graft | HD and HDF |
| 5 | Diabetic nephropathy | 84 | M | 24.4 | 29 | FX80-1.8 m2 | a/v fistula | HD and HDF |
| 6 | Polycystic kidney disease | 49 | M | 16.7 | 45 | FX80-1.8 m2 | a/v fistula | HD and HDF |
| 7 | Diabetic nephropathy | 76 | M | 29.0 | 32 | FX80-1.8 m2 | a/v fistula | HD and HDF |
| 8 | Atherosclerosis | 73 | M | 33.2 | 24 | FX80-1.8 m2 | a/v fistula | HD and HDF |
| 9 | Glomerulo-nephritis | 69 | F | 27.1 | 47 | FX10-1.8 m2 | a/v fistula | HD |
| 10 | Tubulointerstitial nephritis | 62 | F | 20.3 | 7 | FX10-1.8 m2 | a/v fistula | HD |
| 11 | Diabetic nephropathy | 60 | F | 26.4 | 24 | FX80-1.8 m2 | graft | HDF |
| 12 | Polycystic kidney disease | 68 | M | 27.8 | 96 | FX80-1.8 m2 | graft | HDF |
| 13 | Polycystic kidney disease | 43 | M | 23.9 | 16 | FX80-1.8 m2 | graft | HDF |
| 14 | Tubulointerstitial nephritis | 60 | M | 27.1 | 26 | FX80-1.8 m2 | a/v fistula | HDF |
| 15 | Hypertensive renal disease | 48 | M | 27.8 | 8 | FX10-1.8 m2 | a/v fistula | HD |
| 16 | Hypertensive renal disease | 59 | M | 26.9 | 28 | FX80-1.8 m2 | a/v fistula | HDF |
| 17 | Myeloma | 56 | F | 30.5 | 28 | FX80-1.8 m2 | graft | HDF |
| 18 | Myeloma | 58 | M | 25.6 | 29 | FX80-1.8 m2 | a/v fistula | HDF |
| 19 | Diabetic nephropathy | 74 | F | 27.0 | 37 | FX10-1.8 m2 | a/v fistula | HD |
| 20 | Polycystic kidney disease | 46 | M | 22.6 | 42 | FX80-1.8 m2 | graft | HDF |
| 21 | Myeloma | 58 | F | 30.5 | 53 | FX100-1.8 m2 | graft | HDF |
| 22 | Tubulointerstitial nephritis | 43 | F | 19.0 | 23 | FX80-1.8 m2 | a/v fistula | HDF |
| 23 | Hypertensive renal disease | 73 | M | 27.1 | 44 | FX80-1.8 m2 | permanent dialysis catheter | HDF |
| 24 | Tubulointerstitial nephritis | 56 | M | 23.9 | 52 | FX80-1.8 m2 | a/v fistula | HDF |
| 25 | Diabetic nephropathy | 58 | M | 37.6 | 36 | FX100-1.8 m2 | a/v fistula | HDF |
| 26 | Hypertensive renal disease | 80 | M | 20.3 | 81 | FX10-1.8 m2 | a/v fistula | HD |
| 27 | Myeloma | 60 | M | 25.3 | 55 | FX100-1.8 m2 | a/v fistula | HDF |
| 28 | Tubulointerstitial nephritis | 64 | F | 23.0 | 28 | FX80-1.8 m2 | a/v fistula | HD |
Acknowledgments
Author Contributions
Conflicts of Interest
References
- USRDS 2013 Annual Data Report: Atlas of End-Stage Renal Disease in the United States; National Institutes of Health and National Institute of Diabetes and Digestive and Kidney Diseases: Bethesda, MD, USA, 2013.
- Moe, S.M.; Chen, N.X. Mechanisms of vascular calcification in chronic kidney disease. J. Am. Soc. Nephrol. 2008, 19, 213–216. [Google Scholar] [CrossRef]
- Melamed, M.L.; Eustace, J.A.; Plantinga, L.; Jaar, B.G.; Fink, N.E.; Coresh, J.; Klag, M.J.; Powe, N.R. Changes in serum calcium, phosphate, and pth and the risk of death in incident dialysis patients: A longitudinal study. Kidney Int. 2006, 70, 351–357. [Google Scholar] [CrossRef]
- Tentori, F.; Blayney, M.J.; Albert, J.M.; Gillespie, B.W.; Kerr, P.G.; Bommer, J.; Young, E.W.; Akizawa, T.; Akiba, T.; Pisoni, R.L.; et al. Mortality risk for dialysis patients with different levels of serum calcium, phosphorus, and pth: The dialysis outcomes and practice patterns study (dopps). Am. J. Kidney Dis. 2008, 52, 519–530. [Google Scholar] [CrossRef]
- KDIGO (Kidney Disease: Improving Global Outcomes) CKD-MBD Work Group. KDIGO clinical practice guideline for the diagnosis, evaluation, prevention, and treatment of chronic kidney disease–mineral and bone disorder (ckd–mbd). Kidney Int. 2009, 76 (Suppl. 113), S1–S130.
- Goldsmith, D.J.A.; Covic, A.; Fouque, D.; Locatelli, F.; Olgaard, K.; Rodriguez, M.; Spasovski, G.; Urena, P.; Zoccali, C.; London, G.M.; et al. Endorsement of the kidney disease improving global outcomes (kdigo) chronic kidney disease-mineral and bone disorder (ckd-mbd) guidelines: A European renal best practice (erbp) commentary statement. Nephrol. Dial Transpl. 2010, 25, 3823–3831. [Google Scholar] [CrossRef]
- Tertti, R.; Harmoinen, A.; Leskinen, Y.; MetsÄRinne, K.P.; Saha, H. Comparison of calcium phosphate product values using measurement of plasma total calcium and serum ionized calcium. Hemodial. Int. 2007, 11, 411–416. [Google Scholar] [CrossRef]
- Cozzolino, M.; Dusso, A.S.; Slatopolsky, E. Role of calcium-phosphate product and bone-associated proteins on vascular calcification in renal failure. J. Am. Soc. Nephrol. 2001, 12, 2511–2516. [Google Scholar] [PubMed]
- Kuhlmann, M.K. Phosphate elimination in modalities of hemodialysis and peritoneal dialysis. Blood Purif. 2010, 29, 137–144. [Google Scholar] [CrossRef]
- Uhlin, F.; Fridolin, I.; Magnusson, M.; Lindberg, L.G. Dialysis dose (kt/v) and clearance variation sensitivity using measurement of ultraviolet-absorbance (on-line), blood urea, dialysate urea and ionic dialysance. Nephrol. Dial. Transpl. 2006, 21, 2225–2231. [Google Scholar] [CrossRef]
- Holmar, J.; Fridolin, I.; Uhlin, F.; Lauri, K.; Luman, M. Optical method for cardiovascular risk marker uric acid removal assessment during dialysis. ScientificWorldJournal 2012, 2012, 506486. [Google Scholar] [CrossRef]
- Tomson, R.; Fridolin, I.; Uhlin, F.; Holmar, J.; Lauri, K.; Luman, M. Optical measurement of creatinine in spent dialysate. Clin. Nephrol. 2013, 79, 107–117. [Google Scholar] [CrossRef]
- Holmar, J.; Uhlin, F.; Ferenets, R.; Lauri, K.; Tanner, R.; Arund, J.; Luman, M.; Fridolin, I. Estimation of removed uremic toxin indoxyl sulphate during hemodialysis by using optical data of the spent dialysate. In Proceedings of the 35th Annual International Conference of the IEEE EMBS, Osaka, Japan, 3–7 July 2013; pp. 6707–6710.
- Holmar, J.; Arund, J.; Uhlin, F.; Tanner, R.; Fridolin, I. Beta2-microglobulin measurements in the spent dialysate using fluorescence spectra. In Proceedings of the 5th European Conference of the IFMBE, Budapest, Hungary, 14–18 September 2011; pp. 1035–1038.
- Enberg, P.; Fridolin, I.; Holmar, J.; Fernstrom, A.; Uhlin, F. Utilization of UV absorbance for estimation of phosphate elimination during hemodiafiltration. Nephron Clin. Pract. 2012, 121, c1–c9. [Google Scholar] [CrossRef]
- Gutzwiller, J.P.; Schneditz, D.; Huber, A.R.; Schindler, C.; Gutzwiller, F.; Zehnder, C.E. Estimating phosphate removal in haemodialysis: An additional tool to quantify dialysis dose. Nephrol. Dial. Transpl. 2002, 17, 1037–1044. [Google Scholar] [CrossRef]
- Zehnder, C.; Gutzwiller, J.P.; Renggli, K. Hemodiafiltration—A new treatment option for hyperphosphatemia in hemodialysis patients. Clin. Nephrol. 1999, 52, 152–159. [Google Scholar]
- Sigrist, M.; McIntyre, C.W. Calcium exposure and removal in chronic hemodialysis patients. J. Ren. Nutr. 2006, 16, 41–46. [Google Scholar] [CrossRef]
- Levin, N.W.; Hoenich, N.A. Consequences of hyperphosphatemia and elevated levels of the calcium-phosphorus product in dialysis patients. Curr. Opin. Nephrol. Hypertens. 2001, 10, 563–568. [Google Scholar] [CrossRef]
- Daugirdas, J.T.; Tattersall, J.E. Automated monitoring of hemodialysis adequacy by dialysis machines: Potential benefits to patients and cost savings. Kidney Int. 2010, 78, 833–835. [Google Scholar] [CrossRef]
- Michaylova, V.; Ilkova, P. Photometric determination of micro amounts of calcium with arsenazo III. Anal. Chim. Acta 1971, 53, 194–198. [Google Scholar] [CrossRef]
- Daly, J.A.; Ertingsh, G. Direct method for determining inorganic-phosphate in serum with centrifichem. Clin. Chem. 1972, 18, 263–265. [Google Scholar] [PubMed]
- Fridolin, I.; Lindberg, L. On-line monitoring of solutes in dialysate using absorption of ultraviolet radiation–wavelength dependence. Med. Biol. Eng. Comput. 2003, 41, 263–270. [Google Scholar] [CrossRef]
- Holmar, J.; Arund, J.; Uhlin, F.; Tanner, R.; Fridolin, I. Quantification of indoxyl sulphate in the spent dialysate using fluorescence spectra. In Proceedings of the 15th Nordic-Baltic Conference on Biomedical Engineering and Medical Physics, Aalborg, Denmark, 14–17 June 2011; pp. 45–48.
© 2015 by the authors; licensee MDPI, Basel, Switzerland. This article is an open access article distributed under the terms and conditions of the Creative Commons Attribution license (http://creativecommons.org/licenses/by/4.0/).
Share and Cite
Holmar, J.; Uhlin, F.; Fernström, A.; Luman, M.; Jankowski, J.; Fridolin, I. An Optical Method for Serum Calcium and Phosphorus Level Assessment during Hemodialysis. Toxins 2015, 7, 719-727. https://doi.org/10.3390/toxins7030719
Holmar J, Uhlin F, Fernström A, Luman M, Jankowski J, Fridolin I. An Optical Method for Serum Calcium and Phosphorus Level Assessment during Hemodialysis. Toxins. 2015; 7(3):719-727. https://doi.org/10.3390/toxins7030719
Chicago/Turabian StyleHolmar, Jana, Fredrik Uhlin, Anders Fernström, Merike Luman, Joachim Jankowski, and Ivo Fridolin. 2015. "An Optical Method for Serum Calcium and Phosphorus Level Assessment during Hemodialysis" Toxins 7, no. 3: 719-727. https://doi.org/10.3390/toxins7030719
APA StyleHolmar, J., Uhlin, F., Fernström, A., Luman, M., Jankowski, J., & Fridolin, I. (2015). An Optical Method for Serum Calcium and Phosphorus Level Assessment during Hemodialysis. Toxins, 7(3), 719-727. https://doi.org/10.3390/toxins7030719