The Effect of Aflatoxin-B1 on Red Drum (Sciaenops ocellatus) and Assessment of Dietary Supplementation of NovaSil for the Prevention of Aflatoxicosis

Abstract
:1. Introduction
2. Results
2.1. Growth Parameters
2.2. Immune Response
2.3. Somatic Indexes

| Variable | Weight gain 5 (%) | Survival (%) | Feed efficiency | Variable | Weight gain (%) | Survival (%) | Feed efficiency | |
|---|---|---|---|---|---|---|---|---|
| AFB1 (ppm) | Individual treatment means | AFB1 (ppm) | NS (%) | Individual treatment means | ||||
| 0 | 332 a | 80.0 a | 0.91 a | 0 | 0 | 332 ab | 80.0 | 0.91 a |
| 0.1 | 223 bc | 46.6 b | 0.62 bc | 5 | 0 | 188 c | 55.5 | 0.62 c |
| 0.25 | 224 bc | 55.5 b | 0.65 bc | 5 | 1 | 339 a | 73.3 | 0.82 ab |
| 0.5 | 254 ab | 60.0 ab | 0.75 ab | 5 | 2 | 218 bc | 57.7 | 0.71 bc |
| 1 | 212 bc | 60.0 ab | 0.73 abc | p-value | 0.039 | 0.261 | 0.005 | |
| 2 | 136 c | 60.0 ab | 0.49 c | Pooled Std. Error | 7.047 | 1.801 | 0.008 | |
| 3 | 183 bc | 62.2 ab | 0.67 bc | AFB1 (ppm) | NS (%) | Means of main effect | ||
| 5 | 188 bc | 55.5 b | 0.62 bc | 0 | 332 | 80.0 | 0.91 a | |
| R2 | 0.229 | 0.010 | 0.100 | 5 | 249 | 62.2 | 0.72 b | |
| p-value | 0.005 | 0.132 | 0.030 | 0 | 260 a | 67.7 | 0.77 | |
| Pooled Std. Error | 5.189 | 1.309 | 0.013 | 1 | 339 ab | 73.3 | 0.82 | |
| 2 | 218 b | 57.7 | 0.71 | |||||
| ANOVA: p-values | ||||||||
| AFB1 | 0.083 | 0.138 | 0.003 | |||||
| NS | 0.043 | 0.387 | 0.029 | |||||
| Variable | Serum lysozyme (units/mL) | NBT (mg/mL blood) 2 | Trypsin inhibition (%) | Variable | Serum Lysozyme (units/mL) | NBT (mg/mL blood) 2 | Trypsin inhibition (%) | |
|---|---|---|---|---|---|---|---|---|
| AFB1 (ppm) | Individual treatment means | AFB1 (ppm) | NS (%) | Individual treatment means | ||||
| 0 | 165 ab | 3.52 | 83.6 ab | 0 | 0 | 165 ab | 3.52 | 83.6 |
| 0.1 | 246 a | 3.35 | 82.4 b | 5 | 0 | 45 c | 3.07 | 81.9 |
| 0.25 | 131 bcd | 2.54 | 86.3 a | 5 | 1 | 76b c | 3.32 | 81.3 |
| 0.5 | 155 abc | 3.30 | 83.2 b | 5 | 2 | 185 a | 3.21 | 79.4 |
| 1 | 106 bcd | 1.78 | 81.9 b | p-Value | 0.024 | 0.944 | 0.577 | |
| 2 | 82 bcd | 3.05 | 80.5 b | Pooled Std. Error | 5.550 | 0.104 | 0.395 | |
| 3 | 63 cd | 2.21 | 82.7 b | AFB1 (ppm) | NS (%) | Means of main effect | ||
| 5 | 45 d | 3.07 | 81.9 b | 0 | 165 | 3.52 | 83.6 | |
| R2 | 0.394 | 0.015 | 0.109 | 5 | 102 | 3.20 | 80.9 | |
| p-Value | 0.004 | 0.250 | 0.038 | 0 | 105 | 3.30 | 82.7 | |
| Pooled Std. Error | 5.705 | 0.102 | 0.192 | 1 | 76 | 3.32 | 81.3 | |
| 2 | 185 | 3.21 | 79.4 | |||||
| ANOVA: p-Values | ||||||||
| AFB1 | 0.018 | 0.622 | 0.291 | |||||
| NS | 0.021 | 0.948 | 0.674 | |||||
| Variable | Spleen | MSI 5 | HSI 6 | IPF 7 | Variable | Spleen | MSI 5 | HSI 6 | IPF 7 | |
|---|---|---|---|---|---|---|---|---|---|---|
| AFB1 (ppm) | Individual treatment means | AFB1 (ppm) | NS (%) | Individual treatment means | ||||||
| 0 | 0.04 | 28.94 | 1.67 abc | 0.32 | 0 | 0 | 0.04 | 28.94 a | 1.67 | 0.32 a |
| 0.1 | 0.04 | 27.42 | 1.98 a | 0.11 | 5 | 0 | 0.04 | 26.06 b | 0.88 | 0.01 b |
| 0.25 | 0.04 | 26.18 | 1.79 ab | 0.20 | 5 | 1 | 0.09 | 28.33 ab | 0.82 | 0.10 b |
| 0.5 | 0.05 | 27.87 | 1.20 abc | 0.26 | 5 | 2 | 0.20 | 29.70 a | 1.56 | 0.46 a |
| 1 | 0.03 | 27.79 | 1.15 abc | 0.07 | p-Value | 0.528 | 0.031 | 0.292 | 0.003 | |
| 2 | 0.18 | 26.25 | 0.72 c | 0.18 | Pooled Std. Error | 0.015 | 0.135 | 0.070 | 0.012 | |
| 3 | 0.05 | 25.72 | 0.94 abc | 0.06 | AFB1 (ppm) | NS (%) | Means of main effect | |||
| 5 | 0.04 | 26.06 | 0.88 bc | 0.01 | 0 | 0.04 | 28.94 | 1.67 | 0.32 | |
| R2 | 0.004 | 0.141 | 0.267 | 0.152 | 5 | 0.11 | 28.03 | 1.09 | 0.19 | |
| p-Value | 0.503 | 0.417 | 0.091 | 0.466 | 0 | 0.04 | 27.50 | 1.27 | 0.17 a | |
| Pooled Std. Error | 0.015 | 0.315 | 0.091 | 0.03 | 1 | 0.09 | 28.33 | 0.82 | 0.10 a | |
| 2 | 0.20 | 29.70 | 1.56 | 0.46 b | ||||||
| ANOVA: p-Values | ||||||||||
| AFB1 | 0.494 | 0.298 | 0.205 | 0.112 | ||||||
| NS | 0.429 | 0.019 | 0.332 | 0.002 | ||||||
2.4. Proximate Composition
| Variable | % Lipid | % Protein | % Moisture | % Ash | Variable | % Lipid | % Protein | % Moisture | % Ash | |
|---|---|---|---|---|---|---|---|---|---|---|
| AFB1 (ppm) | Individual treatment means | AFB1 (ppm) | NS (%) | Individual treatment means | ||||||
| 0 | 2.70 a | 76.01 | 78.38 | 16.38 ab | 0 | 0 | 2.21 | 76.01 | 78.30 | 3.54 |
| 0.1 | 2.37 ab | 74.45 | 79.34 | 17.56 a | 5 | 0 | 1.98 | 76.52 | 79.29 | 3.73 |
| 0.25 | 1.97 bcd | 70.06 | 79.67 | 13.64 b | 5 | 1 | 2.20 | 73.92 | 76.91 | 4.28 |
| 0.5 | 2.42 ab | 74.33 | 77.69 | 16.72 ab | 5 | 2 | 2.19 | 72.93 | 79.04 | 4.35 |
| 1 | 2.17 abc | 71.64 | 78.71 | 18.04 a | p-Value | 0.510 | 0.723 | 0.173 | 0.629 | |
| 2 | 1.45 d | 74.20 | 84.55 | 19.43 a | Pooled Std. Error | 0.022 | 0.488 | 0.140 | 0.098 | |
| 3 | 1.77 cd | 71.64 | 80.60 | 17.22 a | AFB1 (ppm) | NS (%) | Means of main effect | |||
| 5 | 1.98 bcd | 76.52 | 79.29 | 18.02 a | 0 | 2.21 | 76.01 | 78.38 | 3.54 | |
| R2 | 0.211 | 0.021 | 0.024 | 0.109 | 5 | 2.12 | 74.46 | 78.41 | 4.12 | |
| p-Value | 0.002 | 0.476 | 0.452 | 0.038 | 0 | 2.10 | 76.20 | 78.83 | 3.64 | |
| Pooled Std. Error | 0.033 | 0.441 | 0.402 | 1.728 | 1 | 2.20 | 73.90 | 76.91 | 4.28 | |
| 2 | 2.19 | 72.90 | 79.04 | 4.35 | ||||||
| ANOVA: p-Values | ||||||||||
| AFB1 | 0.534 | 0.611 | 0.964 | 0.357 | ||||||
| NS | 0.394 | 0.604 | 0.095 | 0.663 | ||||||
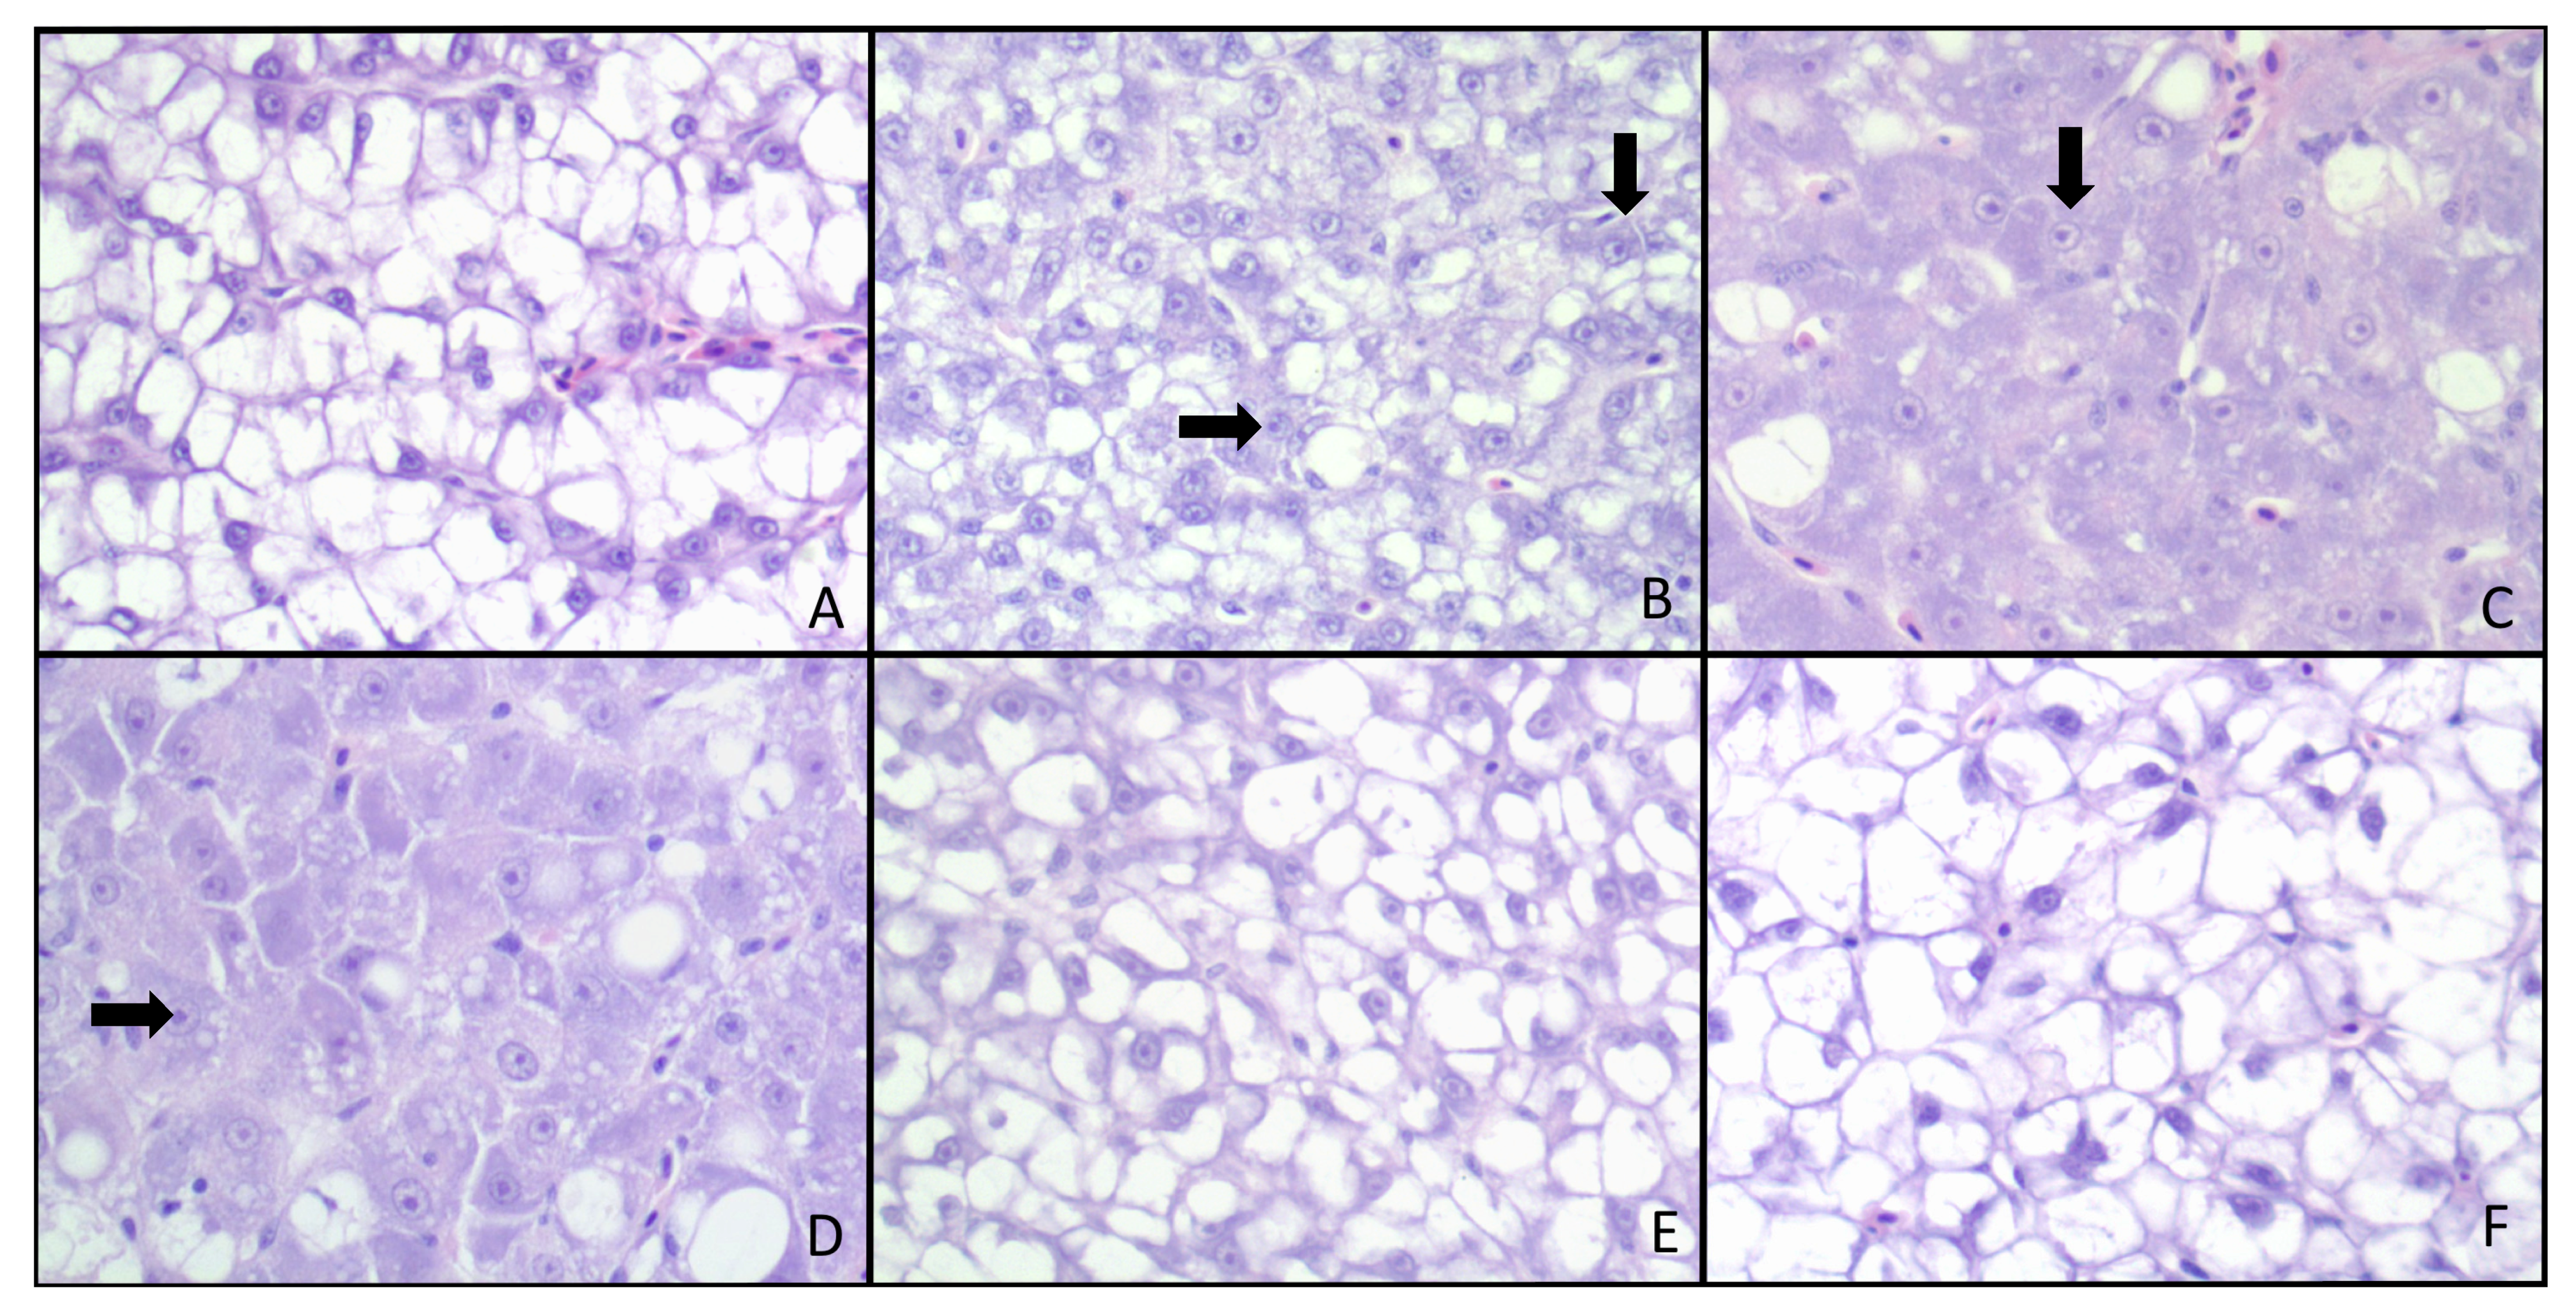
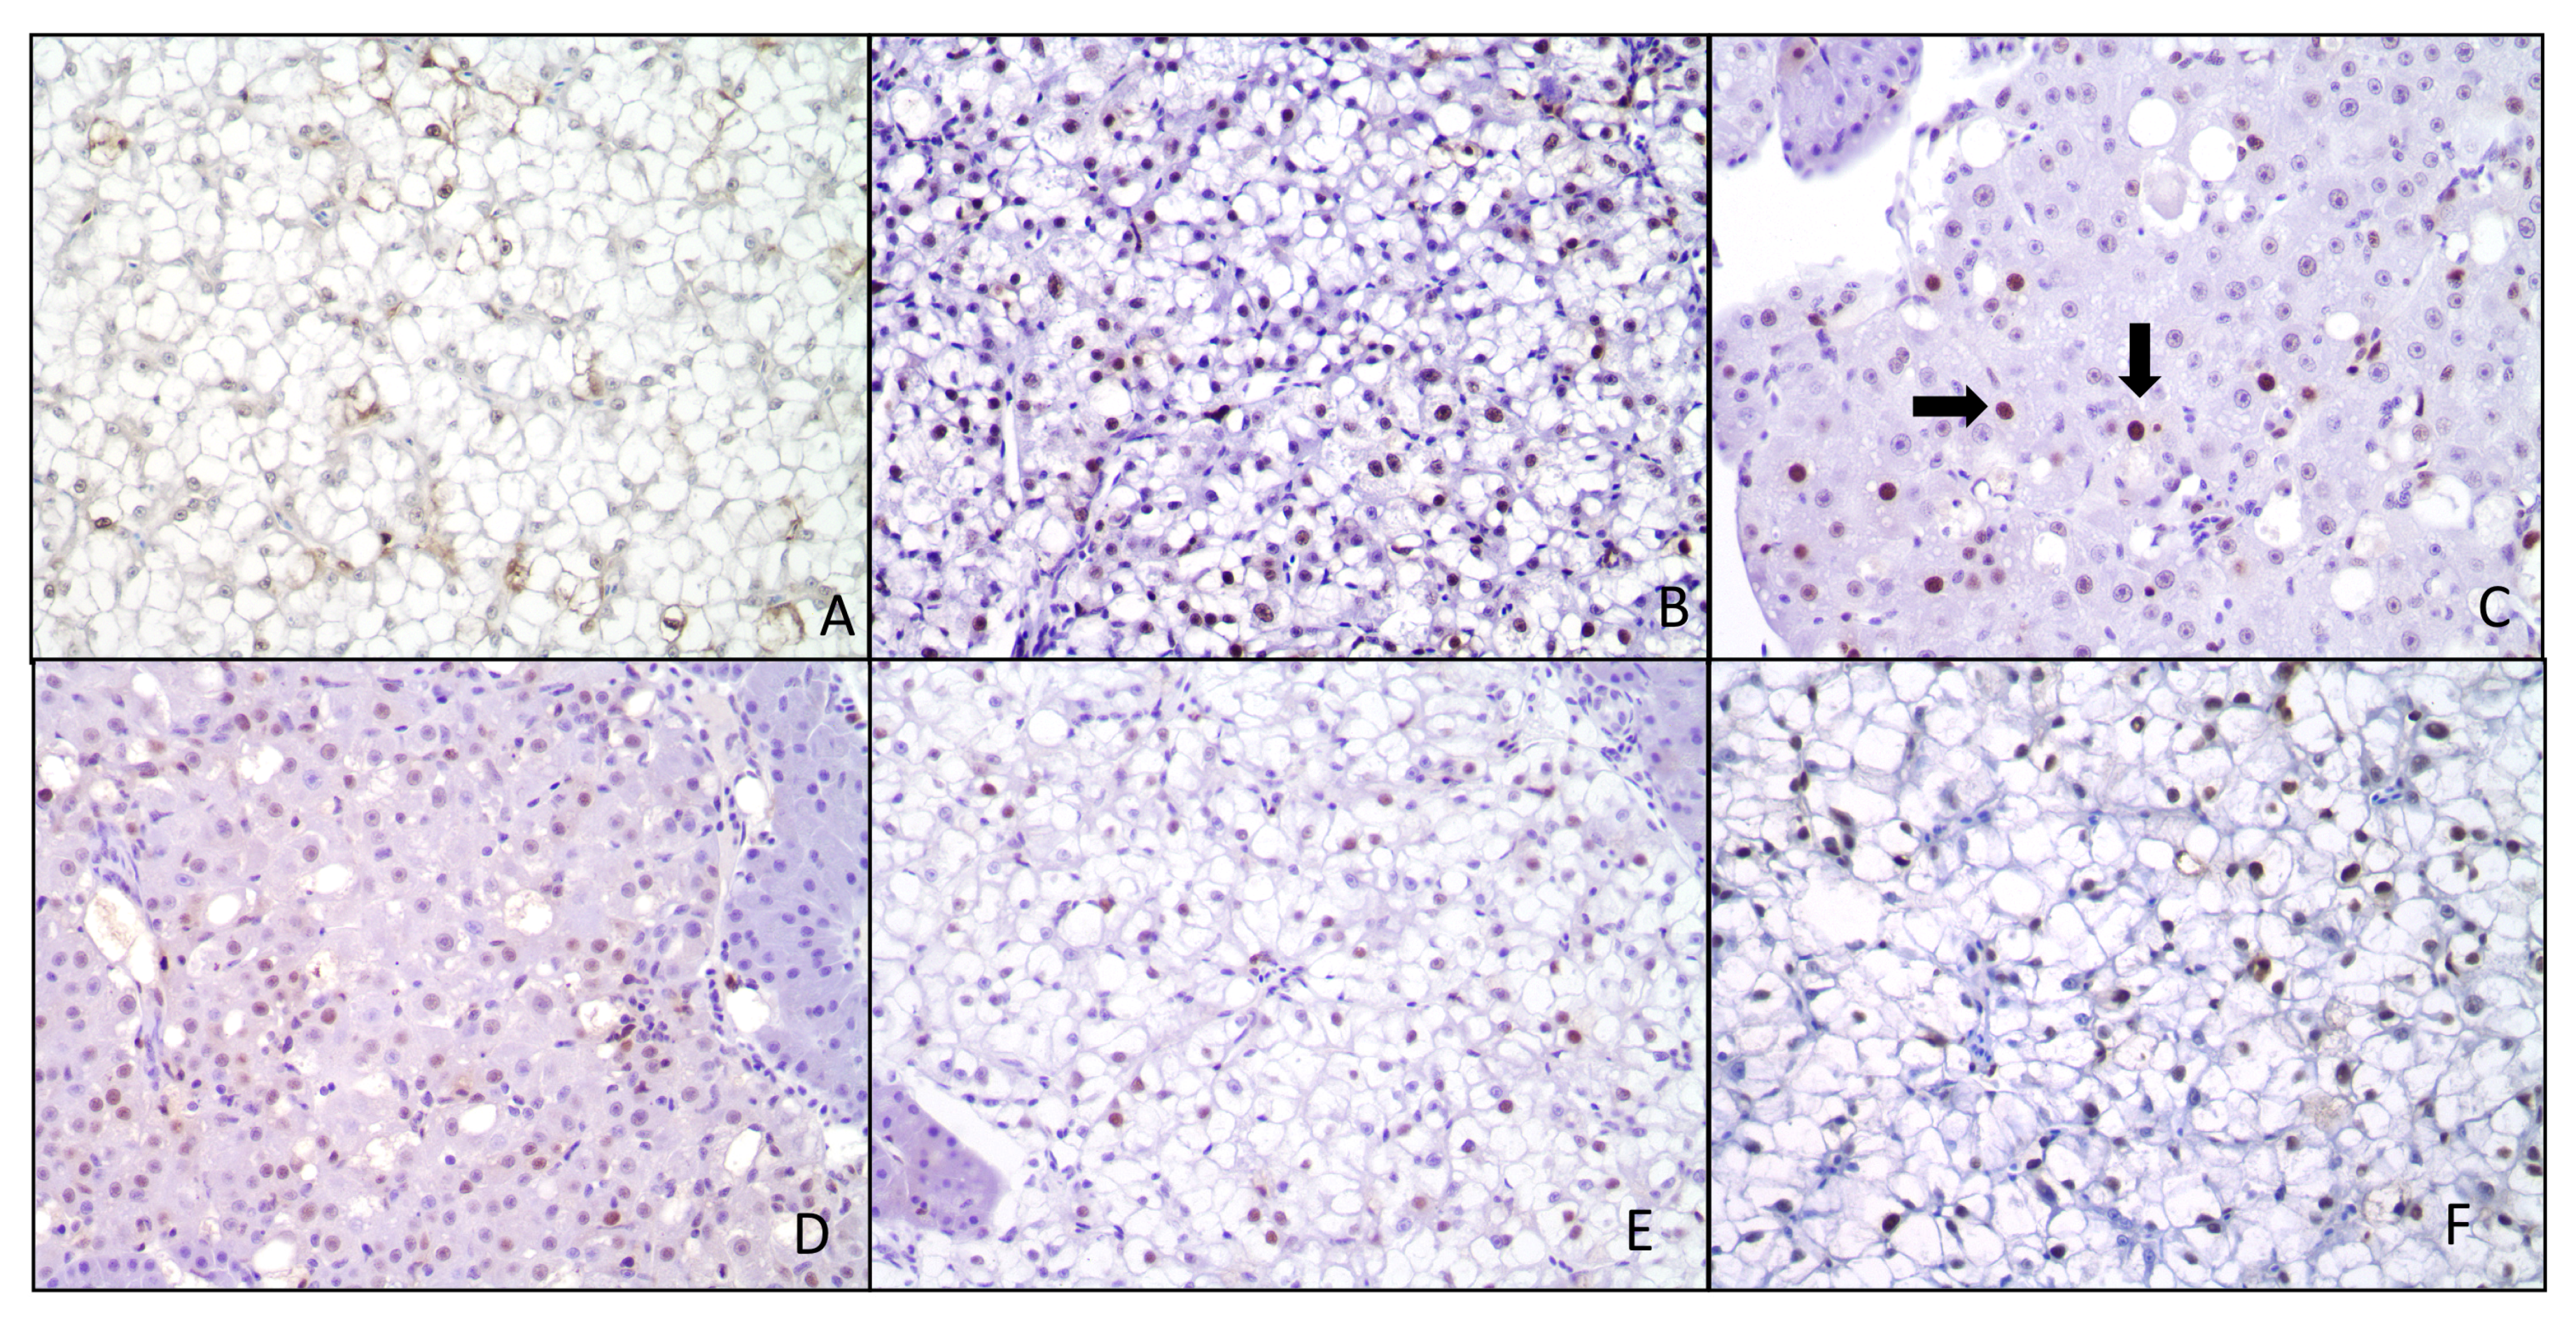
2.5. Histopathological Response and Immunohistochemistry
| Variable | Histology Score 1 | PCNA | Variable | Histology Score | PCNA | |
|---|---|---|---|---|---|---|
| AFB1 (ppm) | Individual treatment means | AFB1 (ppm) | NS (%) | Individual treatment means | ||
| 0 | 5.25 a | 6.27 | 0 | 0 | 13.16 ab | 6.27 |
| 0.1 | 10.67 a | 8.59 | 5 | 0 | 19.00 b | 10.49 |
| 0.25 | 17.33 ab | 9.35 | 5 | 1 | 9.16 a | 9.11 |
| 0.5 | 30.16 c | 11.34 | 5 | 2 | 7.66 a | 9.72 |
| 1 | 25.83 bc | 9.52 | p-Value | 0.0925 | 0.7542 | |
| 2 | 31.83 c | 9.06 | Pooled Std. Error | 0.838 | 0.836 | |
| 3 | 37.00 c | 10.30 | AFB1 (ppm) | NS (%) | Means of main effect | |
| 5 | 37.00 c | 10.49 | 0 | 13.16 | 6.27 | |
| R2 | 0.2353 | 0.0204 | 5 | 11.94 | 9.78 | |
| p-Value | 0.0001 | 0.5059 | 0 | 16.08 | 8.38 | |
| Pooled Std. Error | 1.130 | 0.815 | 1 | 9.16 | 9.11 | |
| 2 | 7.66 | 9.72 | ||||
| ANOVA: p-Values | ||||||
| AFB1 | 0.7248 | 0.3251 | ||||
| NS | 0.0491 | 0.9454 | ||||
3. Discussion


4. Materials and Methods
4.1. Experimental Diets
4.2. Fish Stock and Culture Conditions
| Level of AFB1 (ppm) | 0 | 0.1 | 0.25 | 0.5 | 1 | 2 | 3 | 5 | 5 | 5 |
|---|---|---|---|---|---|---|---|---|---|---|
| Level of NS (%) | 0 | 0 | 0 | 0 | 0 | 0 | 0 | 0 | 1 | 2 |
| Menhaden Meal a | 34.9 | 34.9 | 34.9 | 34.9 | 34.9 | 34.9 | 34.9 | 34.9 | 34.9 | 34.9 |
| Soybean Meal b | 27.3 | 27.3 | 27.3 | 27.3 | 27.3 | 27.3 | 27.3 | 27.3 | 27.3 | 27.3 |
| Dextrinized Starch c | 16.0 | 16.5 | 16.5 | 16.5 | 16.5 | 16.5 | 16.5 | 16.5 | 16.5 | 16.5 |
| Menhaden Oil a | 5.6 | 5.6 | 5.6 | 5.6 | 5.6 | 5.6 | 5.6 | 5.6 | 5.6 | 5.6 |
| Vitamin Premix d | 3.0 | 3.0 | 3.0 | 3.0 | 3.0 | 3.0 | 3.0 | 3.0 | 3.0 | 3.0 |
| Mineral Premix c | 4.0 | 4.0 | 4.0 | 4.0 | 4.0 | 4.0 | 4.0 | 4.0 | 4.0 | 4.0 |
| CMC c | 2.0 | 2.0 | 2.0 | 2.0 | 2.0 | 2.0 | 2.0 | 2.0 | 2.0 | 2.0 |
| Glycine e | 1.0 | 1.0 | 1.0 | 1.0 | 1.0 | 1.0 | 1.0 | 1.0 | 1.0 | 1.0 |
| Lysine e | 0.0 | 0.0 | 0.0 | 0.0 | 0.0 | 0.0 | 0.0 | 0.0 | 0.0 | 0.0 |
| NS f | 0.0 | 0.0 | 0.0 | 0.0 | 0.0 | 0.0 | 0.0 | 0.0 | 1.1 | 2.3 |
| AFB1-spiked Celufil g | 0.0 | 0.2 | 0.7 | 1.6 | 4.5 | 0.5 | 0.8 | 1.6 | 1.6 | 1.6 |
| Celufil e | 5.5 | 5.3 | 4.8 | 3.9 | 1.0 | 5.0 | 4.7 | 3.9 | 2.8 | 1.7 |
| Proximate Composition (% dry matter) | ||||||||||
| Protein | 36.2 | 35.8 | 35.7 | 35.2 | 35.6 | 35.5 | 36.1 | 35.6 | 35.2 | 35.5 |
| Lipid | 9.5 | 9.3 | 10.3 | 10.4 | 10.7 | 10.6 | 10.6 | 10.7 | 10.7 | 11.1 |
| Dry Matter | 94.5 | 94.7 | 94.9 | 93.6 | 94.3 | 94.8 | 95.2 | 95.4 | 95.4 | 95.0 |
| Ash | 11.1 | 10.9 | 10.9 | 11.3 | 11.1 | 10.9 | 10.9 | 11.1 | 11.8 | 12.9 |
4.3. Fish Growth and Health Responses
4.4. Immunological Responses
4.5. Histological Response
| Score | Evaluation | Description |
|---|---|---|
| 0 | Normal | Intracytoplasmic vacuolation, mostly macrovacuolar with one of the control livers also having micro and macrovesiculation. Nuclei are small and pushed to the periphery with small nucleoli. |
| 1+ | Minimal | Scattered increase in nuclear size and mostly inconspicuous nucleoli. |
| 2+ | Mild | Mild hypertrophy and pleomorphism with slightly prominent nuclei and more evident nucleoli. Some loss of intracytoplasmic macrovacuoles, and formation of microvacuoles. |
| 3+ | Moderate | Moderate cellular pleomorphism, with anisocytosis, anisokaryosis, megalocytosis and megalokaryosis. Sparse intracytoplasmic vacuoles. |
| 4+ | Marked | Diffuse loss of cytoplasmic vacuolation, mostly solid cytoplasm. Marked pleomorphism, anisocytosis, anisokaryosis, megalocytosis and megalokaryosis. |
4.6. Immunohistochemistry
4.7. Statistical Analysis
5. Conclusions
Acknowledgements
Conflicts of Interest
References
- Cardwell, K.F. Mycotoxin Contamination in Foods: Anti-Nutritional Factors. In Proceedings on Improving Human Nutrition through Agriculture, Los Banos, CA, USA, 1999; pp. 27–34.
- Council for Agricultural Science and Technology (CAST), Mycotoxins: Economic and Health Risks; CAST: Ames, IA, USA, 1989.
- Mishra, H.N.; Das, C. A review on biological control and metabolism of aflatoxin. Crit. Rev. Food Sci. Nutr. 2003, 43, 245–264. [Google Scholar] [CrossRef]
- Quist, C.F.; Bounous, D.I.; Kilburn, J.V.; Nettles, V.F.; Wyatt, R.D. The effect of dietary aflatoxin on wild Turkey poults. J. Wildlife Dis. 2000, 36, 436–444. [Google Scholar]
- Florentin, E.R.; Cottier, G.J.; Diener, U.L.; Davis, N.D. Effect of aflatoxin on different breeds and crosses of chickens. Poult. Sci. 1969, 48, 1807. [Google Scholar]
- Jiang, Y.; Jolly, P.E.; Ellis, W.O.; Wang, J.S.; Phillips, T.D.; Williams, J.H. Aflatoxin B1 albumin adduct levels and cellular immune status in Ghanaians. Int. Immunol. 2005, 17, 807–814. [Google Scholar] [CrossRef]
- Bostock, J.; McAndrew, B.; Richards, R.; Jauncey, K.; Telfer, T.; Lorenzen, K.; Little, D.; Ross, L.; Handisyde, N.; Gatward, I. Aquaculture: Global status and trends. Philos. Trans. R. Soc. B 2010, 365, 2897–2912. [Google Scholar] [CrossRef]
- Bimbo, A.P.; Crowther, J.B. Fish meal and oil: Current uses. J. Am. Oil Chem. Soc. 1992, 69, 221–227. [Google Scholar] [CrossRef]
- Pauly, D. The most important fish in the sea—Menhaden and America. Science 2007, 318, 750–751. [Google Scholar] [CrossRef]
- Davis, D.A.; Jirsa, D.; Arnold, C. Evaluation of soybean proteins as replacements for menhaden fish meal in practical diets for the red drum Sciaenops ocellatus. J. World Aquac. Soc. 1995, 26, 48–58. [Google Scholar] [CrossRef]
- Yue, Y.R.; Liu, Y.J.; Tian, L.X.; Gan, L.; Yang, H.J.; Liang, G.Y. Effects of replacing fish meal with soybean meal and peanut meal on growth, feed utilization and haemolymph indexes for juvenile white shrimp Litopenaeus vannamei, Boone. Aquac. Res. 2012, 43, 1687–1696. [Google Scholar] [CrossRef]
- Li, M.H.; Robinson, E.H.; Oberle, D.F.; Lucas, P.M.; Bosworth, B.G. Evaluation of corn gluten feed and cottonseed meal as partial replacements for soybean meal and corn in diets for pond-raised hybrid catfish, Ictalurus punctatus X I. furcatus. J. World Aquac. Soc. 2012, 43, 107–113. [Google Scholar] [CrossRef]
- 13. Naylor, R.L.; Hardy, R.W.; Bureau, D.P.; Chiu, A.; Elliott, M.; Farrell, A.P.; Forster, I.; Gatlin, D.M.; Goldburg, R.J.; Hua, K.; et al. Feeding aquaculture in an era of finite resources. Proc.Natl. Acad. Sci. USA 2009, 106, 15103–15110, 18040. [Google Scholar] [CrossRef]
- Bautista, M.N.; Lavillapitogo, C.R.; Subosa, P.F.; Begino, E.T. Aflatoxin B-1 contamination of shrimp feeds and its effect on growth and hepatopancreas of pre-adult Penaeus monodon. J. Sci. Food Agric. 1994, 65, 5–11. [Google Scholar] [CrossRef]
- Abdelhamid, A.M.; Khalil, F.F.; Ragab, M.A. Problem of mycotoxins in fish production. Egyp. J. Nutr. Feeds 1998, 1, 63–71. [Google Scholar]
- Barbosa, T.; Pereyra, C.; Soleiro, C.; Dias, E.; Oliveira, A.; Keller, K.; Silva, P.; Cavaglieri, L.; Rosa, C. Mycobiota and mycotoxins present in finished fish feeds from farms in the Rio de Janeiro State, Brazil. Int. Aquat. Res. 2013, 5, 1–9. [Google Scholar] [CrossRef]
- Phillips, T.; Afriyie-Gyawu, E.; Williams, J.; Huebner, H.; Ankrah, N.A.; Ofori-Adjei, D.; Jolly, P.; Johnson, N.; Taylor, J.; Marroquin-Cardona, A. Reducing human exposure to aflatoxin through the use of clay: A review. Food Addit. Contam. 2008, 25, 134–145. [Google Scholar] [CrossRef]
- Grant, P.G.; Phillips, T.D. Isothermal adsorption of aflatoxin B-1 on hscas clay. J. Agric. Food Chem. 1998, 46, 599–605. [Google Scholar] [CrossRef]
- Marroquín-Cardona, A.; Deng, Y.; Garcia-Mazcorro, J.; Johnson, N.; Mitchell, N.; Tang, L.; Robinson, A.; Taylor, J.; Wang, J.S.; Phillips, T. Characterization and safety of uniform particle size NovaSil clay as a potential aflatoxin enterosorbent. Appl. Clay Sci. 2011, 54, 248–257. [Google Scholar] [CrossRef]
- Afriyie-Gyawu, E.; Mackie, J.; Dash, B.; Wiles, M.; Taylor, J.; Huebner, H.; Tang, L.L.; Guan, H.X.; Wang, J.S.; Phillips, T. Chronic toxicological evaluation of dietary NovaSil clay in Sprague-Dawley rats. Food Addit. Contam. 2005, 22, 259–269. [Google Scholar] [CrossRef]
- Mayura, K.; Abdel-Wahhab, M.A.; McKenzie, K.S.; Sarr, A.B.; Edwards, J.F.; Naguib, K.; Phillips, T.D. Prevention of maternal and developmental toxicity in rats via dietary inclusion of common aflatoxin sorbents: Potential for hidden risks. Toxicol. Sci. 1998, 41, 175–182. [Google Scholar] [CrossRef]
- Zychowski, K.E.; Pohlenz, C.; Mays, T.; Romoser, A.; Hume, M.; Buentello, A.; Gatlin Iii, D.M.; Phillips, T.D. The effect of NovaSil dietary supplementation on the growth and health performance of Nile tilapia (Oreochromis niloticus) fed aflatoxin-B1 contaminated feed. Aquaculture 2013, 376–379, 117–123. [Google Scholar] [CrossRef]
- Peters, K.M.; McMichael, R.H., Jr. Early life history of the red drum, Sciaenops ocellatus (Pisces: Sciaenidae), in Tampa Bay, Florida. Estuaries 1987, 10, 92–107. [Google Scholar] [CrossRef]
- Food and Agriculture Organization (FAO). Cultured Aquatic Species Information Programme: Sciaenops ocellatus. Available online: http://www.fao.org/fishery/en (accessed on 2 May 2013).
- Ellis, S.C.; Reigh, R.C. Effects of dietary lipid and carbohydrate levels on growth and body composition of juvenile red drum, Sciaenops ocellatus. Aquaculture 1991, 97, 383–394. [Google Scholar] [CrossRef]
- McGoogan, B.; Gatlin, D. Effects of replacing fish meal with soybean meal in diets for red drum sciaenops ocellatus and potential for palatability enhancement. J. World Aquac. Soc. 1997, 28, 374–385. [Google Scholar] [CrossRef]
- Panangala, V.S.; Giambrone, J.J.; Diener, U.L.; Davis, N.D.; Hoerr, F.J.; Mitra, A.; Schultz, R.D.; Wilt, G.R. Effects of aflatoxin on the growth performance and immune responses of weanling swine. Am. J. Vet. Res. 1986, 47, 2062–2067. [Google Scholar]
- Dalvi, R. An overview of aflatoxicosis of poultry: Its characteristics, prevention and reduction. Vet. Res. Commun. 1986, 10, 429–443. [Google Scholar] [CrossRef]
- Deng, S.X.; Tian, L.X.; Liu, F.J.; Jin, S.J.; Liang, G.Y.; Yang, H.J.; Du, Z.Y.; Liu, Y.J. Toxic effects and residue of aflatoxin B1 in tilapia (Oreochromis niloticus × O. aureus) during long-term dietary exposure. Aquaculture 2010, 307, 233–240. [Google Scholar] [CrossRef]
- Anh Tuan, N.; Grizzle, J.M.; Lovell, R.T.; Manning, B.B.; Rottinghaus, G.E. Growth and hepatic lesions of Nile Tilapia (Oreochromis niloticus) fed diets containing aflatoxin B1. Aquaculture 2002, 212, 311–319. [Google Scholar] [CrossRef]
- Santacroce, M.P.; Conversano, M.; Casalino, E.; Lai, O.; Zizzadoro, C.; Centoducati, G.; Crescenzo, G. Aflatoxins in aquatic species: Metabolism, toxicity and perspectives. Rev. Fish Biol. Fish. 2008, 18, 99–130. [Google Scholar] [CrossRef]
- Han, D.; Xie, S.; Zhu, X.; Yang, Y.; Guo, Z. Growth and hepatopancreas performances of gibel carp fed diets containing low levels of aflatoxin B1. Aquac. Nutr. 2010, 16, 335–342. [Google Scholar]
- Raghavan, P.R.; Zhu, X.; Lei, W.; Han, D.; Yang, Y.; Xie, S. Low levels of Aflatoxin B1 could cause mortalities in juvenile hybrid sturgeon, Acipenser ruthenus ♂×A. baeri♀. Aquac. Nutr. 2011, 17, e39–e47. [Google Scholar] [CrossRef]
- Cagauan, A.G.; Tayaban, R.H.; Somga, J.R.; Bartolome, R.M. Effect of Aflatoxin-Contaminated Feeds in Nile Tilapia (Oreochromis Niloticus L.). In Proceedings of 6th International Symposium on Tilapia in Aquaculture (ISTA 6) Section: Health Management and Diseases, Manila, Philippines, 2004.
- Calabrese, E.J. Hormetic dose-response relationships in immunology: Occurrence, quantitative features of the dose response, mechanistic foundations, and clinical implications. Crit. Rev. Toxicol. 2005, 35, 89–295. [Google Scholar] [CrossRef]
- Calabrese, E.J. Hormesis: A revolution in toxicology, risk assessment and medicine. EMBO Rep. 2004, 5, S37–S40. [Google Scholar] [CrossRef]
- Diaz, G.; Calabrese, E.; Blain, R. Aflatoxicosis in chickens (Gallus gallus): An example of hormesis? Poult. Sci. 2008, 87, 727–732. [Google Scholar] [CrossRef]
- Chávez-Sánchez, M.C.; Martínez Palacios, C.A.; Osorio Moreno, I. Pathological effects of feeding young Oreochromis niloticus diets supplemented with different levels of aflatoxin B1. Aquaculture 1994, 127, 49–60. [Google Scholar] [CrossRef]
- Ostrander, G.K.; Blair, J.B.; Stark, B.A.; Marley, G.M.; Bales, W.D.; Veltri, R.W.; Hinton, D.E.; Okihiro, M.; Ortego, L.S.; Hawkins, W.E. Long-term primary culture of epithelial cells from rainbow trout (Oncorhynchus mykiss) liver. In Vitro Cell. Dev. Biol. Anim. 1995, 31, 367–378. [Google Scholar] [CrossRef]
- Borucinska, J.D.; Schmidt, B.; Tolisano, J.; Woodward, D. Molecular markers of cancer in cartilaginous fish: Immunocytochemical study of PCNA, p-53, myc and ras expression in neoplastic and hyperplastic tissues from free ranging blue sharks, Prionace glauca (L.). J. Fish Dis. 2008, 31, 107–115. [Google Scholar] [CrossRef]
- Banlunara, W.; Bintvihok, A.; Kumagai, S. Immunohistochemical study of proliferating cell nuclear antigen (PCNA) in duckling liver fed with aflatoxin B1 and esterified glucomannan. Toxicon 2005, 46, 954–957. [Google Scholar] [CrossRef]
- Oznurlu, Y.; Celik, I.; Sur, E.; Ozaydin, T.; Oguz, H.; Altunbas, K. Determination of the effects of aflatoxin B-1 given in ovo on the proximal tibial growth plate of broiler chickens: Histological, histometric and immunohistochemical findings. Avian Pathol. 2012, 41, 469–477. [Google Scholar] [CrossRef]
- Bailey, G.S.; Williams, D.E.; Wilcox, J.S.; Loveland, P.M.; Coulombe, R.A.; Hendricks, J.D. Aflatoxin B1 carcinogenesis and its relation to DNA adduct formation and adduct persistence in sensitive and resistant salmonid fish. Carcinogenesis 1988, 9, 1919–1926. [Google Scholar] [CrossRef]
- Mohapatra, S.; Sahu, N.P.; Pal, A.K.; Prusty, A.K.; Kumar, V.; Kumar, S. Haemato-immunology and histo-architectural changes in Labeo rohita fingerlings: Effect of dietary aflatoxin and mould inhibitor. Fish Physiol. Biochem. 2011, 37, 177–186. [Google Scholar] [CrossRef]
- Hassan, A.M.; Kenawy, A.M.; Abbas, W.T.; Abdel-Wahhab, M.A. Prevention of cytogenetic, histochemical and biochemical alterations in Oreochromis niloticus by dietary supplement of sorbent materials. Ecotoxicol. Environ. Saf. 2010, 73, 1890–1895. [Google Scholar] [CrossRef]
- Hamilton, P.; Garlich, J. Aflatoxin as a possible cause of fatty liver syndrome in laying hens. Poult. Sci. 1971, 50, 800–804. [Google Scholar] [CrossRef]
- Rogers, A.E.; Newberne, P.M. Diet and aflatoxin B1 toxicity in rats. Toxicol. Appl. Pharmacol. 1971, 20, 113–121. [Google Scholar] [CrossRef]
- Tucker, J.W., Jr.; Lellis, W.A.; Vermeer, G.K.; Roberts, D.E., Jr.; Woodward, P.N. The effects of experimental starter diets with different levels of soybean or menhaden oil on red drum (Sciaenops ocellatus). Aquaculture 1997, 149, 323–339. [Google Scholar] [CrossRef]
- Karaman, M.; Ozen, H.; Tuzcu, M.; Cigremis, Y.; Onder, F.; Ozcan, K. Pathological, biochemical and haematological investigations on the protective effect of α-lipoic acid in experimental aflatoxin toxicosis in chicks. Br. Poult. Sci. 2010, 51, 132–141. [Google Scholar] [CrossRef]
- Godlewski, C.E.; Boyd, J.N.; Sherman, W.K.; Anderson, J.L.; Stoewsand, G.S. Hepatic glutathione S-transferase activity and aflatoxin B1-induced enzyme altered foci in rats fed fractions of brussels sprouts. Cancer Lett. 1985, 28, 151–157. [Google Scholar] [CrossRef]
- Hanigan, M.H.; Pitot, H.C. Gamma-glutamyl transpeptidase—Its role in hepatocarcinogenesis. Carcinogenesis 1985, 6, 165–172. [Google Scholar] [CrossRef]
- Ellis, R.; Clements, M.; Tibbetts, A.; Winfree, R. Reduction of the bioavailability of 20 μg/kg aflatoxin in trout feed containing clay. Aquaculture 2000, 183, 179–188. [Google Scholar] [CrossRef]
- Eya, J.C.; Parsons, A.; Haile, I.; Jagidi, P. Effects of dietary zeolites (bentonite and mordenite) on the performance juvenile rainbow trout onchorhynchus myskis. Austr. J. Basic Appl. Sci. 2008, 2, 961–967. [Google Scholar]
- Gatlin, D.M. Red Drum Sciaenops Ocellatus. In Nutrient Requirements and Feeding of Fish for Aquaculture; Webster, C.D., Lim, C., Eds.; CABI Publishing: Wallingford, Oxon, UK, 2002; pp. 147–158. [Google Scholar]
- Webb, K.A.; Gatlin, D.M. Effects of dietary protein level and form on production characteristics and ammonia excretion of red drum sciaenops ocellatus. Aquaculture 2003, 225, 17–26. [Google Scholar] [CrossRef]
- Li, P.; Gatlin, D.M. Evaluation of brewers yeast (Saccharomyces cerevisiae) as a feed supplement for hybrid striped bass (Morone chrysops × M-saxatilis). Aquaculture 2003, 219, 681–692. [Google Scholar] [CrossRef]
- Jorgensen, J.B.; Sharp, G.J.E.; Secombes, C.J.; Robertsen, B. Effect of a yeast-cell-wall glucan on the bactericidal activity of rainbow-trout macrophages. Fish Shellfish Immunol. 1993, 3, 267–277. [Google Scholar] [CrossRef]
- Siwicki, A.K.; Anderson, D.P.; Rumsey, G.L. Dietary intake of immunostimulants by rainbow trout affects nonspecific immunity and protection against furunculosis. Vet. Immunol. Immunopathol. 1994, 41, 125–139. [Google Scholar] [CrossRef]
- Lange, S.; Guđmundsdottir, B.K.; Magnadottir, B. Humoral immune parameters of cultured atlantic halibut (Hippoglossus Hippoglossus). Fish Shellfish Immunol. 2001, 11, 523–535. [Google Scholar] [CrossRef]
- Lamprecht, M.R.; Sabatini, D.M.; Carpenter, A.E. Cellprofiler™: Free, versatile software for automated biological image analysis. Biotechniques 2007, 42, 71. [Google Scholar] [CrossRef]
- Wobbrock, J.O.; Findlater, L.; Gergle, D.; Higgins, J.J. The Aligned Rank Transform for Nonparametric Factorial Analyses Using Only Anova Procedures. In Proceedings of the ACM Conference on Human Factors in Computing Systems (CHI '11), Vancouver, Canada, 7–12 May 2011; pp. 143–146.
© 2013 by the authors; licensee MDPI, Basel, Switzerland. This article is an open access article distributed under the terms and conditions of the Creative Commons Attribution license (http://creativecommons.org/licenses/by/3.0/).
Share and Cite
Zychowski, K.E.; Hoffmann, A.R.; Ly, H.J.; Pohlenz, C.; Buentello, A.; Romoser, A.; Gatlin, D.M.; Phillips, T.D. The Effect of Aflatoxin-B1 on Red Drum (Sciaenops ocellatus) and Assessment of Dietary Supplementation of NovaSil for the Prevention of Aflatoxicosis. Toxins 2013, 5, 1555-1573. https://doi.org/10.3390/toxins5091555
Zychowski KE, Hoffmann AR, Ly HJ, Pohlenz C, Buentello A, Romoser A, Gatlin DM, Phillips TD. The Effect of Aflatoxin-B1 on Red Drum (Sciaenops ocellatus) and Assessment of Dietary Supplementation of NovaSil for the Prevention of Aflatoxicosis. Toxins. 2013; 5(9):1555-1573. https://doi.org/10.3390/toxins5091555
Chicago/Turabian StyleZychowski, Katherine E., Aline Rodrigues Hoffmann, Hoai J. Ly, Camilo Pohlenz, Alejandro Buentello, Amelia Romoser, Delbert M. Gatlin, and Timothy D. Phillips. 2013. "The Effect of Aflatoxin-B1 on Red Drum (Sciaenops ocellatus) and Assessment of Dietary Supplementation of NovaSil for the Prevention of Aflatoxicosis" Toxins 5, no. 9: 1555-1573. https://doi.org/10.3390/toxins5091555
APA StyleZychowski, K. E., Hoffmann, A. R., Ly, H. J., Pohlenz, C., Buentello, A., Romoser, A., Gatlin, D. M., & Phillips, T. D. (2013). The Effect of Aflatoxin-B1 on Red Drum (Sciaenops ocellatus) and Assessment of Dietary Supplementation of NovaSil for the Prevention of Aflatoxicosis. Toxins, 5(9), 1555-1573. https://doi.org/10.3390/toxins5091555