Article

Cell Type-Specific Effects of Fusarium Mycotoxins on Primary Neurons and Astroglial Cells

by
Viktória Szentgyörgyi
,
Brigitta Tagscherer-Micska
,
Anikó Rátkai
,
Katalin Schlett
,
Norbert Bencsik
* and
Krisztián Tárnok
*
Department of Physiology and Neurobiology, Institute of Biology, Eötvös Loránd University, H-1053 Budapest, Hungary
*
Authors to whom correspondence should be addressed.
Toxins 2025, 17(8), 368; https://doi.org/10.3390/toxins17080368
Submission received: 10 June 2025 / Revised: 14 July 2025 / Accepted: 21 July 2025 / Published: 25 July 2025
(This article belongs to the Section Mycotoxins)

Abstract

Fumonisin B1, deoxynivalenol (DON), and zearalenone (ZEA) are toxic secondary metabolites produced by Fusarium molds. These mycotoxins are common food and feed pollutants and represent a risk to human and animal health. Although the mycotoxins produced by this genus can cross the blood–brain barrier in many species, their effect on neuronal function remains unclear. We investigated the cell viability effects of these toxins on specified neural cell types, including mouse primary neuronal, astroglial, and mixed-cell cultures 24 or 48 h after mycotoxin administration. DON decreased cell viability in a dose-dependent manner, independent of the culture type. Fumonisin B1 was toxic in pure neuronal cultures only at high doses, but toxicity was attenuated in mixed and pure astroglial cultures. ZEA had significant effects on all culture types in 10 nM by increasing cell viability and network activity, as revealed by multi-electrode array measurements. Since ZEA is a mycoestrogen, we analyzed the effects of ZEA on the expression of estrogen receptor isotypes ERα and ERβ and the mitochondrial voltage-dependent anion channel via qRT-PCR. In neuronal and mixed cultures, ZEA administration decreased ERα expression, while in astroglial cultures, it induced the opposite effect. Thus, our results emphasize that Fusarium mycotoxins act in a cell-specific manner.
Key Contribution: The fumonisin B1 (FB1), deoxynivalenol (DON), and zearalenone (ZEA) mycotoxins produced by Fusarium molds have cell type-specific effects on the viability of pure neuronal, mixed primary embryonal, or postnatal astroglia murine cultures. We found that DON decreases cell viability in a dose-dependent manner, while FB1 increases viability in astroglial and mixed-cell cultures at low doses, and ZEA increases viability in all cell types and affects estrogen receptor expression differently. In addition, ZEA rapidly induces burst activity and synchronicity within mixed neuronal–glial cultures.

1. Introduction

The fumonisin B1 (FB1), deoxynivalenol (DON), and zearalenone (ZEA) mycotoxins are common pollutants in food and feed worldwide and represent risks to both human and animal health [1]. These toxic secondary metabolites are produced by molds of the Fusarium genus. Due to climate change, the habitat of these species has changed, and the new weather conditions support their mycotoxin production [2]. Mycotoxins are usually thermostable; therefore, they can be present in processed food and feed despite milling, extrusion, storage, or heating. Mycotoxins can induce a multitude of physiological effects. For example, FB1, the most prevalent fumonisin type, is a known cancer promoter [3] linked to human esophageal cancer in South Africa and China. It is hepato-, nephro-, and immunotoxic as well, caused by the mechanisms of oxidative stress, apoptosis, and the inhibition of sphingolipid biosynthesis [4]. Chronic exposure to DON leads to feed refusal, anorexia, immunotoxicity, gastroenteritis, and skin dermatitis based on its inhibitory action on protein biosynthesis and subsequent activation of mitogen-activated protein kinases [5,6]. DON can activate oxidative stress by elevating ROS (reactive oxygen species) production, triggering inflammatory and apoptotic pathways and compromising antioxidant mechanisms, with partial compensation by the Nrf2-HO-1 (nuclear factor erythroid 2-related factor 2-heme oxygenase-1) system, which can be overloaded at higher exposures [7,8]. ZEA also has immuno- and hepatotoxic effects and induces genotoxicity via DNA adduct formation [9]. Specifically, ZEA exposure has been shown to suppress Nrf2 expression and activity in various cell types, including jejunal epithelial and endometrial stromal cells [10,11]. Some studies also report that antioxidants (e.g., quercetagetin and kaempferol) can restore Nrf2 activity and mitigate ZEA-induced cytotoxicity, highlighting the central role of the Nrf2 pathway in cellular defense against ZEA cytotoxicity [12,13]. In addition, ZEA is a potent endocrine disruptor due to its binding capacity to both the ERα and ERβ estrogen receptors [14,15]. By misregulating the hormonal system, it can cause severe symptoms such as fertility disorders, reduced litter size and fetal weight, alterations in the reproductive tract of animals, or early thelarche and premature puberty in humans [9].
Besides the general physiological effects, exposure to these mycotoxins can cause neurological symptoms [1]. In the case of FB1, the best-known effect is the equine leukoencephalomalacia (ELEM) in horses [16]; however, FB1 has also been linked to neural tube defects in children [17]. Former studies have also shown that FB1 can pass through the blood–brain barrier (BBB) [16]. In vitro studies on neural cultures have demonstrated that FB1 causes diverse cellular effects by inhibiting axonal and dendritic growth [18,19] or altering myelin formation and oligodendrocyte maturation [20] by disrupting sphingolipid metabolism [21]. Based on data from different cell lines, FB1 can induce cell death via oxidative stress and/or apoptosis in a cell type-specific manner [22].
Due to its strong emetic properties, deoxynivalenol is also known as vomitoxin. It is able to exert a direct neuronal effect, since circulating DON or its metabolites can pass the BBB and accumulate in the brain [23,24,25]. DON has been reported to cause GABAergic neuronal activation [26] and stimulate the neuronal dopamine receptors [27,28]. In vivo, it has been reported to increase salivation in swine [29]. DON can cause neuroinflammation [30], modify feeding behavior leading to reduced food intake [31,32] and alter goal-directed, reward-driven behaviors in rats [26].
Limited data are available on the direct neurologic and/or neurotoxic effects of ZEA. In vivo, chronic ZEA administration decreased the brain protein levels of rats and affected the cellular oxidoreductive capacity by increasing superoxide dismutase (SOD) and decreasing glutathione (GSH) levels and glutathione peroxidase activity (GSH-Px), resulting in elevated levels of NO production and apoptosis [33]. The ZEA-induced formation of ROS and oxidative stress were also observed in human neuroblastoma cell lines [34,35,36]. On the other hand, ZEA exerted no effect on estrogen biosynthesis in glioblastoma cells [37]. In a few reports, the administration of ZEA or its derivatives led to positive outcomes on memory impairment and adult neurogenesis [38], or was neuroprotective by counterbalancing the effects of ovariectomy or β-amyloid (25–35)-induced oxidative/ER stress [39,40,41]. The ZEA-mediated regulation of the expression of ERβ or thyroid receptor α,β has also been recently reported on cerebellar granule cells [42,43]. Although these data reveal important neurological consequences of mycotoxin consumption, and purified mycotoxins are intensively tested on different cell lines to determine their primary effects on cell survival and metabolism [44,45], current knowledge on their cell type-specific effects within the brain is still limited.
Primary cultures enable us to investigate cells derived directly from the brain tissue. To unravel the neuron- or astroglia-specific processes upon mycotoxin treatment, pure neuronal as well as mixed cultures containing both neurons and astroglial cells and pure astroglia cultures were established from embryonic and postnatal mouse cortices or forebrains, respectively. In the present work, we compare the cell type-specific effects of FB1, DON, and ZEA to define the cellular targets of the different mycotoxins. We provide evidence that neurons and astrocytes can exert cell type- and concentration-dependent responses to mycotoxins and can counterbalance the mycotoxin-evoked effects on each other. In addition, we show that ZEA rapidly promotes spontaneous bursting activity and the synchronization of in vitro neuronal networks.

2. Results

2.1. The Presence of Astroglial Cells Attenuates the Cytotoxic Effect of FB1

Neurons and astrocytes can exhibit diverse responses to mycotoxin administration. In order to determine and compare the cell type-specific effects of mycotoxins, three different types of primary cell cultures were created and used in our experiments containing (i) both neurons and astroglia (“mixed”), (ii) only neurons and no glial cells (“neuronal culture”), or (iii) neuron-free glial cells (“astroglial culture”). The cellular composition of cultures was verified via immunostaining using cell type-specific markers. Neurons, astroglia cells, and microglia were visualized using IIIβ-tubulin, glial fibrillary acidic protein (GFAP), and Iba-1 immunopositivity, respectively (Figure 1). In mixed cultures, both neurons and astrocytes were detectable. Neuronal cultures were free of astroglial and microglial cells, and while primary glia cultures contained a few microglial cells, they were mainly astrocyte-rich and neuron-free.
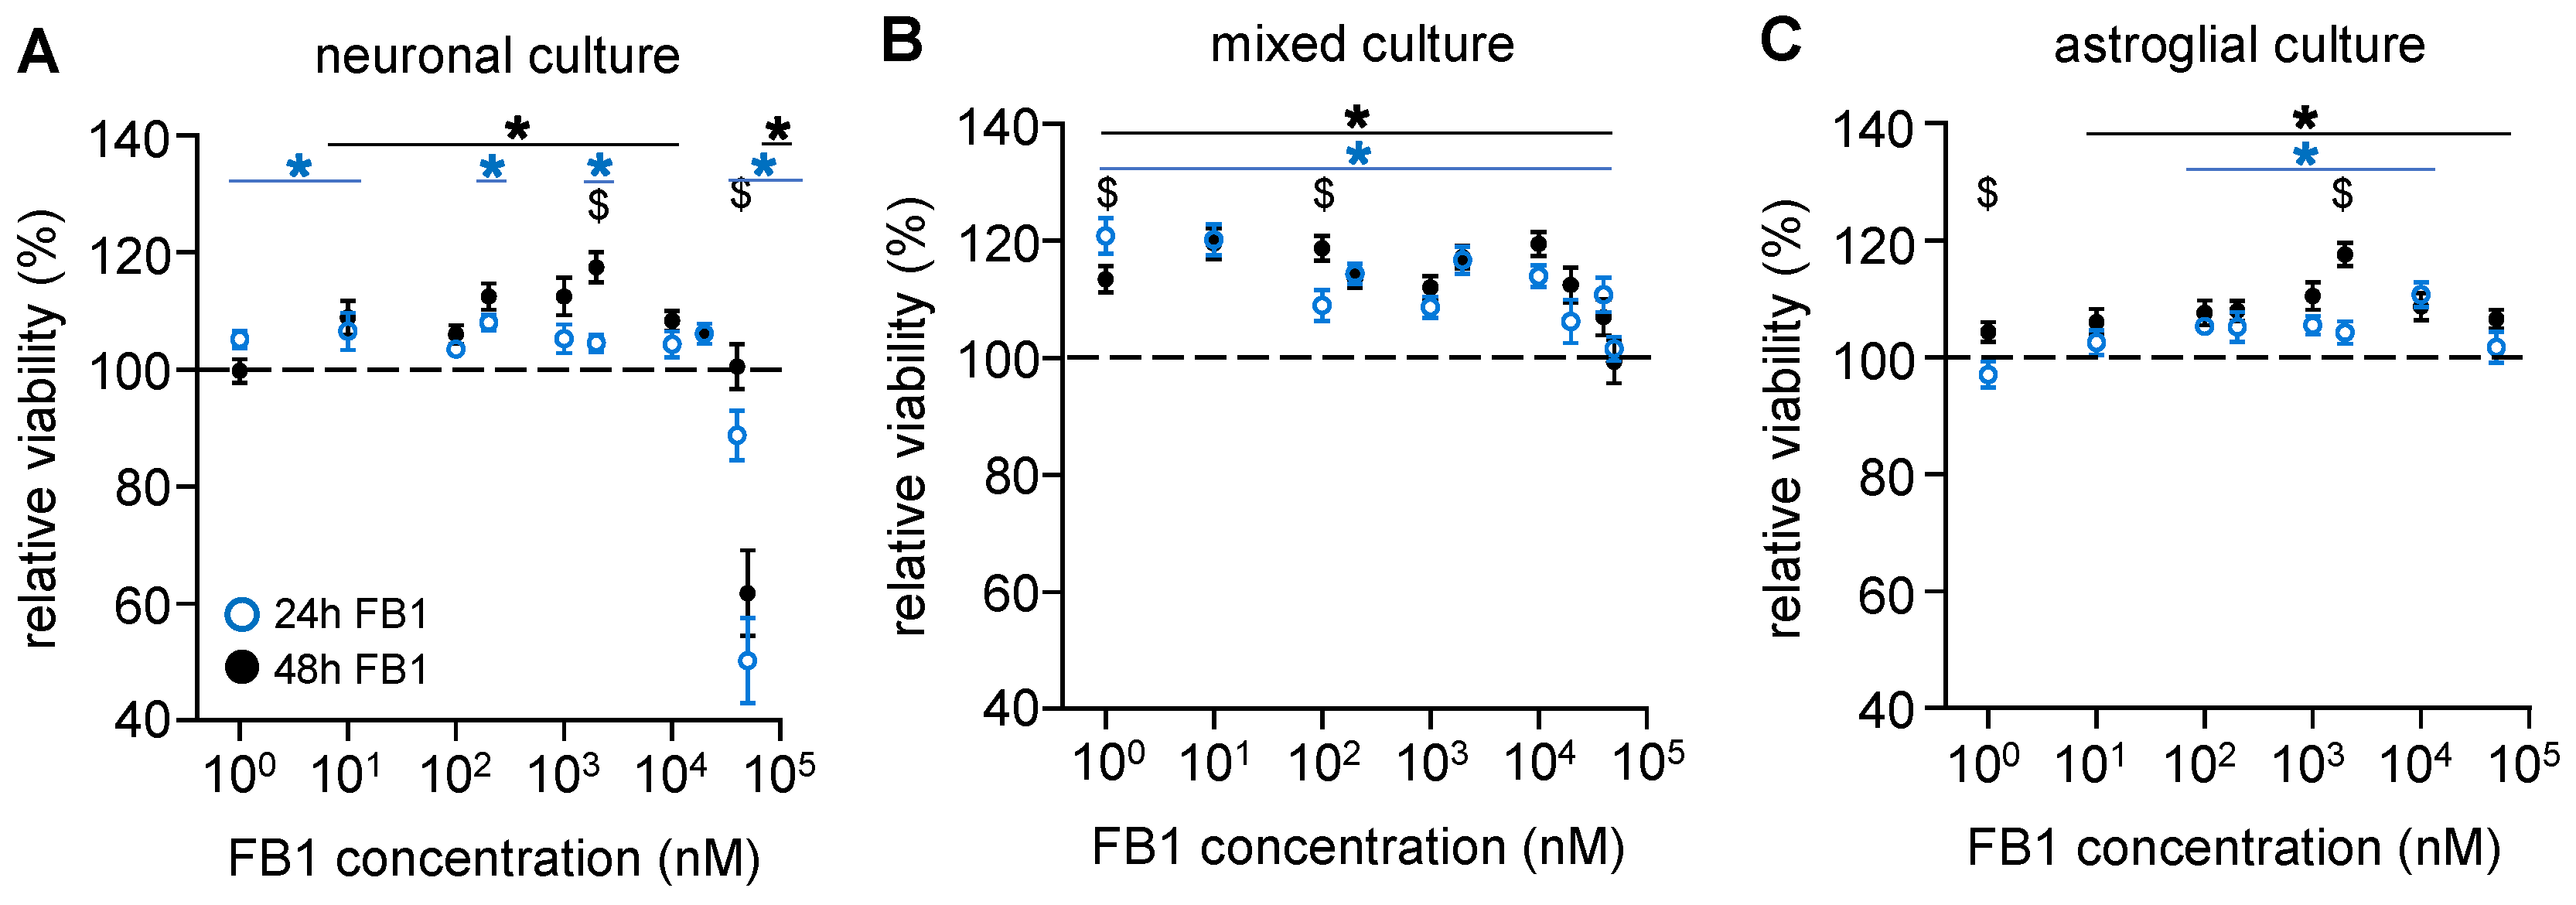
To examine the cellular effects of FB1 mycotoxins, mixed and purified cultures were prepared in 96-well plates and treated for 24 or 48 h with increasing (1 nM–50 µM) concentrations of FB1. Cell viability was determined via the MTT assay. According to our data, FB1 significantly increased cell viability above a 10 nM concentration in cultures containing solely neurons or neurons and astroglia cells (Figure 2A,B). However, this effect was decreased above a 10 µM concentration, and in pure neuronal cultures, 50 µM of FB1 caused a drastic, 50% viability loss. Increasing the treatment from 24 to 48 h did not dramatically change the observed toxin-mediated effects.
In astroglial cultures, FB1 administration significantly increased cell viability above a 10 nM or 100 nM concentration in a 48 or 24 h treatment time, respectively (Figure 2C). The cytotoxic effects observed in pure neuronal cultures did not occur in glial nor in mixed cultures, so the presence of astroglial cells reduced the neuronal cytotoxicity of FB1.

2.2. Astroglial Cells Are More Sensitive than Neurons to the Cytotoxic Effects of DON

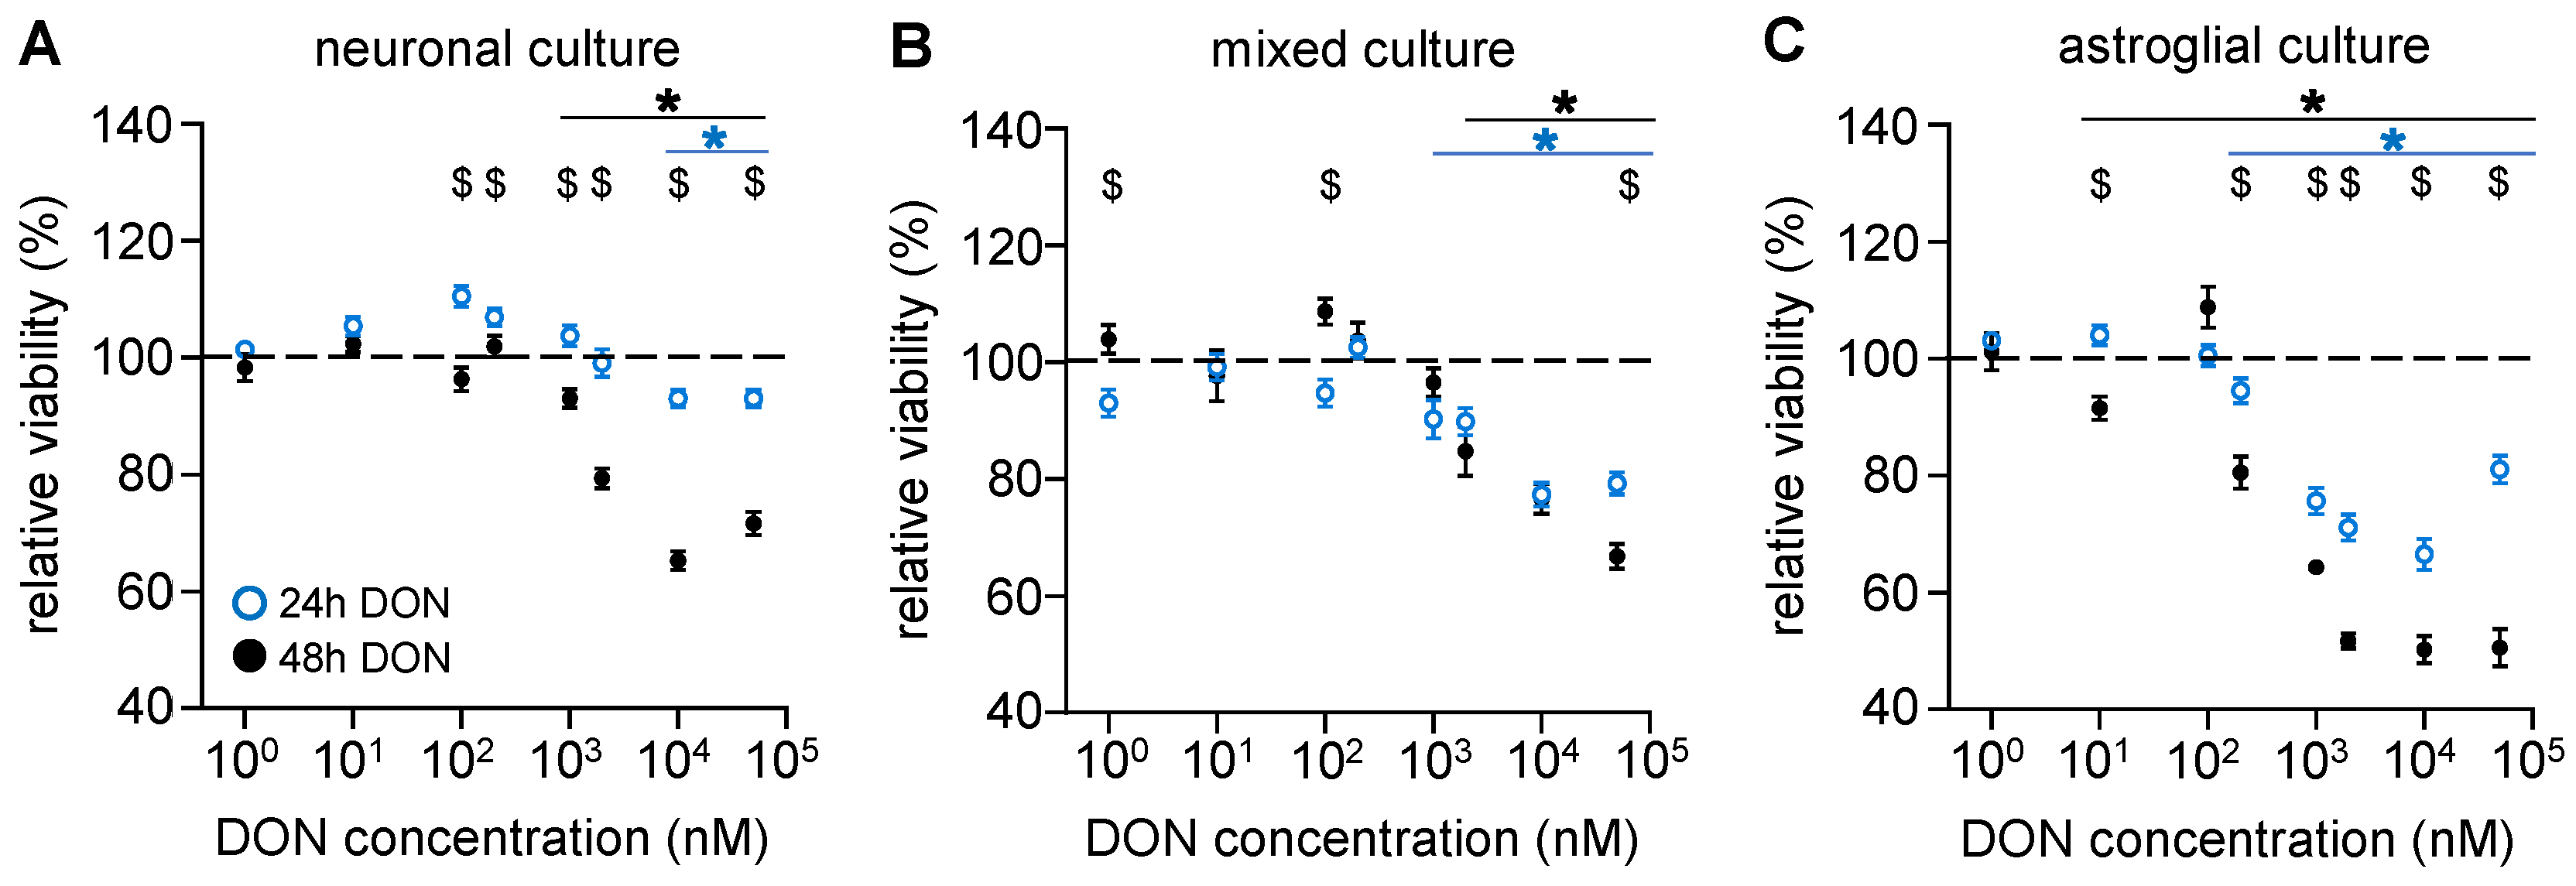
In addition to FB1, Fusarium species also produce other mycotoxins, including deoxynivalenol (DON). To investigate the effects of DON on neural cells, cultures were treated similarly to in the FB1 experiments. Our results showed that in cultures containing either only neurons (Figure 3A) or both neurons and astrocytes (Figure 3B), DON treatment at concentrations below 1 µM was ineffective. In the concentration range of 1–50 µM, DON decreased cell viability in a concentration- and time-dependent manner. On the other hand, a more prominent, concentration-dependent decrease in viability was observed in astroglia cells after 24 h of DON treatment above 200 nM (Figure 3C). Toxicity was further elevated by 48 h of DON treatment and was evident from even lower concentrations (e.g., at 2 µM, 48 h treatment of DON resulted in an approx. 35% reduction in the viability of astroglia cells; Figure 3C). Notably, in mixed cultures, DON treatment reduced cell viability by only 20% at 2 µM (Figure 3B). Taken together, our data show that astroglial cells are the most sensitive to DON administration in our system.

2.3. ZEA Increases Cell Viability in All Investigated Culture Types Even at Low Concentrations and Alters the Expression of ERα in a Cell Type-Specific Manner

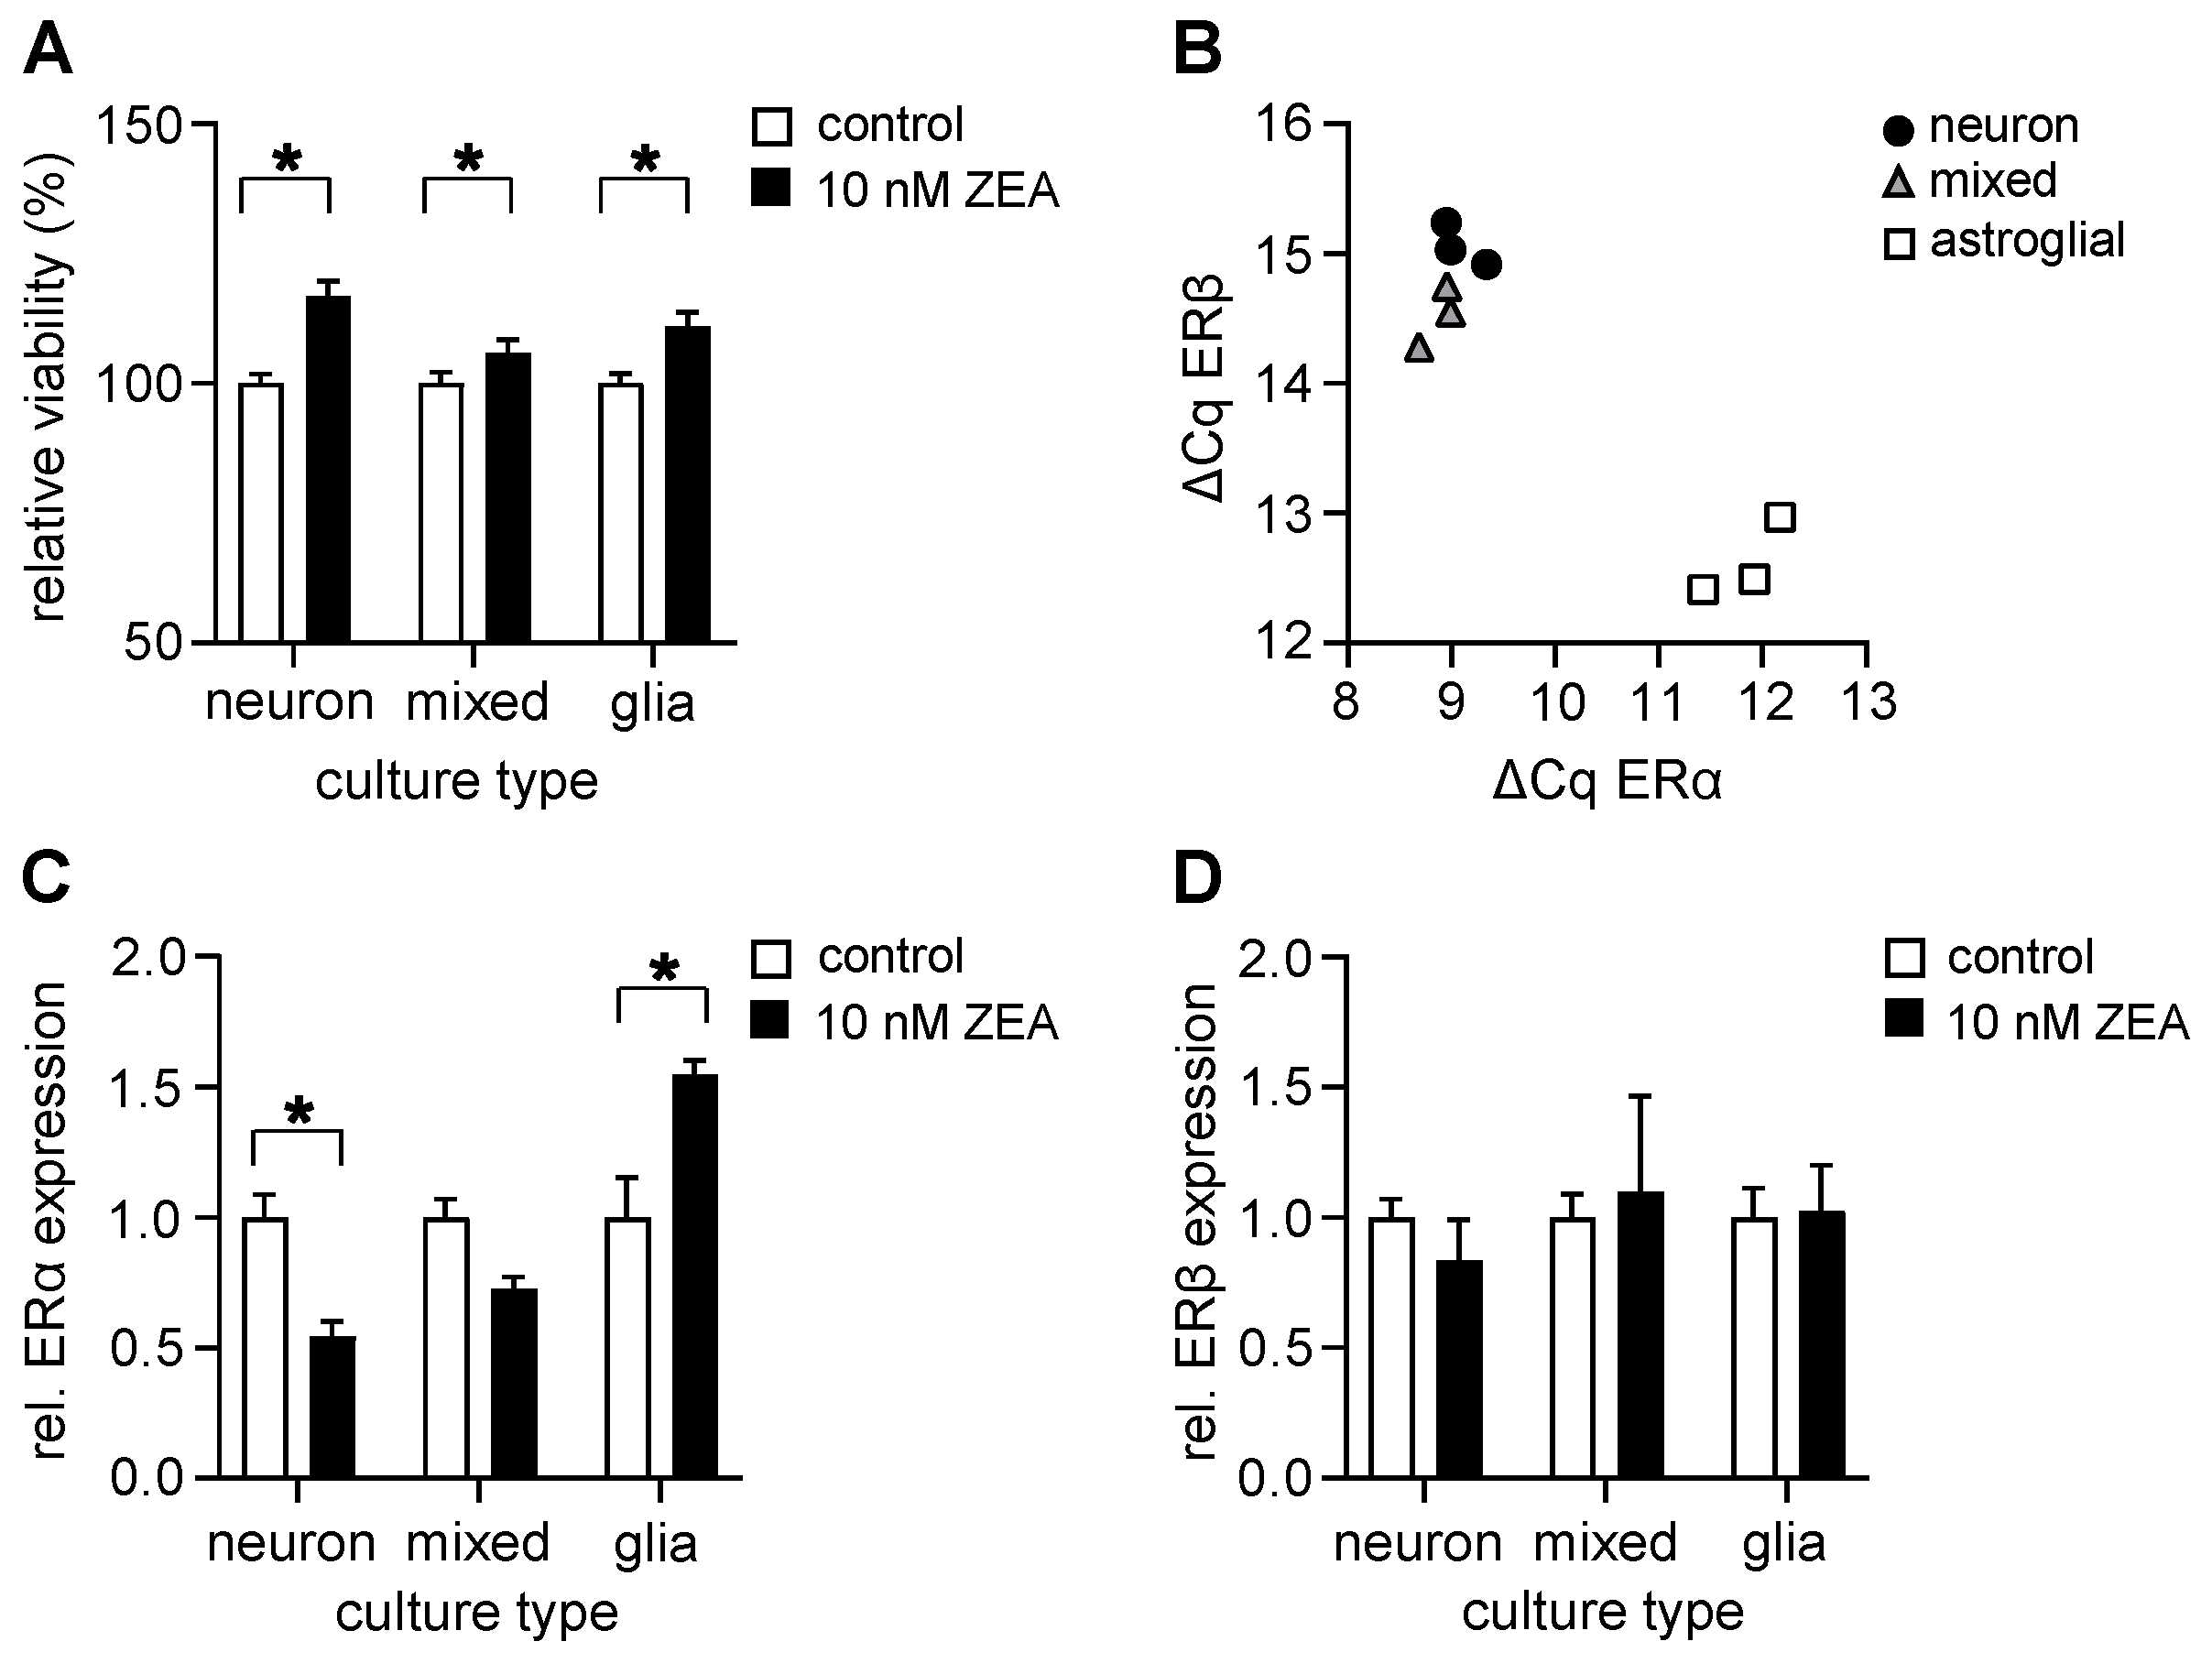
The physiologically relevant concentration of ZEA in brain tissue is predicted to be in the 1–10 nM range in rodents when feeding the animals with non-observed effect-level (NOEL) doses [46]. Former studies have also shown that ZEA is bioactive even at a low, 10 nM concentration in several cell-based systems [40,47,48,49]. This observation was confirmed via our preliminary screening, so detailed analyses were performed using only 10 nM of ZEA. According to our data, 48 h treatment with ZEA at 10 nM significantly increased the viability of each culture type (Figure 4A).
ZEA is known to be capable of binding to both the ERα and ERβ nuclear estrogen receptors of mammals, and already induces estrogenic responses at 1–10 nM concentrations [50,51], with higher Kd than estrogen (17β-estradiol, E2; [52]). Thus, dietary uptake of mycoestrogens may disrupt the natural signaling pathways of E2 [53]. Based on these former observations, the effect of ZEA on the expression of genes encoding nuclear estrogen receptors was also investigated in all three types of cultures. First, we examined the transcription rates of the ERα and ERβ genes, comparing them to the expression of housekeeping genes (mRPL13a and GAPDH). Analysis of the amplification curves (ΔCq) revealed that both types of estrogen receptors were expressed in both neurons and astroglia cells, but that their amount differed between culture types (Figure 4B). Astroglial cultures expressed similar amounts of ERα and ERβ receptors (Figure 4B). In cultures containing neurons, on the other hand, higher expressions of ERα and lower levels of ERβ were observed compared to astrocytes (the amplicon lengths were nearly the same, see Table A1).
To evaluate the effects of ZEA administration, we quantified the expression of ER mRNAs upon 48 h treatment with 10 nM of ZEA, normalized to the corresponding control ΔCq values. According to our data, the expression of ERα was decreased in pure and mixed neuronal cultures and increased in astroglial cultures (Figure 4C). ERβ expression, on the other hand, was not altered via ZEA treatment in either culture type (Figure 4D). As changes in the expression of ERs are generally linked to E2 pathway induction [54], the observed increase in cell viability after ZEA administration suggests that there are certain metabolic changes in action.

2.4. ZEA Does Not Affect the Number of Mitochondria in Astrocytes

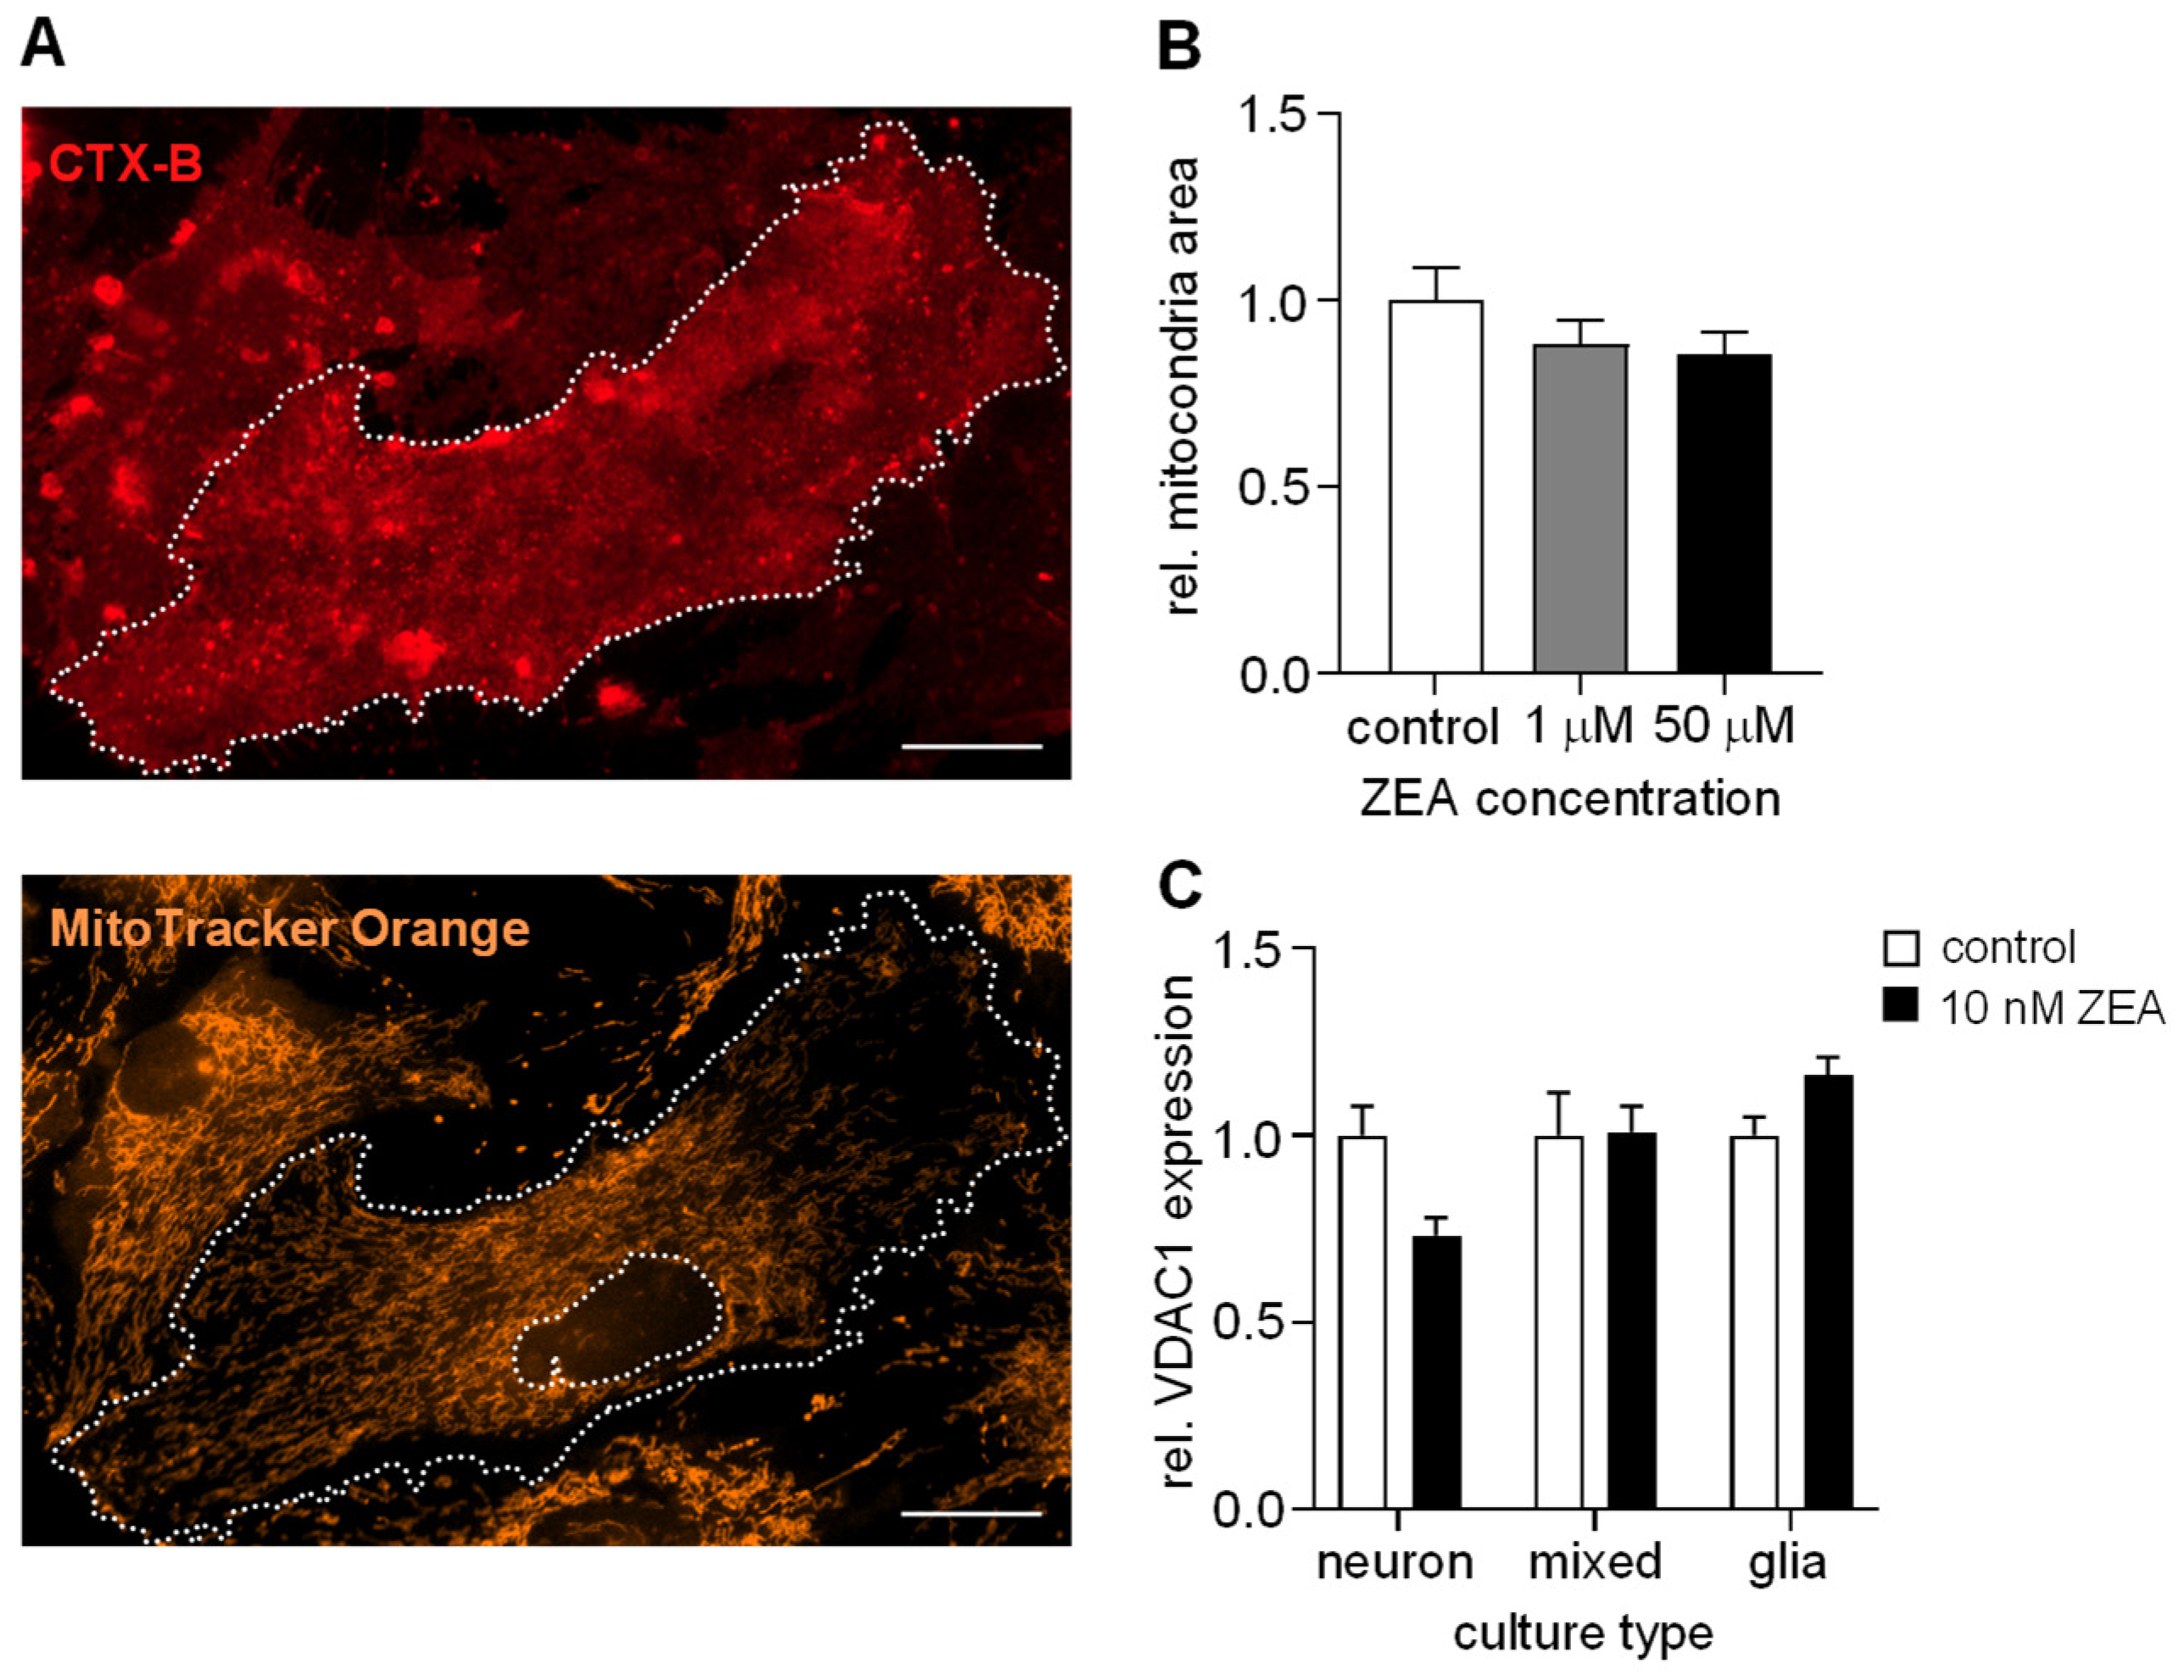
Estrogens are well known to influence mitochondrial activity under both normal physiological and pathological conditions, such as by controlling the transcriptional regulation of mitochondrial proteins, interacting with mitochondrial ER receptors, and stabilizing the activity and structural morphological integrity of the mitochondrial respiratory electron transport chain [55]. To decide whether the observed ZEA-mediated increase in cell viability is due to a change in mitochondrial function or volume, the extent of the mitochondrial network was estimated in the presence or in the absence of ZEA in astroglia cells (Figure 5A). To do so, the mitochondrial network was stained with MitoTracker Orange, and its area was normalized to the area of the cytoplasm. Our analyses did not reveal any significant differences in the mitochondrial area compared to the control cultures (Figure 5B).
For further analysis, we also compared the expression of the mitochondrial marker voltage-dependent anionic channel (VDAC1) via qRT-PCR. The relative expression of VDAC1 was compared to the expression of housekeeping genes (mRPL13a and GAPDH). As shown in Figure 5C, ZEA treatment did not substantially alter the expression of the VDAC1 gene. No changes were observed in mixed and astroglial cultures; however, in neuronal cultures, the expression of the VDAC1 gene was slightly but not significantly reduced.
Taken together, neither immunocytochemical evaluation nor mitochondrial marker gene expression assays were able to detect significant changes in the mitochondrial network in any of the investigated culture types after ZEA treatment. Thus, our results suggest that increased cell viability may be primarily due to other metabolic causes.

2.5. ZEA Alters Spontaneous Neuronal Activity in Mixed-Cell Cultures

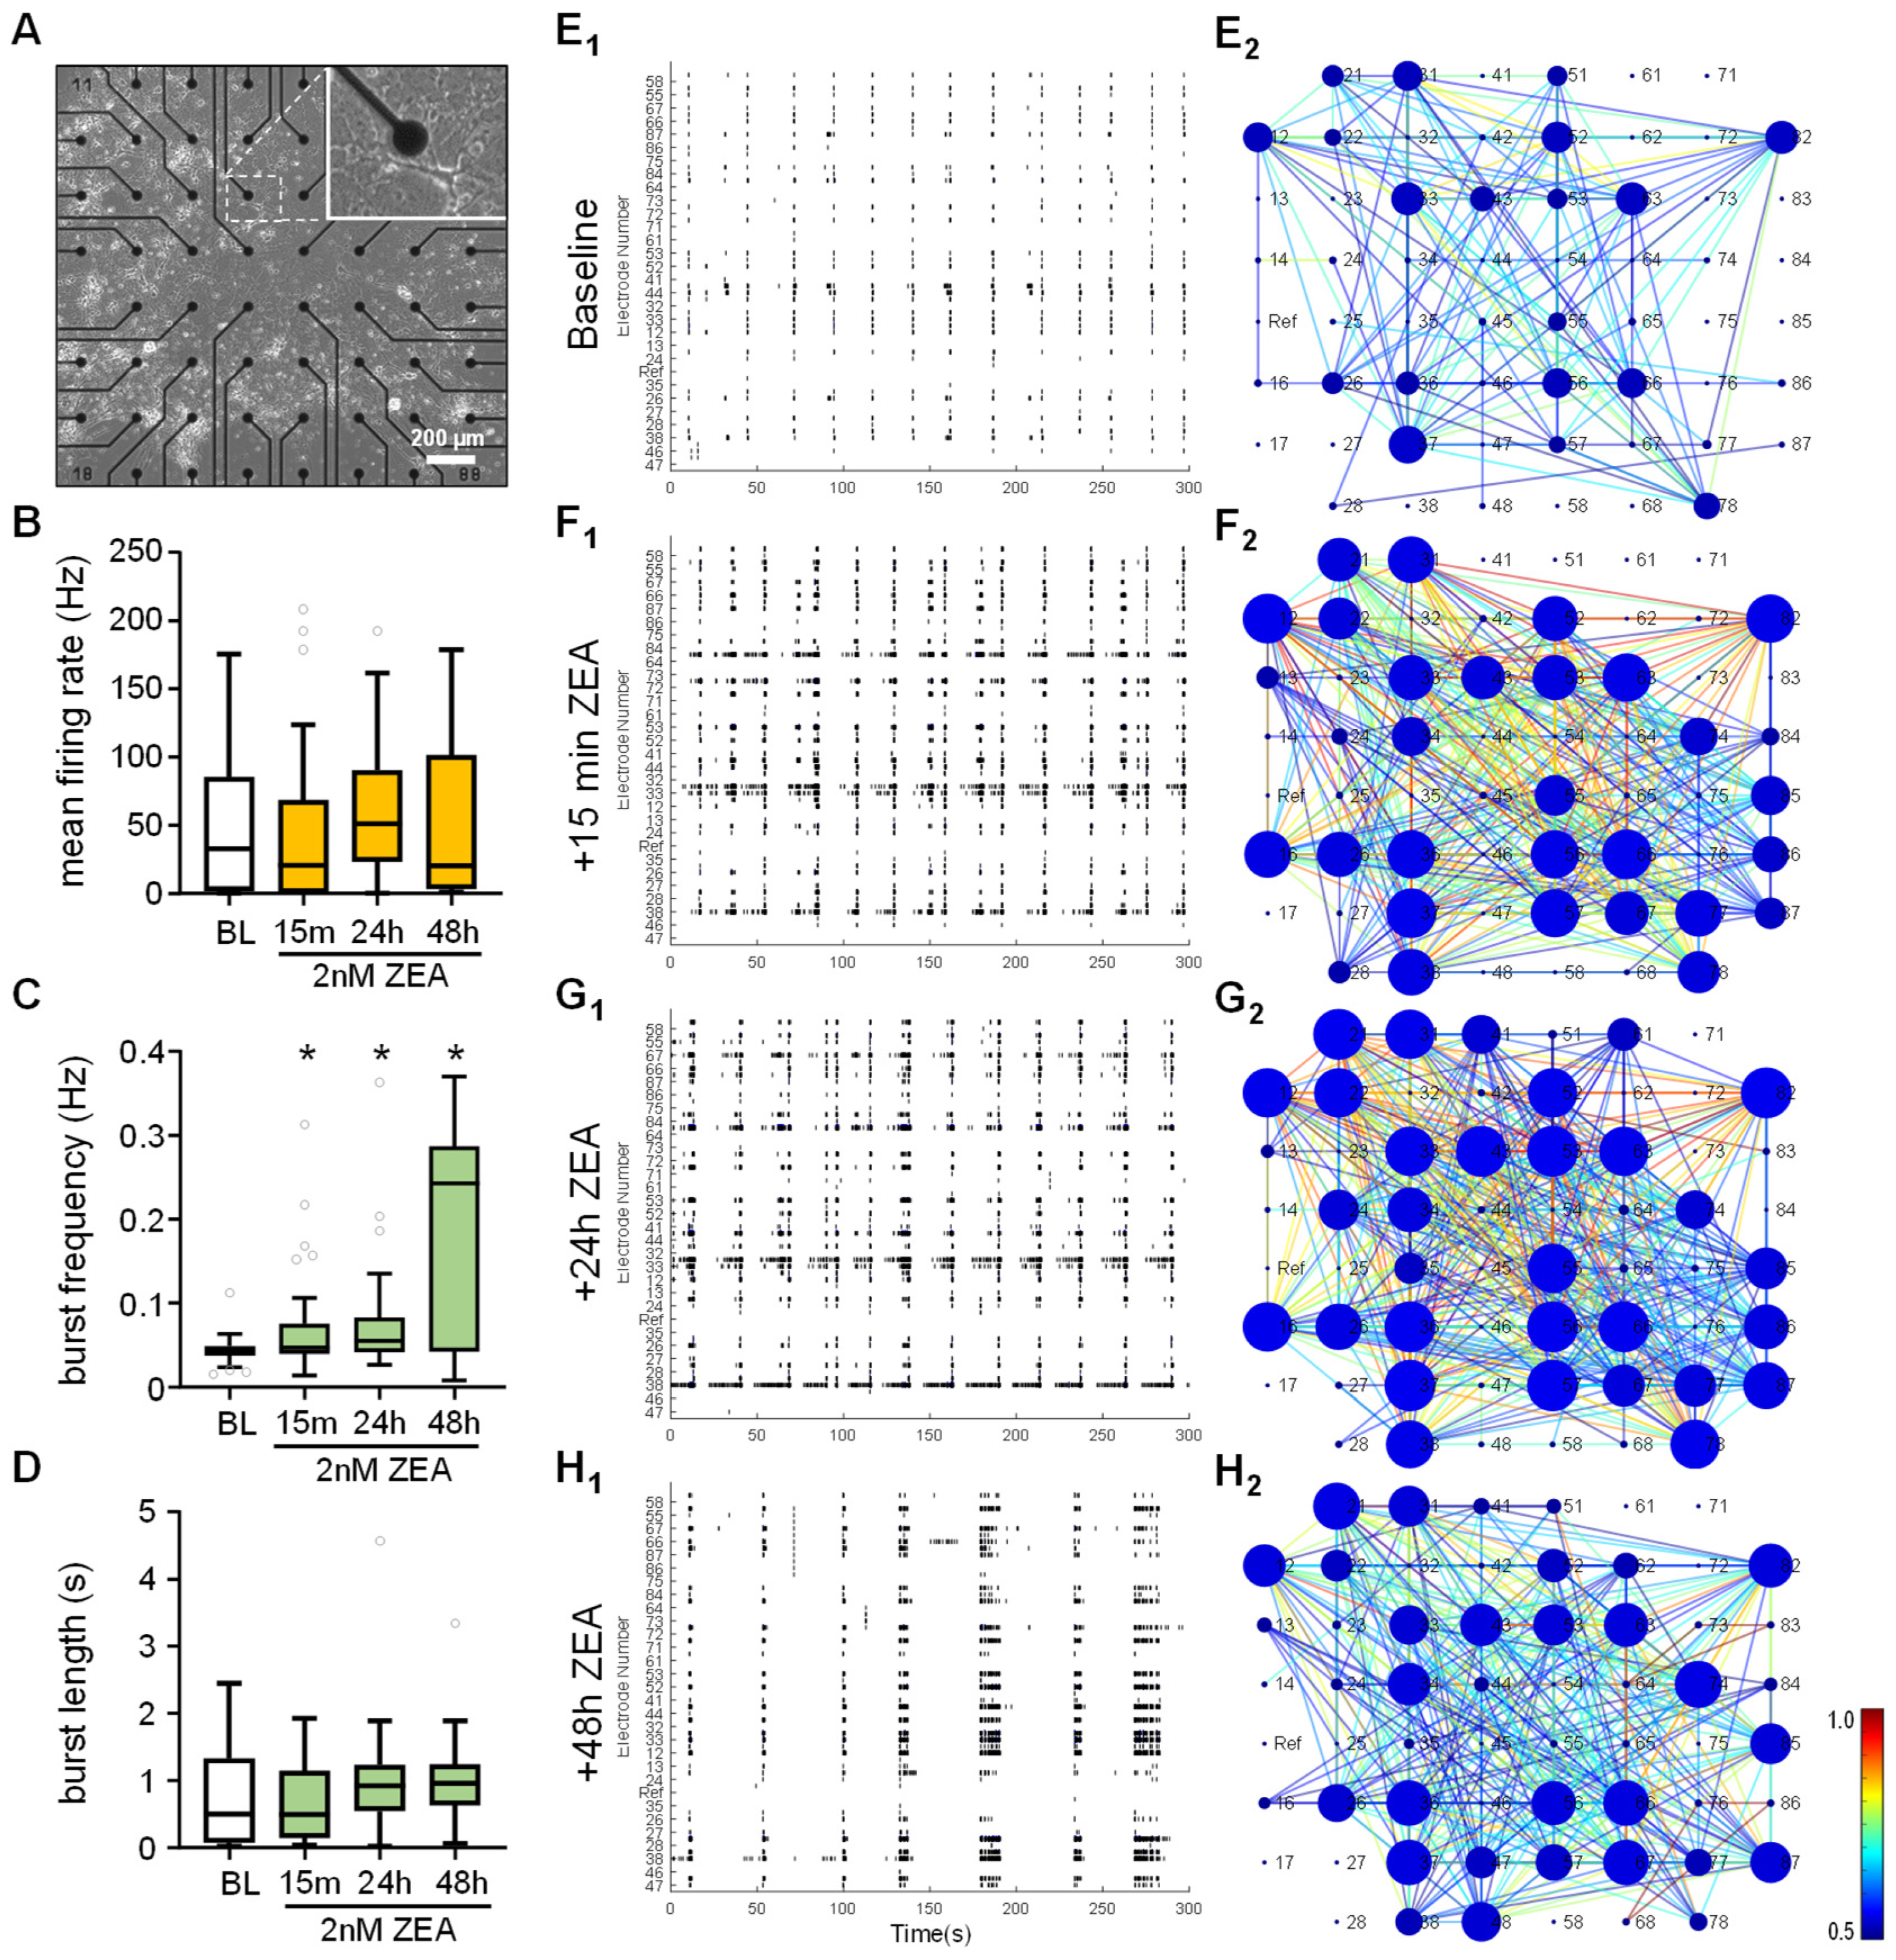
It is also known that estrogen can alter the firing activity of neurons [56]. To investigate whether the mycoestrogen ZEA has a similar effect on neuronal cultures, multi-electrode array (MEA) electrophysiology was performed to investigate the spontaneous electrical activity of neuronal cultures over time [57]. Dissociated neurons were cultivated on top of the electrode surfaces of MEA chips (Figure 6A). Following a baseline recording, 2 nM of ZEA was added to the cultures and spontaneous neuronal activity was monitored in a non-invasive way after 15 min and 24 or 48 h later, based on changes in local field potentials (LFPs; Figure 6B–F).
Primary neurons grown on MEA chips formed dense neural networks (Figure 6A) and exhibited repetitive and robust bursting activity (Figure 6E1), characterized by a high ratio of spikes appearing within the bursts (74.3 ± 5.0%, mean ± s.e.m, n = 48). ZEA treatment did not change the firing activity, so the mean frequency (Figure 6B) and the burst length parameters (Figure 6D) were unaffected upon ZEA treatment. The ratio of active electrodes remained similar throughout the recordings (baseline: 49.95%; +15 min ZEA: 41.45%; +24 h ZEA: 38.1%; +48 h ZEA: 31.3% and Figure 6E2–H2, where the blue circles over the given electrodes indicate the nodes of the cross-correlograms, with their diameter representing the total number of active connections within the network). The activity patterns were also characterized by the network level, with the firing coincidence calculated among the electrodes of the MEA60 chip (Figure 6E2–H2). Cross-correlation maps clearly showed that simultaneous firing became dominant after ZEA administration. Importantly, the pattern of spontaneous neuronal activity significantly changed as the burst frequency values significantly increased (Figure 6C). These effects were observed within 15 min of adding ZEA to the culture medium (Figure 6C,F1,F2), which was further enhanced by the longer survival. Importantly, small bursts concatenated into longer “superbursts”, which were predominant after 48h treatment (Figure 6H1). The ratio of spikes within bursts also slightly increased (81.0 ± 6.8%, mean ± s.e.m, n = 19), but this change was not significant. These data show that ZEA rapidly influences the spontaneous electrical activity and synchronization of neuronal networks.

3. Discussion

Mycotoxins produced by Fusarium spp. molds are worldwide pollutants of food and feed [1]. While most of them are known to have a wide range of biological effects, their neurotoxic potential and the underlying mechanisms of their toxicity are still not clear. The literature is contradictory regarding their toxic effects in the brain, primarily due to the diversity of in vivo and in vitro models used. In addition, certain species have different tolerance to these toxins [5,29]. In this study, we aimed to compare the effects of fumonisin B1, deoxynivalenol, and zearalenone on mouse primary cultures containing neurons and astrocytes in different amounts to characterize the primary cellular targets of the different mycotoxins. Moreover, in the case of ZEA, we also performed detailed analyses to clarify its mode of action in our in vitro system.

3.1. Effects of Fumonisin B1 on Neural Cultures

Previously, several studies have shown that FB1 has neuronal effects, as it evokes neurotoxicity, caused by oxidative stress or apoptosis [22] and alterations in myelin formation [20]. In contrast, Bódi et al. recently showed only a mild increase in neuronal intrinsic excitability in vitro, as only a high concentration (100 μM) of FB1 evoked a significant increase in the electrophysiological properties of either hippocampal cell cultures or brain slices. Moreover, changes in neuronal activity and excitability under in vivo conditions were not detected [58]. In addition, FB1 did not cause cell death in astroglia cultures within the 1 nM–50 μM concentration range used in our experiments, but slightly and significantly increased cell viability. This observation is in line with previous studies. For example, Kwon et al. showed that FB1 (0.5–75 µM) was not cytotoxic after 5 or 10 days of exposure in primary rat astro- and oligodendroglial cultures [59]. Similar results were obtained from differentiated primary rat astrocyte cells [60] or in a glioblastoma cell line [61]. On the other hand, incubation with 50 µM of FB1 for 8 days caused cell death in primary mouse astrocyte cultures [62].
In the case of neuronal and mixed cultures, FB1 also caused a small (<20%) but significant, dose-independent increase in cell viability at low concentrations (<10 µM). This is consistent with the findings of Harel et al., where primary rat hippocampal cultures did not show signs of cell death despite a 48 h application of FB1 at 10–40 µM concentrations [18]. Other reports also showed non-toxic effects on different culture types, even at higher (200 μM) concentrations [20,63,64]. Notably, FB1 was not toxic to human SH-SY5Y neuroblastoma cells at 200 µM after 24 h [64]; however, another study reported toxicity over 100 µM after 48 h [65].
In our pure neuronal cultures, however, 50 µM of FB1 drastically reduced cell viability. This effect was independent of the duration of treatment (24 vs. 48 h) and was not observed when astroglial cells were also present (mixed culture). In a recent study, Domijan et al. reported that besides modifying membranes and the induction of oxidative stress, FB1 can inhibit the mitochondrial transport chain I complex and deregulate calcium signaling [64]. They observed that FB1 administration (0.5–200 μM) significantly increases the level of glutathione (GSH) in astrocytes. As GSH is the major antioxidant in the CNS and astrocytes are the major source of GSH in the brain [66], the excreted GSH by astrocytes can reduce the oxidative stress in neurons [67]. Since FB1 is able to alter neuronal excitability [58] and increase glutamate-induced Ca++-response [58], it is feasible that the neuroprotective effect of glial cells is exerted via the regulation of glutamate levels [68]. In addition, other mechanisms such as neurotrophic factor release, the recycling of ascorbate to directly scavenge ROS, or even the release of glial exosomes are also quite conceivable [69,70].
Taken together, these results indicate that fumonisin B1 at higher concentrations is more cytotoxic to neurons, and that the presence of astrocytes can partially compensate for FB1-mediated neuronal toxicity.

3.2. Effects of Deoxynivalenol on Neural Cultures

Deoxynivalenol is one of the most abundant Fusarium mycotoxins. In the last two decades, several studies have indicated DON contamination in harvested cereals and animal feeds [71,72] and revealed exposures above the tolerable daily intake (TDI: 1 μg/bw kg) to DON in the German and Austrian populations [73,74], where the provisional daily intake (PDI) exceeded the TDI in 12% and 33% of the volunteers, respectively. As some effects triggered by DON can occur in vivo in the brain at concentrations close to the TDI [24], neurological damage is a valid risk. Former studies have shown that DON can reach neuronal tissues [23,75], and in concentrations exceeding 10 μM, it can reduce the integrity of the blood–brain barrier [76]. It is also known that DON decreases the brain protein levels and the activity of the antioxidant system and induces oxidative stress, apoptosis [33], and can cause neuroinflammation [30]. DON has also been reported to have neuroendocrine effects [29].
Based on our results obtained from primary neural cultures, DON acts in a cell type-specific manner. Cell viability was reduced in all three culture types in a concentration- and exposure time-dependent manner; however, astroglial cells were found to be the most sensitive to DON (cell viability was decreased above 0.2 μM concentrations in glial and above 1 μM doses in mixed and neuronal cultures). The sensitivity of glial cells is consistent with previous work, where DON was found to be cytotoxic in rat glia cell cultures in vitro within the 10–100 µM range [77]. In this study, DON also reduced the viability of astroglial cells: the IC50 dose calculated for the glial cells (31 μM) is comparable with our finding (24 μM). However, in this work, microglial cells were primarily the most sensitive population. Similar effects on the human astroglial cell line, STTG-1, were also demonstrated, but only at higher doses (>25 μM). In addition, DON has also been shown to inhibit the glutamate uptake of astrocytes, which is a key astroglial function [77].
The effect of DON on the viability of rodent neurons is, to our best knowledge, a new, unpublished scientific result. Recently, Wang et al. presented neuronal data on DON toxicity using piglet hippocampal cells and PC12 cell lines [78,79]. The piglet neurons were already sensitive to DON above 400 nM, which can be explained by the fact that swine are more susceptible to DON than mice or rats [29]. Apoptosis and neuroinflammation are the most feasible mechanisms behind the neurotoxicity of DON [77,78]. According to our data, DON also acts in a cell type-specific manner, and it is likely that the actual tissue concentration of DON determines its glial and/or neuronal effects.

3.3. Effects of Zearalenone on Neural Cultures

Little is known about the direct effects of short or continuous exposure to ZEA mycoestrogen on brain function and development. Former publications have shown that besides oxidative and DNA damage, apoptosis, or necrosis caused by ZEA, its main prominent action is mediated through the estrogenic signalization pathways [53]. Both types of nuclear estrogen receptors, ERα and ERβ, are expressed and play a vital role in neuronal development, and their expression is dynamically regulated during critical periods of cortical development [80]. Under physiological conditions, E2 is able to bind to the α-receptor with greater affinity [81], and E2-induced changes in the expression of estrogen-sensitive genes ultimately lead to the regulation of central nervous system development and neuronal differentiation and affect cell migration, viability and cell death, and synaptic plasticity [82].
In this study, expressions of both estrogen receptor mRNAs (ERα and ERβ) were detectable via RT-qPCR in all culture types. The expression of ERβ receptors was lower than ERα receptor levels in cultures containing neurons. There are limited data supporting the roles of ERα signaling in astroglial cells, including effects on morphology, proliferation, and reactive astrogliosis (reviewed in [83]). The astrocyte-specific knockout of aromatase results in impaired reactive astrogliosis and decreased activation of the JAK–STAT3 pathway after brain injury [84]. On the other hand, the reduction in the ERα level in neurons may be due to developmental immaturity, possibly protecting the brain from hormonal interference during early development. Similar observations are reported in the literature [85,86,87,88], with the note that the pattern of the mRNA expression and protein expression of these receptors is generally correlated [85]. In the adult brain, E2 has been shown to mostly reduce the expression of ERα mRNA [54]. Moreover, 10 nM of ZEA exhibited similar effects in neuronal cultures after 48 h of exposure. In contrast, in astroglial cultures, ZEA caused a significant increase in ERα expression. This is consistent with Frago et al., who reported that E2 increased the amount of ERα mRNA in astroglial cultures obtained from female rats [89]. Although in the study, E2 reduced the expression of ERβ in astroglial cells, as well, we did not detect a similar effect of ZEA treatment in mouse astroglial cultures.
In mixed cultures, no significant change in ER–receptor–mRNA levels was detected after ZEA treatment. Since the sex of the embryos and newborn pups used to establish the cell cultures was not determined due to technical limitations, further investigations are needed to investigate if ZEA exerts sex-dependent effects on neurons, similarly to E2. It should be noted that in other systems, e.g., using neuroblastoma cell lines or cerebellar granule cells, opposite effects were exhibited upon ZEA administration [42,90], further strengthening the cell type-specific action of ZEA.
Some studies investigated the direct toxic effects of ZEA on neural cell types [34,36,43,53]. In our in vitro assay, ZEA increased cell viability in all cell culture types, even at 10 nM. Theoretically, higher cell viability can be achieved via increased proliferation and/or metabolism. Neurons are non-dividing cells; thus, the potential proliferating effect can be excluded. It is also known that estrogens control the transcriptional regulation of mitochondrial proteins and influence mitochondrial activity under both physiological and pathological conditions via ERβ receptors by, e.g., affecting the activity of the mitochondrial respiratory electron transport chain, reducing ROS production, balancing the expression of fusion and fission proteins, or changing the structure of the mitochondrial network [55]. According to our results, ZEA-dependent changes in the extent of the mitochondrial network (determined by the relative area or VDAC1 expression) were not detected. Alternatively, exposure to ZEA can interfere with the oxidoreductive metabolism of mitochondria, and may affect the reductive capacity of the cells by increasing the SOD and GSH levels [36,40,91]. On the other hand, in neuroblastoma cell lines, ZEA induced oxidative stress and reduced cell viability [34] only in 1000× higher, presumably non-physiological concentrations [46,92].
Importantly, the effects of ZEA on neuronal activity and network firing patterns are a new finding. The generally observed burst firing in our cultures is driven by excitatory network episodes due to the dense glutamatergic connections among the cells [93]. ZEA has a strong potentiating effect by increasing the frequency of bursts, but it does not influence the overall firing rate. Besides the individual cell activities, ZEA rapidly promotes spontaneous network burst activity and network synchronization, even after 15 min administration. It also induces the formation of highly synchronized “superbursts”. This phenomenon resembles the effects of estrogen on neuronal cultures, where burst activity has been shown to be more apparent in the presence of estrogen [94].

4. Conclusions

Our results strengthen the cell type-specific effects of Fusarium toxins on the nervous system. The data obtained from cell cultures with different neuronal and/or astroglial compositions support the importance of identifying the cellular targets of in vivo mycotoxin exposure.

5. Materials and Methods

5.1. Animal Handling

CD1 wild-type mice were purchased from Charles River Laboratories (Wilmington, MA, USA; organism: RRID:IMSR_CRL:22). Mice were housed at 22 ± 1 °C, with 12 h light/dark cycles and ad libitum access to food and water. Experiments were carried out in accordance with the Hungarian Act of Animal Care and Experimentation (1998, XXVIII) and with the directive 2010/63/EU of the European Parliament and of the Council of 22 September 2010 on the protection of animals used for scientific purposes [95]. Experimental protocols were approved by the Animal Care and Use Committee of Eötvös Loránd University and the National Food Chain Safety Office. Sacrificing the animals to obtain brain tissue and prepare primary neuronal cultures is regarded as organ donation. All possible efforts were made to minimize the number of animals used.

5.2. Drug Preparation

Fumonisin B1 (FB1, Tocris Bioscience, UK), deoxynivalenol (DON, Tocris Bioscience, UK), and zearalenone (ZEA, Tocris Bioscience, UK) were dissolved in 10% DMSO (FB1), 10% ethanol (DON), or in 10% ethanol–50% DMSO (ZEA), respectively. Cells were treated with mycotoxins in a 1 nM to 50 μM concentration range, for 24 or 48 h. Control wells were treated with the correspondent solvent.

5.3. Preparation of Cell Cultures

The experiments were performed on mixed (where both neurons and astroglia cells were present) and on pure neuronal or astroglial primary cultures. Primary cultures of embryonic cortical neurons were prepared from pregnant CD1 mice on embryonic days 14–15, according to Tárnok et al.,2008 [96]. As sex-selective grouping of embryos from that age is technically challenging [97,98] and would expand the cell isolation time enormously, the sex of the embryos/pups used for the preparation of the cell cultures was not determined. Briefly, under aseptic conditions, cortices were isolated, cleaned from meninges, and incubated in 0.05% trypsin-EDTA solution (Gibco, Thermo Scientific, Hungary) for 15 min at 37 °C. After a brief centrifugation step, cells were triturated in NeuroBasal media (Gibco, Thermo Scientific) supplemented with 2% B27 (Gibco, Thermo Scientific, Hungary), 5% FCS (PAN-Biotech, Germany), 0.5 mM of Glutamax (Gibco, Thermo Scientific, Hungary), 40 μg/mL of gentamycin (Hungaropharma Ltd., Hungary), and 2.5 μg/mL of amphotericin B (Sigma-Aldrich-Merck, Hungary), and filtered through a sterile polyester mesh with a 42 μm pore size (EmTek Ltd., Hungary). Cells were seeded onto poly-L-lysine (PLL; Sigma-Aldrich-Merck, Hungary)-coated 96-well plates (Greiner Bio-One, Hungary) at 8 × 10⁴ cells/well density. For microscopy, 1.5 × 10⁵ cortical neurons were seeded onto poly-L-lysine–laminin (1 μg/cm2 Sigma-Aldrich-Merck, Hungary)-coated glass coverslips in 24-well plates. Cells were cultivated at 37 °C in a 5% CO2/95% air atmosphere. Neurons were cultured in Neurobasal medium (Thermo Scientific, Hungary), supplemented with 2% B27 (Thermo Scientific, Hungary), 0.5 mM of Glutamax (Gibco, Thermo Scientific, Hungary), 40 μg/mL of gentamycin (Hungaropharma Ltd., Hungary), and 2.5 μg/mL of amphotericin B (Sigma-Aldrich-Merck, Hungary). Then, 5% FCS (PAN-Biotech, Germany) was included in the culture medium until DIV1 (pure neuronal cultures) or DIV4 (mixed neuronal–glial cultures). Complete and partial (1:2) medium changes were performed on DIV1 and DIV4, respectively. Pure neuronal cultures were treated with cytosin–arabinofuranoside (CAR, 10 μM; Sigma-Aldrich-Merck, Hungary) 24 h after plating to prevent the further division of non-neuronal cells. In the case of mixed cultures, cells were treated with 10 μM CAR only on the 6th day after plating. Mycotoxin treatments were performed on the 7–8th day of cultivation (see further details in the text).
The primary cultures of astrocytes were prepared from 1 to 4 day-old CD1 mice, according to Tárnok et al., 2010 [99]. Briefly, cerebral cortices were isolated, freed from meninges, and incubated in trypsin-EDTA [0.5 mg/mL in phosphate-buffered saline (PBS) pH = 7.4, Gibco, Thermo Scientific, Hungary] and 5 mg/mL of DNase solution (Sigma-Aldrich-Merck, Hungary) for 15 min at 37 °C. After brief centrifugation, cells were triturated in high-glucose Dulbecco’s Modified Eagle Medium (HDMEM, Sigma-Aldrich-Merck, Hungary) supplemented with 10% fetal calf serum (FCS, PAN-Biotech, Germany), 40 μg/mL of gentamycin, and 2.5 μg/mL of amphotericin B (all from Sigma-Aldrich-Merck, Hungary), and filtered through a sterile polyester mesh with a 42 μm pore size (EmTek Ltd., Hungary). The cell number was determined via trypan blue exclusion. Cells were seeded onto poly-L-lysine-coated Petri dishes at 3–4 × 10⁵ cells/cm2 density in DMEM containing 10% FCS, 2 mM of L-glutamine, 2.5 μg/mL of amphotericin B, and 40 μg/mL of gentamycin. Cells were cultivated at 37 °C in a 5% CO2/95% air atmosphere. Astroglial cultures were used for further experiments after reaching confluency (7–8 days in vitro). For the experiments, cells were reseeded into poly-L-lysine-coated 96-well plates or onto 12 mm-diameter coverslips in 24-well plates in a 2.5 × 10⁴ cells/cm2 density.

5.4. Cell Viability Assay

The viability of the cultures was measured 24 h or 48 h after mycotoxin treatment via MTT assay, as described by Tárnok et al., 2008 [96]. Briefly, cells grown in 96-well plates were treated with 3-(4,5-dimethylthiazol-2-yl)-2,5-diphenyltetrazolium bromide (MTT, Sigma-Aldrich-Merck, Hungary) at a final concentration of 200 μg/mL. After 35–40 min incubation, cells and formazan crystals were dissolved in acidic (0.08 M HCl) isopropanol (Sigma-Aldrich-Merck, Hungary). Optical density was determined at a measuring wavelength of 570 nm against 630 nm as a reference with a Multiskan EX ELISA reader (Thermo Scientific, Hungary). Assays were carried out on at least 6 parallel wells of 3 independent cultures. Viability data were determined as averages and standard errors of the mean and were expressed as a percentage of the control cultures. Data were compared using Student’s t-test (p < 0.05).

5.5. Immunocytochemistry and Microscopic Analysis

Cells grown on 12 mm-diameter coverslips in 24-well plates were fixed with 4% paraformaldehyde (TAAB Laboratories Equipment Ltd., UK; w/v in PBS), permeabilized with 0.1% Triton-X-100 in phosphate-buffered saline, and blocked in 2% bovine serum albumin in phosphate-buffered saline.
To detect the different cell types in neural cultures, cells were immunostained using anti-IIIβ-tubulin (mouse, 1:1000; EXBIO, Czech Republic), anti-GFAP (chicken, 1:1000, Synaptic Systems, Germany), and anti-Iba1 (goat, 1:500, Novusbio, Bio-Techne, Hungary) antibodies overnight at 4 °C. Anti-mouse Alexa Fluor-DyLight594 (Vector Laboratories, UK), anti-chicken Alexa Fluor-647 (Invitrogen, Thermo Scientific, Hungary), and anti-goat Alexa Fluor-488 (Invitrogen, Thermo Scientific, Hungary) were applied in a 1:500 dilution for 1h at RT. Preparations were mounted with bis-benzimide (Sigma, Hungary)-containing Mowiol 4.88 (for nuclei labeling, Polysciences, Germany).
To stain the mitochondria of astroglia cells, 10 nM of MitoTracker Orange (Thermo Scientific, Hungary) was applied at 37 °C for 25 min before fixing (in the presence or absence of ZEA). After the fixation, cell membranes were labeled using Cholera Toxin B-Alexa647 (50 μg/mL, Invitrogen, Thermo Scientific, Hungary) for 30 min at RT. Preparations were mounted with bis-benzimide-containing Mowiol 4.88 (for nuclei labeling, Polysciences, Germany).
Microscopic images were acquired with an inverted AxioObserver Z1 wide-field fluorescent microscope (Zeiss, Hungary) with a LD Plan Neofluar 20×/0.4 NA (Zeiss, Hungary) or an α-PlanApoChromat 63×/1.46 NA oil immersion objective (Zeiss, Hungary) using Colibri-LED illumination and the appropriate filter sets. Images from sister cultures for the same experiment were recorded with identical microscope settings and analyzed in the same way.
Mitochondrial area was determined in projected z-stack images of astrocytes taken at 63× magnification. Cholera Toxin B and DAPI staining was used to delineate the cell shape and nucleus, respectively, using ImageJ/Fiji 1.54p software [100]. MitoTracker Orange-positive objects within the cytoplasm were separated from the background via intensity thresholding, and their total area was determined to calculate the (total mitochondrial area)/(cytoplasmic area) ratio.

5.6. Quantitative Real-Time PCR (qRT-PCR)

Cultures were lysed and RNA samples were obtained using Quick-RNA MiniPrep (ZYMO Research, Hungary). Reverse transcription was performed with the Maxima First Strand cDNA Synthesis for the RT-qPCR kit (Thermo Scientific, Hungary), according to the manufacturer’s instruction. Messenger RNA expression was investigated using the Maxima SYBR qPCR Master Mix (Thermo Scientific, Hungary) with specific primers (see Table A1, in the Appendix A). The qPCR run was performed using a CFX96 (C1000 Touch) from Bio-Rad Laboratories (USA) with the following settings: 1 cycle at 95 °C for 10min, 40 cycles at 95 °C for 15 s followed by 55 °C for 30 s, and 72 °C for 30 s. Cq and RFU values were obtained from Bio-Rad CFX Manager v3.0 software (Bio-Rad, USA). The relative expression of the interested genes was calculated using the ΔΔCq method and triplicated samples.

5.7. MEA Recordings and Analysis

In MEA experiments, cells were seeded onto MEA60-4Well-PT (Qwane Biosciences, Switzerland), 60ThinMEA 100/10 ITO (Multichannel Systems, Germany), or 60MEA 200/30 ITO (Multichannel Systems, Germany) multi-electrode chambers at 4 × 10⁴ (MEA60-4Well-PT) or 4–5 × 10⁵ (60ThinMEA 100/10 ITO and 60MEA 200/30 ITO) cells/well densities. Prior to seeding the cells, the surface of the multi-electrode arrays was coated with poly-L-lysine (2 µg/cm2, Sigma-Aldrich-Merck, Hungary) and laminin (4.2 µg/cm2, Sigma-Aldrich-Merck, Hungary).
Spontaneous extracellular field potentials were recorded at 37 °C (Temperature Controller TC01102, Multichannel Systems, Germany) using a USB-1060 INV Microelectrode array System (Multichannel Systems, Germany) with a MEA Amplifier with a Blanking Circuit (Multichannel Systems, Germany) amplifier at a sampling rate of 20 kHz/channel. Signals were high-pass filtered at 300 Hz and low-pass filtered at 3000 Hz with a Butterworth 2nd-order filter. Spontaneous firing was recorded for 10 min before the addition of the toxins (baseline) and repeated after the toxin treatment for another 10 min. Recorded spikes were detected via a threshold crossing method (Thr.%: −1.1) and were sorted via the k means algorithm. The Thr.% shows the threshold value in A/D counts and the associated voltage that was used to collect the waveforms. The spike timestamps were extracted using the Plexon Offline Sorter (Plexon Inc., TX, USA). Analysis of the spike timestamps, including characterizing spontaneous firing and burst activity, was performed by the NeuroExpress software (https://www.researchgate.net/publication/338623194_NeuroExpress_program_for_analyzing_patch-clamp_data, accessed on 10 June 2025). Network activity graphs were created using MEAnalyzer [101] software, with a 0.5 cross-correlation threshold.

5.8. Statistics

For the statistical evaluation of pairs of data sets, Student’s t-tests (paired or independent, in case of normal distribution of data) or non-parametric Mann–Whitney tests (in case of non-normal distribution of data) were used. Statistics were calculated using SPSS Statistics v29 (IBM, USA). A p-value equal to or smaller than 0.05 was considered statistically significant. The number of independent experiments (n) is indicated in the figure legends.

Author Contributions

Conceptualization, K.S. and K.T.; Methodology, K.T.; Validation, V.S., B.T.-M. and A.R.; Formal analysis, V.S., B.T.-M., A.R. and K.T.; Investigation, V.S., B.T.-M., A.R. and K.T.; Writing—original draft, V.S., K.S. and K.T.; writing—review and editing, K.S., N.B. and K.T.; Visualization, V.S. and A.R.; Supervision, K.S. and K.T.; Project administration, N.B. and K.T.; Funding acquisition, K.S. and N.B. All authors have read and agreed to the published version of the manuscript.

Funding

This work is supported by grants from the National Research, Development and Innovation Office (PD137855 to N.B., NVKP_16-1-2016-0016, VEKOP-2.3.3-15-2016-00007) and the National Brain Research Program (2017-1.2.1-NKP-2017-00002). Supported by the University Excellence Fund of Eötvös Loránd University, Budapest, Hungary (ELTE, 2024-11-14/176).

Institutional Review Board Statement

According to the Hungarian and European Union Animal welfare legislation (in accordance with the Hungarian Act of Animal Care and Experimentation (1998, XXVIII) and with the directive 2010/63/EU of the European Parliament and of the Council of 22 September 2010 on the protection of animals used for scientific purposes), sacrifying the animals to obtain brain tissue and prepare primary neuronal cultures is regarded as "organ donation", therefore it is not necessary to obtain individual ethical approvals.

Informed Consent Statement

Not applicable.

Data Availability Statement

The data presented in this study are available in this article.

Acknowledgments

The authors thank Attila Szűcs for their critical reading and suggestions.

Conflicts of Interest

The authors declare no conflicts of interest.

Abbreviations

The following abbreviations are used in this manuscript:
FB1Fumonisin B1
DONDeoxynivalenol
ZEAZearalenon
EREstrogen receptor
MEAMulti-electrode array

Appendix A

Table A1. Primer sets used in qRT-PCR analysis. The designed primer pairs recognize all transcriptional variants.
Gene of InterestPrimerSequenceProduct Length (bp)
Mus musculus estrogen receptor 1 (alpha) (Esr1) (NM_007956.5)ForwardATTATGGGGTCTGGTCCTGC187
ReverseTCTTTCCGTATGCCGCCTTT
Mus musculus estrogen receptor 2 (beta) (Esr2) (NM_207707.1)ForwardCATTACGGTGTCTGGTCCTGT189
ReverseTTCTCTCCTGGATCCACACTTG
Mus musculus ribosomal protein L13A (Rpl13a) (NM_207707.1)ForwardAGGGGCAGGTTCTGGTATTG191
ReverseGGGGTTGGTATTCATCCGCT
Mus musculus voltage-dependent anion channel 1 (Vdac1)(NM_001362693.1)ForwardGGCTACGGCTTTGGCTTAAT199
ReverseCAGTGATCTCAGTGCCCAGG
Mus musculus GAPDH (NM_008084.3)ForwardTGGTGAAGGTCGGTGTGAAC106
ReverseATGAAGGGGTCGTTGATGGC

References

  1. Marin, S.; Ramos, A.J.; Cano-Sancho, G.; Sanchis, V. Mycotoxins: Occurrence, Toxicology, and Exposure Assessment. Food Chem. Toxicol. 2013, 60, 218–237. [Google Scholar] [CrossRef] [PubMed]
  2. Farkas, J.; Beczner, J.; Mohácsi-Farkas, C. Potential Impact of the Climate Change on the Risk of Mycotoxin Contamination of Agricultural Products in Southeast Central Europe A Mini-Review. Acta Univ. Sapientiae Aliment. 2011, 4, 89–96. [Google Scholar]
  3. Gelderblom, W.C.A.; Abel, S.; Smuts, C.M.; Marnewick, J.; Marasas, W.F.O.; Lemmer, E.R.; Ramljak, D. Fumonisin-Induced Hepatocarcinogenesis: Mechanisms Related to Cancer Initiation and Promotion. Environ. Health Perspect. 2001, 109, 291–300. [Google Scholar] [CrossRef] [PubMed]
  4. Stockmann-Juvala, H.; Savolainen, K. A Review of the Toxic Effects and Mechanisms of Action of Fumonisin B 1. Hum. Exp. Toxicol. 2008, 27, 799–809. [Google Scholar] [CrossRef] [PubMed]
  5. Pestka, J.J. Deoxynivalenol: Toxicity, Mechanisms and Animal Health Risks. Anim. Feed Sci. Technol. 2007, 137, 283–298. [Google Scholar] [CrossRef]
  6. Pestka, J.J. Deoxynivalenol: Mechanisms of Action, Human Exposure, and Toxicological Relevance. Arch. Toxicol. 2010, 84, 663–679. [Google Scholar] [CrossRef] [PubMed]
  7. Mishra, S.; Dwivedi, P.D.; Pandey, H.P.; Das, M. Role of Oxidative Stress in Deoxynivalenol Induced Toxicity. Food Chem. Toxicol. 2014, 72, 20–29. [Google Scholar] [CrossRef] [PubMed]
  8. Yu, M.; Chen, L.; Peng, Z.; Wang, D.; Song, Y.; Wang, H.; Yao, P.; Yan, H.; Nüssler, A.K.; Liu, L.; et al. Embryotoxicity Caused by DON-Induced Oxidative Stress Mediated by Nrf2/HO-1 Pathway. Toxins 2017, 9, 188. [Google Scholar] [CrossRef] [PubMed]
  9. Zinedine, A.; Soriano, J.M.; Moltó, J.C.; Mañes, J. Review on the Toxicity, Occurrence, Metabolism, Detoxification, Regulations and Intake of Zearalenone: An Oestrogenic Mycotoxin. Food Chem. Toxicol. 2007, 45, 1–18. [Google Scholar] [CrossRef] [PubMed]
  10. Fu, W.; Dai, C.; Ma, Z.; Li, Q.; Lan, D.; Sun, C.; Wu, X.; Li, J.; Wang, S. Enhanced Glutathione Production Protects against Zearalenone-Induced Oxidative Stress and Ferroptosis in Female Reproductive System. Food Chem. Toxicol. 2024, 185, 114462. [Google Scholar] [CrossRef] [PubMed]
  11. Cheng, Q.; Jiang, S.; Huang, L.; Wang, Y.; Yang, W. Zearalenone Exposure Affects the Keap1–Nrf2 Signaling Pathway and Glucose Nutrient Absorption Related Genes of Porcine Jejunal Epithelial Cells. Toxins 2022, 14, 793. [Google Scholar] [CrossRef] [PubMed]
  12. Rajendran, P.; Ben Ammar, R.; Al-Saeedi, F.J.; Mohamed, M.E.; Elnaggar, M.A.; Al-Ramadan, S.Y.; Bekhet, G.M.; Soliman, A.M. Kaempferol Inhibits Zearalenone-Induced Oxidative Stress and Apoptosis via the Pi3k/Akt-Mediated Nrf2 Signaling Pathway: In Vitro and in Vivo Studies. Int. J. Mol. Sci. 2021, 22, 217. [Google Scholar] [CrossRef] [PubMed]
  13. Wu, F.; Wang, F.; Tang, Z.; Yang, X.; Liu, Y.; Zhao, M.; Liu, S.; Han, S.; Zhang, Z.; Chen, B. Quercetagetin Alleviates Zearalenone-Induced Liver Injury in Rabbits through Keap1/Nrf2/ARE Signaling Pathway. Front. Pharmacol. 2023, 14, 1271384. [Google Scholar] [CrossRef] [PubMed]
  14. Takemura, H.; Shim, J.Y.; Sayama, K.; Tsubura, A.; Zhu, B.T.; Shimoi, K. Characterization of the Estrogenic Activities of Zearalenone and Zeranol in Vivo and in Vitro. J. Steroid Biochem. Mol. Biol. 2007, 103, 170–177. [Google Scholar] [CrossRef] [PubMed]
  15. Ropejko, K.; Twarużek, M. Zearalenone and Its Metabolites-General Overview, Occurrence, and Toxicity. Toxins 2021, 13, 35. [Google Scholar] [CrossRef] [PubMed]
  16. Domijan, A.M. Fumonisin B1: A Neurotoxic Mycotoxin. Arh. Hig. Rada Toksikol. 2012, 63, 531–544. [Google Scholar] [CrossRef] [PubMed]
  17. Missmer, S.A.; Suarez, L.; Felkner, M.; Wang, E.; Merrill, A.H.; Rothman, K.J.; Hendricks, K.A. Exposure to Fumonisins and the Occurence of Neutral Tube Defects along the Texas-Mexico Border. Environ. Health Perspect. 2006, 114, 237–241. [Google Scholar] [CrossRef] [PubMed]
  18. Harel, R.; Futerman, A.H. Inhibition of Sphingolipid Synthesis Affects Axonal Outgrowth in Cultured Hippocampal Neurons. J. Biol. Chem. 1993, 268, 14476–14481. [Google Scholar] [CrossRef] [PubMed]
  19. Furuya, S.; Ono, K.; Hirabayashi, Y. Sphingolipid Biosynthesis Is Necessary for Dendrite Growth and Survival of Cerebellar Purkinje Cells in Culture. J. Neurochem. 1995, 65, 1551–1561. [Google Scholar] [CrossRef] [PubMed]
  20. Monnet-Tschudi, F.; Zurich, M.G.; Sorg, O.; Matthieu, J.M.; Honegger, P.; Schilter, B. The Naturally Occurring Food Mycotoxin Fumonisin B1 Impairs Myelin Formation in Aggregating Brain Cell Culture. Neurotoxicology 1999, 20, 41–48. [Google Scholar] [PubMed]
  21. Soriano, J.M.; González, L.; Catalá, A.I. Mechanism of Action of Sphingolipids and Their Metabolites in the Toxicity of Fumonisin B1. Prog. Lipid Res. 2005, 44, 345–356. [Google Scholar] [CrossRef] [PubMed]
  22. Doi, K.; Uetsuka, K. Mechanisms of Mycotoxin-Induced Neurotoxicity through Oxidative Stress-Associated Pathways. Int. J. Mol. Sci. 2011, 12, 5213–5237. [Google Scholar] [CrossRef] [PubMed]
  23. Pestka, J.J.; Islam, Z.; Amuzie, C.J. Immunochemical Assessment of Deoxynivalenol Tissue Distribution Following Oral Exposure in the Mouse. Toxicol. Lett. 2008, 178, 83–87. [Google Scholar] [CrossRef] [PubMed]
  24. Maresca, M. From the Gut to the Brain: Journey and Pathophysiological Effects of the Food-Associated Trichothecene Mycotoxin Deoxynivalenol. Toxins 2013, 5, 784–820. [Google Scholar] [CrossRef] [PubMed]
  25. Sun, Y.; Jiang, J.; Mu, P.; Lin, R.; Wen, J.; Deng, Y. Toxicokinetics and Metabolism of Deoxynivalenol in Animals and Humans. Arch. Toxicol. 2022, 96, 2639–2654. [Google Scholar] [CrossRef] [PubMed]
  26. Csikós, V.; Varró, P.; Bódi, V.; Oláh, S.; Világi, I.; Dobolyi, A. The Mycotoxin Deoxynivalenol Activates GABAergic Neurons in the Reward System and Inhibits Feeding and Maternal Behaviours. Arch. Toxicol. 2020, 94, 3297–3313. [Google Scholar] [CrossRef] [PubMed]
  27. Sobrova, P.; Adam, V.; Vasatkova, A.; Beklova, M.; Zeman, L.; Kizek, R. Deoxynivalenol and Its Toxicity. Interdiscip. Toxicol. 2010, 3, 94–99. [Google Scholar] [CrossRef] [PubMed]
  28. Prelusky, D.B.; Yeung, J.M.; Thompson, B.K.; Trenholm, H.L. Effect of Deoxynivalenol on Neurotransmitters in Discrete Regions of Swine Brain. Arch. Environ. Contam. Toxicol. 1992, 22, 36–40. [Google Scholar] [CrossRef] [PubMed]
  29. Rotter, B.A.; Prelusky, D.B.; Pestka, J.J. Invited Review: Toxicology of Deoxynivalenol (Vomitoxin). J. Toxicol. Environ. Health 1996, 48, 1–34. [Google Scholar] [CrossRef] [PubMed]
  30. Girardet, C.; Bonnet, M.S.; Jdir, R.; Sadoud, M.; Thirion, S.; Tardivel, C.; Roux, J.; Lebrun, B.; Mounien, L.; Trouslard, J.; et al. Central Inflammation and Sickness-like Behavior Induced by the Food Contaminant Deoxynivalenol: A PGE2-Independent Mechanism. Toxicol. Sci. 2011, 124, 179–191. [Google Scholar] [CrossRef] [PubMed]
  31. Girardet, C.; Bonnet, M.S.; Jdir, R.; Sadoud, M.; Thirion, S.; Tardivel, C.; Roux, J.; Lebrun, B.; Wanaverbecq, N.; Mounien, L.; et al. The Food-Contaminant Deoxynivalenol Modifies Eating by Targeting Anorexigenic Neurocircuitry. PLoS ONE 2011, 6, e26134. [Google Scholar] [CrossRef] [PubMed]
  32. Collins, T.F.X.; Sprando, R.L.; Black, T.N.; Olejnik, N.; Eppley, R.M.; Hines, F.A.; Rorie, J.; Ruggles, D.I. Effects of Deoxynivalenol (DON, Vomitoxin) on in Utero Development in Rats. Food Chem. Toxicol. 2006, 44, 747–757. [Google Scholar] [CrossRef] [PubMed]
  33. Ren, Z.H.; Deng, H.D.; Deng, Y.T.; Deng, J.L.; Zuo, Z.C.; Yu, S.M.; Shen, L.H.; Cui, H.M.; Xu, Z.W.; Hu, Y.C. Effect of the Fusarium Toxins, Zearalenone and Deoxynivalenol, on the Mouse Brain. Environ. Toxicol. Pharmacol. 2016, 46, 62–70. [Google Scholar] [CrossRef] [PubMed]
  34. Venkataramana, M.; Chandra Nayaka, S.; Anand, T.; Rajesh, R.; Aiyaz, M.; Divakara, S.T.; Murali, H.S.; Prakash, H.S.; Lakshmana Rao, P.V. Zearalenone Induced Toxicity in SHSY-5Y Cells: The Role of Oxidative Stress Evidenced by N-Acetyl Cysteine. Food Chem. Toxicol. 2014, 65, 335–342. [Google Scholar] [CrossRef] [PubMed]
  35. Agahi, F.; Font, G.; Juan, C.; Juan-García, A. Individual and Combined Effect of Zearalenone Derivates and Beauvericin Mycotoxins on SH-SY5Y Cells. Toxins 2020, 12, 212. [Google Scholar] [CrossRef] [PubMed]
  36. Agahi, F.; Álvarez-Ortega, N.; Font, G.; Juan-García, A.; Juan, C. Oxidative Stress, Glutathione, and Gene Expression as Key Indicators in SH-SY5Y Cells Exposed to Zearalenone Metabolites and Beauvericin. Toxicol. Lett. 2020, 334, 44–52. [Google Scholar] [CrossRef] [PubMed]
  37. Wang, Y.; Wong, T.Y.; Chan, F.L.; Chen, S.; Leung, L.K. Assessing the Effect of Food Mycotoxins on Aromatase by Using a Cell-Based System. Toxicol. In Vitro 2014, 28, 640–646. [Google Scholar] [CrossRef] [PubMed]
  38. Dong, Y.; Jiang, A.; Yang, H.; Chen, H.; Wang, Y. Phytoestrogen α -Zearalanol Improves Memory Impairment and Hippocampal Neurogenesis in Ovariectomized Mice. Sci. World J. 2014, 2014, 862019. [Google Scholar] [CrossRef] [PubMed]
  39. Dong, Y.L.; Yue, Y.; Liu, F.H.; Lang, S.Y.; Zhang, X.C.; Dai, S.L.; Ge, Q.S.; Zuo, P.P. Treatment with Phytoestrogen α-Zearalanol Might Protect Neurons of Hippocampus in Ovariectomized Rats. Endocrine 2006, 30, 249–254. [Google Scholar] [CrossRef] [PubMed]
  40. Dong, Y.L.; Zuo, P.P.; Li, Q.; Liu, F.H.; Dai, S.L.; Ge, Q.S. Protective Effects of Phytoestrogen α-Zearalanol on Beta Amyloid 25-35 Induced Oxidative Damage in Cultured Rat Hippocampal Neurons. Endocrine 2007, 32, 206–211. [Google Scholar] [CrossRef] [PubMed]
  41. Dong, Y.; Li, R.; Jiang, A.; Xu, Z.; Wang, Y. Phytoestrogen Alpha-Zearalanol Attenuate Endoplasmic Reticulum Stress to against Cultured Rat Hippocampal Neurons Apoptotic Death Induced by Amyloid Beta25-35. Neuroendocrinol. Lett. 2017, 38, 353–359. [Google Scholar] [PubMed]
  42. Jocsak, G.; Kiss, D.S.; Toth, I.; Goszleth, G.; Bartha, T.; Frenyo, L.V.; Horvath, T.L.; Zsarnovszky, A. Comparison of Individual and Combined Effects of Four Endocrine Disruptors on Estrogen Receptor Beta Transcription in Cerebellar Cell Culture: The Modulatory Role of Estradiol and Triiodo-Thyronine. Int. J. Environ. Res. Public Health 2016, 13, 619. [Google Scholar] [CrossRef] [PubMed]
  43. Kiss, D.S.; Ioja, E.; Toth, I.; Barany, Z.; Jocsak, G.; Bartha, T.; Horvath, T.L.; Zsarnovszky, A. Comparative Analysis of Zearalenone Effects on Thyroid Receptor Alpha (TRα) and Beta (TRβ) Expression in Rat Primary Cerebellar Cell Cultures. Int. J. Mol. Sci. 2018, 19, 1440. [Google Scholar] [CrossRef] [PubMed]
  44. Smith, M.C.; Gheux, A.; Coton, M.; Madec, S.; Hymery, N.; Coton, E. In Vitro Co-Culture Models to Evaluate Acute Cytotoxicity of Individual and Combined Mycotoxin Exposures on Caco-2, THP-1 and HepaRG Human Cell Lines. Chem. Biol. Interact. 2018, 281, 51–59. [Google Scholar] [CrossRef] [PubMed]
  45. Juan-García, A.; Manyes, L.; Ruiz, M.J.; Font, G. Applications of Flow Cytometry to Toxicological Mycotoxin Effects in Cultured Mammalian Cells: A Review. Food Chem. Toxicol. 2013, 56, 40–59. [Google Scholar] [CrossRef] [PubMed]
  46. Shin, B.S.; Hong, S.H.; Bulitta, J.B.; Lee, J.B.; Hwang, S.W.; Kim, H.J.; Yang, S.D.; Yoon, H.S.; Kim, D.J.; Lee, B.M.; et al. Physiologically Based Pharmacokinetics of Zearalenone. J. Toxicol. Environ. Health—Part A Curr. Issues 2009, 72, 1395–1405. [Google Scholar] [CrossRef] [PubMed]
  47. Zheng, W.; Wang, B.; Li, X.; Wang, T.; Zou, H.; Gu, J.; Yuan, Y.; Liu, X.; Bai, J.; Bian, J.; et al. Zearalenone Promotes Cell Proliferation or Causes Cell Death? Toxins 2018, 10, 184. [Google Scholar] [CrossRef] [PubMed]
  48. Zheng, J.; Xiao, X.; Liu, J.; Zheng, S.; Yin, Q.; Yu, Y. Growth-Promoting Effect of Environmental Endocrine Disruptors on Human Neuroblastoma SK-N-SH Cells. Environ. Toxicol. Pharmacol. 2007, 24, 189–193. [Google Scholar] [CrossRef] [PubMed]
  49. Phelps, C.J.; Wiggins, J.P.; Wangsness, P.J. Effects of Zeranol on in Vitro Growth Hormone Release by Lamb and Rat Pituitary Cells. J. Anim. Sci. 1988, 66, 2614–2625. [Google Scholar] [CrossRef] [PubMed]
  50. Shier, W.T.; Shier, A.C.; Xie, W.; Mirocha, C.J. Structure-Activity Relationships for Human Estrogenic Activity in Zearalenone Mycotoxins. Toxicon 2001, 39, 1435–1438. [Google Scholar] [CrossRef] [PubMed]
  51. Lecomte, S.; Lelong, M.; Bourgine, G.; Efstathiou, T.; Saligaut, C.; Pakdel, F. Assessment of the Potential Activity of Major Dietary Compounds as Selective Estrogen Receptor Modulators in Two Distinct Cell Models for Proliferation and Differentiation. Toxicol. Appl. Pharmacol. 2017, 325, 61–70. [Google Scholar] [CrossRef] [PubMed]
  52. Nikov, G.N.; Hopkins, N.E.; Boue, S.; Alworth, W.L. Interactions of Dietary Estrogens with Human Estrogen Receptors and the Effect on Estrogen Receptor-Estrogen Response Element Complex Formation. Environ. Health Perspect. 2000, 108, 867–872. [Google Scholar] [CrossRef] [PubMed]
  53. Rai, A.; Das, M.; Tripathi, A. Occurrence and Toxicity of a Fusarium Mycotoxin, Zearalenone. Crit. Rev. Food Sci. Nutr. 2019, 60, 2710–2729. [Google Scholar] [CrossRef] [PubMed]
  54. Liu, X.; Shi, H. Regulation of Estrogen Receptor Expression in the Hypothalamus by Sex Steroids: Implication in the Regulation of Energy Homeostasis. Int. J. Endocrinol. 2015, 2015, 949085. [Google Scholar] [CrossRef] [PubMed]
  55. Arnold, S.; Beyer, C. Neuroprotection by Estrogen in the Brain: The Mitochondrial Compartment as Presumed Therapeutic Target. J. Neurochem. 2009, 110, 1–11. [Google Scholar] [CrossRef] [PubMed]
  56. Woolley, C.S. Acute Effects of Estrogen on Neuronal Physiology. Annu. Rev. Pharmacol. Toxicol. 2007, 47, 657–680. [Google Scholar] [CrossRef] [PubMed]
  57. Johnstone, A.F.M.; Gross, G.W.; Weiss, D.G.; Schroeder, O.H.U.; Gramowski, A.; Shafer, T.J. Microelectrode Arrays: A Physiologically Based Neurotoxicity Testing Platform for the 21st Century. Neurotoxicology 2010, 31, 331–350. [Google Scholar] [CrossRef] [PubMed]
  58. Bódi, V.; Csikós, V.; Rátkai, E.A.; Szűcs, A.; Tóth, A.; Szádeczky-Kardoss, K.; Dobolyi, Á.; Schlett, K.; Világi, I.; Varró, P. Short-Term Neuronal Effects of Fumonisin B1 on Neuronal Activity in Rodents. Neurotoxicology 2020, 80, 41–51. [Google Scholar] [CrossRef] [PubMed]
  59. Kwon, O.S.; Slikker, W.; Davies, D.L. Biochemical and Morphological Effects of Fumonisin B1 on Primary Cultures of Rat Cerebrum. Neurotoxicol. Teratol. 2000, 22, 565–572. [Google Scholar] [CrossRef] [PubMed]
  60. Galvano, F.; Campisi, A.; Russo, A.; Galvano, G.; Palumbo, M.; Renis, M.; Barcellona, M.L.; Perez-Polo, J.R.; Vanella, A. DNA Damage in Astrocytes Exposed to Fumonisin B1. Neurochem. Res. 2002, 27, 345–351. [Google Scholar] [CrossRef] [PubMed]
  61. Stockmann-Juvala, H.; Mikkola, J.; Naarala, J.; Loikkanen, J.; Elovaara, E.; Savolainen, K. Fumonisin B1-Induced Toxicity and Oxidative Damage in U-118MG Glioblastoma Cells. Toxicology 2004, 202, 173–183. [Google Scholar] [CrossRef] [PubMed]
  62. Osuchowski, M.F.; Sharma, R.P. Fumonisin B1 Induces Necrotic Cell Death in BV-2 Cells and Murine Cultured Astrocytes and Is Antiproliferative in BV-2 Cells While N2A Cells and Primary Cortical Neurons Are Resistant. Neurotoxicology 2005, 26, 981–992. [Google Scholar] [CrossRef] [PubMed]
  63. Domijan, A.M.; Kovac, S.; Abramov, A.Y. Impact of Fumonisin B 1 on Glutamate Toxicity and Low Magnesium-Induced Seizure Activity in Neuronal Primary Culture. Neuroscience 2012, 202, 10–16. [Google Scholar] [CrossRef] [PubMed]
  64. Domijan, A.M.; Abramov, A.Y. Fumonisin B1 Inhibits Mitochondrial Respiration and Deregulates Calcium Homeostasis—Implication to Mechanism of Cell Toxicity. Int. J. Biochem. Cell Biol. 2011, 43, 897–904. [Google Scholar] [CrossRef] [PubMed]
  65. Stockmann-Juvala, H.; Mikkola, J.; Naarala, J.; Loikkanen, J.; Elovaara, E.; Savolainen, K. Oxidative Stress Induced by Fumonisin B1 in Continuous Human and Rodent Neural Cell Cultures. Free Radic. Res. 2004, 38, 933–942. [Google Scholar] [CrossRef] [PubMed]
  66. Dringen, R.; Hirrlinger, J. Glutathione Pathways in the Brain. Biol. Chem. 2003, 384, 505–516. [Google Scholar] [CrossRef] [PubMed]
  67. Bolaños, J.P. Bioenergetics and Redox Adaptations of Astrocytes to Neuronal Activity. J. Neurochem. 2016, 139, 115–125. [Google Scholar] [CrossRef] [PubMed]
  68. Quincozes-Santos, A.; Santos, C.L.; de Souza Almeida, R.R.; da Silva, A.; Thomaz, N.K.; Costa, N.L.F.; Weber, F.B.; Schmitz, I.; Medeiros, L.S.; Medeiros, L.; et al. Gliotoxicity and Glioprotection: The Dual Role of Glial Cells. Mol. Neurobiol. 2021, 58, 6577–6592. [Google Scholar] [CrossRef] [PubMed]
  69. Lee, K.H.; Cha, M.; Lee, B.H. Crosstalk between Neuron and Glial Cells in Oxidative Injury and Neuroprotection. Int. J. Mol. Sci. 2021, 22, 13315. [Google Scholar] [CrossRef] [PubMed]
  70. Oyarce, K.; Cepeda, M.Y.; Lagos, R.; Garrido, C.; Vega-Letter, A.M.; Garcia-Robles, M.; Luz-Crawford, P.; Elizondo-Vega, R. Neuroprotective and Neurotoxic Effects of Glial-Derived Exosomes. Front. Cell. Neurosci. 2022, 16, 920686. [Google Scholar] [CrossRef] [PubMed]
  71. Tima, H.; Rácz, A.; Guld, Z.; Mohácsi-Farkas, C.; Kiskó, G. Deoxynivalenol, Zearalenone and T-2 in Grain Based Swine Feed in Hungary. Food Addit. Contam. Part B 2016, 9, 275–280. [Google Scholar] [CrossRef] [PubMed]
  72. Tima, H.; Brückner, A.; Mohácsi-Farkas, C.; Kiskó, G. Fusarium Mycotoxins in Cereals Harvested from Hungarian Fields. Food Addit. Contam. Part B Surveill. 2016, 9, 127–131. [Google Scholar] [CrossRef] [PubMed]
  73. Gerding, J.; Cramer, B.; Humpf, H.U. Determination of Mycotoxin Exposure in Germany Using an LC-MS/MS Multibiomarker Approach. Mol. Nutr. Food Res. 2014, 58, 2358–2368. [Google Scholar] [CrossRef] [PubMed]
  74. Warth, B.; Sulyok, M.; Fruhmann, P.; Berthiller, F.; Schuhmacher, R.; Hametner, C.; Adam, G.; Fröhlich, J.; Krska, R. Assessment of Human Deoxynivalenol Exposure Using an LC-MS/MS Based Biomarker Method. Toxicol. Lett. 2012, 211, 85–90. [Google Scholar] [CrossRef] [PubMed]
  75. Prelusky, D.B.; Hartin, K.E.; Trenholm, H.L. Distribution of Deoxynivalenol in Cerebral Spinal Fluid Following Administration to Swine and Sheep. J. Environ. Sci. Health Part B 1990, 25, 395–413. [Google Scholar] [CrossRef] [PubMed]
  76. Behrens, M.; Hüwel, S.; Galla, H.J.; Humpf, H.U. Blood-Brain Barrier Effects of the Fusarium Mycotoxins Deoxynivalenol, 3 Acetyldeoxynivalenol, and Moniliformin and Their Transfer to the Brain. PLoS ONE 2015, 10, e143640. [Google Scholar] [CrossRef] [PubMed]
  77. Razafimanjato, H.; Benzaria, A.; Taïeb, N.; Guo, X.J.; Vidal, N.; di Scala, C.; Varini, K.; Maresca, M. The Ribotoxin Deoxynivalenol Affects the Viability and Functions of Glial Cells. Glia 2011, 59, 1672–1683. [Google Scholar] [CrossRef] [PubMed]
  78. Wang, X.; Fan, M.; Chu, X.; Zhang, Y.; ur Rahman, S.; Jiang, Y.; Chen, X.; Zhu, D.; Feng, S.; Li, Y.; et al. Deoxynivalenol Induces Toxicity and Apoptosis in Piglet Hippocampal Nerve Cells via the MAPK Signaling Pathway. Toxicon 2018, 155, 1–8. [Google Scholar] [CrossRef] [PubMed]
  79. Wang, X.; Xu, W.; Fan, M.; Meng, T.; Chen, X.; Jiang, Y.; Zhu, D.; Hu, W.; Gong, J.; Feng, S.; et al. Deoxynivalenol Induces Apoptosis in PC12 Cells via the Mitochondrial Pathway. Environ. Toxicol. Pharmacol. 2016, 43, 193–202. [Google Scholar] [CrossRef] [PubMed]
  80. Belcher, S.M. Regulated Expression of Estrogen Receptor α and β MRNA in Granule Cells during Development of the Rat Cerebellum. Dev. Brain Res. 1999, 115, 57–69. [Google Scholar] [CrossRef] [PubMed]
  81. Kuiper, G.G.J.M.; Carlsson, B.; Grandien, K.; Enmark, E.; Häggblad, J.; Nilsson, S.; Gustafsson, J.Å. Comparison of the Ligand Binding Specificity and Transcript Tissue Distribution of Estrogen Receptors and α and β. Endocrinology 1997, 138, 863–870. [Google Scholar] [CrossRef] [PubMed]
  82. Beyer, C. Estrogen and the Developing Mammalian Brain. Anat. Embryol. 1999, 199, 379–390. [Google Scholar] [CrossRef] [PubMed]
  83. Crespo-Castrillo, A.; Arevalo, M.A. Microglial and Astrocytic Function in Physiological and Pathological Conditions: Estrogenic Modulation. Int. J. Mol. Sci. 2020, 21, 3219. [Google Scholar] [CrossRef] [PubMed]
  84. Wang, J.; Sareddy, G.R.; Lu, Y.; Pratap, U.P.; Tang, F.; Greene, K.M.; Meyre, P.L.; Tekmal, R.R.; Vadlamudi, R.K.; Brann, D.W. Astrocyte-Derived Estrogen Regulates Reactive Astrogliosis and Is Neuroprotective Following Ischemic Brain Injury. J. Neurosci. 2020, 40, 9751–9771. [Google Scholar] [CrossRef] [PubMed]
  85. Wilson, M.E.; Westberry, J.M. Regulation of Oestrogen Receptor Gene Expression: New Insights and Novel Mechanisms. J. Neuroendocrinol. 2009, 21, 238–242. [Google Scholar] [CrossRef] [PubMed]
  86. Wilson, M.E.; Westberry, J.M.; Trout, A.L. Estrogen Receptor-Alpha Gene Expression in the Cortex: Sex Differences during Development and in Adulthood. Horm. Behav. 2011, 59, 353–357. [Google Scholar] [CrossRef] [PubMed]
  87. Da Su, J.; Qiu, J.; Zhong, Y.P.; Chen, Y.Z. Expression of Estrogen Receptor -α and -β Immunoreactivity in the Cultured Neonatal Suprachiasmatic Nucleus: With Special Attention to GABAergic Neurons. Neuroreport 2001, 12, 1955–1959. [Google Scholar] [CrossRef]
  88. Piechota, M.; Korostynski, M.; Golda, S.; Ficek, J.; Jantas, D.; Barbara, Z.; Przewlocki, R. Transcriptional Signatures of Steroid Hormones in the Striatal Neurons and Astrocytes. BMC Neurosci. 2017, 18, 37. [Google Scholar] [CrossRef] [PubMed]
  89. Frago, L.M.; Canelles, S.; Freire-Regatillo, A.; Argente-Arizón, P.; Barrios, V.; Argente, J.; Garcia-Segura, L.M.; Chowen, J.A. Estradiol Uses Different Mechanisms in Astrocytes from the Hippocampus of Male and Female Rats to Protect against Damage Induced by Palmitic Acid. Front. Mol. Neurosci. 2017, 10, 330. [Google Scholar] [CrossRef] [PubMed]
  90. Schreihofer, D.A. Transcriptional Regulation by Phytoestrogens in Neuronal Cell Lines. Mol. Cell. Endocrinol. 2005, 231, 13–22. [Google Scholar] [CrossRef] [PubMed]
  91. Tatay, E.; Espín, S.; García-Fernández, A.J.; Ruiz, M.J. Oxidative Damage and Disturbance of Antioxidant Capacity by Zearalenone and Its Metabolites in Human Cells. Toxicol. In Vitro 2017, 45, 334–339. [Google Scholar] [CrossRef] [PubMed]
  92. Shin, B.S.; Hong, S.H.; Bulitta, J.B.; Hwang, S.W.; Kim, H.J.; Lee, J.B.; Yang, S.D.; Kim, J.E.; Yoon, H.S.; Kim, D.J.; et al. Disposition, Oral Bioavailability, and Tissue Distribution of Zearalenone in Rats at Various Dose Levels. J. Toxicol. Environ. Health—Part A Curr. Issues 2009, 72, 1406–1411. [Google Scholar] [CrossRef] [PubMed]
  93. Suresh, J.; Radojicic, M.; Pesce, L.L.; Bhansali, A.; Wang, J.; Tryba, A.K.; Marks, J.D.; Van Drongelen, W. Network Burst Activity in Hippocampal Neuronal Cultures: The Role of Synaptic and Intrinsic Currents. J. Neurophysiol. 2016, 115, 3073–3089. [Google Scholar] [CrossRef] [PubMed]
  94. Brewer, G.J.; Boehler, M.D.; Jones, T.T.; Wheeler, B.C. NbActiv4 Medium Improvement to Neurobasal/B27 Increases Neuron Synapse Densities and Network Spike Rates on Multielectrode Arrays. J. Neurosci. Methods 2008, 170, 181–187. [Google Scholar] [CrossRef] [PubMed]
  95. Directive 2010/63/EU; The European Parliament and of the Council of 22 September 2010 on the Protection of Animals Used for Scientific Purposes. Official Journal of the European Union: Luxembourg, 2010.
  96. Tárnok, K.; Kiss, E.; Luiten, P.G.M.; Nyakas, C.; Tihanyi, K.; Schlett, K.; Eisel, U.L.M. Effects of Vinpocetine on Mitochondrial Function and Neuroprotection in Primary Cortical Neurons. Neurochem Int 2008, 53, 289–295. [Google Scholar] [CrossRef] [PubMed]
  97. Staack, A.; Donjacour, A.A.; Brody, J.; Cunha, G.R.; Carroll, P. Mouse Urogenital Development: A Practical Approach. Differentiation 2003, 71, 402–413. [Google Scholar] [CrossRef] [PubMed]
  98. Song, J.; Song, J.; Xue, K.; Han, H.; Ding, F.; Li, S.; Dai, Y.; Li, N. Rapid Atraumatic Sex Identification of Developmental Day 14-16 Mice. Biotech. Histochem. 2015, 90, 309–314. [Google Scholar] [CrossRef] [PubMed]
  99. Tárnok, K.; Szilágyi, L.; Berki, T.; Németh, P.; Gráf, L.; Schlett, K. Anoxia Leads to a Rapid Translocation of Human Trypsinogen 4 to the Plasma Membrane of Cultured Astrocytes. J. Neurochem. 2010, 115, 314–324. [Google Scholar] [CrossRef] [PubMed]
  100. Schindelin, J.; Arganda-Carreras, I.; Frise, E.; Kaynig, V.; Longair, M.; Pietzsch, T.; Preibisch, S.; Rueden, C.; Saalfeld, S.; Schmid, B.; et al. Fiji: An Open-Source Platform for Biological-Image Analysis. Nat. Methods 2012, 9, 676–682. [Google Scholar] [CrossRef] [PubMed]
  101. Dastgheyb, R.M.; Yoo, S.W.; Haughey, N.J. MEAnalyzer—A Spike Train Analysis Tool for Multi Electrode Arrays. Neuroinformatics 2020, 18, 163–179. [Google Scholar] [CrossRef] [PubMed]
Figure 1. Representative immunofluorescence images of three types of neural cultures applied for mycotoxin measurements. Neurons (arrowheads), astroglial cells (arrows), and microglia (asterisk) were visualized using IIIβ-tubulin, glial fibrillary acidic protein (GFAP), and Iba-1 immunopositivity, respectively. Neuronal cultures (left image) were free of astroglial and microglial cells on DIV7, since mitosis was inhibited 24 h after plating by adding CAR. In mixed cultures (middle image), both neurons and astrocytes were detectable on DIV7. Astroglial cell cultures (right image) contained less than 2% microglia (asterisk), and they were free of neurons 24 h after seeding. Scale bars: 50 μm.
Toxins 17 00368 g001
Figure 2. Astroglial cells attenuate the cytotoxic effect of FB1 observed in neurons. The effects of FB1 on the cell viability of mouse primary (A) neuronal, (B) mixed, and (C) astroglial cell cultures were determined after 24 (blue) or 48 h (black) treatments of 1, 10, 100, or 200 nM or 1, 2, 10, or 50 μM FB1 via MTT assay. Results are expressed in the percentage of control data, as mean ± s.e.m. “$” indicates significant differences between data obtained after 24 and 48 h treatment; * indicates significant differences compared to non-treated data (*: p < 0.05). n = 12–42.
Toxins 17 00368 g002
Figure 3. Astroglial cells are the most sensitive to the cytotoxic effect of DON. The effects of DON on the cell viability of mouse primary (A) neuronal, (B) mixed, and (C) astroglial cell cultures were determined after 24 (blue) or 48 h (black) treatments of 1, 10, 100, or 200 nM or 1, 2, 10, or 50 μM DON via MTT assay. Results are expressed in the percentage of control data, as mean ± s.e.m. “$” indicates significant differences between data obtained after 24 and 48 h treatment; * indicates significant differences compared to non-treated data (*: p < 0.05). n = 18–36.
Toxins 17 00368 g003
Figure 4. Low ZEA concentration increases cell viability and alters the expression of ERα in a cell type-specific manner. (A) Effects of 10 nM of ZEA on the cell viability of mouse primary neuronal, astroglial, and mixed-cell cultures after 48 h, as measured via MTT assay. Results are expressed in the percentage of control data, as mean ± s.e.m. n = 17–35. (B) ΔCq values of ERα and ERβ relative expression in the control, non-treated neuronal, astroglial, and mixed cultures, analyzed via qRT-PCR. Both estrogen receptor types are expressed in the different cell cultures. (C) qRT-PCR assay showed that in neuronal and mixed cultures, ZEA administration decreased, while in astroglial cultures, it increased ERα expression compared to the control cells. (D) ERβ expression, on the other hand, was not altered by ZEA in either cell culture. mRPL13a and GAPDH were used as housekeeping genes. Results are expressed as mean ± s.d. n = 3 biological samples. * indicates significant differences compared to non-treated data (*: p < 0.05).
Toxins 17 00368 g004
Figure 5. ZEA does not influence the number of mitochondria, but reduces the expression of VDAC1, an ion channel of the outer mitochondrial membrane. (A) Cholera Toxin B-Alexa647 was used to visualize the cell membrane (white, dotted line), while mitochondria and nuclei were stained using MitoTracker Orange7510 and DAPI, respectively. The relative area of mitochondria was determined as the ratio of mitochondria/cytoplasm areas, using ImageJ 1.54p software. Scale bars, 20 μm. (B) Effects of ZEA on the relative area of mitochondria in astroglial cultures. Results are expressed as mean ± s.e.m. (n = 12–15). (C) VDAC1 relative expression in ZEA-treated cells (black) compared to the control, non-treated cultures (white), analyzed via qRT-PCR. mRPL13a and GAPDH were used as housekeeping genes. Results are expressed as mean ± s.d. n = 3 biological samples.
Toxins 17 00368 g005
Figure 6. ZEA rapidly alters neuronal activity by affecting firing patterns. (A) Overview of in vitro developed neuronal network, cultured on the surface of an MEA chip. (BD) Electrophysiological parameters measured via multi-electrode array before and after the addition of 2 nM of ZEA to the culture medium. Results are represented as box plots (interquartile range withmedian and outliers). *: p < 0.05, n = 16–40. (E1H1) Representative spike trains obtained from MEA60 chips depicted as raster plots from 5 min-long recordings before (E) and after (F: 15 min, G: 24 h, and H: 48 h) 2 nM ZEA treatment. (E2H2) Cross-correlograms of the respective recorded network activity, where the node size represents the total number of connections for the given node (electrode) and edge color shows the relative coincidence value between the interconnected nodes.
Toxins 17 00368 g006
Disclaimer/Publisher’s Note: The statements, opinions and data contained in all publications are solely those of the individual author(s) and contributor(s) and not of MDPI and/or the editor(s). MDPI and/or the editor(s) disclaim responsibility for any injury to people or property resulting from any ideas, methods, instructions or products referred to in the content.