Article

Molecular Quantification of Total and Toxigenic Microcystis Using Digital-Droplet-Polymerase-Chain-Reaction-Based Multiplex Assay

1
Nakdong River Environment Research Center, National Institute of Environmental Research, Daegu 43008, Republic of Korea
2
Department of Environmental Engineering, Chungbuk National University, Cheongju 28644, Republic of Korea
*
Author to whom correspondence should be addressed.
Toxins 2025, 17(5), 242; https://doi.org/10.3390/toxins17050242
Submission received: 8 April 2025 / Revised: 2 May 2025 / Accepted: 12 May 2025 / Published: 12 May 2025
(This article belongs to the Section Marine and Freshwater Toxins)

Abstract

:
The proliferation of harmful cyanobacteria, particularly Microcystis, poses significant risks to drinking and recreational water resources, especially under the influence of climate change. Conventional monitoring methods based on microscopy for harmful cyanobacteria management systems are limited in detecting toxigenic genotypes, hindering accurate risk assessment. In this study, we developed a digital droplet PCR (ddPCR)-based method for the simultaneous quantification of total and toxigenic Microcystis in freshwater environments. We targeted the secA gene, specific to the Microcystis genus, and the mcyA gene, associated with microcystin biosynthesis. Custom-designed primers and probes showed high specificity and sensitivity, enabling accurate detection without cross-reactivity. The multiplex ddPCR assay allowed for concurrent quantification of both targets in a single reaction, reducing the analysis time and cost. Application to field samples demonstrated good agreement with microscopic counts and revealed seasonal shifts in toxigenic genotype abundance. Notably, ddPCR detected Microcystis at very low densities—down to 7 cells/mL in the mixed cyanobacterial communities of field samples—even when microscopy failed, highlighting its utility for early bloom detection. This approach provides a reliable and efficient tool for monitoring Microcystis dynamics and assessing toxin production potential, offering significant advantages for the early warning and proactive management of harmful cyanobacterial blooms.
Key Contribution: We developed a genetic method for quantifying both total and toxigenic Microcystis using ddPCR, targeting the secA gene specific to the Microcystis genus and the mcyA gene associated with microcystin synthesis, offering a reliable and efficient approach for the early warning and mitigation of the risks posed by Microcystis.

1. Introduction

The increase in population and subsequent human activities have led to land-use changes, urbanization, and expanded industrial and agricultural activities, consequently increasing pollutant loads in freshwater systems such as rivers, lakes, and reservoirs, thereby accelerating eutrophication [1,2]. Eutrophication inevitably enhances primary production and alters community structures, particularly triggering the proliferation of toxin-producing harmful cyanobacterial blooms (cyanoHABs), which pose serious threats to aquatic ecosystems, water resource utilization, and human health on a global scale [3,4,5,6,7,8]. Furthermore, ongoing global climate change is expected to increase the intensity, frequency, and duration of cyanoHAB events [9,10,11,12].
The major cyanobacterial genera responsible for cyanoHABs include Microcystis, Aphanizomenon, Cylindrospermopsis, Dolichospermum, and Planktothrix [7,13]. Among these, Microcystis is the most frequently reported bloom-forming cyanobacterium across diverse freshwater environments worldwide [4,14,15,16,17,18,19]. In the rivers and lakes of Korea, Microcystis blooms occur extensively during the warm summer months, significantly impairing water resource utilization [20,21]. Microcystis forms colonies with cells arranged irregularly, sparsely, or densely, within a common mucilage, which proliferate rapidly under warm conditions and often accumulate as surface scums [21,22].
The primary health risk associated with Microcystis blooms arises from the potent hepatotoxin they produce, known as microcystins. Microcystis is the most well-known producer of microcystins, although other cyanobacteria have also been reported to produce them [7,23,24]. Once absorbed into cells, microcystins inhibit protein phosphatases (PP1, PP2A, and PP5), leading to cytoskeletal destabilization and subsequent apoptosis and necrosis. High acute exposure can result in hepatic hemorrhage due to damage to sinusoidal capillaries, while chronic exposure at low doses (below 20 μg/kg body weight) may lead to phosphatase inhibition, abnormal cellular proliferation, hepatic hypertrophy, and tumor-promoting effects [25].
Microcystins are cyclic heptapeptides containing a unique ADDA moiety, and variations in amino acid residues result in over 250 known structural variants, such as microcystin-LR, -YR, and -RR [26]. Their biosynthesis involves a multi-enzyme complex, including polyketide synthases and non-ribosomal peptide synthetases, which enhance their chemical stability and influence their biodegradability in aquatic environments [27].
In 1998, the World Health Organization (WHO) established a provisional drinking water guideline value of 1 μg/L for microcystin-LR—the first regulatory measure targeting a cyanotoxin [28]. Many countries have since adopted or modified this guideline to ensure drinking water safety, implementing regular monitoring and management frameworks such as the Alert Level Framework (ALF) [7,29,30,31,32,33]. The ALF alert thresholds are typically based on cyanobacterial cell density, biovolume, or chlorophyll-a concentration, assessed using microscopy-based species identification and biomass measurements [30].
In addition to microscopic analysis, various monitoring technologies have recently been developed for the effective management of harmful cyanobacteria. Microcystins and other cyanotoxins are analyzed using liquid chromatography–tandem mass spectrometry (LC–MS/MS), with water samples collected through conventional sampling methods or using solid-phase adsorption toxin tracking (SPATT) samplers [34]. Satellite-based remote sensing techniques have also been developed to generate high-resolution chlorophyll-a and phycocyanin maps for bloom detection [35]. Additionally, machine learning models such as CyanoNet have demonstrated practical effectiveness in the detection and quantification of cyanobacteria by modeling cyanobacterial indices (CIs) from satellite data [36].
However, most existing monitoring techniques focus on measuring the total harmful cyanobacterial biomass and bloom expansion. Since not all cyanobacteria produce toxins, risk assessments based solely on total cyanobacterial biomass may overestimate public health risks associated with cyanotoxins [33,37,38]. The most accurate approach for evaluating toxin-associated risks involves directly analyzing toxin concentrations using LC–MS/MS or ELISA. However, these methods require substantial investments in high-cost analytical equipment and operation by highly trained personnel [33]. Furthermore, while direct toxin monitoring provides precise toxin concentration estimates, it does not account for non-specific health effects associated with cyanoHABs. Therefore, a time- and cost-effective tool is needed to simultaneously estimate the cyanobacterial biomass and toxin production potential for a more comprehensive risk assessment regarding cyanoHABs [7].
With advancements in PCR-based molecular techniques, studies have focused on detecting and quantifying genes responsible for the biosynthesis of toxins and odor compounds in specific cyanobacterial taxa [13,33,39,40,41,42,43,44]. Genetic methods primarily indicate the potential for toxin production rather than providing direct information on actual toxin concentrations. Nonetheless, integrating genetic methods into monitoring programs allows for the early warning of toxin-producing blooms and identification of toxin-producing taxa within mixed cyanobacterial populations. Additionally, genetic approaches facilitate high-throughput sample analysis [7].
Quantitative real-time PCR (qPCR) has been widely used for DNA quantification [42,45,46,47,48]; however, digital PCR (dPCR) has recently emerged as an alternative method [49,50,51,52]. Unlike qPCR, which estimates DNA quantities based on standard curves, but its precision and sensitivity decrease with low-concentration samples, dPCR enables absolute quantification without standard curves and maintains robustness in the presence of PCR inhibitors, offering greater accuracy and reproducibility [53,54].
In this study, we developed a genetic analysis method using Digital Droplet PCR (ddPCR), which offers superior accuracy, sensitivity, and reproducibility. This method was used to estimate the biomass of Microcystis, the most frequently occurring harmful cyanobacterium responsible for cyanoHABs worldwide, as well as the biomass of toxigenic Microcystis, which possess the microcystin synthetase gene and therefore have the potential to produce microcystins. The developed method was applied to field samples, and its applicability was evaluated by comparison with conventional microscopic analysis.

2. Results

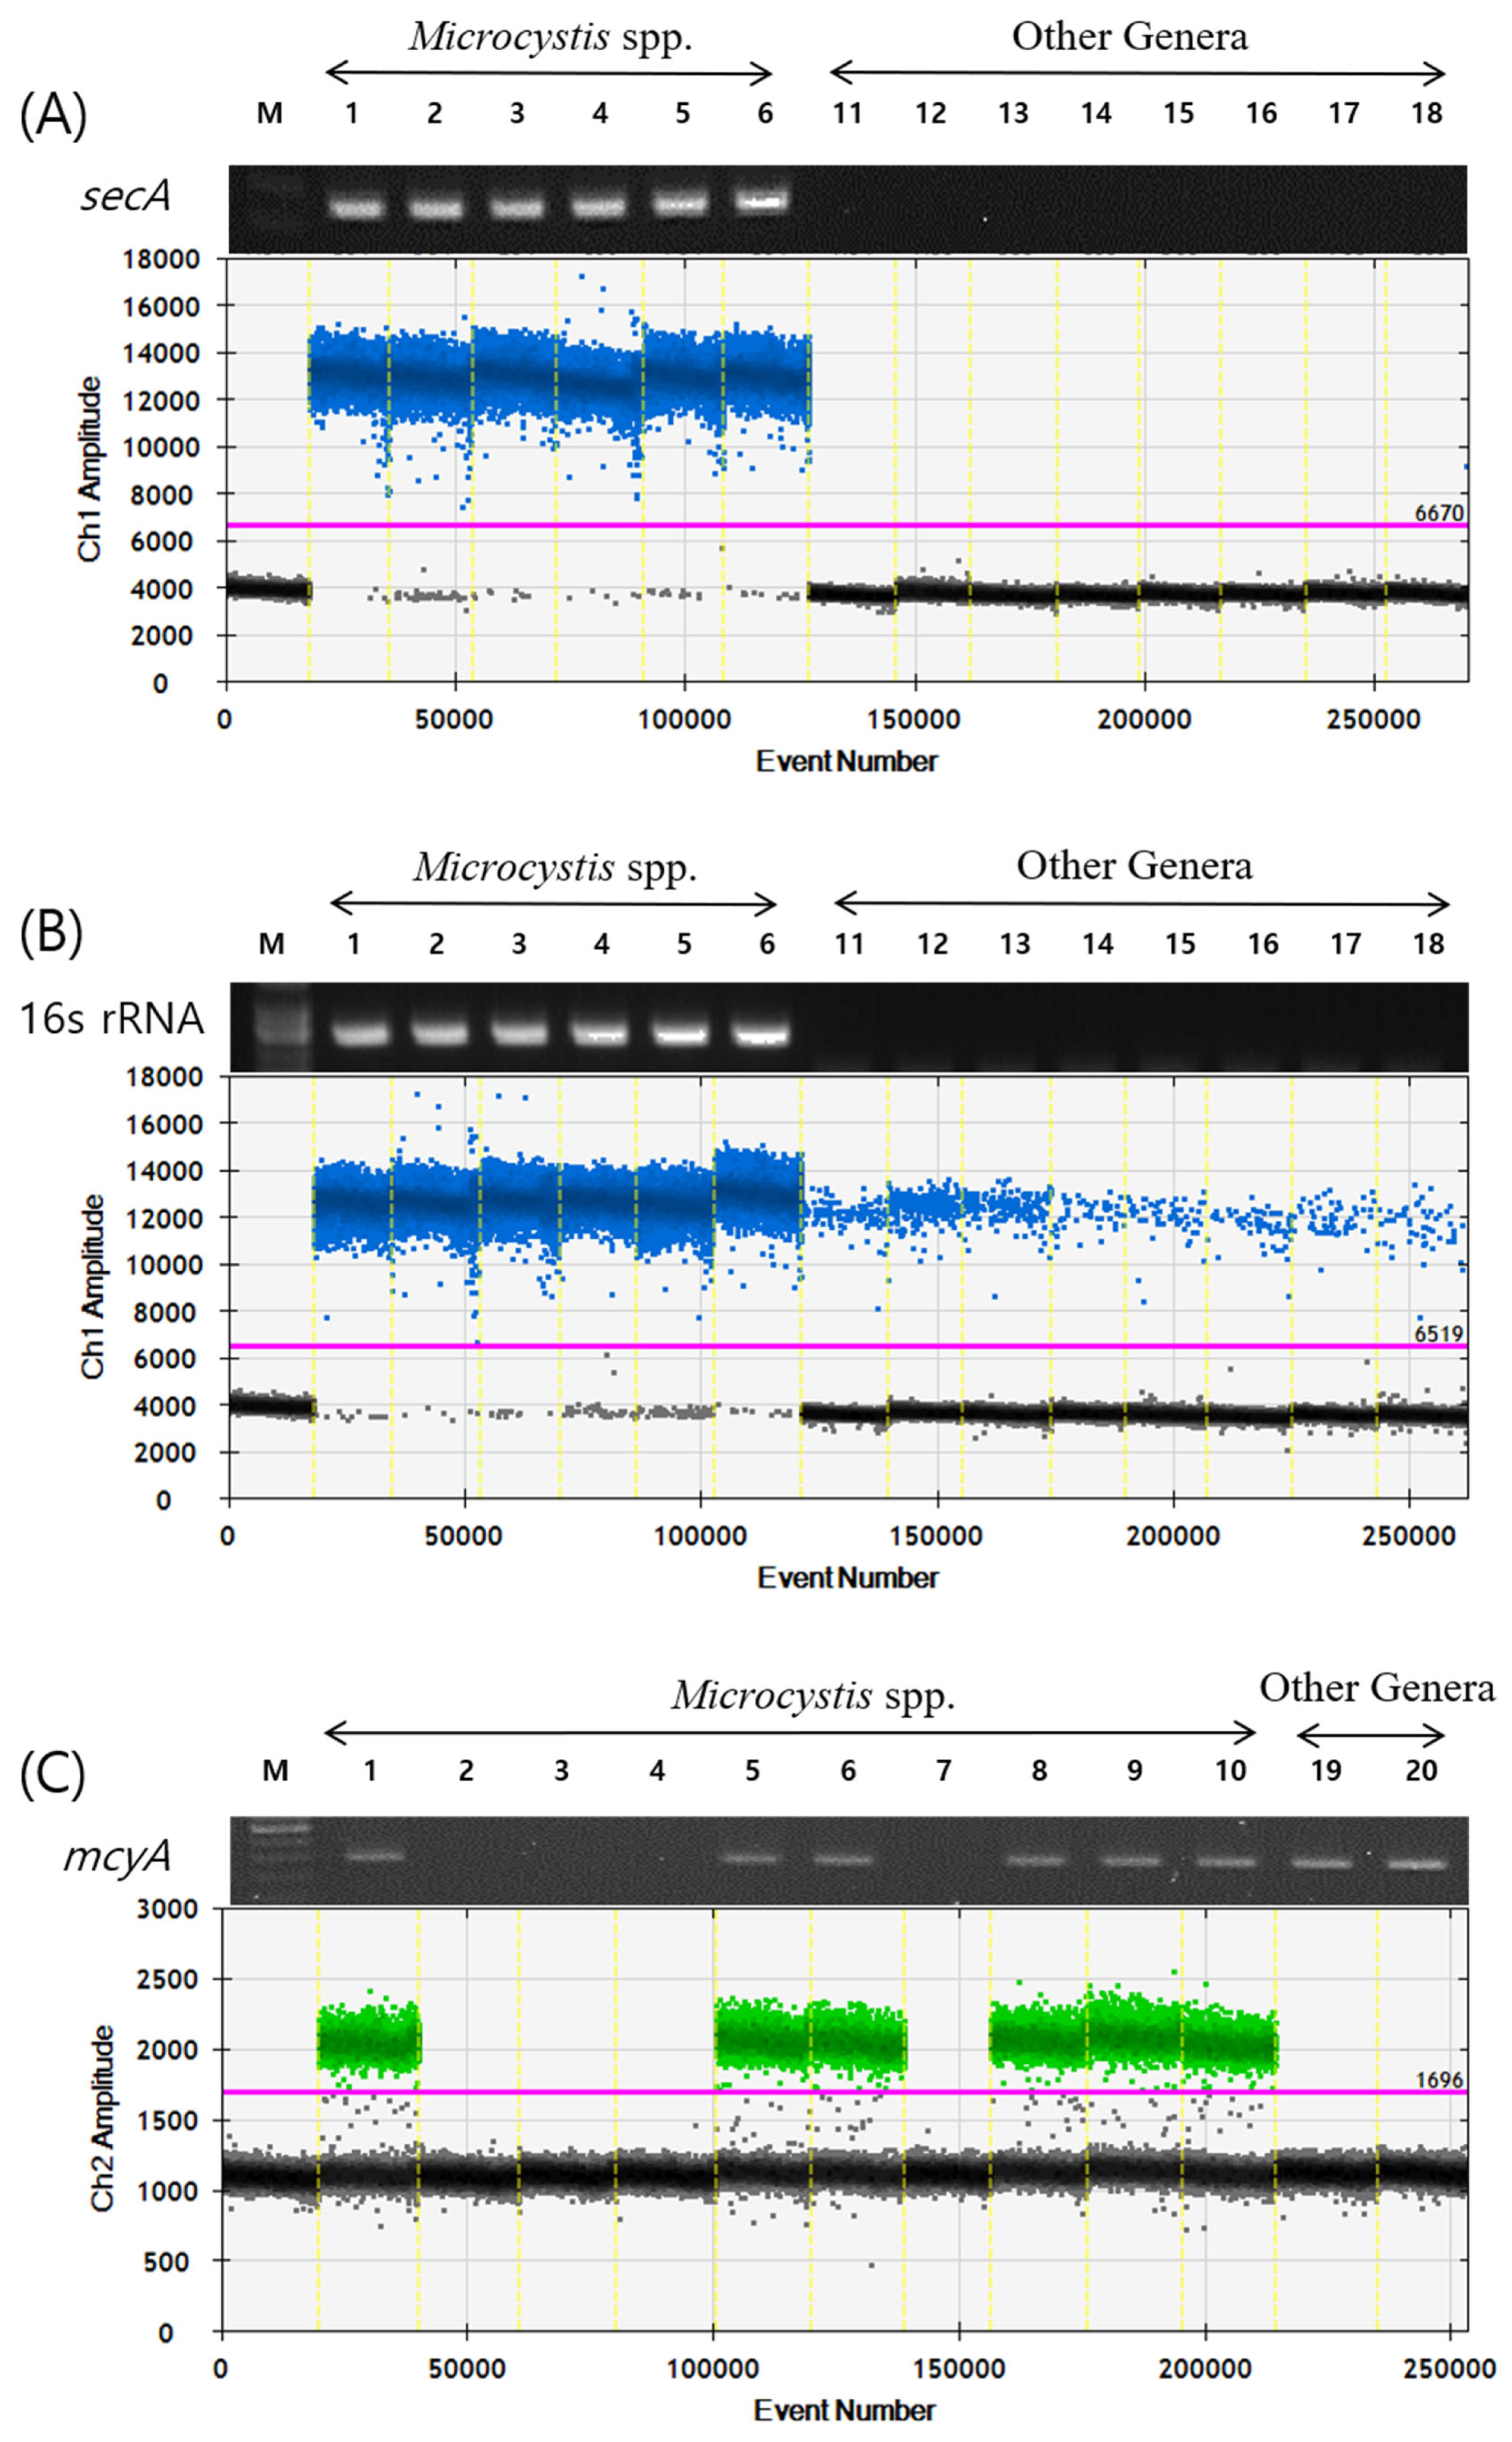
2.1. Verification of secA and mcyA ddPCR Primers and Probes

The primers and probes were designed to specifically detect Microcystis spp. (Table 1). The secA gene, a component of the secYEG protein translocation channel in the cell membrane, was selected as the target for Microcystis-specific primer design [55]. To verify the genus-level specificity, both conventional PCR and ddPCR analyses were conducted using DNA from Microcystis and other cyanobacterial species. These included species of the same order (Chroococcales), such as Aphanocapsa sp. and Synechococcus sp., as well as species from different orders, including Aphanizomenon flos-aquae, Dolichospermum planctonicum, Sphaerospermopsis aphanizomenoides, Cuspidothrix issatchenkoi, Cylindrospermopsis raciborskii, and Geitlerinema amphibium. The results confirmed that the primers and probe reacted specifically with the genus Microcystis (Figure 1A). In contrast, the previously reported 16S rRNA gene primers and probe used in qPCR [56] yielded false-positive signals in non-Microcystis genera, demonstrating their lack of specificity for ddPCR analysis (Figure 1B).
Based on previously reported universal mcyA primers [57], we designed Microcystis-specific mcyA ddPCR primers and a probe set. While the universal mcyA primers amplified PCR products in all microcystin-producing cyanobacteria regardless of genus, the newly designed ddPCR primers and probe yielded positive signals exclusively in Microcystis strains that produce microcystins. No positive signals were observed in Dolichospermum flos-aquae, or Planktothrix agardhii, although these species produce microcystins, indicating the high specificity of the newly developed primers and probe for Microcystis-derived mcyA (Figure 1C).

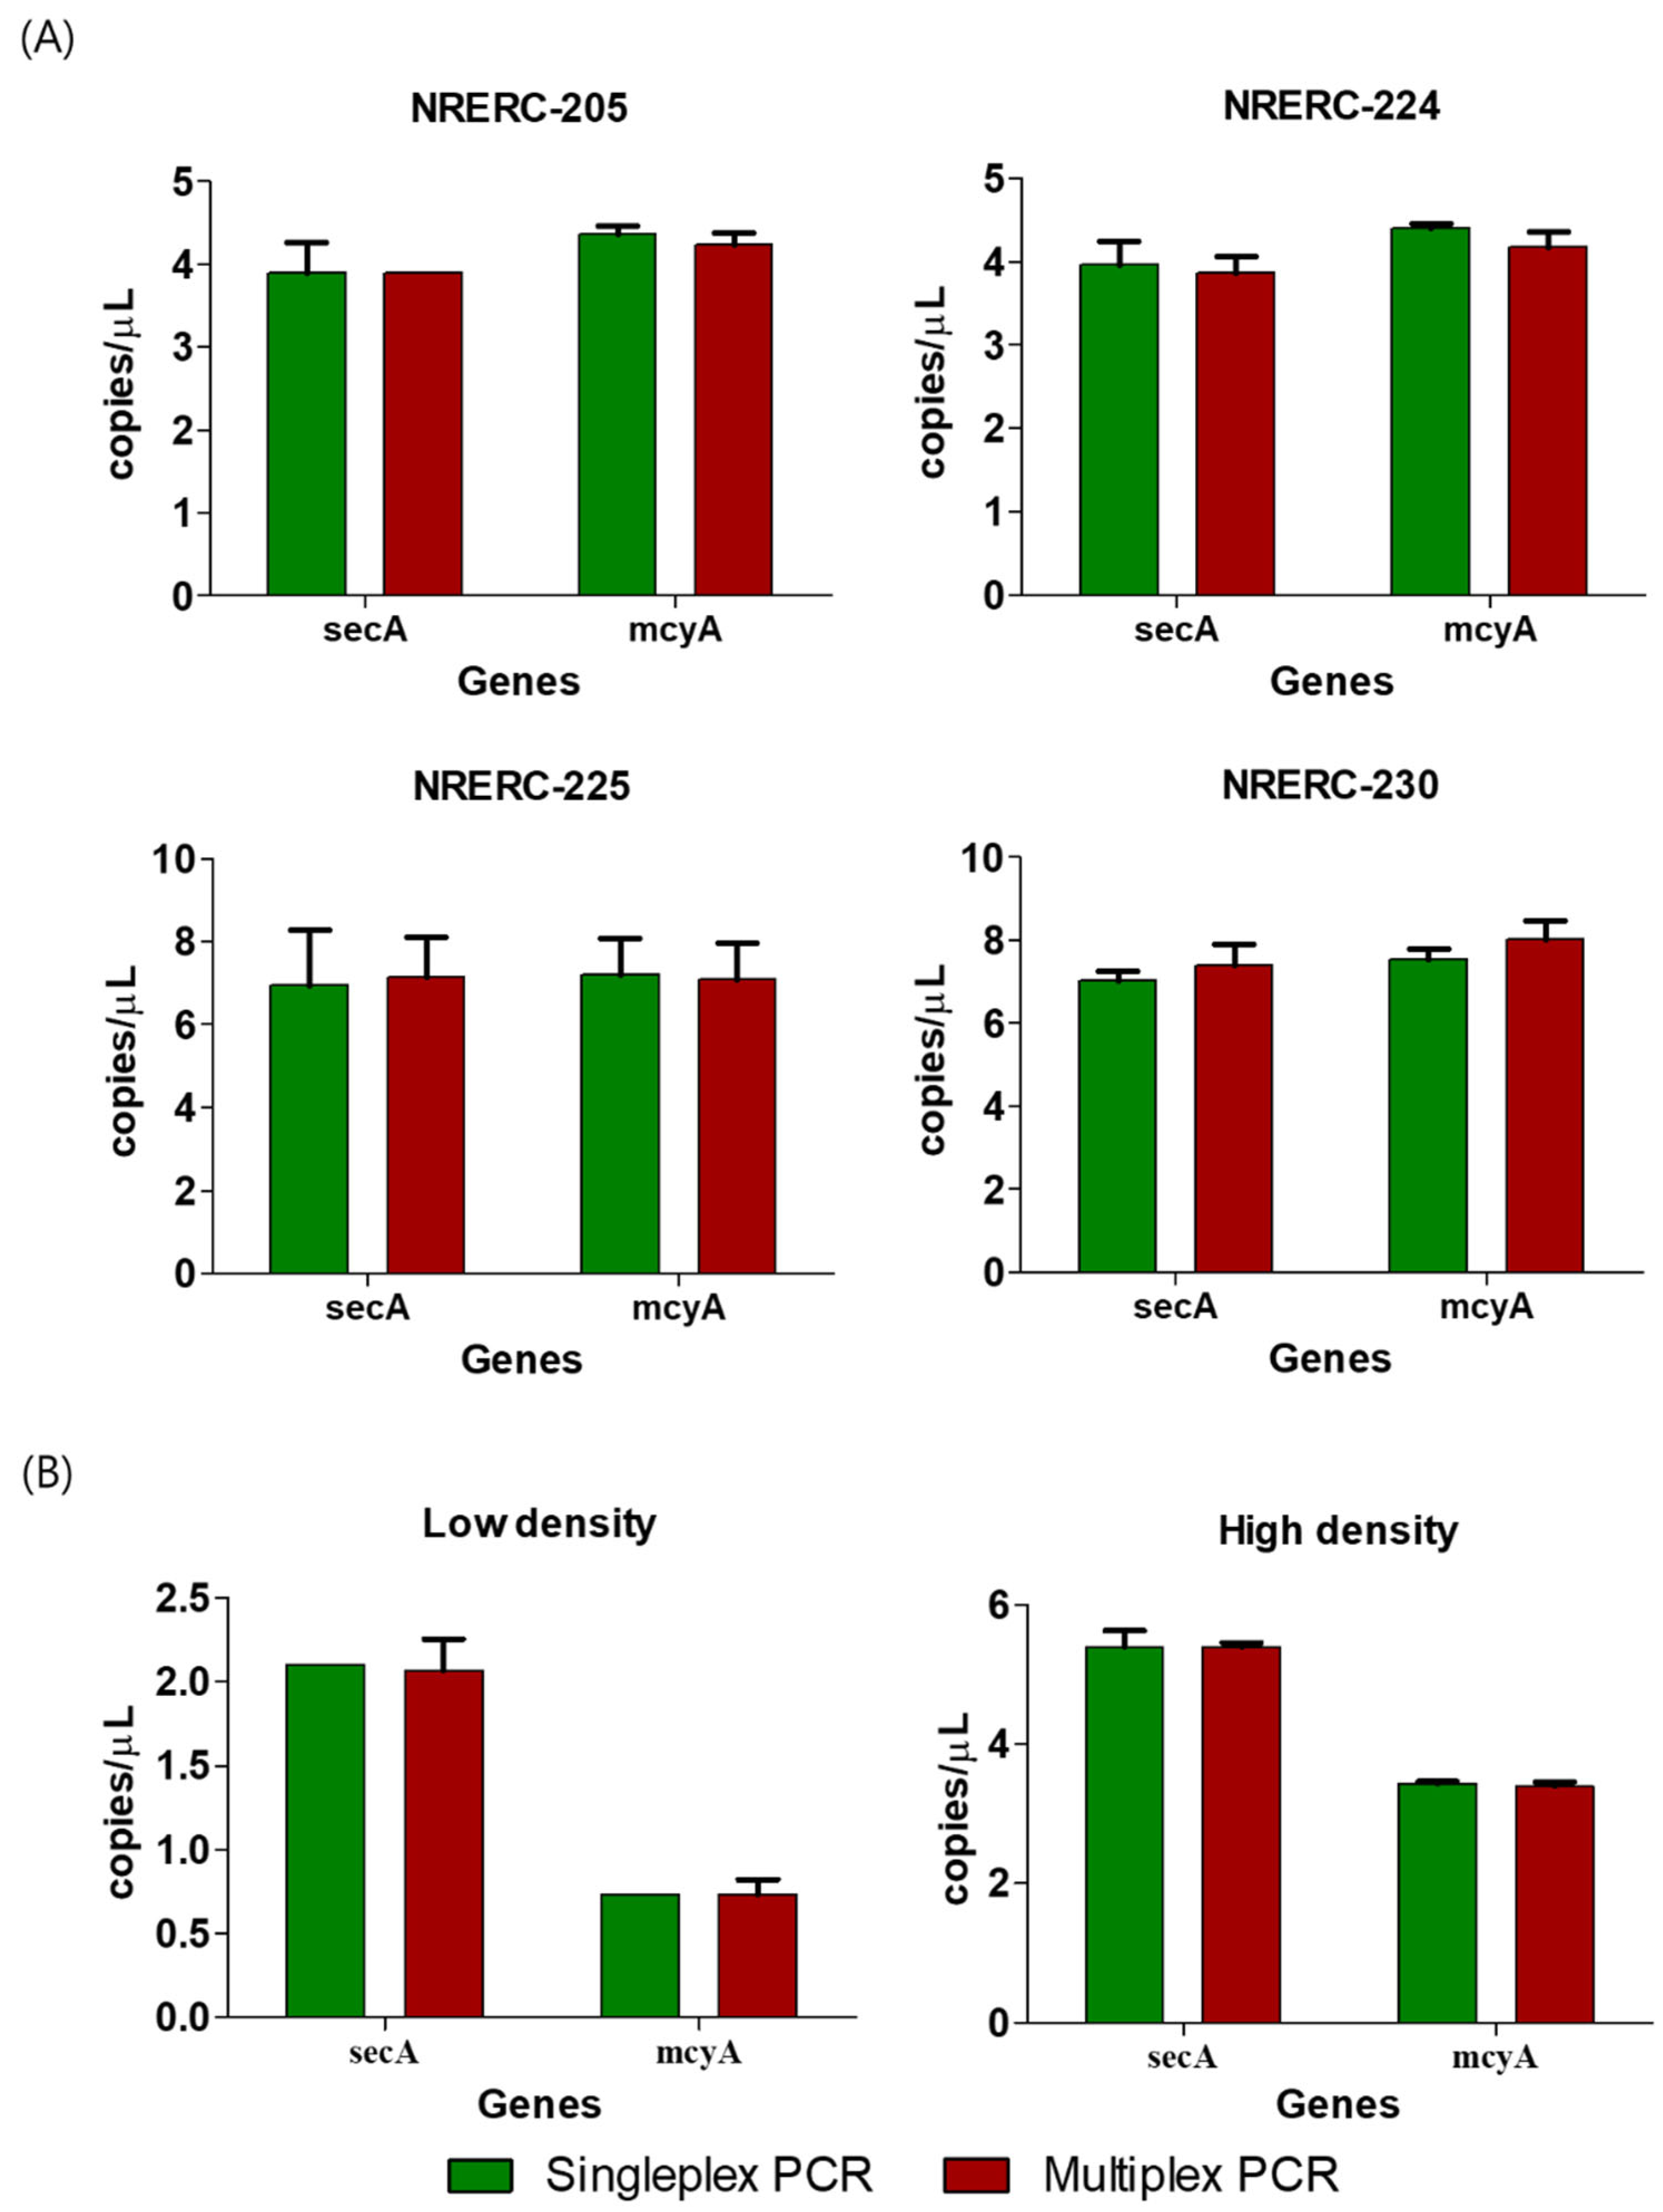
2.2. Comparison of Sensitivity Between secA and mcyA Singleplex and Multiplex PCR Using ddPCR

To verify whether the designed primer and probe sets could be used simultaneously in a multiplex ddPCR analysis, both secA and mcyA genes were analyzed independently (singleplex) and concurrently (multiplex) using ddPCR in toxic Microcystis strains isolated from the Korean rivers. The secA probe was labeled with fluorescein amidite (FAM), and the mcyA probe was labeled with hexachlorofluorescein (HEX), enabling dual-channel detection. In singleplex ddPCR analysis of four toxic Microcystis strains (M. flos-aquae [NRERC-205], M. viridis [NRERC-224], M. novacekii [NRERC-225], and M. aeruginosa [NRERC-230]), secA gene copy numbers ranged from 3.9 to 7.0 copies/μL (mean: 5.5 copies/μL), while mcyA gene copy numbers ranged from 4.4 to 7.5 copies/μL (mean: 5.9 copies/μL), with variation among strains. In multiplex ddPCR, secA gene copy numbers ranged from 3.9 to 7.4 copies/μL (mean: 5.6 copies/μL), while mcyA gene values ranged from 4.2 to 8.0 copies/μL (mean: 5.9 copies/μL). The results of the multiplex PCR were almost identical to those of the singleplex PCR, indicating that the two primer and probe sets for secA and mcyA did not interfere with each other in multiplex PCR and could be stably measured (Figure 2A).
To assess field applicability, water samples with low and high Microcystis cell densities were selected from CH site in 2022 based on microscopic counts. The low-density sample (860 cells/mL) was collected on 23 May 2022 and the high-density sample (131,000 cells/mL) on 8 August 2022. These samples were diluted to below the detection threshold and analyzed using both singleplex and multiplex ddPCR, as with the cultured strains. In the singleplex PCR analysis, the secA and mcyA gene copies in the low-density sample were 1.8–2.4 and 0.6–0.8 copies/μL, with averages of 2.1 and 0.7 copies/μL, respectively. In the high-density sample, the secA and mcyA gene numbers were 5.0–5.4 and 3.4–3.5 copies/μL, with averages of 5.4 and 3.4 copies/μL, respectively. Similar values were obtained from the multiplex ddPCR analysis: the secA and mcyA gene copy numbers were 1.7–2.3 and 0.6–0.9 copies/μL (mean: 2.1 and 0.7 copies/μL), in the low-density sample and 5.3–5.5 and 3.3–3.5 copies/μL (mean: 5.4 and 3.4 copies/μL) in the high-density sample, respectively. These results further confirmed that both primer/probe sets were reliable and compatible for multiplex ddPCR in both cultured and environmental samples (Figure 2B).

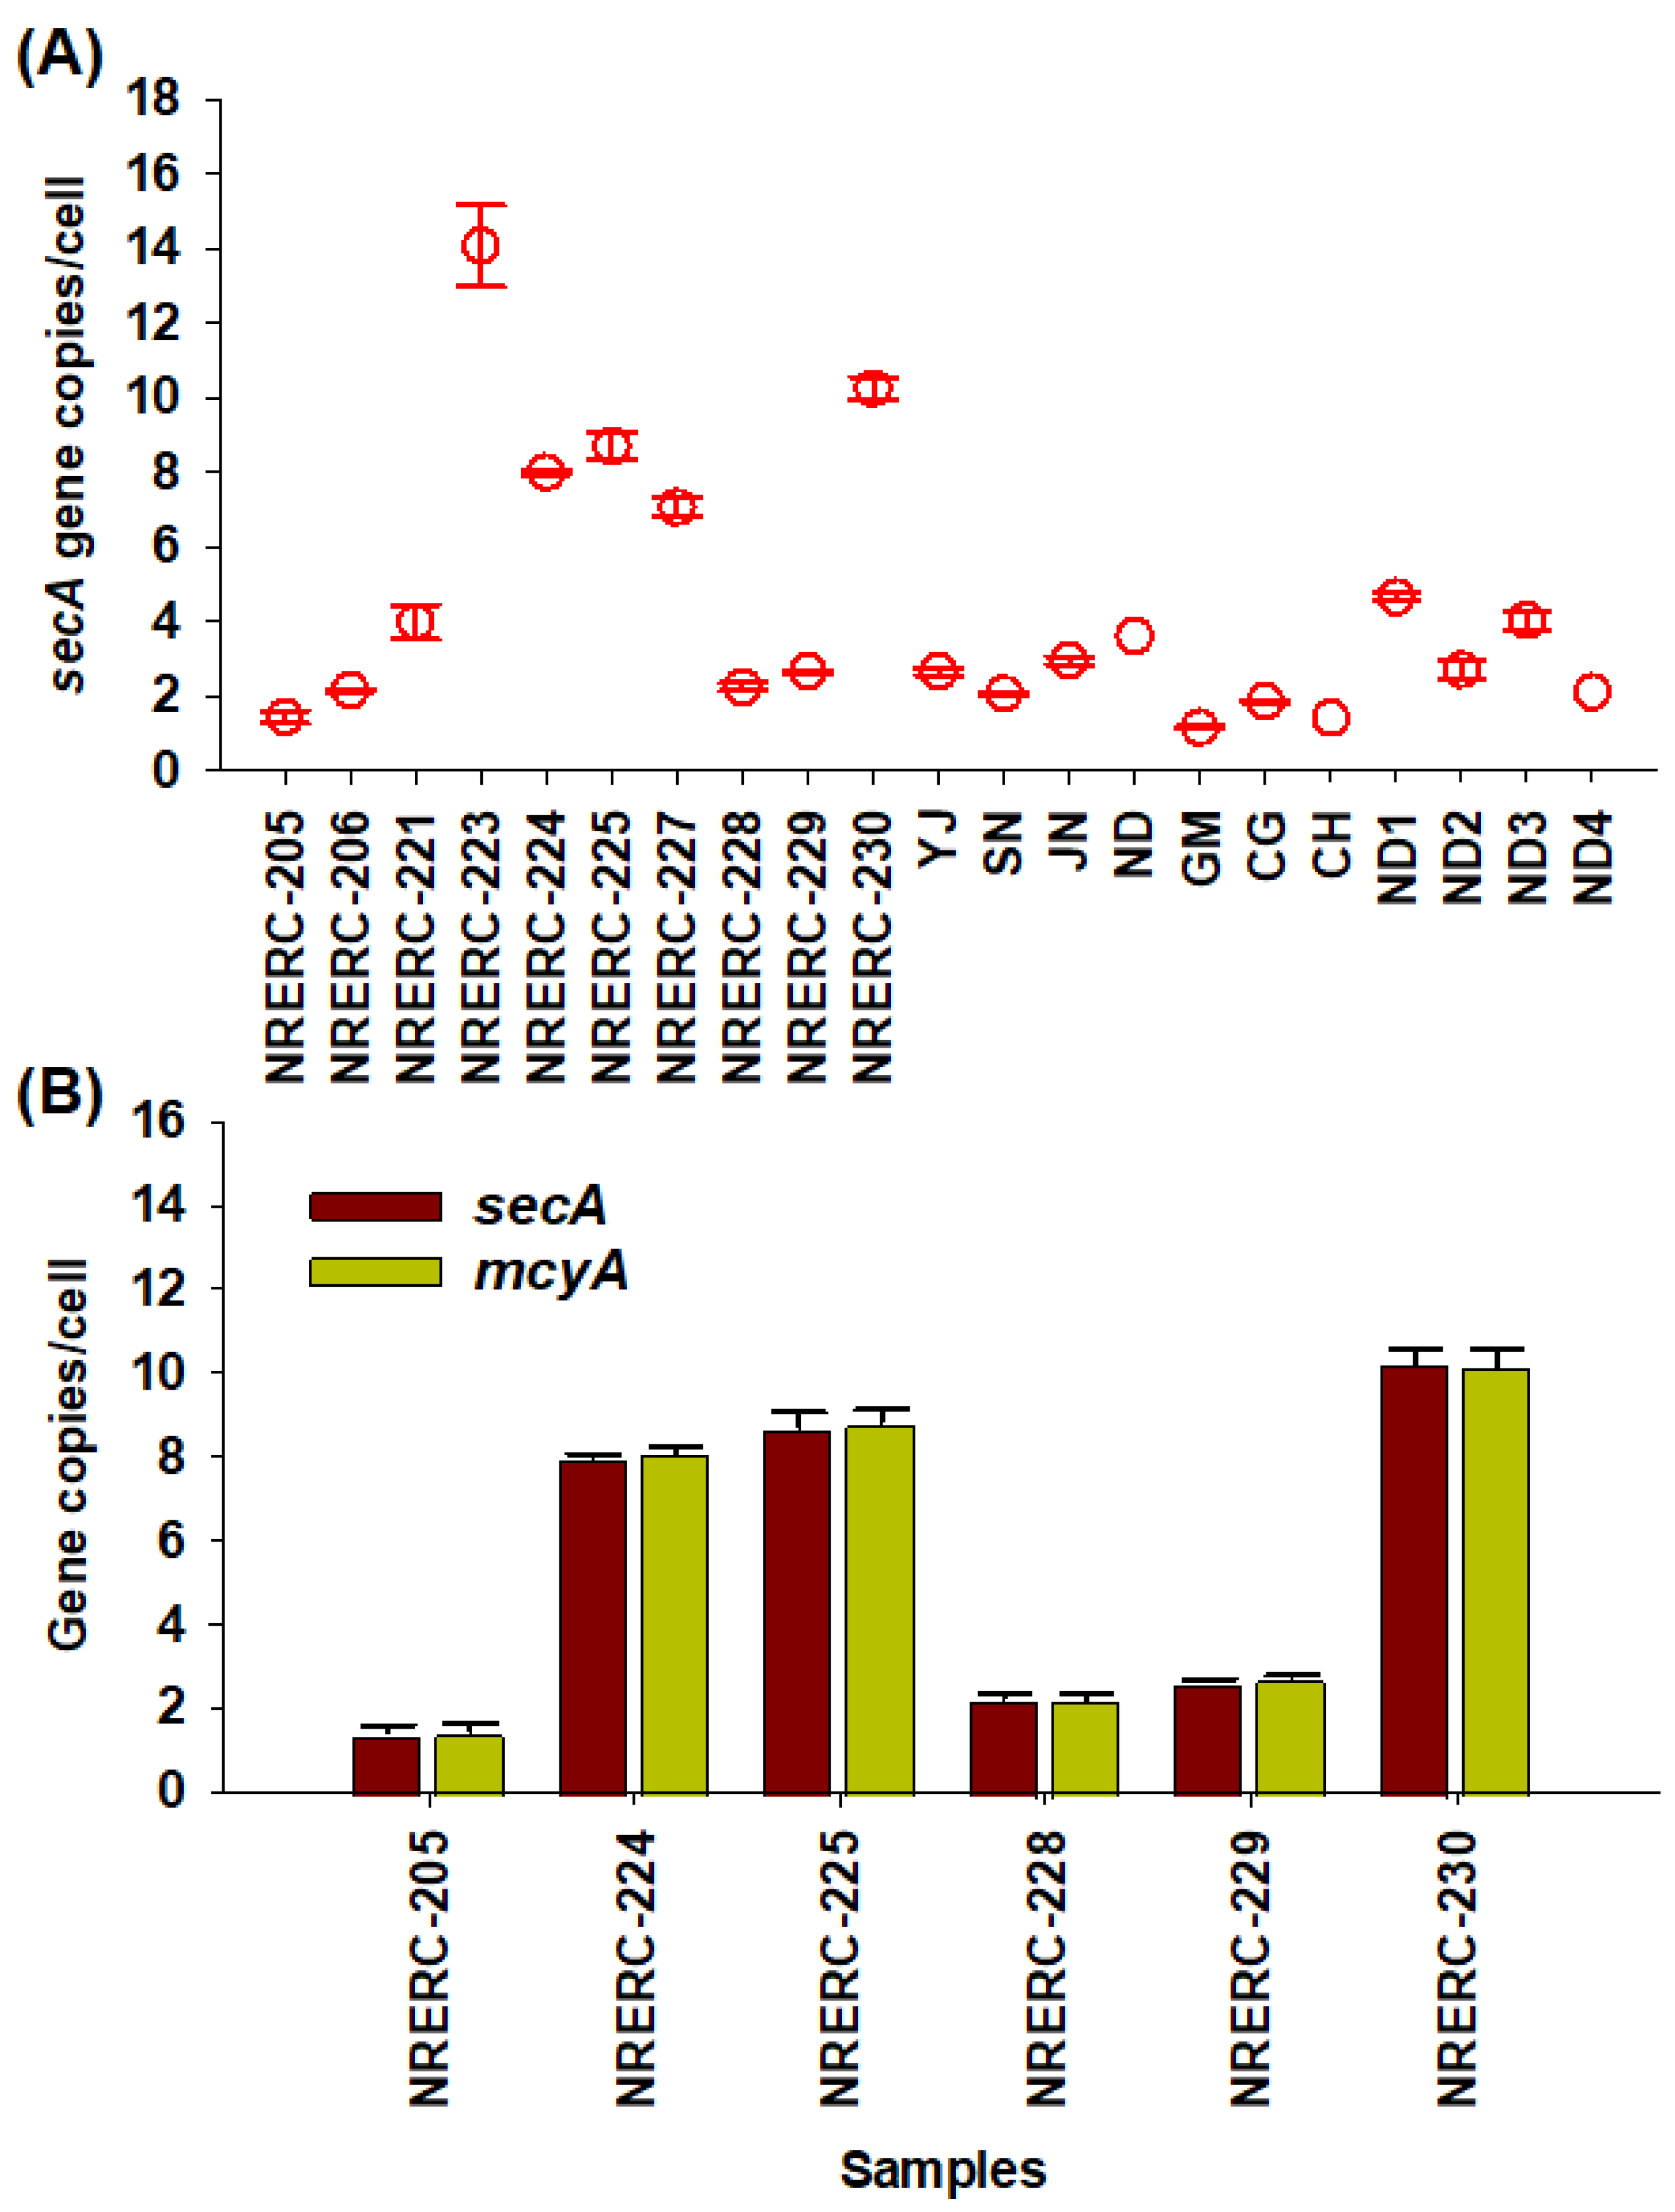
2.3. Copy Number per Cell of secA and mcyA Genes in Microcystis Cells

The copy number of the secA gene per cell was determined using sub-cultured Microcystis strains isolated from the Nakdong River. The values ranged from 1.1 to 16.4 copies/cell, with an average of 7.1 copies/cell. Average copy numbers per cell by strain were as follows: M. aeruginosa, 7.8; M. flos-aquae, 2.0; M. ichthyoblabe, 2.2; M. wesenbergii, 14.1; M. viridis, 7.3; and M. novacekii, 8.7 copies/cell. These results showed differences between species, with M. wesenbergii exhibiting significantly higher copy numbers (10.4–16.5 copies/cell) compared to other species. Variation was also observed among strains of the same species—for example, M. aeruginosa NRERC-221 had an average of 4.0 copies/cell, whereas NRERC-230 had 10.3 copies/cell. In contrast, M. viridis NRERC-224 and NRERC-227 showed similar copy numbers (8.0 and 7.1 copies/cell, respectively). In mixed field populations of Microcystis collected from the Nakdong River basin, the secA gene copy number per cell was more consistent, ranging from 1.1 to 4.8 copies/cell, with an average of 2.8 copies/cell (Figure 3A).
Among toxigenic Microcystis strains, the average copy number per cell of the secA gene was 6.3 copies/cell, while the mcyA gene copy number averaged 6.3 copies/cell (ranging 1.1–11.6 copies/cell). Although variability was observed among strains, secA and mcyA gene copy numbers per cell were identical within each toxigenic strain (Figure 3B). Since toxigenic and non-toxigenic cells were mixed in the mixed field populations of Microcystis from the Nakdong River, it was not possible to separately count the cell number of toxigenic cells and, thus, the mcyA gene copy number per cell could not be calculated.

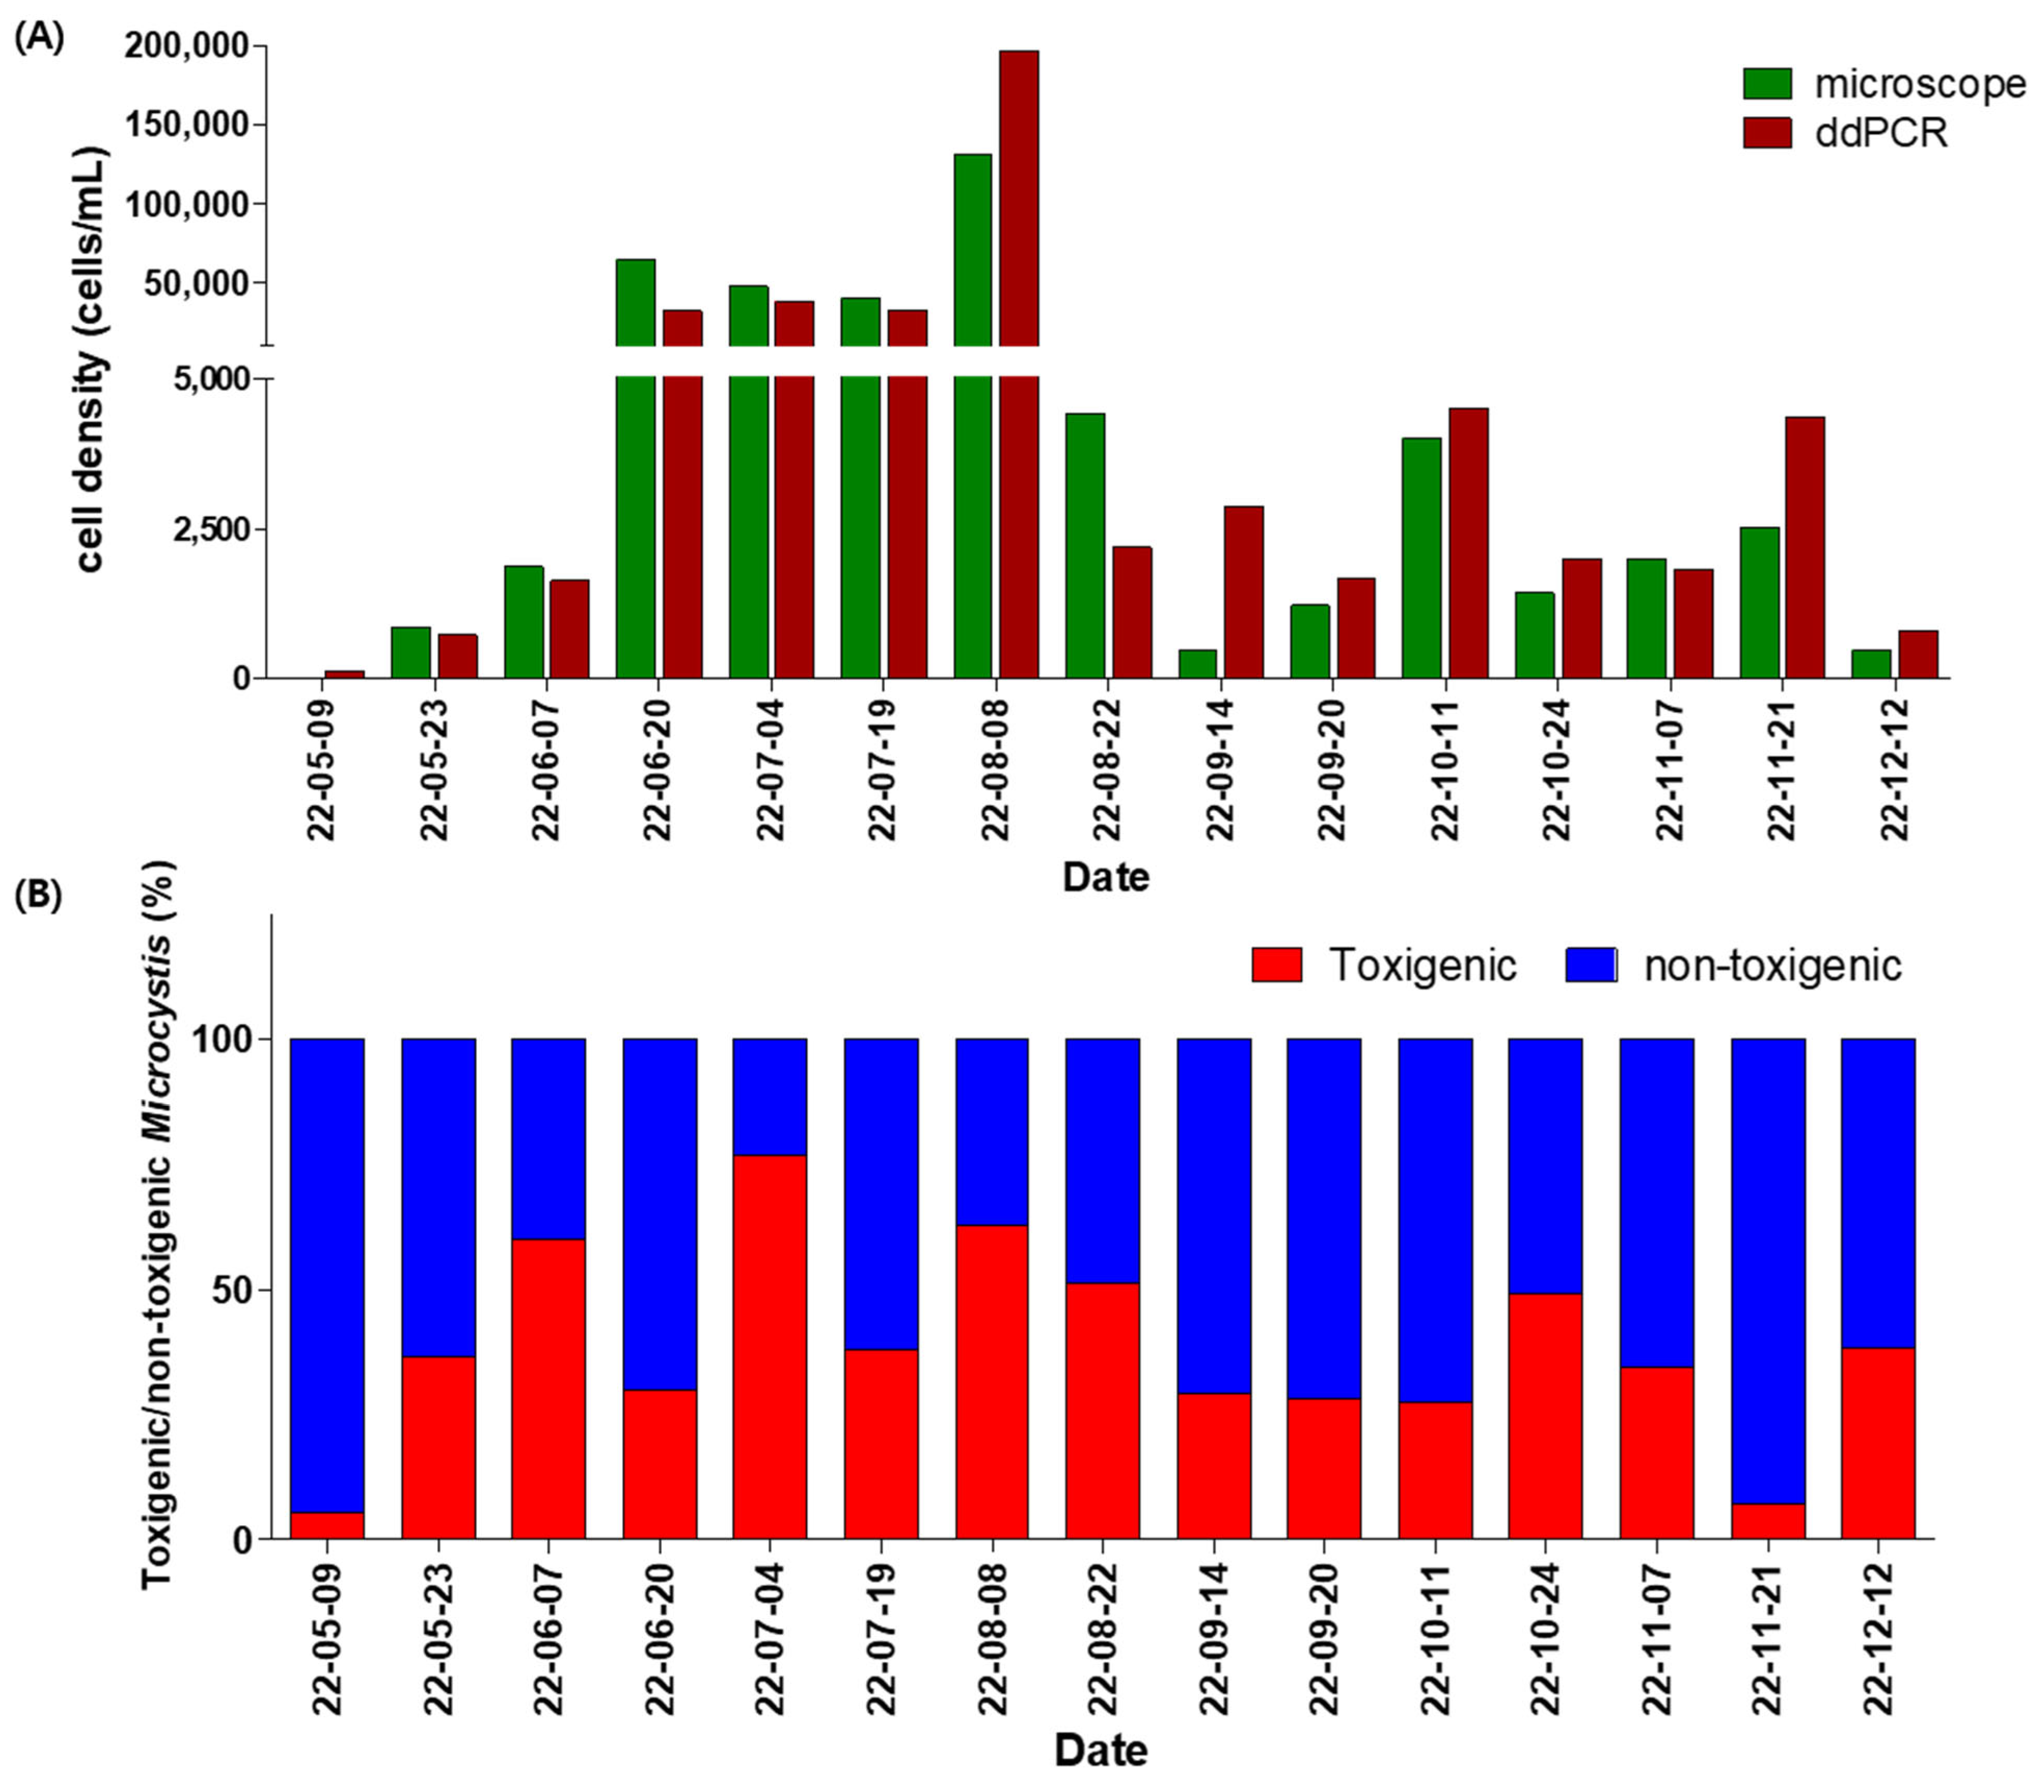
2.4. Comparison Between Microscopic Analysis and Genetic Quantification of Field Samples

From May to December 2022, water samples were collected twice a month from CH site in the Nakdong River, and Microcystis cell densities were measured microscopically. The cell densities ranged from 465 to 131,000 cells/mL. Microcystis first appeared in late May with rising water temperatures, followed by a significant increase in late June. Cell density slightly decreased during the rainy season but reached its peak in early August. After mid-August, heavy rainfall and typhoons led to a rapid decline that persisted through December. Regarding the dominance of species within the Microcystis genus, M. aeruginosa was the dominant species for most of the monitoring period; however, M. wesenbergii was dominant on 19 July and 7 November, while M. viridis was subdominant (>30%) on 7 June and 4 July (Figure 4A and Table 2).
Simultaneously, secA and mcyA gene copy numbers were measured using ddPCR, and converted to cell densities to estimate total Microcystis (secA gene) and toxigenic Microcystis (mcyA gene) cell densities. For this, a conversion factor of 2.8 copies/cell—derived from the average secA gene copy number per cell (2.8) in mixed field populations of Microcystis collected from the Nakdong River—was applied. The estimated total Microcystis cell density based on the secA gene copy number ranged from 136 to 196,198 cells/mL. Comparison between genetic and microscopic analyses yielded a coefficient of variation ranging from 7.0 to 102.4% (mean: 37.0%). For samples exceeding 10,000 cells/mL, the variation was lower, ranging from 16.4 to 47.3% (mean: 26.5%). Nonetheless, the temporal trends in cell density were consistent between methods, that is, the increase period and decrease period of the ddPCR estimate corresponded with the microscopic count. Additionally, the secA gene was detected in the May 9 sample—prior to visible detection by microscopy—at an estimated 136 cells/mL (Figure 4A).
Because the field samples contained a mixture of toxigenic and non-toxigenic Microcystis, the mcyA copy number per toxigenic cell could not be independently determined. Therefore, the same 2.8 copies/cell conversion factor was applied to mcyA, based on the 1:1 ratio of secA versus mcyA genes observed in cultured toxigenic strains (Figure 3B). The proportion of toxigenic Microcystis cells ranged from 5.2% (7 cells/mL) to 76.9% (29,066 cells/mL), with an average of 38.3%. Among the 15 samples, toxigenic Microcystis were dominant (>50%) in only four samples (27%), while non-toxigenic Microcystis predominated in the rest. The relative abundance of toxigenic Microcystis was relatively high during the summer bloom period (60.0% on 7 June, 76.9% on 4 July, 63.0% on 8 August, and 51.3% on 22 August), but declined in autumn following heavy rains, causing a sharp decline in the total cell density (Figure 4B).

3. Discussion

In this study, we developed a ddPCR-based gene quantification method to estimate the biomass of total Microcystis as well as toxigenic Microcystis genotypes. Previous studies have proposed several gene targets for the quantification of total Microcystis, including 16S rRNA, 16S–23S ITS, and cpcBA [47,58]. However, when we applied the primers and probe targeting 16S rRNA—commonly used in quantitative PCR (qPCR) analyses—to ddPCR, we observed non-specific amplification in other cyanobacterial genera. This result underscored the need for a new gene target capable of specifically detecting Microcystis. After reviewing the NCBI database and relevant studies, we selected the secA gene, which encodes a key component of the protein translocation system and regulates the function of the secYEG channel through ATPase activity. The secA gene has been employed as a supplementary marker for detecting and classifying pathogenic bacteria such as Phytoplasma [59,60,61]. The primers and probes that we designed for secA exhibited high sensitivity and specificity, reacting exclusively with Microcystis while eliminating the non-specific amplification observed with 16S rRNA primers (Figure 1B). These results suggest that the secA is a reliable genetic marker for detecting and quantifying Microcystis within mixed cyanobacterial communities.
Meanwhile, microcystins are known to be produced not only by Microcystis but also by other cyanobacterial genera such as Dolichospermum, Aphanizomenon, and Planktothrix [7]. To assess microcystin production, previous studies have widely targeted genes involved in ADDA synthesis, such as mcyE, as well as other genes within the microcystin biosynthesis cluster [26,43,62,63]. In this study, we selected mcyA, which is located in a different region of the open reading frame and is involved in the structural variation in microcystin residues [27]. The primers and probe that we designed for mcyA produced positive signals in all toxigenic Microcystis strains that were confirmed to produce microcystins by ELISA analysis, while no signals were observed in non-toxigenic strains. Furthermore, no amplification was observed in toxigenic Dolichospermum and Planktothrix strains, confirming the specificity of mcyA-based detection for Microcystis (Figure 1C). Thus, the mcyA primers/probe set developed in this study can be effectively used to estimate the biomass of toxigenic Microcystis and identify microcystin-producing genera within complex cyanobacterial communities. However, detecting a single gene, such as mcyA or mcyE, may not be sufficient to definitively confirm microcystin production. Future studies should consider the inclusion of additional genes in the microcystin biosynthesis cluster, such as mcyB, mcyC, and mcyD, to improve the accuracy of toxin production assessments.
The ddPCR has gained attention as a novel and precise method for detecting and quantifying cyanobacteria, providing higher accuracy and reproducibility than qPCR [40,48,54,64,65,66,67]. Zhang et al. (2014) [62] used qPCR to analyze the abundance of Microcystis spp. and Cylindrospermopsis raciborskii in aquatic environments, reporting a detection limit of 1 × 10³ cells/mL for Microcystis spp. While their qPCR-based quantification results aligned well with microscopic observations, they noted limited sensitivity of qPCR for low-concentration samples. Similarly, Te et al. (2015) [40] compared qPCR and ddPCR, concluding that ddPCR was more suitable for environmental sample analysis. According to their findings, the limit of detection (LOD) for Microcystis spp. was 8.5 × 10⁶ copies/reaction in qPCR, whereas ddPCR achieved a significantly lower LOD of 3.52 copies/reaction. The ddPCR also exhibited greater resistance to background noise from other species, allowing accurate quantification even at low target gene concentrations. Moreover, ddPCR is well-suited for multiplex PCR applications, enabling the simultaneous detection of multiple target genes within a single sample. This feature reduces the analysis time and cost while maintaining accuracy, making ddPCR an efficient tool for cyanobacterial studies [65,66,67]. In this study, we developed a multiplex ddPCR assay that simultaneously quantifies total and toxigenic Microcystis, thereby enabling rapid biomass estimation of both toxigenic and non-toxigenic genotypes.
Notably, we observed significant variations in the secA gene copy number per cell across different Microcystis strains. Similar variability has been reported in Sphaerospermopsis quantification using the rbcLX gene [41] and other cyanobacterial gene copy number analyses based on qPCR [68,69]. These differences were also observed in the environmental samples, suggesting that gene copy number may reflect the strain composition in natural populations influenced by environmental conditions such as nutrient availability and light intensity. This variability may reflect adaptive strategies, where specific strains dominate under certain environmental conditions. Previous studies have also noted such variations in gene copy numbers among both freshwater and marine cyanobacteria [68,69,70,71,72,73]. For example, Griese et al. (2011) demonstrated the growth-stage-dependent regulation of gene copy numbers in Synechocystis sp. PCC6803 [74], while Riaz et al. (2021) reported the precise regulation of gene copy numbers in Thermosynechococcus elongatus E542 in response to growth stage and nutrient availability [69]. These findings indicate that cyanobacteria can exhibit monoploid, oligoploid, or polyploid states as part of their response to external stressors [73,74]. Notably, the variability in gene copy number per cell in mixed Microcystis populations was smaller than that observed among individual strains. This suggests that while the gene copy number variability may limit the accuracy of estimating cell counts from gene copy numbers, such limitations could be overcome through further research involving diverse environmental samples.
Interestingly, the copy numbers of secA and mcyA remained consistent across toxigenic Microcystis genotypes, regardless of strain-specific variation. This may imply a strong regulatory linkage between these genes, possibly reflecting a balance between cellular metabolism and toxin biosynthesis. Since secA is involved in protein translocation and mcyA in microcystin biosynthesis, coordinated copy number regulation may indicate an intrinsic connection. However, this hypothesis remains speculative, as no other studies to date have explicitly confirmed this relationship. Further investigation is needed to explore strain-specific gene expression patterns and adaptive mechanisms.
When we estimated the Microcystis cell density from the gene analysis results of field samples collected from the CH station using the average secA gene copy number per cell obtained from mixed Microcystis populations from the Nakdong River system, the results mirrored seasonal trends observed in microscopic counts, although the absolute values differed. This discrepancy may arise from temporal variations in Microcystis species composition, growth stages, and environmental factors affecting gene copy numbers per cell. Nevertheless, the trend similarity suggests that genus-specific genetic quantification analysis holds great potential for estimating Microcystis biomass.
Furthermore, using the mcyA gene copy number measured by ddPCR, we estimated that toxigenic Microcystis comprised approximately 38% of the total Microcystis population. This implies that health risks from toxins during Microcystis blooms in the field may be significantly lower than what would be estimated based on microscopic analysis alone. Additionally, the proportion of toxigenic Microcystis increased during the warmer summer months, suggesting that the developed genetic method is well-suited for investigating environmental factors influencing toxigenic genotype dominance.
Importantly, secA gene detection in spring samples—where microscopic analysis failed to identify Microcystis—demonstrates that ddPCR can detect Microcystis even at extremely low cell densities during early bloom stages. This is crucial for managing toxic bloom development. Unlike filamentous cyanobacteria, which form filaments of a few to dozens of cells, Microcystis typically forms colonies of several to hundreds of cells. This has significant implications for managing toxic blooms, as Microcystis often exists in less than one colony of a few to several dozen cells per milliliter during the early bloom stages, making early-stage detection challenging via microscopy. The ability to detect toxigenic genotypes at trace levels well before bloom development is crucial for timely risk assessment and water quality management.
The production of microcystins plays a key role in Microcystis survival and environmental adaptation, with toxin gene expression being regulated by temperature, nutrient availability, pH, and light intensity [75,76,77,78]. Studies have shown that Microcystis growth rates and microcystin synthesis increase at higher temperatures [75], while high phosphorus levels favor toxigenic Microcystis dominance [76]. Additionally, alkaline pH (8–9) enhances toxin gene expression [77], and UV stress induces microcystin biosynthesis [78]. Given these findings, climate change and eutrophication may prolong toxigenic genotype dominance, further emphasizing the need for proactive management strategies.
The World Health Organization (WHO) recommends the Alert Levels Framework (ALF) for managing cyanobacterial risks in drinking and recreational water [7,32]. Conventional microscopic counting is time consuming, labor intensive, highly dependent on analyst expertise, and unable to distinguish between toxigenic and non-toxigenic strains. In contrast, the ddPCR-based approach developed in this study enables the rapid, sensitive detection of Microcystis, even at low concentrations, making it highly advantageous for early warning systems. Furthermore, the simultaneous analysis of secA and mcyA genes enables estimation of the proportion of toxigenic genotypes within Microcystis populations, providing valuable insights for cyanobacterial toxin management.

4. Conclusions

In this study, we developed a ddPCR-based genetic method for the simultaneous quantification of total and toxigenic Microcystis in freshwater environments. Targeting the secA gene, which is specific to the Microcystis genus and the mcyA gene, associated with microcystin biosynthesis, we demonstrated the method’s high specificity and sensitivity through both laboratory validation and field application.
The developed multiplex ddPCR assay successfully quantified both secA and mcyA gene copy numbers in environmental samples without cross-interference between the target genes. This method allows for the simultaneous detection and quantification of total and toxic Microcystis, which can produce microcystins. Estimated cell densities derived from gene copy numbers were consistent with trends observed in microscopic counts, while ddPCR exhibited superior sensitivity, detecting Microcystis even at low cell densities undetectable by microscopy.
This ddPCR-based method provides a sensitive and efficient tool for monitoring Microcystis blooms and distinguishing between toxigenic and non-toxigenic populations. This method can complement existing monitoring technologies such as microscopy and LC–MS/MS, offering a faster and more efficient approach for providing an early warning, managing water resources, and mitigating the risks posed by Microcystis.

5. Materials and Methods

5.1. Cyanobacterial Strains and Culture Conditions

To develop Microcystis-specific gene primers, six species and ten strains of Microcystis—Microcystis flos-aquae, M. ichthyoblabe, M. aeruginosa, M. wesenbergii, M. viridis, and M. novacekii—were used as positive controls. All strains were isolated from Korean rivers and lakes and maintained through sub-culturing. Among them, six strains were toxigenic (microcystin-producing) and four were non-toxigenic (Table 3).
As negative controls, strains from the orders Nostocales and Oscillatoriales—including Aphanizomenon flos-aquae, Cylindrospermopsis raciborskii, Dolichospermum planctonicum, Sphaerospermopsis aphanizomenoides, Cuspidothrix issatschenkoi, and Geitlerinema amphimium—were also isolated from the Nakdong River and sub-cultured. Additionally, strains from the order Chroococcales order (Aphanocapsa sp. [AG10016] and Synechococcus sp. [AG20470]) were obtained from the Korean Collection for Type Cultures (KCTC).
To verify the Microcystis specificity of the mcyA gene primers, toxigenic strains of Dolichospermum flos-aquae (NIVA-CYA 656) and Planktothrix agardhii (NIVA-CYA 855) were obtained from the Norwegian Culture Collection of Algae (NORCCA, Oslo, Norway). Microcystis strains possessing the microcystin synthesis gene mcyA were classified as toxigenic Microcystis. All cyanobacterial strains were cultured in CB medium [79] under controlled conditions: 20 °C, light intensity of 40 μEm−2s−1, and 14:10 h light/dark cycle.

5.2. Field Sample Collection and Pretreatment

To calculate the gene copy number per Microcystis cell in natural water bodies, Microcystis colonies were collected from three lake sites (Yeongju Lake [YJ], Sannam Reservoir [SN], and Junam Reservoir [JN]) and eight river sites (Nakdan [ND], Gumi [GM], Chilgok [CG], Changnyeong-Haman [CH], ND1, ND2, ND3, and ND4) along the Nakdong River, a large river flowing toward southern coast of the Republic of Korea [21], between July and August 2024 (Figure 5).
Additionally, to apply the developed ddPCR method to field samples, surface water samples (2 L) were collected twice monthly from May to December 2022 at the CH site of the Nakdong River. Samples were transported to the laboratory at 4 °C. For microscopic analysis, a portion of each sample was transferred to a glass bottle and preserved with Lugol’s iodine solution (final concentration: 0.3%). For genetic analysis, 50 mL of the sample was filtered through a 0.45 μm MicronSep nitrocellulose membrane disk (GVS Life Sciences, Findley, OH, USA) and stored at −80 °C until use.
Microcystis cell density was determined by examining 1 mL of the fixed sample using a Sedgwick-Rafter counting chamber under a phase-contrast microscope (ZEISS, Oberkochen, BW, Germany) at 100–400× magnification. Species identification was based on colony morphology, following references [22] and [80]. Colonies were disrupted using an ultrasonic processor (Sonics Vibra Cell, Sonics and Materials Inc., VCX 750, Newtown, CT, USA) [81] and the number of cells of the resulting cell suspension were counted to calculate cell density (cells/mL).

5.3. DNA Extraction

For genomic DNA extraction, both cultured and environmental samples were filtered through a 0.45 μm MicronSep nitrocellulose membrane disk (GVS Life Sciences, Findley, OH, USA) and stored at −80 °C until use. Genomic DNA was extracted using the DNeasy PowerBiofilm Kit (QIAGEN, Hilden, Germany), following the manufacturer’s instructions. Frozen filters were thawed at room temperature for five minutes prior to extraction. The concentration and purity of the extracted genomic DNA was measured using an Infinite M200 PRO instrument. Extracted DNA was stored at −20 °C until analysis.

5.4. Primer Design and Validation

To develop Microcystis-specific primers, secA gene sequences from major harmful cyanobacteria—including Aphanizomenon, Dolichospermum, Cuspidothrix, and Cylindrospermopsis—as well as from morphologically similar taxa like Aphanocapsa and Synechococcus, were obtained from NCBI GenBank. The collected sequences were aligned using MEGA 6.0 to identify regions unique to Microcystis.
For detection of the mcyA gene, which is involved in microcystin biosynthesis, primers were designed based on sequences from previously validated primer set, ensuring specificity to the Microcystis mcyA gene.
Primers and the probe for ddPCR were designed in accordance with the Bio-Rad Digital Droplet PCR Applications Guide. Specifically, primers were selected to have a GC content of 50–60% and a melting temperature (Tm) between 50 and 65 °C. The probe was designed to have a GC content of 30–80% and a Tm 3–10 °C higher than that of the primers. The amplicon length was maintained at under 250 bp.
The Microcystis-specific primers and probe were validated by comparing the results with those obtained using 16S rRNA-specific primers from previous studies [19], and the Microcystis mcyA-specific primers and probe were compared with analyses of microcystin-producing strains from other genera.

5.5. The ddPCR Analysis

For ddPCR, each reaction mixture was prepared in a final volume of 20 μL comprising 10 μL of ddPCRTM Supermix for Probe (no dUTP) (Bio-Rad Laboratories Inc., Munich, Germany), 0.9 μL each of 10 pmol forward and reverse primers, 0.25 μL of a 10 pmol probe, and 1 μL of the sample DNA, with sterile distilled water used to adjust the final volume. The prepared reaction mixtures were loaded into a 96-well plate and partitioned into approximately 20,000 droplets of ~1 nanoliter each using the Bio-Rad QX200TM Droplet Generator (Bio-Rad Lab Inc., Hercules, CA, USA). The generated droplets were then transferred to a new 96-well plate and subjected to PCR in a T100 Thermal Cycler (Bio-Rad Lab Inc., Hercules, CA, USA). The PCR protocol consisted of an initial denaturation at 95 °C for 10 min, followed by 40 cycles of 95 °C for 30 s and 56 °C for 40 s, with a final hold at 4 °C to complete the reaction.
After amplification, the plate was moved to a Droplet Reader (Bio-Rad Lab Inc., Hercules, CA, USA) to quantify the droplets by measuring the FAM or HEX fluorescence signals. Signal analysis was carried out using QuantaSoftTM software version 1.7.4 (Bio-Rad Laboratories Inc., Hercules, CA, USA). To ensure data reliability, only results with a total droplet count of at least 12,000 were included in the analysis, as recommended by the Bio-Rad Digital Droplet PCR Applications Guide. All ddPCR-related reagents were obtained from Bio-Rad (Bio-Rad Laboratories Inc., USA).

5.6. Calculation of Microcystis Gene Copy Number per Cell Using ddPCR Analysis and Field Application

To calculate the gene copy number per Microcystis cell, cell densities of both cultured monoculture Microcystis strains and a mixed field population were enumerated. Samples containing 1000–20,000 cells were filtered through a 0.45 µm MicronSep nitrocellulose membrane disk (GVS Life Sciences, Findley, OH, USA). The filtered samples underwent genomic DNA extraction followed by ddPCR analysis targeting the gene of interest. Each sample was analyzed in six replicates.
The copy number per cell was calculated using the following formula:
C N = P S × D E C D × V
CN: Gene copy number per cell (copies/cell)
PS: Positive signal per well (copies/μL)
DE: DNA elution volume (μL)
CD: Counted cell density (cells/mL)
V: Filtered volume (mL)
To apply this method to field samples from the CH site (2022), the secA gene and mcyA gene copy numbers obtained via dd PCR were used to estimate the cell density of total and toxigenic Microcystis, respectively. These estimated cell densities were then compared with those obtained via microscopic enumeration. The conversion to cell density was calculated as follows:
E C D = P S × D E × D M A C N × V
ECD: Estimated cell density (cells/mL)
PS: Positive signal per well (copies/μL)
DE: DNA elution volume (μL)
DM: Dilution multiple
ACN: Average gene copy number per cell (copies/cell)
V: Filtered volume (mL)
In this study, an average secA gene copy number of 2.8 copies per cell, derived from mixed field populations of Microcystis collected from the Nakdong River, was used to convert both the secA and mcyA gene copy numbers obtained using ddPCR into cell densities.

5.7. Analysis of Microcystins

For the analysis of microcystins, cultured Microcystis samples were placed in 50 mL conical tubes and disrupted using an ultrasonic homogenizer (Sonics Vibra Cell, Sonics and Materials Inc., VCX 750, Newtown, CT, USA). The resulting cell lysate was filtered through 0.45 μm syringe filter and then transferred into a clean tube. Microcystin concentrations were measured using a Microcystins (Adda specific) ELISA kit (Enzo Life Sciences, Farmingdale, NY, USA), following the manufacturer’s instructions.

5.8. Statistical Analysis

All data are presented as the mean ± standard error of the mean (SEM). Differences between samples were assessed using an independent two-sample t-test (two-tailed). A p-value < 0.05 was considered statistically significant.

Author Contributions

Conceptualization, I.-S.K. and H.-K.P.; Validation, H.-K.P.; Formal analysis, I.-S.K. and H.-K.P.; Investigation, I.-S.K. and H.-K.P.; Data curation, H.-K.P.; Writing—original draft, I.-S.K. and H.-K.P.; Writing—review and editing, H.-K.P.; Visualization, I.-S.K.; Supervision, H.-K.P.; Project administration, H.-K.P.; Funding acquisition, H.-K.P. All authors have read and agreed to the published version of the manuscript.

Funding

This research was supported by the National Institute of Environmental Research (NIER), funded by the Ministry of Environment (MOE) of the Republic of Korea, grant number NIER-2024-01-01-065.

Institutional Review Board Statement

Not applicable.

Informed Consent Statement

Not applicable.

Data Availability Statement

The original contributions presented in this study are included in the article. Further inquiries can be directed to the corresponding author.

Acknowledgments

The authors would like to thank the members of the Freshwater Ecosystem Research Section, Nakdong River Environmental Research Center, NIER for their invaluable field and laboratory assistance.

Conflicts of Interest

The authors declare no conflicts of interest.

References

  1. Paerl, H.W.; Hall, N.S.; Calandrino, E.S. Controlling harmful cyanobacterial blooms in a world experiencing anthropogenic and climatic-induced change. Sci. Total Environ. 2011, 409, 739–1745. [Google Scholar] [CrossRef] [PubMed]
  2. Beaver, J.R.; Manis, E.E.; Loftin, K.A.; Graham, J.L.; Pollard, A.I.; Mitchell, R.M. Land use patterns, ecoregion, and microcystin relationships in U.S. lakes and reservoirs: A preliminary evaluation. Harmful Algae 2014, 36, 57–62. [Google Scholar] [CrossRef]
  3. Huisman, J.M.; Matthijs, H.C.P.; Visser, P.M. Harmful Cyanobacteria; Springer Aquatic Ecology Series 3; Springer: Dordrecht, The Netherlands, 2005; p. 243. [Google Scholar]
  4. Paerl, H.W.; Otten, T.G. Harmful cyanobacterial blooms: Causes, consequences, and controls. Microbiol. Ecol. 2013, 65, 995–1010. [Google Scholar] [CrossRef] [PubMed]
  5. Codd, G.A.; Meriluoto, J.; Metcalf, J.S. Introduction: Cyanobacteria, cyanotoxins, their human impact, and risk management. In Handbook of Cyanobacterial Monitoring and Cyanotoxin Analysis; John Wiley & Sons, Ltd.: Hoboken, NJ, USA, 2017. [Google Scholar]
  6. Mirasbekov, Y.; Abdimanova, A.; Sarkytbayev, K.; Samarkhanov, K.; Abilkas, A.; Potashnikova, D.; Arbuz, G.; Issayev, Z.; Vorobjev, I.A.; Malashenkov, D.V.; et al. Combining Imaging Flow Cytometry and Molecular Biological Methods to Reveal Presence of Potentially Toxic Algae at the Ural River in Kazakhstan. Front. Mar. Sci. 2021, 8, 680482. [Google Scholar] [CrossRef]
  7. Chorus, I.; Welker, M. (Eds.) Toxic Cyanobacteria in Water, 2nd ed.; CRC Press: Boca Raton, FL, USA; on behalf of the World Health Organization: Geneva, Switzerland, 2021. [Google Scholar]
  8. Adekolurejo, O.A.; Floyd, M.; Dunn, A.M.; Kay, P.; Dean, A.P.; Hassall, C. Combined effects of increased water temperature and cyanobacterial compounds exert heterogeneous effects on survival and ecological processes in key freshwater species. Oecologia 2022, 200, 515–528. [Google Scholar] [CrossRef]
  9. Erratt, K.J.; Creed, I.F.; Lobb, D.A.; Smol, J.P.; Trick, C.G. Climate change amplifies the risk of potentially toxigenic cyanobacteria. Glob. Change Biol. 2023, 29, 5240–5249. [Google Scholar] [CrossRef]
  10. Smucker, N.J.; Beaulieu, J.J.; Nietch, C.T.; Young, J.L. Increasingly severe cyanobacterial blooms and deep water hypoxia coincide with warming water temperatures in reservoirs. Glob. Change Biol. 2021, 27, 2507–2519. [Google Scholar] [CrossRef]
  11. Merder, J.; Harris, R.T.; Zhao, G.; Stasinopoulos, D.M.; Rigby, R.A.; Michalak, A.M. Geographic redistribution of microcystin hotspots in response to climate warming. Nat. Water 2023, 1, 844–859. [Google Scholar] [CrossRef]
  12. Kleinteich, J.; Frassl, M.A.; Schulz, M.; Fischer, H. Climate change triggered planktonic cyanobacterial blooms in a regulated temperate river. Sci. Rep. 2024, 14, 16298. [Google Scholar] [CrossRef]
  13. Saleem, F.; Jiang, J.L.; Atrache, R.; Paschos, A.; Edge, T.A.; Schellhorn, H.E. Cyanobacterial Algal Bloom Monitoring: Molecular Methods and Technologies for Freshwater Ecosystems. Microorganisms 2023, 11, 851. [Google Scholar] [CrossRef]
  14. Park, H.-D.; Watanabe, M.F.; Harada, K.I.; Nagai, H.; Suzuki, M.; Watanabe, M.; Hayashi, H. Hepatotoxin (microcystin) and neurotoxin (anatoxin-a) contained in natural blooms and strains of cyanobacteria from Japanese freshwaters. Nat. Toxins 1993, 1, 353–360. [Google Scholar] [CrossRef] [PubMed]
  15. Otten, T.G.; Xu, H.; Qin, B.; Zhu, G.; Paerl, H.W. Spatiotemporal patterns and ecophysiology of toxigenic Microcystis blooms in Lake Taihu, China: Implications for water quality management. Environ. Sci. Technol. 2012, 46, 3480–3488. [Google Scholar] [CrossRef] [PubMed]
  16. Guedes, I.A.; da Costa Leite, D.M.; Manhães, L.A.; Bisch, P.M.; Azevedo, S.M.; Pacheco, A.B.F. Fluctuations in microcystin concentrations, potentially toxic Microcystis and genotype diversity in a cyanobacterial community from a tropical reservoir. Harmful Algae 2014, 39, 303–309. [Google Scholar] [CrossRef]
  17. Wu, Y.; Li, L.; Zheng, L.; Dai, G.; Ma, H.; Shan, K.; Wu, H.; Zhou, Q.; Song, L. Patterns of succession between bloom-forming cyanobacteria Aphanizomenon flos-aquae and Microcystis and related environmental factors in large, shallow Dianchi Lake. China Hydrobiol. 2016, 765, 1–13. [Google Scholar] [CrossRef]
  18. Harke, M.J.; Steffen, M.M.; Gobler, C.J.; Otten, T.G.; Wilhelm, S.W.; Wood, S.A.; Paerl, H.W. A review of the global ecology, genomics, and biogeography of the toxic cyanobacterium, Microcystis spp. Harmful Algae 2016, 54, 4–20. [Google Scholar] [CrossRef]
  19. Jablonska, M.; Cerasino, L.; Boscaini, A.; Capelli, C.; Greco, C.; Klemenčič, A.K.; Mischke, U.; Salmaso, N.; Kurmayer, R. Distribution of toxigenic cyanobacteria in Alpine lakes and rivers as revealed by molecular screening. Water Res. 2024, 258, 121783. [Google Scholar] [CrossRef]
  20. Joung, S.-H.; Oh, H.-M.; Ko, S.-R.; Ahn, C.-Y. Correlations between environmental factors and toxic and non–toxic Microcystis dynamics during bloom in Daechung Reservoir, Korea. Harmful Algae 2011, 10, 188–193. [Google Scholar] [CrossRef]
  21. Park, H.K.; Lee, H.J.; Heo, J.; Yun, J.H.; Kim, Y.J.; Kim, H.M.; Hong, D.G.; Lee, I.J. Deciphering the key factors determining spatio-temporal heterogeneity of cyanobacterial bloom dynamics in the Nakdong River with consecutive large weirs. Sci. Total Environ. 2020, 755, 143079. [Google Scholar] [CrossRef]
  22. Komáreck, J.; Anagnostidis, K. Freshwater Flora of Central Europe Vol. 19/1 Cyanoprokaryota, 1st Part: Chroococcales; Gustav Fisher: Jena, Germany, 1999. [Google Scholar]
  23. Carmichael, W.W. Toxic Microcystis and the environment. In Toxic Microcystis; Watanabe, M., Harada, K., Carmichael, W., Fujiki, H., Eds.; CRC Press: Boca Raton, FL, USA, 1995; pp. 1–12. [Google Scholar]
  24. Preece, E.P.; Hardy, F.J.; Moore, B.C.; Bryan, M. A review of microcystin detections in Estuarine and Marine waters: Environmental implications and human health risk. Harmful Algae 2017, 61, 31–45. [Google Scholar] [CrossRef]
  25. Humpage, A.; Fastner, J. Cyanobacterial toxins: Hepatotoxic cyclic peptides—Microcystins and nodularins. In Toxic Cyanobacteria in Water, 2nd ed.; Chorus, I., Welker, M., Eds.; CRC Press: Boca Raton, FL, USA; on behalf of the World Health Organization: Geneva, Switzerland, 2021. [Google Scholar]
  26. Mallia, V.; Uhlig, S.; Rafuse, C.; Meija, J.; Miles, C.O. Novel Microcystins from Planktothrix prolifica NIVA–CYA 544 Identified by LC–MS/MS, Functional Group Derivatization and 15N–labeling. Mar. Drugs 2019, 17, 643. [Google Scholar] [CrossRef]
  27. Rastogi, R.P.; Sinha, R.P.; Incharoensakdi, A. The cyanotoxin–microcystins: Current overview. Rev. Environ. Sci. Biotechnol. 2014, 13, 215–249. [Google Scholar] [CrossRef]
  28. World Health Organization. Guidelines for Drinking–Water Quality: Fourth Edition Incorporating the First and Second Addenda; WHO: Geneva, Switzerland, 2022.
  29. Kouzminov, A.; Ruck, J.; Wood, S.A. New Zealand risk management approach for toxic cyanobacteria in drinking water. Aust. N. Z. J. Public Health 2007, 31, 275–281. [Google Scholar] [CrossRef] [PubMed]
  30. Izydorczyk, K.; Carpentier, C.; Mrówczyński, J.; Wagenvoort, A.; Jurczak, T.; Tarczyńska, M. Establishment of an Alert Level Framework for cyanobacteria in drinking water resources by using the Algae Online Analyser for monitoring cyanobacterial chlorophyll a. Water Res. 2009, 43, 989–996. [Google Scholar] [CrossRef]
  31. Ibelings, B.W.; Backer, L.C.; Kardinaal, W.E.A.; Chorus, I. Current approaches to cyanotoxin risk assessment and risk management around the globe. Harmful Algae 2014, 40, 63–74. [Google Scholar] [CrossRef]
  32. Park, H.-K.; Kim, H.; Lee, J.J.; Lee, J.A.; Lee, H.; Park, J.-H.; Seo, J.; Youn, S.-J.; Moon, J. Investigation of criterion on harmful algae alert system using correlation between cell numbers and cellular microcystins content of Korean toxic cyanobacteria. J. Kor. Soc. Water Env. 2011, 27, 491–498. [Google Scholar]
  33. Schürmann, Q.J.F.; Visser, P.M.; Sollie, S.; Kardinaal, W.E.A.; Faassen, E.J.; Lokmani, R.; van der Oost, R.; van de Waal, D.B. Risk assessment of toxic cyanobacterial blooms in recreational waters: A comparative study of monitoring methods. Harmful Algae 2024, 138, 102683. [Google Scholar] [CrossRef]
  34. Preece, E.P.; Otten, T.G.; Cooke, J. Use of multiple sampling techniques for cyanobacteria and cyanotoxin monitoring in the Sacramento–San Joaquin Delta under different hydrologic regimes. Mar. Pollut. Bull. 2024, 205, 116585. [Google Scholar] [CrossRef]
  35. Fickas, K.C.; O’Shea, R.E.; Pahlevan, N.; Smith, B.; Bartlett, S.L.; Wolny, J.L. Leveraging multimission satellite data for spatiotemporally coherent cyanoHAB monitoring. Front. Remote Sens. 2023, 4, 1157609. [Google Scholar] [CrossRef]
  36. Mishra, S.; Stumpf, R.P.; Meredith, A. Constructing a Consistent and Continuous Cyanobacteria Bloom Monitoring Product from Multi–Mission Ocean Color Instruments. Remote Sens. 2023, 15, 5291. [Google Scholar] [CrossRef]
  37. Gaget, V.; Lau, M.; Scendall, B.; Froscio, S.; Humpage, A.R. Cyanotoxins: Which detection technique for an optimum risk assessment? Water Res. 2017, 118, 227–238. [Google Scholar] [CrossRef]
  38. Huisman, J.; Codd, G.A.; Paerl, H.W.; Ibelings, B.W.; Verspagen, J.M.H.; Visser, P.M. Cyanobacterial blooms. Nat. Rev. Micrbiol 2018, 16, 471–483. [Google Scholar] [CrossRef] [PubMed]
  39. Lee, J.E.; Park, R.; Yu, M.; Byeon, M.; Kang, T. qPCR–Based Monitoring of 2–Methylisoborneol/Geosmin–Producing Cyanobacteria in Drinking Water Reservoirs in South Korea. Microorganisms 2023, 11, 2332. [Google Scholar] [CrossRef] [PubMed]
  40. Te, S.H.; Chen, E.Y.; Gin, K.Y. Comparison of Quantitative PCR and Droplet Digital PCR Multiplex Assays for Two Genera of Bloom–Forming Cyanobacteria, Cylindrospermopsis and Microcystis. Appl. Environ. Microbiol. 2015, 81, 5203–5211. [Google Scholar] [CrossRef]
  41. Kim, Y.-J.; Park, H.-K.; Kim, I.-S. Assessment of the Appearance and Toxin Production Potential of Invasive Nostocalean Cyanobacteria Using Quantitative Gene Analysis in Nakdong River, Korea. Toxins 2022, 14, 294. [Google Scholar] [CrossRef] [PubMed]
  42. Panksep, K.; Tamm, M.; Mantzouki, E.; Rantala–Ylinen, A.; Laugaste, R.; Sivonen, K.; Tammeorg, O.; Kisand, V. Using Microcystin Gene Copies to Determine Potentially–Toxic Blooms, Example from Shallow Eutrophic Lake Peipsi. Toxins 2020, 12, 211. [Google Scholar] [CrossRef]
  43. Padovan, A.; Kennedy, K.; Gibb, K. A Microcystin synthesis mcyE/ndaF gene assay enables early detection of microcystin production in a tropical wastewater pond. Harmful Algae 2023, 127, 102476. [Google Scholar] [CrossRef]
  44. Wang, Z.; Song, G.; Shao, J.; Tan, W.; Li, Y.; Li, L. Establishment and field applications of real-time PCR methods for the quantification of potential MIB-producing cyanobacteria in aquatic systems. J. Appl. Phycol. 2016, 28, 325–333. [Google Scholar] [CrossRef]
  45. Kurmayer, R.; Kutzenberger, T. Application of Real-Time PCR for Quantification of Microcystin Genotypes in a Population of the Toxic Cyanobacterium Microcystis sp. Appl. Env. Mocrobiol 2003, 69, 6723–6730. [Google Scholar] [CrossRef]
  46. Te, S.H.; Gin, K.Y. The dynamics of cyanobacteria and microcystin production in a tropical reservoir of Singapore. Harmful Algae 2011, 10, 319–329. [Google Scholar] [CrossRef]
  47. Kataoka, T.; Homma, T.; Nakano, S.; Hodoki, Y.; Ohbayashi, K.; Kondo, R. PCR primers for selective detection of intra–Species variations in the bloom–forming cyanobacterium, Microcystis. Harmful Algae 2013, 23, 46–54. [Google Scholar] [CrossRef]
  48. Oh, K.-H.; Jeong, D.-H.; Shin, S.-H.; Cho, Y.-C. Simultaneous Quantification of Cyanobacteria and Microcystis spp. Using Real–Time PCR. J. Microbiol. Biotechnol. 2012, 22, 248–255. [Google Scholar] [CrossRef] [PubMed]
  49. Strain, M.C.; Lada, S.M.; Luong, T.; Rought, S.E.; Gianella, S.; Terry, V.H.; Spina, C.A.; Woelk, C.H.; Richman, D.D. Highly precise measurement of HIV DNA by Droplet Digital PCR. PLoS ONE 2013, 8, e55943. [Google Scholar] [CrossRef] [PubMed]
  50. Vynck, M.; Vandesompeleb, J.; Nijs, N.; Mentenb, B.; Ganck, A.D.; Thasa, O. Flexible analysis of digital PCR experiments using generalized linear mixed models. Biomol. Detect. Quantif. 2016, 9, 1–13. [Google Scholar] [CrossRef] [PubMed]
  51. Tan, C.; Fan, D.; Wang, N.; Wang, F.; Wang, B.; Zhu, L.; Guo, Y. Applications of digital PCR in COVID-19 pandemic. View 2021, 2, 20200082. [Google Scholar] [CrossRef]
  52. Dominguez, S.L.; Suárez, C.A.; Ledesma, S.M.; Bellido, M.J.L. Present and future applications of digital PCR in infectious diseases diagnosis. Diagnostics 2024, 14, 931. [Google Scholar] [CrossRef]
  53. Murthy, S.; Suresh, A.; Dandasena, D.; Singh, S.; Subudhi, M.; Bhandari, V.; Bhanot, V.; Arora, J.S.; Sharma, P. Multiplex ddPCR: A promising diagnostic assay for early detection and drug monitoring in bovine theileriosis. Pathogens 2023, 12, 296. [Google Scholar] [CrossRef]
  54. Hayden, R.T.; Ingersoll, J.; Abdul–Ali, D.; Shi, L.; Pounds, S.; Caliendo, A.M. Comparison of droplet digital PCR to real–time PCR for quantitative detection of cytomegalovirus. J. Clin. Microbiol. 2013, 51, 540–546. [Google Scholar] [CrossRef]
  55. Dong, L.; Yang, S.; Chen, J.; Wu, X.; Sun, D.; Song, C.; Li, L. Structural basis of secA–mediated protein translocation. Proc. Natl. Acad. Sci. USA 2023, 120, e2208070120. [Google Scholar] [CrossRef]
  56. Rinta–kanto, J.M.; Ouellette, A.J.A.; Boyer, G.L.; Twiss, M.R.; Bridgeman, T.B.; Wilhelm, S.W. Quantification of toxic Microcystis spp. during the 2003 and 2004 Blooms in Western Lake Erie using quantitative real–time PCR. Environ. Sci. Technol. 2005, 39, 4198–4205. [Google Scholar]
  57. Hisbergues, M.; Christiansen, G.; Rouhiainen, L.; Sivonen, K.; Börner, T. PCR–Based Identification of microcystin–producing genotypes of cifferent cyanobacterial genera. Arch. Microbiol. 2003, 180, 402–410. [Google Scholar] [CrossRef]
  58. Saker, M.L.; Welker, M.; Vasconcelos, V.M. Multiplex PCR for the detection of toxigenic cyanobacteria in dietary supplements produced for human consumption. Appl. Microbiol. Biotechnol. 2007, 73, 1136–1142. [Google Scholar] [CrossRef] [PubMed]
  59. Sneideris, D.; Ivanauskas, A.; Zizyte, M.; Valiunas, D. secA Gene suitability for fast and easy identification of phytoplasmas by RFLP analysis. Eur. J. Plant Pathol. 2021, 160, 737–743. [Google Scholar] [CrossRef]
  60. Kumar, S.; Jadon, V.S.; Rao, G.P. Use of secA gene for characterization of Phytoplasmas associated with sugarcane grassy shoot disease in India. Sugar Tech 2017, 19, 632–637. [Google Scholar] [CrossRef]
  61. Bloch, M.; Helmick, E.E.; Bahder, B.W. Differentiation of palm–infecting Phytoplasmas in the caribbean basin using high resolution melt curve analysis of the secA gene. Plant Dis. 2022, 106, 2480–2489. [Google Scholar] [CrossRef]
  62. Zhang, W.; Lou, I.; Ung, W.K.; Kong, Y.; Mok, K.M. Application of PCR and real–time PCR for monitoring cyanobacteria, Microcystis spp. and Cylindrospermopsis raciborskii in Macau freshwater reservoir. Front. Earth Sci. 2014, 8, 291–301. [Google Scholar] [CrossRef]
  63. Liu, Y.; Liu, Y.; Guo, L.; Wu, Y.; Wang, Y.; Xu, L.; Xu, M.; Huang, S.; Chen, P.; Wang, T.; et al. Multiplex asymmetric PCR by combining the amplification refractory mutation system with the homo–tag–assisted nondimer system. Anal. Chem. 2024, 96, 9200–9208. [Google Scholar] [CrossRef]
  64. Wang, D.; Wang, S.; Du, X.; He, Q.; Liu, Y.; Wang, Z.; Feng, K.; Li, Y.; Deng, Y. ddPCR surpasses classical qPCR technology in quantitating bacteria and fungi in the environment. Mol. Ecol. Resour. 2022, 22, 2587–2598. [Google Scholar] [CrossRef]
  65. Cox, C.R.; Weghorn, K.N.; Ruger, K.; Powers–Fletcher, M.V.; Powell, E.A.; Mortensen, J.E. Clinical utility of multiplex PCR in the detection of pathogens from sterile body fluids. J. Clin. Microbiol. 2024, 62, e0161123. [Google Scholar] [CrossRef]
  66. Mori, C.; Matsumura, S. Development and validation of simultaneous identification of 26 mammalian and poultry species by a multiplex assay. Int. J. Leg. Med. 2022, 136, 1–12. [Google Scholar] [CrossRef]
  67. Yuan, J.; Yi, J.; Zhan, M.; Xie, Q.; Zhen, T.T.; Zhou, J.; Li, Z.; Li, Z. The web–based multiplex PCR primer design software ultiplex and the associated experimental workflow: Up to 100–Plex multiplicity. BMC Genom. 2021, 22, 835. [Google Scholar] [CrossRef]
  68. Kim, H.-R.; Kim, C.-K.; Ahn, T.-S.; Yoo, S.-A.; Lee, D.-H. Effects of temperature and light on microcystin synthetase gene transcription in Microcystis aeruginosa. Key Eng. Mater. 2005, 277–279, 606–611. [Google Scholar] [CrossRef]
  69. Riaz, S.; Xiao, M.; Chen, P.; Li, M.; Cui, Y.; Daroch, M. The genome copy number of the thermophilic cyanobacterium Thermosynechococcus elongatus E542 is controlled by growth phase and nutrient availability. Appl. Environ. Microbiol. 2021, 87, e02993-20. [Google Scholar] [CrossRef] [PubMed]
  70. Riaz, S.; Jiang, Y.; Xiao, M.; You, D.; Klepacz–Smółka, A.; Rasul, F.; Daroch, M. Generation of miniploid cells and improved natural transformation procedure for a model cyanobacterium Synechococcus elongatus PCC7942. Front. Microbiol. 2022, 13, 959043. [Google Scholar] [CrossRef] [PubMed]
  71. Schirrmeister, B.E.; Dalquen, D.A.; Anisimova, M.; Bagheri, H.C. Gene copy number variation and its significance in cyanobacterial phylogeny. BMC Microbiol. 2012, 12, 177. [Google Scholar] [CrossRef]
  72. Miller, S.R.; Wood, A.M.; Blankenship, R.E.; Kim, M.; Ferriera, S. Dynamics of gene duplication in the genomes of chlorophyll d–producing cyanobacteria: Implications for the ecological niche. Genome Biol. Evol. 2011, 3, 601–613. [Google Scholar] [CrossRef]
  73. Ohbayashi, R.; Nakamachi, A.; Hatakeyama, T.S.; Watanabe, S.; Kanesaki, Y.; Chibazakura, T.; Yoshikawa, H.; Miyagishima, S.-Y. Coordination of polyploid chromosome replication with cell size and growth in a cyanobacterium. mBio 2019, 10, e00510-19. [Google Scholar] [CrossRef]
  74. Griese, M.; Lange, C.; Soppa, J. Ploidy in cyanobacteria. FEMS Microbiol. Lett. 2011, 323, 124–131. [Google Scholar] [CrossRef]
  75. Davis, T.W.; Berry, D.L.; Boyer, G.L.; Gobler, C.J. The effects of temperature and nutrients on the growth and dynamics of toxic and non–toxic strains of Microcystis during cyanobacterial blooms. Harmful Algae 2009, 8, 715–725. [Google Scholar] [CrossRef]
  76. Gaget, V.; Humpage, A.R.; Huang, Q.; Monis, P.; Burch, M.D. Water treatment of cyanobacterial blooms: Understanding cyanobacteria cell behaviour and its impact on drinking water treatment processes. Water Res. 2017, 113, 61–77. [Google Scholar]
  77. Tanabe, Y.; Kaya, K.; Watanabe, M.M. Evidence for reclassification of toxic and non–toxic Microcystis strains on the basis of genetic analysis. FEMS Microbiol. Lett. 2007, 264, 15–19. [Google Scholar]
  78. Puddick, J.; Prinsep, M.R.; Wood, S.A.; Kaufononga, S.A.; Cary, S.C.; Hamilton, D.P. Further characterization of glycosylated microcystins from Microcystis spp. using LC–MS/MS and NMR analysis. Toxins 2014, 6, 4435–4451. [Google Scholar]
  79. Shirai, M.; Matumaru, K.; Ohotake, A.; Takamura, Y.; Aida, T.; Nakano, M. Development of a solid medium for growth and isolation of axenic Microcystis strains (Cyanobacteria). Appl. Environ. Microbiol. 1989, 55, 2569–2571. [Google Scholar] [CrossRef] [PubMed]
  80. John, D.M.; Whitton, B.A.; Brook, A.J. The Freshwater Algal Flora of the British Isles. In An Identification Guide to Freshwater and Terrestrial Algae, 2nd ed.; Cambridge University Press: Cambridge, UK, 2011. [Google Scholar]
  81. Lee, H.-J.; Park, H.-K.; Heo, J.; Lee, H.-J.; Hong, D.-G. Colonial cyanobacteria, Microcystis cell density variations using ultrasonic treatment. J. Korean Soc. Water Environ. 2018, 34, 210–215. [Google Scholar]
Figure 1. Detection of target genes in Microcystis spp. and other genera using PCR and ddPCR. The upper panel displays gel electrophoresis results showing amplification band, and lower panel shows droplet fluorescence data. (A) secA gene; (B) 16s rRNA gene; (C) mcyA gene; Droplets with fluorescence intensity above the threshold (pink line) are considered positive, indicating the presence of target DNA, while those below are considered negative. M: SiZer-100 DNA marker; event number: total droplets; numbers: refer to Table 3.
Toxins 17 00242 g001
Figure 2. Comparison of sensitivity between secA and mcyA singleplex PCR and multiplex PCR in ddPCR: (A) cultured Microcystis strains; (B) mixed field populations of Microcystis collected from CH site. Data are presented as mean ± SEM. Statistical analysis was performed using an unpaired two-tailed Student’s t-test (n = 6). No statistically significant difference was observed (p > 0.05).
Toxins 17 00242 g002
Figure 3. The secA gene copy number per cell in Microcystis strains and mixed filed populations of Microcystis (A) and comparison of secA and mcyA gene copy numbers of toxic Microcystis strains (B). Data are presented as mean ± SEM (bars above and below the symbols). Statistical analysis was performed using an unpaired two-tailed Student’s t-test (n = 6). No statistically significant difference was observed (p > 0.05).
Toxins 17 00242 g003
Figure 4. Comparisons of cell densities between microscopic cell counting method and estimation from gene copy number of ddPCR of field samples (A), and the ratio of toxigenic/non-toxigenic Microcystis biomass (B).
Toxins 17 00242 g004
Figure 5. Map of sampling sites in the Nakdong River basin area.
Toxins 17 00242 g005
Table 1. PCR primers and probes list.
PlatformTarget
Gene
NameSequence(5′ -> 3′)Reference
ddPCRsecAsecA-FGTGTGGGACTAATTCAAGCCThis study
secA-RGGCCTCATCGATAAGAATGG
secA-probeTACACCACTAACAGCGAACTCGGCT
mcyAmcyA-FGGTTAGAAGCAGCCGATGGThis study
mcyA-RGCTCCAAGAACCTCCAGATAAC
mcyA-probeTTTTGAATACTTTGCCCCTACGTTTAGA
16S rRNAMICR 184FGCCGCRAGGTGAAAMCTAA[56]
MICR 431RAATCCAAARACCTTCCTCCC
MICR 228FAAGAGCTTGCGTCTGATTAGCTAGT
Conventional
PCR
mcyAmcyA-Cd1FAAAATTAAAAGCCGTATCAAA[57]
mcyA-Cd1RAAAAGTGTTTTATTAGCGGCTCAT
Table 2. Dominant species and sub-dominant species of Microcystis in the field samples from May to December in 2022.
Survey DateDominant Species
(Relative Abundance %)
Sub-Dominant Species
(Relative Abundance %)
2022.5.23Microcystis sp. (100)
2022.6.7M. aeruginosa (46)M. viridis (38)
2022.6.20M. aeruginosa (41)M. novacekii (26)
2022.7.4M. aeruginosa (46)M. viridis (33)
2022.7.19M. wesenbergii (65)M. aeruginosa (23)
2022.8.8M. aeruginosa (61)M. novacekii (12)
2022.8.22M. aeruginosa (70)Microcystis sp. (20)
2022.9.14Microcystis sp. (100)
2022.9.20M. aeruginosa (56)M. ichthyoblabe (44)
2022.10.11M. aeruginosa (46)M. wesenbergii (31)
2022.10.24M. aeruginosa (83)Microcystis sp. (17)
2022.11.7M. wesenbergii (50)Microcystis sp. (50)
2022.11.21Microcystis sp. (100)
2022.12.12Microcystis sp. (100)
Table 3. List of cyanobacterial strains used for primer verification, presence of secA, mcyA genes by conventional PCR, and production of microcystins (MCY) in each strain.
No.Strain No.Scientific NameIsolation SitesecA
Gene
mcyA
Gene
MCY
1NRERC-205Microcystis flos-aquaeNakdong River+++
2NRERC-206Microcystis ichthyoblabeNakdong River+
3NRERC-221Microcystis aeruginosaYoungju Lake+
4NRERC-223Microcystis wesenbergiiYoungju Lake+
5NRERC-224Microcystis viridisNakdong River+++
6NRERC-225Microcystis novacekiiBanbyeon River+++
7NRERC-227Microcystis viridisYoungsan River+
8NRERC-228Microcystis flos-aquaeYoungsan River+++
9NRERC-229Microcystis flos-aquaeYoungsan River+++
10NRERC-230Microcystis aeruginosaYoungsan River+++
11NRERC-008Aphanizomenon flos-aquaeNakdong River
12NRERC-101Dolichospermum planctonicumNakdong River
13NRERC-450Geitlerinema amphibiumNakdong River
14NRERC-501Cylindrospermopsis raciborskiiNakdong River
15NRERC-601Sphaerospermopsis aphanizomenoidesNakdong River
16NRERC-650Cuspidothrix issatchenkoiNakdong River
17AG10016Aphanocapsa sp.
18AG20470Synechococcus sp.
19NIVA-CYA 656Dolichospermum flos-aquae ++
20NIVA-CYA 855Planktothrix agardhii ++
Disclaimer/Publisher’s Note: The statements, opinions and data contained in all publications are solely those of the individual author(s) and contributor(s) and not of MDPI and/or the editor(s). MDPI and/or the editor(s) disclaim responsibility for any injury to people or property resulting from any ideas, methods, instructions or products referred to in the content.

