Article

Impact of Environmental Conditions on the Concentrations of Trichothecenes, Their Glucosides, and Emerging Fusarium Toxins in Naturally Contaminated, Irradiated, and Fusarium langsethiae Inoculated Oats

1
Applied Mycology Group, Environment and AgriFood Theme, Cranfield University, College Rd., Wharley End, Bedford MK43 0AL, UK
2
Institute for Global Food Security, National Measurement Laboratory: Centre of Excellence in Agriculture and Food Integrity, Queen’s University Belfast, 19 Chlorine Gardens, Belfast BT9 5DL, UK
3
The International Joint Research Centre on Food Security (IJC-FOODSEC), 113 Thailand Science Park, Pahonyothin Road, Khong Luang 12120, Thailand
4
Institute of Bioanalytics and Agro-Metabolomics, Department of Agrobiotechnology IFA-Tulln, University of Natural Resources and Life Sciences, Vienna, 3430 Tulln, Austria
*
Author to whom correspondence should be addressed.
Toxins 2024, 16(4), 166; https://doi.org/10.3390/toxins16040166
Submission received: 5 February 2024 / Revised: 8 March 2024 / Accepted: 12 March 2024 / Published: 22 March 2024
(This article belongs to the Section Mycotoxins)

Abstract

:
Trichothecenes produced by Fusarium species are commonly detected in oats. However, the ratios of the concentrations of free trichothecenes and their conjugates and how they are impacted by different interacting environmental conditions are not well documented. This study aims to examine the effect of water activity (0.95 and 0.98 aw) and temperature (20 and 25 °C) stress on the production of T-2 and HT-2 toxins, deoxynivalenol and their conjugates, as well as diacetoxyscirpenol (DAS). Multiple mycotoxins were detected using liquid chromatography–tandem mass spectrometry from 64 contaminated oat samples. The highest concentrations of HT-2-glucoside (HT-2-Glc) were observed at 0.98 aw and 20 °C, and were higher than other type A trichothecenes in the natural oats’ treatments. However, no statistical differences were found between the mean concentrations of HT-2-Glc and HT-2 toxins in all storage conditions analysed. DAS concentrations were generally low and highest at 0.95 aw and 20 °C, while deoxynivalenol-3-glucoside levels were highest at 0.98 aw and 20 °C in the naturally contaminated oats. Emerging mycotoxins such as beauvericin, moniliformin, and enniatins mostly increased with a rise in water activity and temperature in the naturally contaminated oats treatment. This study reinforces the importance of storage aw and temperature conditions in the high risk of free and modified toxin contamination of small cereal grains.
Key Contribution: This article investigated the concentrations of T-2 toxin; HT-2 toxin; deoxynivalenol; their glucosides; and diacetoxyscirpenol for the first time under different storage conditions to determine the relative risk of their contamination in stored oats.

1. Introduction

Fusarium langsethiae, originally referred to as a ‘powdery Fusarium poae’, is a major producer of the type A trichothecenes T-2 toxin (T-2) and HT-2 toxin (HT-2), initially discovered in Norwegian cereals [1,2]. It is characterized by spores morphologically similar to Fusarium poae, with a similar mycotoxin profile to Fusarium sporotrichioides [3]. The occurrence of Fusarium langsethiae and its mycotoxins in a wide range of cereals and cereal products such as oats, wheat, and barley has been extensively examined [4,5,6,7,8,9].
Diacetoxyscirpenol (DAS), mainly produced by Fusarium langsethiae and mostly found in cereal grains, has been assessed for its toxicity to humans and animals by the European Food Safety Authority (EFSA) [10]. DAS, also called anguidine, belongs to group A of trichothecenes, having a similar structure and toxicity to T-2 toxin, causing lymphoid necrosis, haematotoxicity, and gastrointestinal toxicity [11,12]. Considered a severe threat to human, animal, and plant health, DAS is enlisted for research in the ‘Select Agents and Toxins’ list of the Centers for Disease Control and Prevention, United States [13]. DAS has been found to reduce feed intake and body weight with other cytotoxic effects such as oral lesions in broiler breeders fed with a DAS-contaminated diet [14]. Its occurrence in cereal and cereal-based foods is not well documented.
Deoxynivalenol (DON) has been found in oats and was reported to be mainly produced by F. graminearum, which is the main causative agent of Fusarium head blight (FHB) in small cereal grains, especially in temperate regions [6,15,16]. Unlike F. langsethiae, it is a strong pathogen that can penetrate plant cell walls, causing aggressive colonisation [17,18]. DON has been reported to co-occur with its glucoside, DON-3-G, in cereal-based products and with acetylated forms in oats [19,20,21]. However, these studies did not investigate the impact of storage conditions on the concentrations of these mycotoxins in oats.
As a major contaminant of oats, T-2 toxin can be rapidly metabolized to HT-2 toxin [22]. The effects of both toxins include a weakened immune system, growth retardation in exposed animals, and cytotoxicity in the human small intestine, which are well detailed in the JECFA report on HT-2 and T-2 toxins and other related studies [23,24,25]. Due to their toxicity, indicative levels for the sum of T-2 and HT-2 (μg/kg) have been set by the European Commission at 1000 μg/kg in unprocessed oats (with husks), with a tolerable daily (TDI) intake of 0.02 μg/kg of body weight per day [26].
T-2 and HT-2 can be metabolized to their modified forms, such as HT-2-glucoside, T-2-glucoside, 3′-hydroxy-T-2, T-2 tetraol, and 3′-hydroxy-T-2 triol [23,27]. While these metabolites are less toxic, the glucosides can be converted back to their native form in the mammalian gastrointestinal tract to regain their toxicity [27]. These modified forms are not readily detected by conventional analytical techniques, making it difficult to predict the total mycotoxin levels in harvested grains [28]. Grains that seem to be clean or healthy may be contaminated with high levels of mycotoxins and their modified forms due to the frequent occurrence of Fusarium species in small-sized cereal grains without visible traces of infection [29,30]. It is therefore important to understand Fusarium infection either pre- and/or post-harvest and examine how environmental factors influence mycotoxin contamination of grains by Fusarium langsethiae.
A storage temperature of 25 °C and 0.995 aw was reported as the optimum temperature for the growth of two strains of Fusarium langsethiae on oat-based media [31]. The highest concentrations of T-2 and HT-2 in oat grains in situ were reported at 25 °C in the wettest condition of 0.97 aw by Mylona and Magan, [32]. However, while these studies showed the growth of Fusarium langsethiae and the production of T-2 and HT-2 in oats in vitro and in situ, they have not shown how their concentrations vary alongside their conjugates in stored oats under different environmental conditions. Therefore, as maximum levels for T-2 and HT-2 toxins would be set in the year 2024 by the European Union Commission, it is imperative to examine if different environmental conditions influence free T2, HT-2, and their conjugated forms in stored oat grains.
The objectives of this study were to examine the impact of storage conditions, namely water activities of 0.95 aw and 0.98 aw and temperatures of 20 °C and 25 °C, on (a) the concentrations of free T-2 and HT-2, DON, and their respective glucosides and (b) the concentrations of DAS and other emerging mycotoxins in both naturally contaminated and irradiated oat grains inoculated with Fusarium langsethiae to ascertain any potential increases in toxicity in the oat grains.

2. Results

2.1. Method Validation Performance in the Oat Matrix

The multi-analyte extraction methodology was based on a dilute-and-shoot approach. The extraction efficiency (RE) of each analyte was within the acceptable range (70–120%), according to the amended guideline set by European Commission regulation No. 2021/808/EC [33], and showed good relative standard deviation (RSD) values of <15%. The goodness of fit of the calibration curve for each analyte was acceptable, with r2 values (coefficient of determination) of >0.990. The relative standard deviation of the within-laboratory reproducibility (RSDWLR), the matrix effect or the signal suppression/enhancement (SSE), and the apparent recovery (RA%) were calculated from the average of 75 replicates of the five different lots of oats spiked in quintuplicate across three separate days. The trueness and precision represented by the relative standard deviation (RSD%) of the method were satisfactory (<14%) for the validated analytes, except for nivalenol (NIV). The limit of detection (LOD) and limit of quantitation (LOQ) for the analytes ranged from 1 to 19 µg/kg and 3 to 63 µg/kg, respectively, which were lower than the minimum acceptable levels for the regulated mycotoxins in unprocessed oats [34]. The mean values of the RA, RE, RSD, LOD, and LOQ for each analyte are shown in Table 1. The relative expanded measurement uncertainties for each analyte are shown in Table S1 in the Supplementary Materials.

2.2. Initial Mycotoxin Concentrations of Oats

The initial average concentrations of DON, T-2, HT-2, and HT-2 glucoside in the naturally contaminated oats before the storage experiment were 26.9 ng/g, 61.2 ng/g, 92.2 ng/g, and 32.8 ng/g, respectively. A one-way ANOVA showed significant differences among the concentrations of T-2, HT-2, and HT-2-Glc concentrations (p < 0.05).

2.3. Impact of aw and Temperature on the Concentrations of T-2, HT-2, and HT-2-Glc in All Oat Treatments

The concentrations of HT-2-Glc were 1.5 times higher than the concentrations of HT-2 toxin at 0.95 aw at 20 °C in the naturally contaminated oats (control samples). However, there were no significant differences (p > 0.05) in their concentrations. T-2 toxin, HT-2 toxin, and HT-2-Glc concentrations were below the limit of detection (LOD) or limit of quantitation (LOQ) at 25 °C for both water activity levels examined.
Despite F. langsethiae inoculation in the oats, toxins levels were below the LOD or LOQ at all storage conditions except at 0.98 aw at 20 °C, with HT-2-Glc concentrations of 37 ng/g. A similar trend was observed in the irradiated oat control samples.
In the irradiated inoculated oats, HT-2-Glc levels significantly increased with a rise in water activity and decreased with temperature rise, with concentrations higher than other oat treatments. HT-2-Glc was highest at 0.98 aw at 20 °C. A similar trend was observed for the concentrations of HT-2 toxin in most storage conditions except at 0.98 aw at 25 °C, where an increase in concentrations was observed, with the highest concentrations of 7167 ng/g. T-2 concentrations were significantly higher than HT-2 and HT-2-Glc concentrations at 0.95 aw at both temperatures. However, at 0.98 aw and at both 20 and 25 °C, T-2 concentrations were not significantly different (p > 0.05) from HT-2-Glc concentrations. HT-2 levels were significantly higher than T-2 concentrations at 0.98 aw and 25 °C, and no significant differences (p > 0.05) exist in their concentrations at 0.98 aw and 20 °C, as shown in Table 2.
The p values of the statistical differences in the concentrations of T-2, HT-2, and HT-2-Glc under different storage conditions in all oat treatments are shown in Tables S2 and S3 in the Supplementary Materials.

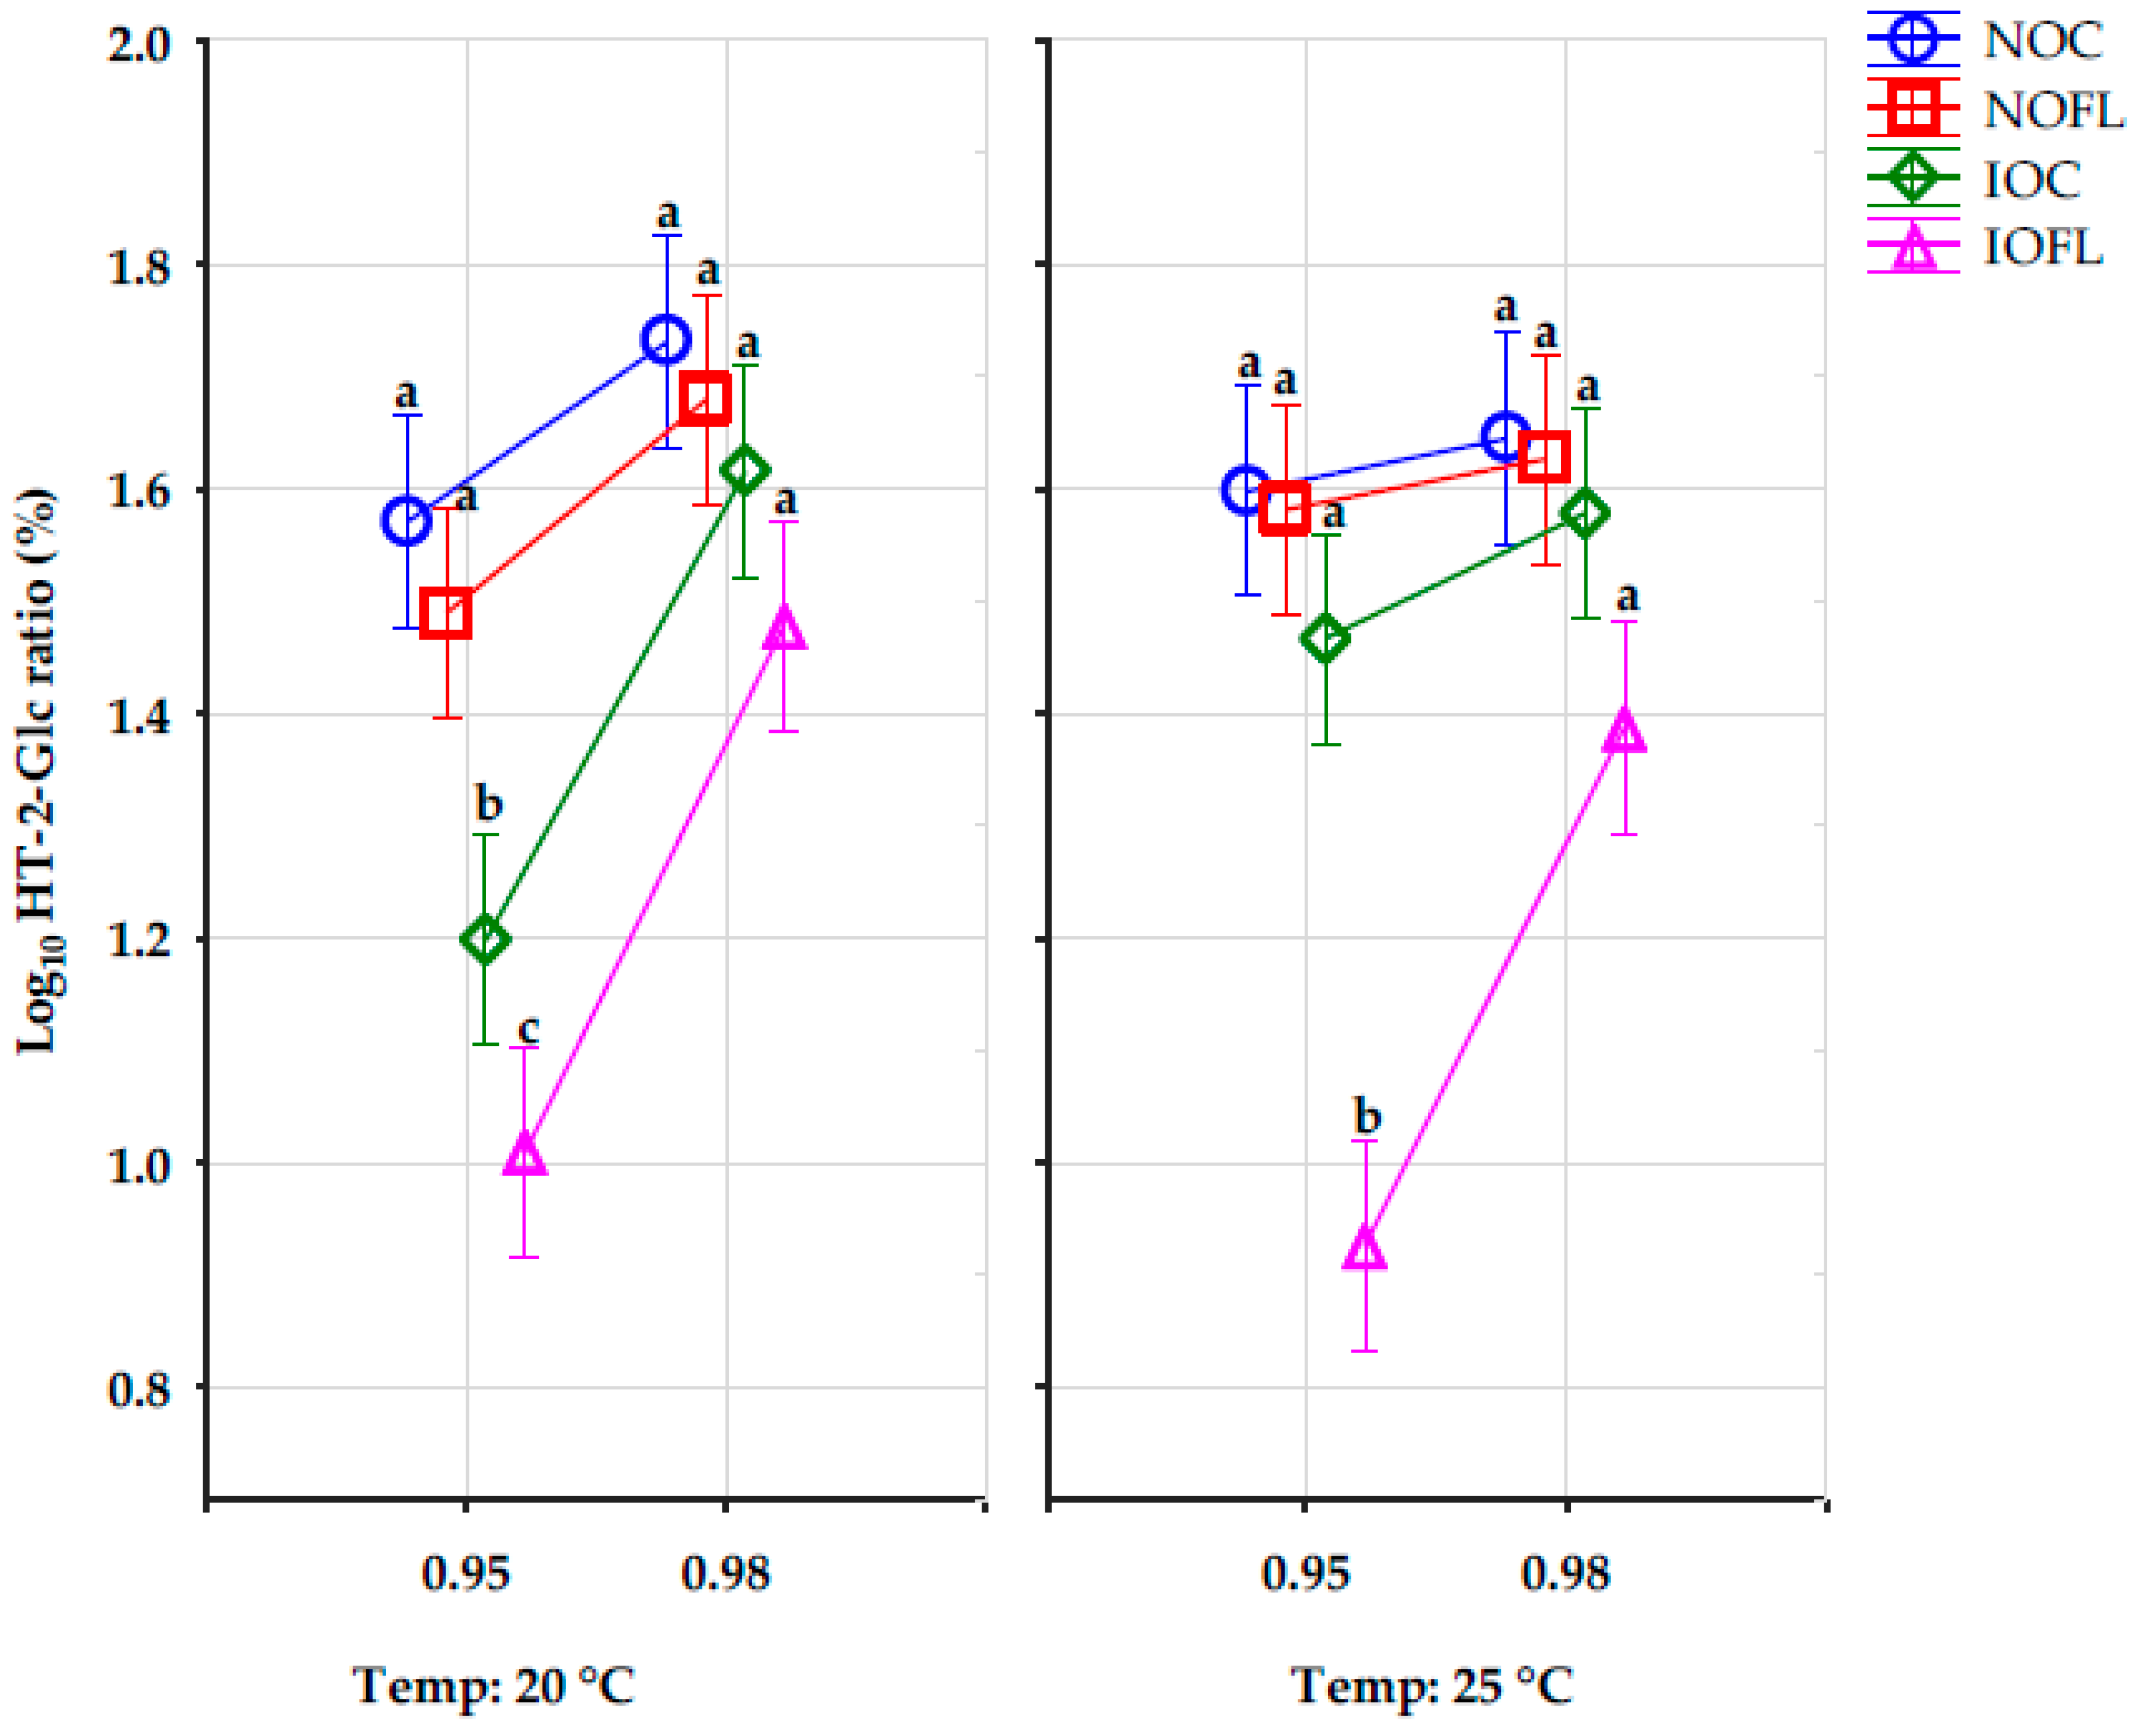
2.4. The Effect of the Interactions of Water Activity, Temperature (T), and Treatments on the Percentage Concentration Ratios of HT-2-Glucoside

The effect of the aw, T, and the combined interactions of the storage conditions and the different treatments on the concentration ratios (%) of HT-2-Glc are significant, except for the interaction between treatment and T, as well as treatment, aw, and T, as shown in Figure 1 below. The different letters of the Tukey HSD test show significant differences in the HT-2-Glc concentration ratios between both water activities at each temperature for all treatments. The HT-2-Glc concentration ratios in both irradiated treatments (IOC and IOFL) at 0.95 aw at 20 °C were significantly different from other treatments, while at 25 °C, HT-2-Glc concentration ratios in the irradiated inoculated oats (IOFL) at 0.95 aw were significantly different from other treatments.
The percentage concentration ratios of HT-2-Glc were calculated using Equation (1).
HT-2-Glc % ratio = [(HT-2-Glc)/(T-2 + HT-2 + HT-2-Glc)] × 100

2.5. Impact of Water Activity, Temperature, and Treatments on DAS Concentrations

Interactions between aw, T, and treatment have no significant impact on the concentrations (ng/g) of DAS. However, water activity and treatment as a single factor had a significant effect on DAS concentrations, as shown in Figure 2a,b. Different letters of the Tukey HSD test show significant differences in DAS concentrations between both water activities and in each treatment. DAS concentrations decreased significantly as water activities increased from 0.95 aw to 0.98 aw in all treatments. Its concentrations were highest at 0.95 aw at 20 °C for both natural treatments. Although there was a decrease in DAS concentrations with temperature rise, the effect of temperature was not significant in all treatments. Also, DAS concentrations in all treatments and all conditions were not significantly different, except for concentrations in the irradiated inoculated oats (IOFL), as shown in Figure 2b. The mean concentration values of DAS in all treatments and conditions are shown in Table S4 in the Supplementary Materials.

2.6. Impact of aw and Temperature on DON and DON-3-G in Both Natural and Irradiated Oat Grains with and without Fusarium langsethiae Inoculation

In the naturally contaminated oat control samples at 0.98 aw and both temperatures, the levels of DON-3-G were about 2.7 times lower than the DON levels. It was present at levels high enough to increase the total DON content in the oats, exceeding the legislative limits. Surprisingly, DON-3-G concentrations at 0.98 aw and 20 °C had a high mean value of 1869 µg/kg, which, in context, is higher than the maximum limits for DON. DON and DON-3-G concentrations increased with the rise in aw but decreased with the temperature rise. However, significant differences in concentrations were only observed at 0.98 aw and 25 °C, as shown in Table 3 below.
Meanwhile, in the naturally contaminated oats + F. langsethiae, DON-3-G and DON concentrations significantly increased with an increase in water activity. Also, there was a significant increase in DON-3-G concentrations with an increase in temperature at 0.98 aw. In both irradiated oat treatments, there were no significant differences in the concentrations of DON-3-G and DON as the water activity and temperature increased (Table 3).
The p values of the statistical differences in the concentrations of DON-3-G/DON under different storage conditions in all oat treatments are shown in Table S5 in the Supplementary Materials.

2.7. Impact of aw and Temperature on the Concentrations of Other Secondary Metabolites and Emerging Mycotoxins in Natural and Irradiated Oat Grains with and without Fusarium langsethiae Inoculation

In the naturally contaminated oat control samples, the highest concentrations of nivalenol were observed at 0.95 aw at 25 °C, with a mean value of 230 ng/g. Also, 3-acetyldeoxynivalenol (3-AcDON) and 15-acetyldeoxynivalenol (15-AcDON) concentrations increased as water activity increased but decreased with the temperature rise. The enniatin (A, A1, B, B1), beauvericin (BEA), and moniliformin (MON) concentrations mostly increased with a rise in water activity and temperature, with all mycotoxins having the highest concentrations at 0.98 aw at 25 °C.
In the naturally contaminated oats + F. langsethiae, the enniatins were below the limit of quantitation (LOQ) at 0.95 aw, but their concentrations almost doubled at 0.98 aw with the temperature rise. Generally, the concentrations of most emerging mycotoxins fell below the LOD and LOQ in the irradiated oat control and irradiated inoculated oats, respectively (Table 4).

3. Discussion

There is limited information available on the levels of T-2, HT-2, and HT-2-Glc in oats that are subjected to various storage conditions. This study aims to provide a detailed report on the concentrations of T-2, HT-2, HT-2-Glc, DON, DON-3-glucoside, and DAS (for the first time) in naturally and Fusarium langsethiae contaminated oats. naturally Fusarium langsethiae-contaminated under different environmental conditions. The chosen storage conditions were 0.95 and 0.98 aw at temperatures of 20 and 25 °C, which are conducive to the growth of Fusarium species and mycotoxin contamination in oat grains. These temperatures are similar to those found in the European climate [36]. Previous research has indicated that Fusarium langsethiae may colonize oat grains before and after flowering due to specific environmental factors, leading to the accumulation of HT-2 and T-2 [37]. Values of 0.95–0.98 aw may represent a moisture content between 25 and 28% [38] that can be achieved in oat grains post-harvest due to inefficient drying or compromised storage conditions resulting from pest infestations, silo leaks, seasonal rainfall, or temperature changes [39].
The influence of aw and temperature on the levels of HT-2-Glc and HT-2 toxin in naturally contaminated oats (control samples) was found to be insignificant. However, the highest concentrations of these toxins were observed at 0.95 aw and 20 °C, indicating that Fusarium langsethiae was able to grow well in grains under these conditions. This finding contrasts with a previous study which reported that the highest growth range for F. langsethiae in vitro (oat-based medium) occurred at 0.98–0.995 aw and 25 °C [31]. It is understood that F. langsethiae will continue to thrive under cool and damp conditions. Interestingly, under the same storage conditions (0.95 aw and 20 °C) and treatment (naturally contaminated oats control), the concentration of HT-2-Glc was approximately 1.5 times higher than that of HT-2. The levels of T-2 were below the LOQ compared to its acetylated form, HT-2 toxin. Other studies have also reported higher concentrations of HT-2 than its precursor, T-2 toxin [2,4]. Daud et al. [40] reported that concentrations of HT-2 toxins were higher than T-2 toxins in all conventional and organic Scottish oats examined. However, the interactions between different abiotic factors were not considered in these previous studies. Medina and Magan [41] reported higher concentrations of T-2 toxin than HT-2 toxin at 0.95 aw and 20 °C produced by F. langsethiae strains isolated from English oats grown on an oat-based medium. The contrast to the T-2 concentrations reported in our study could be due to the deacetylation of T-2 toxin to HT-2 toxin by the oat grains, which did not occur in the oat-based media. Since studies on the metabolic pathways of HT-2 in F. langsethiae are limited, there are still uncertainties about whether the high production of HT-2 was mainly due to the strain of fungus present or the natural mycobiota rapidly hydrolysing T-2 to HT-2 due to ecological stress, or the cereal itself as reported in other studies by Lattanzio et al. [42] and Kokkonen et al. [43]. Weather conditions in different geographical locations could also be responsible for differences in toxin contamination [37,44].
As the population of Fusarium langsethiae increased due to inoculation, the concentrations of T-2 and HT-2 were found to be below the LOD or LOQ under all storage conditions. This indicates that the growth and toxin production of F. langsethiae may be affected by other competitive fungi that are present in the oat grains.
The irradiated inoculated oats had a higher concentration of F. langsethiae spores (106 spores/mL) compared to the naturally contaminated oats + F. langsethiae samples. This was due to the absence of or lesser competition from other natural fungi that compete for space and nutrients. The concentrations of T-2, HT-2, and HT-2-Glc were high in the irradiated inoculated oat grains and exceeded the recommended levels set by the European Union under all storage conditions. This demonstrates the F. langsethiae strain’s ability to produce T-2, HT-2, and its glucoside HT-2-Glc under both water and temperature stress. The concentrations of T-2, HT-2, and HT-2-Glc were significantly different in most storage conditions, except at 0.98 aw and 20 °C.
Generally, the highest concentrations of HT-2-Glc were observed at 0.98 aw and 20 °C in both irradiated oat treatments. A similar observation was made by Mylona and Magan [32], who reported the highest concentrations of T-2 and HT-2 toxins in irradiated oat samples at a temperature of 25 °C and a water activity of 0.97 aw after ten days of storage. The study revealed that water activity had a greater impact on toxin production than temperature. This finding supports our observations in the irradiated oat grains.
Although there are currently no legal or recommended limits for diacetoxyscirpenol (DAS) in oats, the naturally contaminated oat control samples showed the highest concentrations of DAS at 0.95 aw and a temperature of 20 °C, with a mean value of 12 µg/kg. However, DAS levels decreased in the naturally contaminated oats + F. langsethiae, despite the fungal inoculation. The highest concentrations of DAS were observed at 0.95 aw and a temperature of 20 °C, with a mean value of 7 µg/kg. On the other hand, the irradiated oats under the same storage conditions had a mean value of 19 µg/kg, as shown in Table S4 of the Supplementary Materials. These findings suggest 20 °C as the optimum temperature for DAS production. Bryła et al. [45] analysed DAS alongside other trichothecenes in oats and reported its concentrations to be lower than the limit of quantitation (LOQ) of 1 μg/kg, which was lower than the LOQ in our study. Also, it is important to note that the study did not consider DAS under different environmental conditions.
As a regulated mycotoxin, it is important to analyse DON concentrations alongside T-2 and HT-2 toxins in oats. Our findings show that the concentrations of DON were higher than T-2 and HT-2 toxin concentrations in the naturally contaminated oats. This agrees with the observations of Nathanail et al. [46]. Their study reported DON and its glucoside, DON-3-G, with mean values of 2690 µg/kg and 806 µg/kg, respectively, while T-2, HT-2, and its glucoside HT-2-Glc had mean concentrations of 60.1 µg/kg, 159 µg/kg, and 41.4 µg/kg, respectively. However, the Finnish oat samples used had a moisture content below 15% (<0.70 aw) compared to the wetter conditions used in our study. These studies suggest that Fusarium graminearum might have a growth advantage over Fusarium langsethiae under the conditions studied, leading to an increase in the production of DON in the oats, with the occurrence of DON in oats reported by other studies [6,47].
In contrast to our findings, Langseth and Rundberget [2] reported higher concentrations of HT-2 (115 µg/kg) and T-2 (60 µg/kg) than DON concentrations, which were 56 µg/kg in Norwegian oats samples. The mean value of the moisture content of the Norwegian oats was 15 (±2). In contrast to the naturally contaminated oat control samples, DON concentrations in the irradiated oats were relatively low due to the increased concentrations of T-2 and HT-2 toxins produced by F. langsethiae.
Surprisingly, DON and DON-3-G concentrations were found in the irradiated control samples in the wettest condition, 0.98 aw, at both temperatures. This suggests that the moisture content plays a crucial role in the fungal contamination of grains.
In the naturally contaminated oat control samples, enniatin B had the highest mean concentrations (539 µg/kg) among all enniatins in all storage conditions at 0.98 aw at 25 °C. The occurrence of enniatin B at the highest concentrations among all the enniatins studied was also reported by Uhlig et al. [48]. The mean concentrations of enniatin B in their study were 47 µg/kg, 490 µg/kg, and 790 µg/kg in Norwegian oats, barley, and wheat samples, respectively. However, the grains analysed did not have the same storage conditions as those used in our study. In the wettest and warmest storage conditions, MON and BEA had their highest mean concentrations of 3050 µg/kg and 834 µg/kg, respectively. However, in the naturally contaminated oats + F. langsethiae, MON and BEA concentrations were remarkably lower at the same storage conditions (Table 4).

4. Conclusions

This research shows that the levels of Fusarium toxins vary based on different storage conditions. As the water activity changes, conjugated mycotoxins co-occur with their precursor toxins, other secondary metabolites, and emerging toxins in stored oats. Although the amount of T-2, HT-2, and HT-2-Glc in the naturally contaminated oats was not higher than the recommended or indicative levels, the coexistence of DON-3-G with DON was significant, leading to an increase in the total deoxynivalenol content and thus increasing the overall toxicity of the oats.
Mycotoxin levels in the inoculated grains indicated a high risk of contamination. This risk could occur due to inefficient drying regimes or changes in the storage environment, especially if the populations of Fusarium langsethiae are high in oats. These findings highlight the importance of conducting a robust analysis of mycotoxins in grains to avoid underestimating the total toxin content. Furthermore, since the toxicity of T-2 and HT-2 is similar [49,50] and our findings showed no significant differences in their concentrations, it is important to efficiently dry grains after harvest and monitor the abiotic conditions of the storage environment. This will help to reduce high concentrations of either individual or sums of trichothecene toxins and their respective conjugates in oat grains.

5. Materials and Methods

5.1. Fungal Isolates

Fusarium langsethiae (2390/2391), known to produce T-2 and HT-2 toxins, was used in this study. The strain was maintained in glycerol/water (70:30, v/v) at −20 °C in the culture collection of the Applied Mycology Group, Cranfield University. Fusarium langsethiae was grown on malt extract agar (MEA) + chloramphenicol (anti-bacterial agent) incubated at 25 °C for 7 days and then sub-cultured on V8 agar at 25 °C for 7 days for active sporulation.

5.2. Oat Grains and Moisture Adsorption Curve Analysis

Oat grains (with husk) were collected from Bedfordshire farms (2019 harvest). Grains were stored at 4 °C ten months before the experiment, where 5 kg of grains was exposed to 12.5–15 kGys (STERIS, Bradford, UK) to reduce microbial contamination from the grains while retaining their germination capacity. The initial mycobiota of the natural and irradiated oats were analysed by placing five grains equidistant on five MEA+ media on 9 cm Petri plates in a sterile flow bench incubated at 25 °C for 7 days. The fungal identification was visually evaluated with a stereoscope.
In total, 10.0 g of both treated oat grains both oats and treated grains was placed in 25 mL universal glass bottles and a known amount of water (0.1–3.5 mL) was added to the grains. The bottles were tightly sealed to reduce moisture loss and stored at 4 °C for 24 h with regular shaking. The samples were equilibrated at room temperature for 1 h and analysed for water activity with a water activity meter (4 TE Decagon devices, Aqualab Inc., Pullman, WA, USA) and moisture content, with the samples oven-dried at 105 °C overnight. Three replicates were analysed for each grain treatment. The amount of added water was plotted against aw values to modify the grains to the targeted aw levels. The relationship between the moisture content (MC) (dry weight basis) and aw values was also plotted and noted as discussed by Chulze et al. [38].

5.3. Grain Inoculation

Spores were harvested aseptically from a 7-day-old F. langsethiae plate scraped with a sterile spatula with sterile Tween 80 water (0.05% v/v). Then, 10 mL of the suspension was transferred into a sterile tube and shaken to obtain a homogenous mix. The spores’ concentrations were counted and calculated with a Thoma cell counting chamber. The spore suspension was further diluted with Tween 80 water to achieve the targeted concentrations of 106 spores/mL. Targeted aw levels of 0.95 and 0.98 aw for the natural and irradiated oat grains were calculated using the moisture adsorption curve. A total of 120 g of grains was mixed with sterile water (1 mL less for spore inoculum) and stored at 4 °C for 24 h to equilibrate. The control treatments were also modified with sterile water. The equilibrated grains were dispensed (15 g) into 40 mL clear glass volatile organic analysis (VOA) vials with sealable polytetrafluoroethylene (PTFE) caps containing a silicone septum for gas exchange. Grains with the same aw levels were placed in 12 L poly-propylene environmental chambers with 2 × 500 mL beakers of glycerol–water solution to maintain the target equilibrium relative humidity (ERH) of the atmosphere for each aw level. The chambers were stored at temperatures of 20 and 25 °C for 17 days. The grains were dried at 55 °C overnight, ground, and stored at −20 °C before further analysis.

5.4. Mycotoxin Analysis

5.4.1. Chemical Reagents

HT-2-toxin-3-O-β-D-glucoside was synthesized by Michlmayr et al. [51]. Other mycotoxin standards supplied by the Institute for Global Food Security, Queen’s University Belfast (QUB), UK were purchased from Romer Labs (Tulln, Austria) They include DON-3-G, HT-2 toxin, T-2 toxin, DON, 15-acetyl-deoxynivalenol (15-AcDON), 3-acetyl-deoxynivalenol (3-AcDON), DAS, enniatin A (ENN A), enniatin A1 (ENN A1), enniatin B (ENN B), enniatin B1 (ENN B1), moniliformin (MON) beauvericin (BEA), and nivalenol (NIV). LC-MS/MS-grade methanol, acetonitrile, and formic acid (Honeywell, Seelze, Germany); ammonium acetate (MS grade, Sigma-Aldrich, Darmstadt, Germany); and glacial acetic acid (Sigma-Aldrich, Burlington, MA, USA) were used. Water was purified successively by reverse osmosis and using a Milli-Q plus system from Millipore (Merck, Molsheim, France).

5.4.2. Sample Preparation and Extraction

The initial mycotoxin concentrations of the oat grains were analysed. Following the storage experiment, 64 contaminated oat samples (including replicates) were analysed for mycotoxins. A volume of 4 mL of extraction solvent (ACN/H2O/acetic acid, 79:20:1, v/v/v) was added to 1.00 g of ground oat grains. Extraction was carried out for 90 min using a multitube vortex (VWR DVX-2500, VMR International Ltd. Leicestershire, UK), followed by centrifugation for 15 min at 5000 rpm on a Rotina 380R centrifuge (Hettich, Tuttlingen, Germany). Then, 200 µL of the extract was diluted with 800 µL of dilution solvent (ACN/H2O/acetic acid, 20:79:1, v/v/v). The diluted extracts were then filtered into LC-MS/MS vials using a 0.22 µm PTFE filter, with 5 µL of the diluted extract injected into the LC-MS/MS system for analysis.

5.4.3. LC-MS/MS Parameters

The LC-MS/MS machine used in this study was a LQTRAP 5500+ MS/MS system (SCIEX, Framingham, MA, USA) equipped with a Turbo V electrospray ionization (ESI) source, coupled to an ExionLC AD System (SCIEX, Framingham, MA, USA). Chromatographic separation was performed at 27 °C on a Gemini C18-column, 100 × 4.6 mm (Phenomenex, Torrance, CA, USA). The chromatographic method, as well as chromatographic and mass spectrometric parameters, were adapted from Malachová et al. [52]. Liquid chromatography–tandem mass spectrometry (LC-MS/MS) (SCIEX, Framingham, MA, USA) was performed in the time-scheduled MRM mode both in positive and negative polarities in one chromatographic run per sample by scanning two fragmentation reactions per analyte. Elution was carried out in binary gradient mode. Both mobile phases contained 5 mM of ammonium acetate and were composed of water/methanol/acetic acid at 89:10:1 (v/v/v; eluent A) and 2:97:1 (v/v/v; eluent B), respectively, with a sample injection volume set at 5 µL, with a total runtime of 7.5 min. The gradient elution program for the elution of mycotoxins was as follows: 0 min 5% B, 0.5 min 5% B, 2.5 min 70% B, 3.5 min 95% B, 5 min 95% B, 7.5 min 5% B. The mass spectrometry parameters used are outlined in Table 5.

5.4.4. Optimised LC-MS/MS Method Validation

The optimised LC-MS/MS method for the analysis of mycotoxins in oats was validated based on the acceptable performance criteria of analytical methods set and updated by European Commission regulation No. 2021/808/EC [32]. The performance characteristics evaluated were linearity (r2), limit of detection (LOD), limit of quantification (LOQ), matrix effect or the signal suppression/enhancement (SSE), recovery of the extraction process (RE), absolute recovery (RA), and repeatability. Extraction and apparent recoveries were determined from five different lots of oats spiked in quintuplicate on three separate days, with the multi-mycotoxin working standard solution.
A working standard of 0.5 µg/mL (for DON-3-G and the enniatins) and at 1 µg/mL (for other toxins listed in Section 5.4.1) was prepared from the individual intermediate standards, diluted with ACN/H2O (50:50, v/v) to achieve the desired concentration of each analyte in the working standard. Quantification was performed via external calibration using an eight-point calibration curve achieved by serial dilutions of the multi-analyte working standard solution. Data were further processed using Analyst® 1.7.1 and SCIEX OS-Q 3.0. The validation procedure was adapted from Siri-Anusornsak et al. [53].
The apparent recovery (RA), matrix effect (SSE), and extraction efficiency (RE) were calculated using Equations (2)–(4) below.
RA (%) = area (sample spiked before extraction)/area (neat solvent standard) × 100
SSE (%) = area (sample spiked after extraction)/area (neat solvent standard) × 100
RE (%) = area (sample spiked before extraction)/area (sample spiked after extraction) × 100

5.5. Statistical Analyses

JMP® Pro 16 and Statistica 14.0.1 software were used for data analysis. Data were tested for normality and homoscedasticity using the Shapiro–Wilk and Levene tests, respectively. When data failed the normality test, data were transformed to achieve normality. Transformed data were normally distributed; therefore, a one-way ANOVA was used to find differences between groups. Also, nonparametric comparisons for each pair using the Wilcoxon method showed differences among each toxin pair for each treatment. A Tukey HSD test was used to analyse the significant impact of the interactions of the storage conditions and treatments on the DAS and HT-2-glucoside concentration ratios. The linearity assumption and the normal distribution of residuals were examined, resulting in normal plots of the residuals. Concentrations of analytes <LOD and <LOQ are assigned with values of LOD/2 and LOQ/2, respectively, for the calculation of the mean concentration and statistical analysis [35]. Statistical analyses performed were considered significant when p values were <0.05.

Supplementary Materials

The following supporting information can be downloaded at https://www.mdpi.com/article/10.3390/toxins16040166/s1: Table S1: The measurement uncertainty for each analyte. Table S2: Statistical differences in the concentrations of each trichothecene at all storage conditions using one-way ANOVA and nonparametric comparisons for each pair using the Wilcoxon method. Table S3: Statistical differences in the concentrations of trichothecenes at each water activity level and temperature for all treatments using one-way ANOVA and nonparametric comparisons for each pair using the Wilcoxon method. Table S4. Influence of aw × T on the concentrations of diacetoxyscirpenol in oats. Table S5: Statistical differences in the concentrations of DON-3-G to DON at each water activity level and temperature for all treatments using one-way ANOVA and nonparametric comparisons for each pair using Wilcoxon method.

Author Contributions

Conceptualization, A.M., A.O., J.M. and R.K.; methodology, A.O. and A.M.; validation: B.G.; metabolomic analysis: A.O. and B.G.; statistics A.O. and A.M.; writing—original draft preparation, A.O.; writing—review and editing, B.G., F.B., J.M., A.M. and R.K.; supervision, J.M., R.K. and A.M.; funding acquisition, J.M., A.M. and R.K. All authors have read and agreed to the published version of the manuscript.

Funding

This research was funded by the United Kingdom Research and Innovation (UKRI), the Biotechnology and Biological Sciences Research Council (BBSRC), and the FoodBioSystem Doctoral Training Partnership (FBSDTP); grant reference: BB/T008776/1.

Institutional Review Board Statement

Not applicable.

Informed Consent Statement

Not applicable.

Data Availability Statement

Data supporting this study are included within the article and Supplementary Materials.

Acknowledgments

We like to acknowledge Naresh Magan (Decd) who contributed to the planning and methodology of the experiments and the funding acquisition of this project.

Conflicts of Interest

The authors declare no conflicts of interest.

References

  1. Kosiak, B.; Torp, M.; Thrane, U.L.F. The occurrence of Fusarium spp. in Norwegian grain-A survey. Cereal Res. Commun. 1997, 25, 595–596. [Google Scholar] [CrossRef]
  2. Langseth, W.; Rundberget, T. The occurrence of HT-2 toxin and other trichothecenes in Norwegian cereals. Mycopathologia 1999, 147, 157–165. [Google Scholar] [CrossRef]
  3. Imathiu, S.M.; Edwards, S.G.; Ray, R.V.; Back, M.A. Fusarium langsethiae—A HT-2 and T-2 toxins producer that needs more attention. J. Phytopathol. 2013, 161, 1–10. [Google Scholar] [CrossRef]
  4. Edwards, S.G. Investigation of Fusarium Mycotoxins in UK Barley and Oat Production; HGCA Project Report No. 415; HGCA: London, UK, 2007. [Google Scholar]
  5. Opoku, N.; Back, M.; Edwards, S.G. Development of Fusarium langsethiae in commercial cereal production. Eur. J. Plant Pathol. 2013, 136, 159–170. [Google Scholar] [CrossRef]
  6. Hofgaard, I.S.; Aamot, H.U.; Torp, T.; Jestoi, M.; Lattanzio, V.M.T.; Klemsdal, S.S.; Waalwijk, C.; Van der Lee, T.; Brodal, G. Associations between Fusarium species and mycotoxins in oats and spring wheat from farmers’ fields in Norway over a six-year period. World Mycotoxin J. 2016, 9, 365–378. [Google Scholar] [CrossRef]
  7. Morcia, C.; Tumino, G.; Ghizzoni, R.; Badeck, F.W.; Lattanzio, V.M.; Pascale, M.; Terzi, V. Occurrence of Fusarium langsethiae and T-2 and HT-2 toxins in Italian malting barley. Toxins 2016, 8, 247. [Google Scholar] [CrossRef] [PubMed]
  8. Bernhoft, A.; Wang, J.; Leifert, C. Effect of Organic and Conventional Cereal Production Methods on Fusarium Head Blight and Mycotoxin Contamination Levels. Agronomy 2022, 12, 797. [Google Scholar] [CrossRef]
  9. Venslovas, E.; Mankevičienė, A.; Kochiieru, Y.; Janavičienė, S.; Dabkevičius, Z.; Bartkevičs, V.; Bērziņa, Z.; Pavlenko, R. The Effect of Ustilago maydis and Delayed Harvesting on A- and B-Type Trichothecene Concentrations in Maize Grain. J. Fungi 2023, 9, 794. [Google Scholar] [CrossRef] [PubMed]
  10. EFSA CONTAM Panel (EFSA Panel on Contaminants in the Food Chain); Knutsen, H.K.; Alexander, J.; Barregård, L.; Bignami, M.; Brüschweiler, B.; Ceccatelli, S.; Cottrill, B.; Dinovi, M.; Grasl-Kraupp, B.; et al. Risk to human and animal health related to the presence of 4, 15-diacetoxyscirpenol in food and feed. Efsa J. 2018, 16, e05367. [Google Scholar] [PubMed]
  11. Hoerr, F.J.; Carlton, W.W.; Yagen, B. Mycotoxicosis caused by a single dose of T-2 toxin or diacetoxyscirpenol in broiler chickens. Vet. Pathol. 1981, 18, 652–664. [Google Scholar] [CrossRef] [PubMed]
  12. Haschek, W.M.; Beasley, V.R. Trichothecene mycotoxins. In Handbook of Toxicology of Chemical Warfare Agents; Academic Press: Cambridge, MA, USA, 2009; pp. 353–369. [Google Scholar]
  13. CDC. Centers for Disease Control and Prevention United States. 2002; Select Agents and Toxins List. Available online: https://www.selectagents.gov/sat/list.htm (accessed on 30 December 2022).
  14. Brake, J.; Hamilton, P.B.; Kittrell, R.S. Effects of the trichothecene mycotoxin diacetoxyscirpenol on feed consumption, body weight, and oral lesions of broiler breeders. Poult. Sci. 2000, 79, 856–863. [Google Scholar] [CrossRef]
  15. Parikka, P.; Hakala, K.; Tiilikkala, K. Expected shifts in Fusarium species’ composition on cereal grain in Northern Europe due to climatic change. Food Addit. Contam. 2012, 29, 1543–1555. [Google Scholar] [CrossRef]
  16. Fredlund, E.; Gidlund, A.; Sulyok, M.; Börjesson, T.; Krska, R.; Olsen, M.; Lindblad, M. Deoxynivalenol and other selected Fusarium toxins in Swedish oats—Occurrence and correlation to specific Fusarium species. Int. J. Food Microbiol. 2013, 167, 276–283. [Google Scholar] [CrossRef]
  17. Imathiu, S.M.; Ray, R.V.; Back, M.; Hare, M.C.; Edwards, S.G. Fusarium langsethiae pathogenicity and aggressiveness towards oats and wheat in wounded and unwounded in vitro detached leaf assays. Eur. J. Plant Pathol. 2009, 124, 117–126. [Google Scholar] [CrossRef]
  18. Boenisch, M.J.; Schäfer, W. Fusarium graminearum forms mycotoxin producing infection structures on wheat. BMC Plant Biol. 2011, 11, 110. [Google Scholar] [CrossRef] [PubMed]
  19. De Boevre, M.; Di Mavungu, J.D.; Maene, P.; Audenaert, K.; Deforce, D.; Haesaert, G.; Eeckhout, M.; Callebaut, A.; Berthiller, F.; Van Peteghem, C.; et al. Development and validation of an LC-MS/MS method for the simultaneous determination of deoxynivalenol, zearalenone, T-2-toxin and some masked metabolites in different cereals and cereal-derived food. Food Addit. Contam. 2012, 29, 819–835. [Google Scholar] [CrossRef]
  20. Rasmussen, P.H.; Nielsen, K.F.; Ghorbani, F.; Spliid, N.H.; Nielsen, G.C.; Jørgensen, L.N. Occurrence of different trichothecenes and deoxynivalenol-3-β-D-glucoside in naturally and artificially contaminated Danish cereal grains and whole maize plants. Mycotoxin Res. 2012, 28, 181–190. [Google Scholar] [CrossRef] [PubMed]
  21. Bryła, M.; Waśkiewicz, A.; Podolska, G.; Szymczyk, K.; Jędrzejczak, R.; Damaziak, K.; Sułek, A. Occurrence of 26 mycotoxins in the grain of cereals cultivated in Poland. Toxins 2016, 8, 160. [Google Scholar] [CrossRef]
  22. Marin, S.; Ramos, A.J.; Cano-Sancho, G.; Sanchis, V. Mycotoxins: Occurrence, toxicology, and exposure assessment. Food Chem. Toxicol. 2013, 60, 218–237. [Google Scholar] [CrossRef] [PubMed]
  23. Canady, R.A.; Coker, R.D.; Egan, S.K.; Krska, R.; Olsen, M.; Resnik, S.; Schlatter, J. T-2 and HT-2 toxins. Safety evaluation of certain mycotoxins in food. WHO Food Addit. Ser. 2001, 47, 557–597. [Google Scholar]
  24. Meneely, J.; Greer, B.; Kolawole, O.; Elliott, C. T-2 and HT-2 Toxins: Toxicity, occurrence and analysis: A review. Toxins 2023, 15, 481. [Google Scholar] [CrossRef]
  25. Venturini, M.C.; Quiroga, M.A.; Risso, M.A.; Di Lorenzo, C.; Omata, Y.; Venturini, L.; Godoy, H. Mycotoxin T-2 and aflatoxin B1 as immunosuppressors in mice chronically infected with Toxoplasma gondii. J. Comp. Pathol. 1996, 115, 229–237. [Google Scholar] [CrossRef]
  26. Arcella, D.; Gergelova, P.; Innocenti, M.L.; Steinkellner, H. Human and animal dietary exposure to T-2 and HT-2 toxin. EFSA J. 2017, 15, e04972. [Google Scholar]
  27. Lattanzio, V.M.; Visconti, A.; Haidukowski, M.; Pascale, M. Identification, and characterization of new Fusarium masked mycotoxins, T2 and HT2 glycosyl derivatives, in naturally contaminated wheat and oats by liquid chromatography–high-resolution mass spectrometry. J. Mass. Spectrom. 2012, 47, 466–475. [Google Scholar] [CrossRef]
  28. Berthiller, F.; Crews, C.; Dall’Asta, C.; Saeger, S.D.; Haesaert, G.; Karlovsky, P.; Oswald, I.P.; Seefelder, W.; Speijers, G.; Stroka, J. Masked mycotoxins: A review. Mol. Nutr. Food Res. 2013, 57, 165–186. [Google Scholar] [CrossRef]
  29. Stenglein, S.A. Fusarium poae: A pathogen that needs more attention. J. Plant Pathol. 2009, 91, 25–36. [Google Scholar]
  30. Imathiu, S.M.; Hare, M.C.; Ray, R.V.; Back, M.; Edwards, S.G. Evaluation of pathogenicity and aggressiveness of F. langsethiae on oat and wheat seedlings relative to known seedling blight pathogens. Eur. J. Plant Pathol. 2010, 126, 203–216. [Google Scholar] [CrossRef]
  31. Medina, A.; Magan, N. Comparisons of water activity and temperature impacts on growth of Fusarium langsethiae strains from northern Europe on oat-based media. Int. J. Food Microbiol. 2010, 142, 365–369. [Google Scholar] [CrossRef]
  32. Mylona, K.; Magan, N. Fusarium langsethiae: Storage environment influences dry matter losses and T2 and HT-2 toxin contamination of oats. J. Stored Prod. Res. 2011, 47, 321–327. [Google Scholar] [CrossRef]
  33. European Commission. Commission Implementing Regulation (EU) 2021/808 of 22 March 2021 on the performance of analytical methods for residues of pharmacologically active substances used in food-producing animals and on the interpretation of results as well as on the methods. Off. J. Eur. Union 2021, 180, 84–109. [Google Scholar]
  34. European Union. Commission Regulation (EC) No 1881/2006 of 19 December 2006 setting maximum levels for certain contaminants in foodstuffs. Off. J. Eur. Union 2006, 49, 5–24. [Google Scholar]
  35. European Food Safety Authority (EFSA). Arecella, D.; Gómez Ruiz, J.A. Use of cut-off values on the limits of quantification reported in datasets used to estimate dietary exposure to chemical contaminants. Efsa J. 2018, 15, 1452E. [Google Scholar]
  36. Aldred, D.; Magan, N. Prevention strategies for trichothecenes. Toxicol. Lett. 2004, 153, 165–171. [Google Scholar] [CrossRef]
  37. Hjelkrem, A.G.R.; Aamot, H.U.; Brodal, G.; Strand, E.C.; Torp, T.; Edwards, S.G.; Dill-Macky, R.; Hofgaard, I.S. HT-2 and T-2 toxins in Norwegian oat grains related to weather conditions at different growth stages. Eur. J. Plant Pathol. 2018, 151, 501–514. [Google Scholar] [CrossRef]
  38. Cairns-Fuller, V.; Aldred, D.; Magan, N. Water, temperature and gas composition interactions affect growth and ochratoxin A production by isolates of Penicillium verrucosum on wheat grain. J. Appl. Microbiol. 2005, 99, 1215–1221. [Google Scholar] [CrossRef]
  39. Chulze, S.N.; Palazzini, J.M.; Lullien-Pellerin, V.; Ramirez, M.L.; Cuniberti, M.; Magan, N. Fusarium species infection in wheat: Impact on quality and mycotoxin accumulation. Wheat Qual. Improv. Process. Hum. Health 2020, 421–452. [Google Scholar] [CrossRef]
  40. Daud, N.; Currie, V.; Duncan, G.; Filipe, J.A.N.; Yoshinari, T.; Stoddart, G.; Roberts, D.; Gratz, S.W. Free and Modified Mycotoxins in Organic and Conventional Oats (Avena sativa L.) Grown in Scotland. Toxins 2023, 15, 247. [Google Scholar] [CrossRef]
  41. Medina, A.; Magan, N. Temperature, and water activity effects on production of T-2 and HT-2 by Fusarium langsethiae strains from north European countries. Food Microbiol. 2011, 28, 392–398. [Google Scholar] [CrossRef]
  42. Lattanzio, V.M.; Solfrizzo, M.; Visconti, A. Enzymatic hydrolysis of T-2 toxin for the quantitative determination of total T-2 and HT-2 toxins in cereals. Anal. Bioanal. Chem. 2009, 395, 1325–1334. [Google Scholar] [CrossRef]
  43. Kokkonen, M.; Ojala, L.; Parikka, P.; Jestoi, M. Mycotoxin production of selected Fusarium species at different culture conditions. Int. J. Food Microbiol. 2010, 143, 17–25. [Google Scholar] [CrossRef]
  44. Scudamore, K.; Patel, S.; Edwards, S. HT-2 toxin and T-2 toxin in commercial cereal processing in the United Kingdom, 2004–2007. World Mycotoxin J. 2009, 2, 357–365. [Google Scholar] [CrossRef]
  45. Bryła, M.; Jędrzejczak, R.; Szymczyk, K.; Roszko, M.; Obiedziński, M.W. An LC-IT-MS/MS-based method to determine trichothecenes in grain products. Food Anal. Methods 2014, 7, 1056–1065. [Google Scholar] [CrossRef]
  46. Nathanail, A.V.; Syvahuoko, J.; Malachova, A.; Jestoi, M.; Varga, E.; Michlmayr, H.; Adam, G.; Sievilainen, E.; Berthiller, F.; Peltonen, K. Simultaneous Determination of Major Type A and B Trichothecenes, Zearalenone and Certain Modified Metabolites in Finnish Cereal Grains with a Novel Liquid Chromatography-Tandem Mass Spectrometric Method. Anal. Bioanal. Chem. 2015, 407, 4745–4755. [Google Scholar] [CrossRef]
  47. Schöneberg, T.; Jenny, E.; Wettstein, F.E.; Bucheli, T.D.; Mascher, F.; Bertossa, M.; Musa, T.; Seifert, K.; Gräfenhan, T.; Keller, B.; et al. Occurrence of Fusarium species and mycotoxins in Swiss oats—Impact of cropping factors. Eur. J. Agron. 2018, 92, 123–132. [Google Scholar] [CrossRef]
  48. Uhlig, S.; Torp, M.; Heier, B.T. Beauvericin and enniatins A, A1, B and B1 in Norwegian grain: A survey. Food Chem. 2006, 94, 193–201. [Google Scholar] [CrossRef]
  49. WHO/FAO. Safety Evaluation of Certain Mycotoxins in Food. Prepared by the Fifty-Sixth Meeting of the Joint FAO/WHO Expert Committee on Food Additives (JECFA); WHO Food Additives Series 47; FAO food and nutrition paper 74; International Programme on Chemical Safety; World Health Organization: Geneva, Switzerland, 2001. [Google Scholar]
  50. Schuhmacher-Wolz, U.; Heine, K.; Schneider, K. Report on toxicity data on trichothecene mycotoxins HT-2 and T-2 toxins. EFSA Support. Publ. 2010, 7, 65. [Google Scholar] [CrossRef]
  51. Michlmayr, H.; Varga, E.; Malachová, A.; Fruhmann, P.; Piątkowska, M.; Hametner, C.; Šofrová, J.; Jaunecker, G.; Häubl, G.; Lemmens, M.; et al. UDP-glucosyltransferases from rice, Brachypodium, and barley: Substrate specificities and synthesis of type A and B trichothecene-3-O-β-D-glucosides. Toxins 2018, 10, 111. [Google Scholar] [CrossRef]
  52. Malachová, A.; Sulyok, M.; Beltrán, E.; Berthiller, F.; Krska, R. Optimization and validation of a quantitative liquid chromatography–tandem mass spectrometric method covering 295 bacterial and fungal metabolites including all regulated mycotoxins in four model food matrices. J. Chromatogr. 2014, 1362, 145–156. [Google Scholar] [CrossRef]
  53. Siri-Anusornsak, W.; Kolawole, O.; Mahakarnchanakul, W.; Greer, B.; Petchkongkaew, A.; Meneely, J.; Elliott, C.; Vangnai, K. The occurrence and co-occurrence of regulated, emerging, and masked mycotoxins in rice bran and maize from Southeast Asia. Toxins 2022, 14, 567. [Google Scholar] [CrossRef]
Figure 1. HT-2-Glc concentration ratios (%) in all oat treatments and all storage conditions. Vertical bars denote 0.95 confidence intervals. Different letters show significant differences in HT-2-Glc concentration ratios between all oat treatments at each water activity level for each temperature using the Tukey HSD test. HT-2-Glc: HT-2-glucoside. Water activity: 0.95 and 0.98. Temperature: 20 and 25 °C. NOC: naturally contaminated oat control. NOFL: naturally contaminated oat + F. langsethiae. IOC: irradiated oat control. IOFL: irradiated oat + F. langsethiae. Concentrations of analytes <LOD and <LOQ are assigned with values of LOD/2 and LOQ/2, respectively [35].
Toxins 16 00166 g001
Figure 2. Impact of (a) water activity and (b) treatment on DAS concentrations (ng/g). Vertical bars denote 0.95 confidence intervals. Different letters show significant differences in DAS concentrations between both water activities and among the treatments using the Tukey HSD test. DAS: diacetoxyscirpenol. aw: water activity (0.95 and 0.98). NOC: naturally contaminated oat control. NOFL: naturally contaminated oats + F. langsethiae. IOC: irradiated oat control. IOFL: irradiated oat + F. langsethiae. Concentrations of analytes <LOD and <LOQ are assigned with values of LOD/2 and LOQ/2, respectively [35].
Toxins 16 00166 g002
Table 1. Mean values (n = 75) of the inter-day precision within-lab reproducibility (WLR) method validation for wheat grains.
ComponentsRSD (%)RA (%)SSE (%)RE (%)LOD (ng/g)LOQ (ng/g)
Moniliformin687116742.06.7
15-Acetyldeoxynivalenol135765952.89.2
3-Acetyldeoxynivalenol39594992.27.3
Beauvericin594921012.68.6
Diacetoxyscirpenol593891001.96.4
Deoxynivalenol396961013.712.4
DON-3-Glucoside56988771.75.5
Enniatin A786841031.03.4
Enniatin A158991981.65.4
Enniatin B997101985.117.0
Enniatin B179496982.89.2
HT-2 toxin39496984.113.6
HT-2-Glc59393955.615.8
Nivalenol2280859219.063.2
T-2-toxin29494993.411.4
RA—apparent recovery, RE—extraction efficiency, RSD—relative standard deviation, SSE—signal suppression/enhancement, LOD—limit of detection, LOQ—limit of quantitation. n = average values of 75 replicates from the 5 different lots of oats.
Table 2. Influence of aw and T on the concentrations of T-2, HT-2, and HT-2-Glc in oats.
Mycotoxins (ng/g of Grains) a
20 °C25 °C
TreatmentsawT-2 1HT-2 2HT-2-Glc 3SumT-2 1HT-2 2HT-2-Glc 3Sum
Naturally contaminated oat control0.95<LOQ264167<LOD<LOD<LOD-
0.98<LOD<LOD<LOQ-<LOD<LOD<LOQ-
Naturally contaminated oat +
F. langsethiae
0.95<LOQ<LOQ<LOQ-<LOD<LOQ<LOD-
0.98<LOQ<LOQ3737<LOD<LOQ<LOQ-
Irradiated oat
control
0.95<LOQ20<LOD20<LOQ<LOQ<LOQ-
0.98<LOQ<LOQ<LOD-<LOQ<LOQ<LOD-
Irradiated oat +
F. langsethiae
0.954488 *1655 *704 *68471822 *645 *226 *2693
0.9871526037592519,11441177167369014,974
a Results are a mean of 4 replicates in different storage conditions. aw—water activity. T—temperature. 1 T-2 toxin, 2 HT-2 toxin, 3 HT-2-glucoside. * = significant differences in the concentrations of T-2 and HT-2 at the same aw (for the same temperature in each row). <LOD—below limit of detection. <LOQ—below limit of quantitation. Sum—T-2 + HT-2 + HT-2-Glc.
Table 3. Influence of aw and T on the concentrations of deoxynivalenol and DON-3-glucoside in oats.
Mycotoxins (ng/g of Grains) a
20 °C25 °C
TreatmentsawDON 1DON-3-Glc 2SumDON 1DON-3-Glc 2Sum
Naturally contaminated oat control0.9572189027633
0.985137186970062212 *818 *3030
Naturally
contaminated oat +
F. langsethiae
0.951141 *58 *11991636 *64 *1700
0.983995 *1061 *50565052 *2297 *7349
Irradiated oat control0.95<LOD<LOD<LOD<LOD<LOD<LOD
0.9821 *7 *2833 *8 *41
Irradiated oat +
F. langsethiae
0.9520<LOQ2014<LOQ14
0.9855 *7 *6216 *7 *23
a Results are a mean of 4 replicates in different storage conditions. aw—water activity. T—temperature. 1 Deoxynivalenol, 2 Deoxynivalenol-3-Glucoside. * = significant differences in the concentrations of DON and DON-3-G at the same aw (for the same temperature in each row). <LOD—below limit of detection. <LOQ—below limit of quantitation. Sum—DON + DON-3-G.
Table 4. Influence of aw and T on the concentrations of other secondary metabolites and emerging mycotoxins in oats.
Mycotoxins (ng/g of Grains) a
TreatmentsT (°C)aW3-AcDON15-AcDONNIVENN AENN A1ENN BENN B1MONBEA
Naturally contaminated oat control200.952729137<LOQ<LOQ1913929
0.9889126138856251192205142
250.951029230<LOQ619176351
0.98268990251905394613050834
Naturally
contaminated oat +
F. langsethiae
200.95962237<LOQ<LOQ<LOQ<LOQ1323
0.9826192860<LOQ94529<LOQ141
250.952193206<LOQ<LOQ<LOQ<LOQ1922
0.9892172610<LOQ20886221142
Irradiated oat control200.95<LOD1238<LOD<LOD<LOD13<LOD4
0.98<LOD1542<LOD<LOD<LOD13<LOD12
250.95<LOD2755<LOD<LOD<LOD24<LOD15
0.98<LOD3360<LOD<LOD<LOD21<LOD22
Irradiated oat + F. langsethiae200.95<LOQ4470<LOQ<LOQ<LOQ<LOQ<LOQ25
0.98<LOQ6890<LOQ<LOQ<LOQ<LOQ<LOD47
250.95<LOQ47147<LOQ<LOQ<LOQ12<LOD36
0.98<LOQ81<LOQ<LOQ<LOQ<LOQ12<LOD39
a Results are a mean of 4 replicates in different storage conditions. aw—water activity. T—temperature. AcDON—Acetyldeoxynivalenol. NIV—Nivalenol. ENN—Enniatin. MON—Moniliformin. BEA—Beauvericin. <LOD—below limit of detection. <LOQ—below limit of quantitation.
Table 5. Optimised MS/MS parameters for the analysed mycotoxins, including precursor ions, product ions, declustering potential (DP), collision energy (CE), and collision cell exit potential (CXP).
MycotoxinsPrecursor Ion (m/z) Product Ion (m/z)DP (V)CE (V)CXP (V)
Regulated mycotoxins
Deoxynivalenol297.1249.1912120
297.1203.2912120
T-2 toxin484.3215.2762918
484.3185.1763111
HT-2 toxin442.3263.1711914
442.3215.1711922
Masked Mycotoxins
3-Acetyldeoxynivalenol397.359.2−60−38−8
397.3307.1−60−20−7
15-Acetyldeoxynivalenol339.1321.3811318
339.1261.1811714
Deoxynivalenol-3-Glucoside517.2427.1−115−30−11
517.2457.2−115−20−19
HT-2-Glc604.3323.11011716
604.3263.11012314
Emerging mycotoxins
Beauvericin801.3784.31412714
801.3244.11414312
Diacetoxyscirpenol384.2307.3861716
384.2247.3862114
Enniatin A 699.4682.4102724
699.4210.2103922
Enniatin B 657.3640.3102722
657.3196.1103910
Enniatin B1 671.3654.462722
671.3196.164122
Enniatin A1 685.4668.5112712
685.4210.1113910
Moniliformin96.941.2−5−38−14
Nivalenol 371.1281.1−90−20−15
371.159.1−90−50−7
Disclaimer/Publisher’s Note: The statements, opinions and data contained in all publications are solely those of the individual author(s) and contributor(s) and not of MDPI and/or the editor(s). MDPI and/or the editor(s) disclaim responsibility for any injury to people or property resulting from any ideas, methods, instructions or products referred to in the content.

