Article

Aflatoxin B1 Impairs Bone Mineralization in Broiler Chickens

Department of Poultry Science, University of Georgia, Athens, GA 30602, USA
*
Author to whom correspondence should be addressed.
Toxins 2024, 16(2), 78; https://doi.org/10.3390/toxins16020078
Submission received: 2 January 2024 / Revised: 25 January 2024 / Accepted: 30 January 2024 / Published: 2 February 2024

Abstract

:
Aflatoxin B1 (AFB1), a ubiquitous mycotoxin in corn-based animal feed, particularly in tropical regions, impairs liver function, induces oxidative stress and disrupts cellular pathways, potentially worsening bone health in modern broilers. A 19-day experiment was conducted to investigate the effects of feeding increasing levels of AFB1-contaminated feed (<2, 75–80, 150, 230–260 and 520–560 ppb) on bone mineralization markers in broilers (n = 360). While growth performance remained unaffected up to Day 19, significant reductions in tibial bone ash content were observed at levels exceeding 260 ppb. Micro-computed tomography results showed that AFB1 levels at 560 ppb significantly decreased trabecular bone mineral content and density, with a tendency for reduced connectivity density in femur metaphysis. Moreover, AFB1 above 230 ppb reduced the bone volume and tissue volume of the cortical bone of femur. Even at levels above 75 ppb, AFB1 exposure significantly downregulated the jejunal mRNA expressions of the vitamin D receptor and calcium and phosphorus transporters. It can be concluded that AFB1 at levels higher than 230 ppb negatively affects bone health by impairing bone mineralization via disruption of the vitamin D receptor and calcium and phosphorus homeostasis, potentially contributing to bone health issues in broilers.
Key Contribution: Exposure to aflatoxin B1 at 230 ppb or higher for 19 days in broilers significantly altered the cortical and trabecular microarchitecture of long bones, evidenced by reduced bone mineral content, density and connectivity. The disruption in bone homeostasis was driven by downregulated expression of the vitamin D receptor and calcium and phosphorus transporters in the jejunum, hindering efficient nutrient absorption and utilization for bone formation.

1. Introduction

Aflatoxicosis, a toxic and carcinogenic condition resulting from the ingestion of aflatoxin B1 (AFB1)-contaminated feed, adversely affects poultry growth and health, especially in tropical and subtropical regions where high temperature and humidity promote the growth of fungi of the Aspergillus spp. [1]. Aspergillus fungi, especially Aspergillus parasiticus and A. flavus, can colonize crops and grains in the field and during storage and produce AFB1 as a secondary metabolite [2]. AFB1 in the contaminated feed is rapidly absorbed in the duodenum of broiler chickens, then transported via the portal vein into the liver, where it is bio-transformed by cytochrome P450 enzymes into a highly reactive electrophilic metabolite, aflatoxin 8,9-epoxide [3]. As a highly reactive molecule, aflatoxin 8,9-epoxide forms covalent bonds with cellular macromolecules, such as nucleic acids, proteins and phospholipids, and causes various genetic, metabolic, signaling and cell structural alterations [4,5,6,7]. In addition, studies have shown that AFB1 can impair cell function and structure by inducing oxidative stress, which is a major mechanism of AFB1 toxicity [8]. In addition to this, aflatoxicosis affects poultry health by causing intestinal barrier impairment, immune suppression and disruption of enzymes in the liver and other organs [8,9,10,11,12].
Furthermore, modern broiler chickens are genetically selected for fast growth and high meat yield, which imposes a high metabolic demand on their skeletal system to support their growth [13,14,15]. Consequently, rapidly growing broilers exhibit inadequate calcification and increased porosity in their long bones [16]. Bone disorders such as decreased bone-breaking strength caused by aflatoxicosis in broilers have been previously linked to changes in cholecalciferol metabolism [17]. Meanwhile, broilers exposed to AFB1 have shown decreased levels of calcium and phosphorus in their blood serum, which may suggest adverse effects of AFB1 on bone homeostasis [18,19,20]. The liver damage, production of reactive oxygen species and interference with cellular processes caused by aflatoxicosis might intensify bone health issues in modern broilers. Recent human and animal studies have revealed new insights into the bone disorders caused by aflatoxicosis, where AFB1 interferes with the expression and function of the vitamin D receptor (VDR), affecting the metabolism of vitamin D2 and D3 into 25-hydroxycholecalciferol (25-OH) and 1,25-dihydroxycholecalciferol (1,25-OHD), resulting in decreased bone quality [21,22,23].
To comprehensively evaluate the adverse effects of aflatoxicosis on the bone health of broiler chickens, this study employed a novel approach: micro-CT scanning and analyses. This innovative technique assesses three-dimensional bone structure, providing an in-depth understanding of changes in the microstructural and architectural properties of the long bones under increasing doses of AFB1 in the diet. The research aimed to contribute valuable insights into the changes in microstructural and architectural properties of metaphyseal segments of long bones affected by aflatoxicosis, enhancing our understanding of the intricate interplay between AFB1 exposure and bone health in broiler chickens.

2. Results

2.1. Growth Performance

Aflatoxin B1 inclusion up to 560 ppb did not show significant differences in the growth performance parameters (body weight gain, feed intake and feed conversion ratio) of broilers raised for 19 days (p > 0.05; Table 1). No signs of morbidity were observed during the 19-day period. The observed mortality rate during the 19-day period was 1.39, 1.39, 0, 4.17 and 4.17% in the T1 (<2 ppb AFB1), T2 (75–79 ppb AFB1), T3 (150 ppb AFB1), T4 (230–260 ppb AFB1) and T5 (520–560 ppb AFB1) groups, respectively.

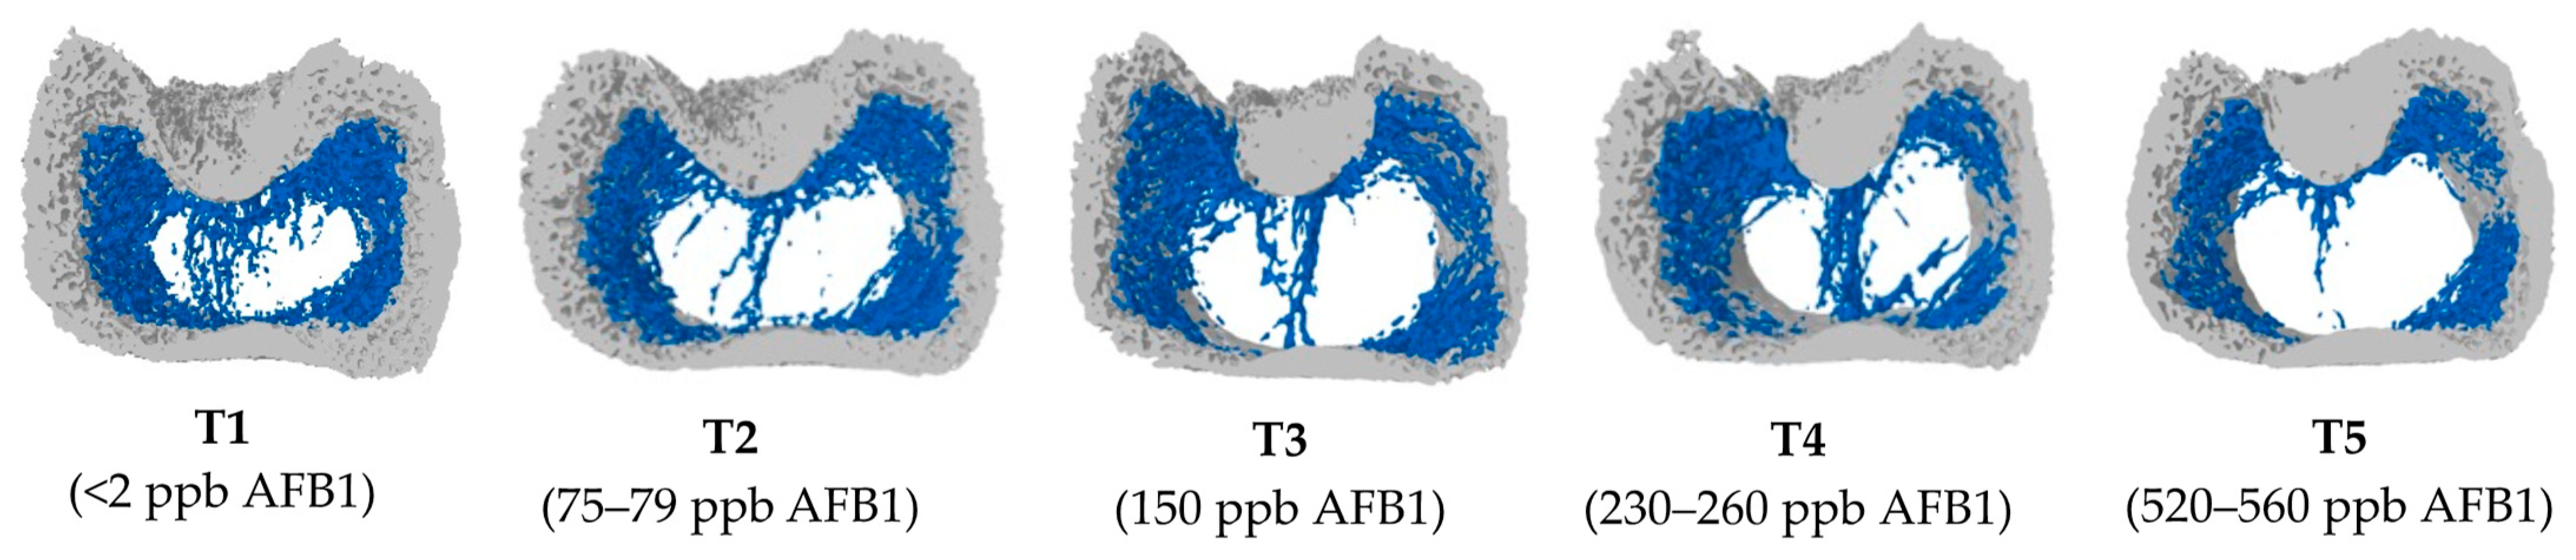
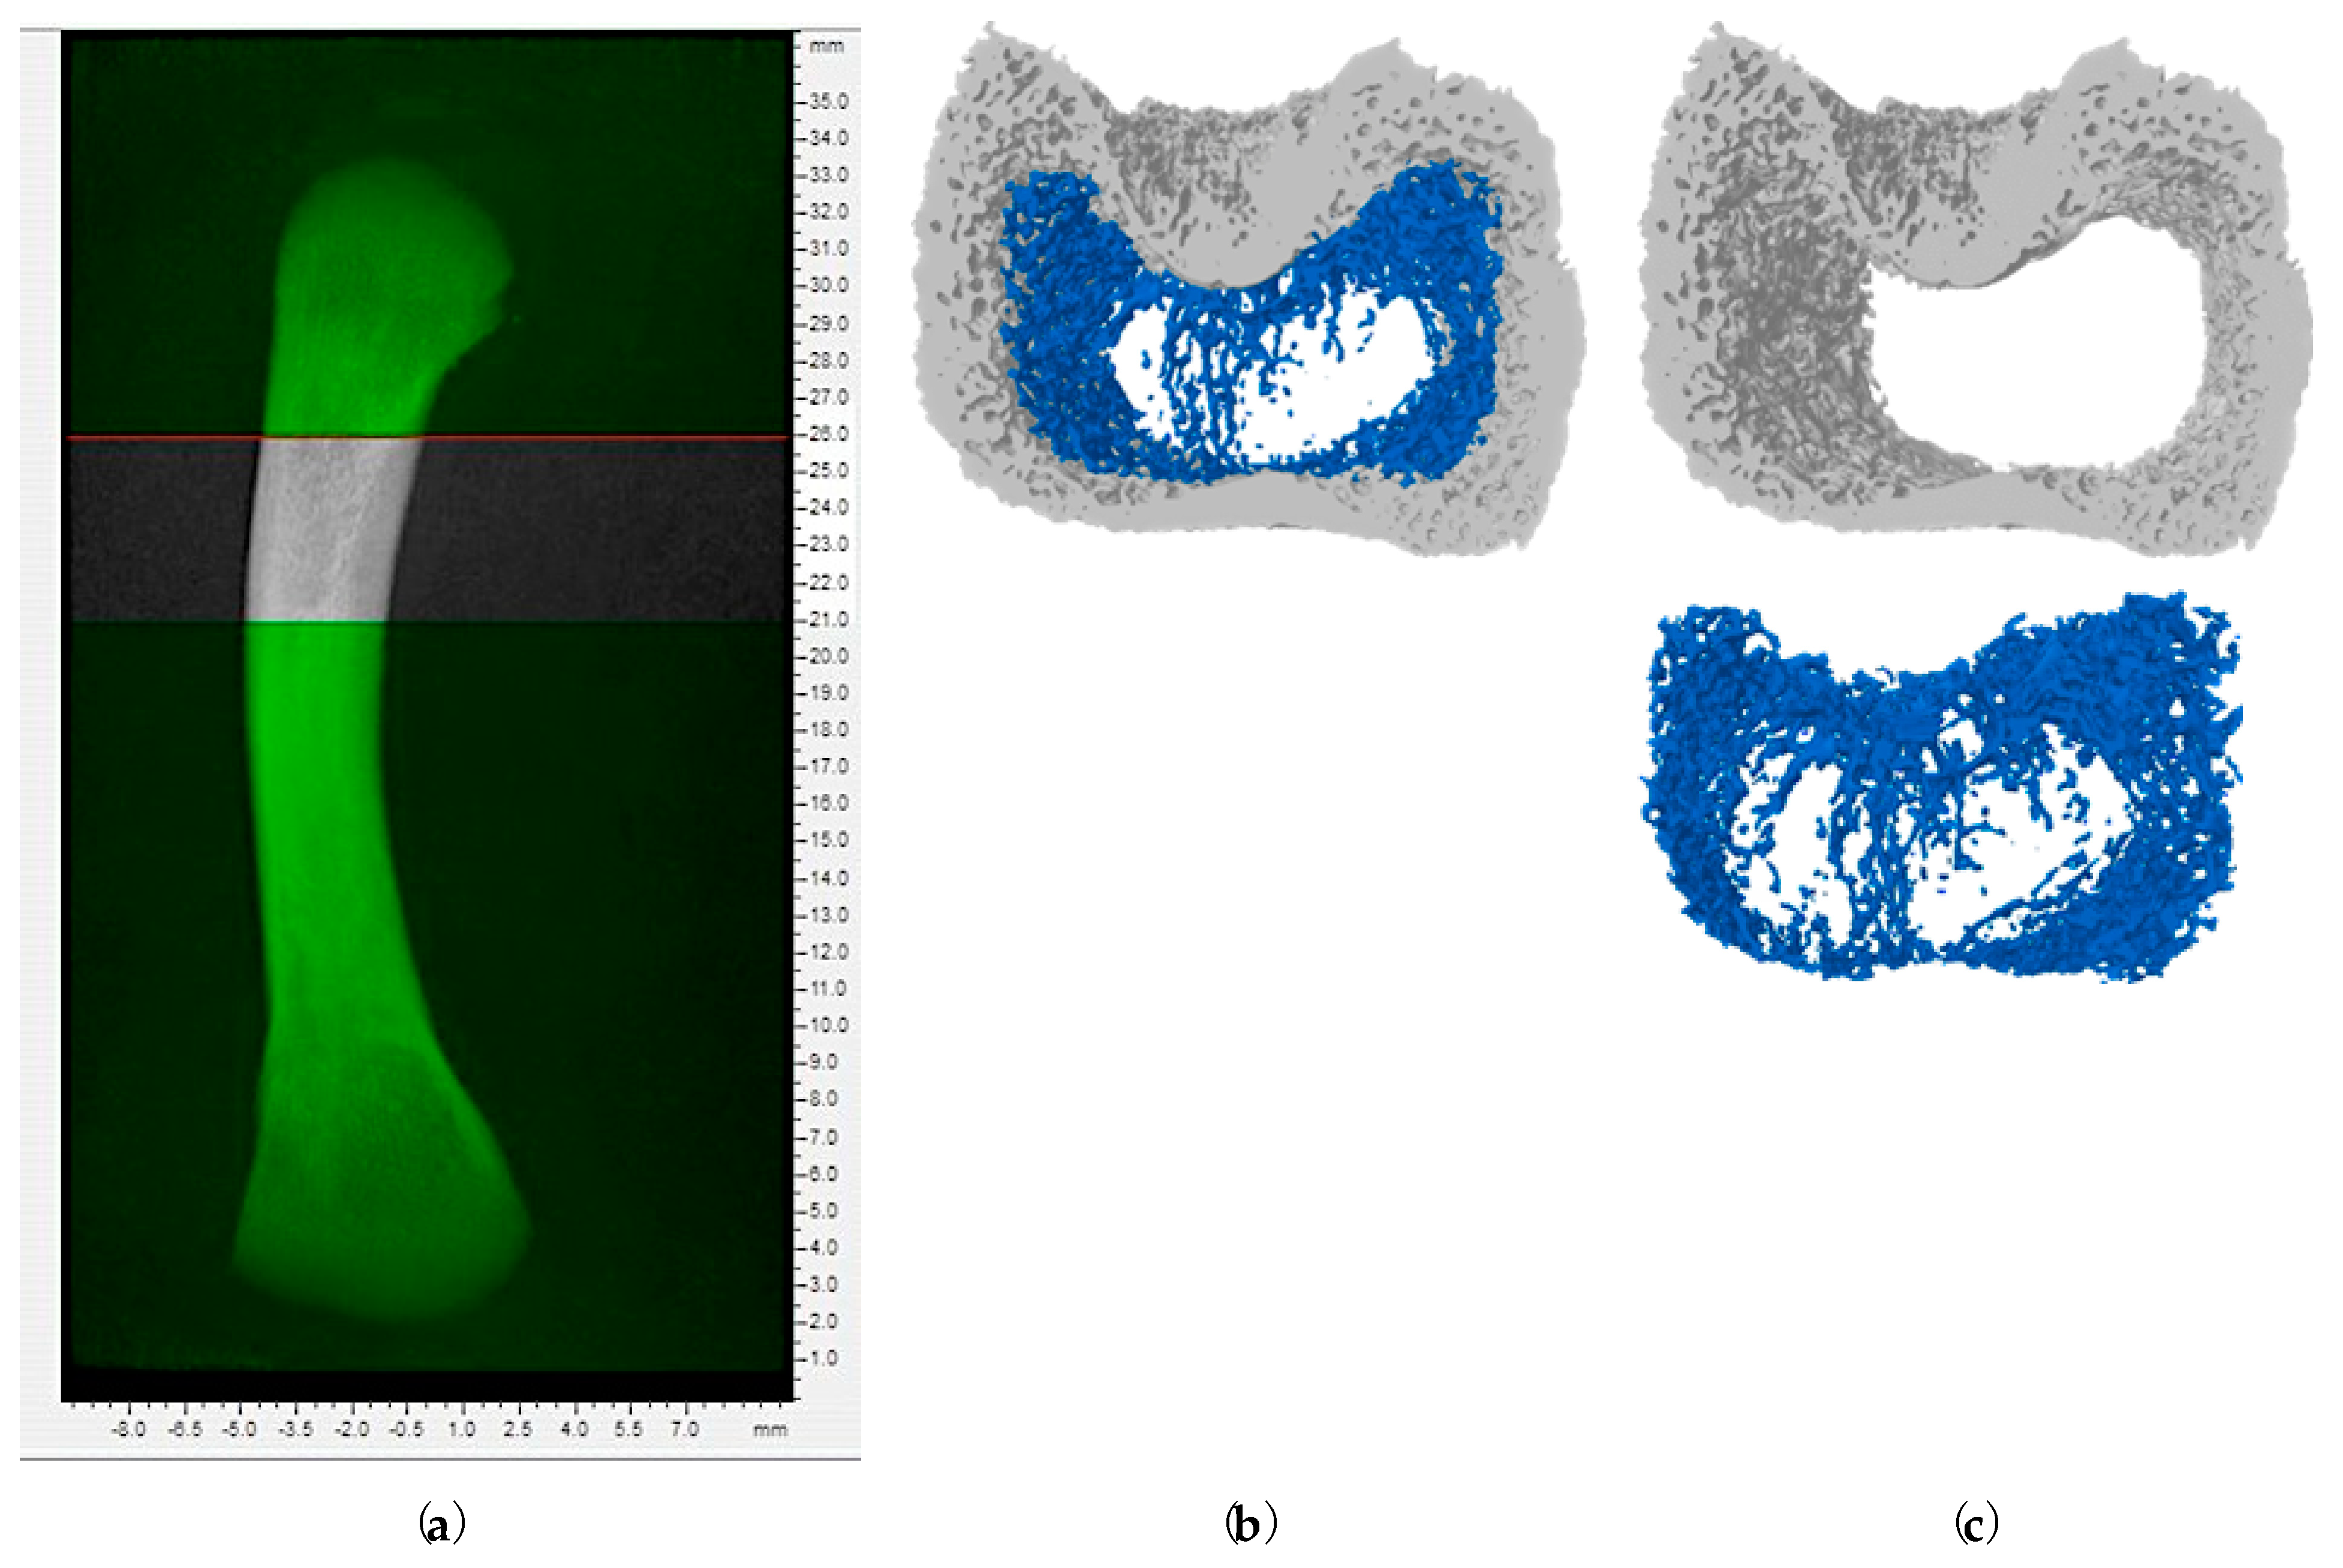
2.2. Bone Microstructural Changes in Response to Increasing Doses of Aflatoxin B1

On Day 8, no significant differences were observed in the microstructure of the femoral metaphysis across the tested levels of AFB1 (p > 0.05; Supplementary Table S1). However, by Day 19, the trabecular bone structure in the metaphysis was notably disrupted, primarily by the T5 group (i.e., 560 ppb) of AFB1 resulting in reduced bone mineral content (BMC; PModel = 0.0331; PLinear = 0.0026) and bone mineral density (BMD: PModel = 0.0214; PLinear = 0.0043), while tending to quadratically reduce connectivity density (Conn.Dn; PModel = 0.0809; PQuadratic = 0.0259; Table 2). Consequently, this led to a decrease in the overall BMC within the total bone segment of the femur metaphysis (PModel = 0.0212; PLinear = 0.0015). The cortical bone structure of the metaphysis exhibited a linear reduction in tissue volume (TV; PModel = 0.0189; PLinear = 0.0002), bone volume (BV; PModel = 0.0429; PLinear = 0.0008), volume of closed pores (Po.V(cl); PModel = 0.0500; PLinear = 0.0060) and volume of open pores (Po.V(op); PModel = 0.0067; PLinear = 0.0004) and porosity percentage (PP; PModel = 0.0337; PLinear = 0.0023) on Day 19. This effect was pronounced for the T4 and T5 groups (i.e., above 230 ppb of AFB1). Consequently, there was a linear decrease in the overall BMC, TV and BV within the total bone segment of the femur metaphysis (PModel < 0.05; PLinear < 0.05). From these results, it is confirmed that AFB1 induced structural changes in the metaphyseal segment of the femur bone when exposed for a longer period (Figure 1). Broilers exposed to the T4 and T5 groups (i.e., above 230 ppb of AFB1) had a disturbed metaphyseal trabecular pattern compared to the T1, T2 and T3 groups (i.e., below 230 ppb of AFB1). These results suggest that AFB1 exposure above 230 ppb for 19 days can potentially impair the trabecular bone, which may compromise the skeletal health and quality of broiler chickens.

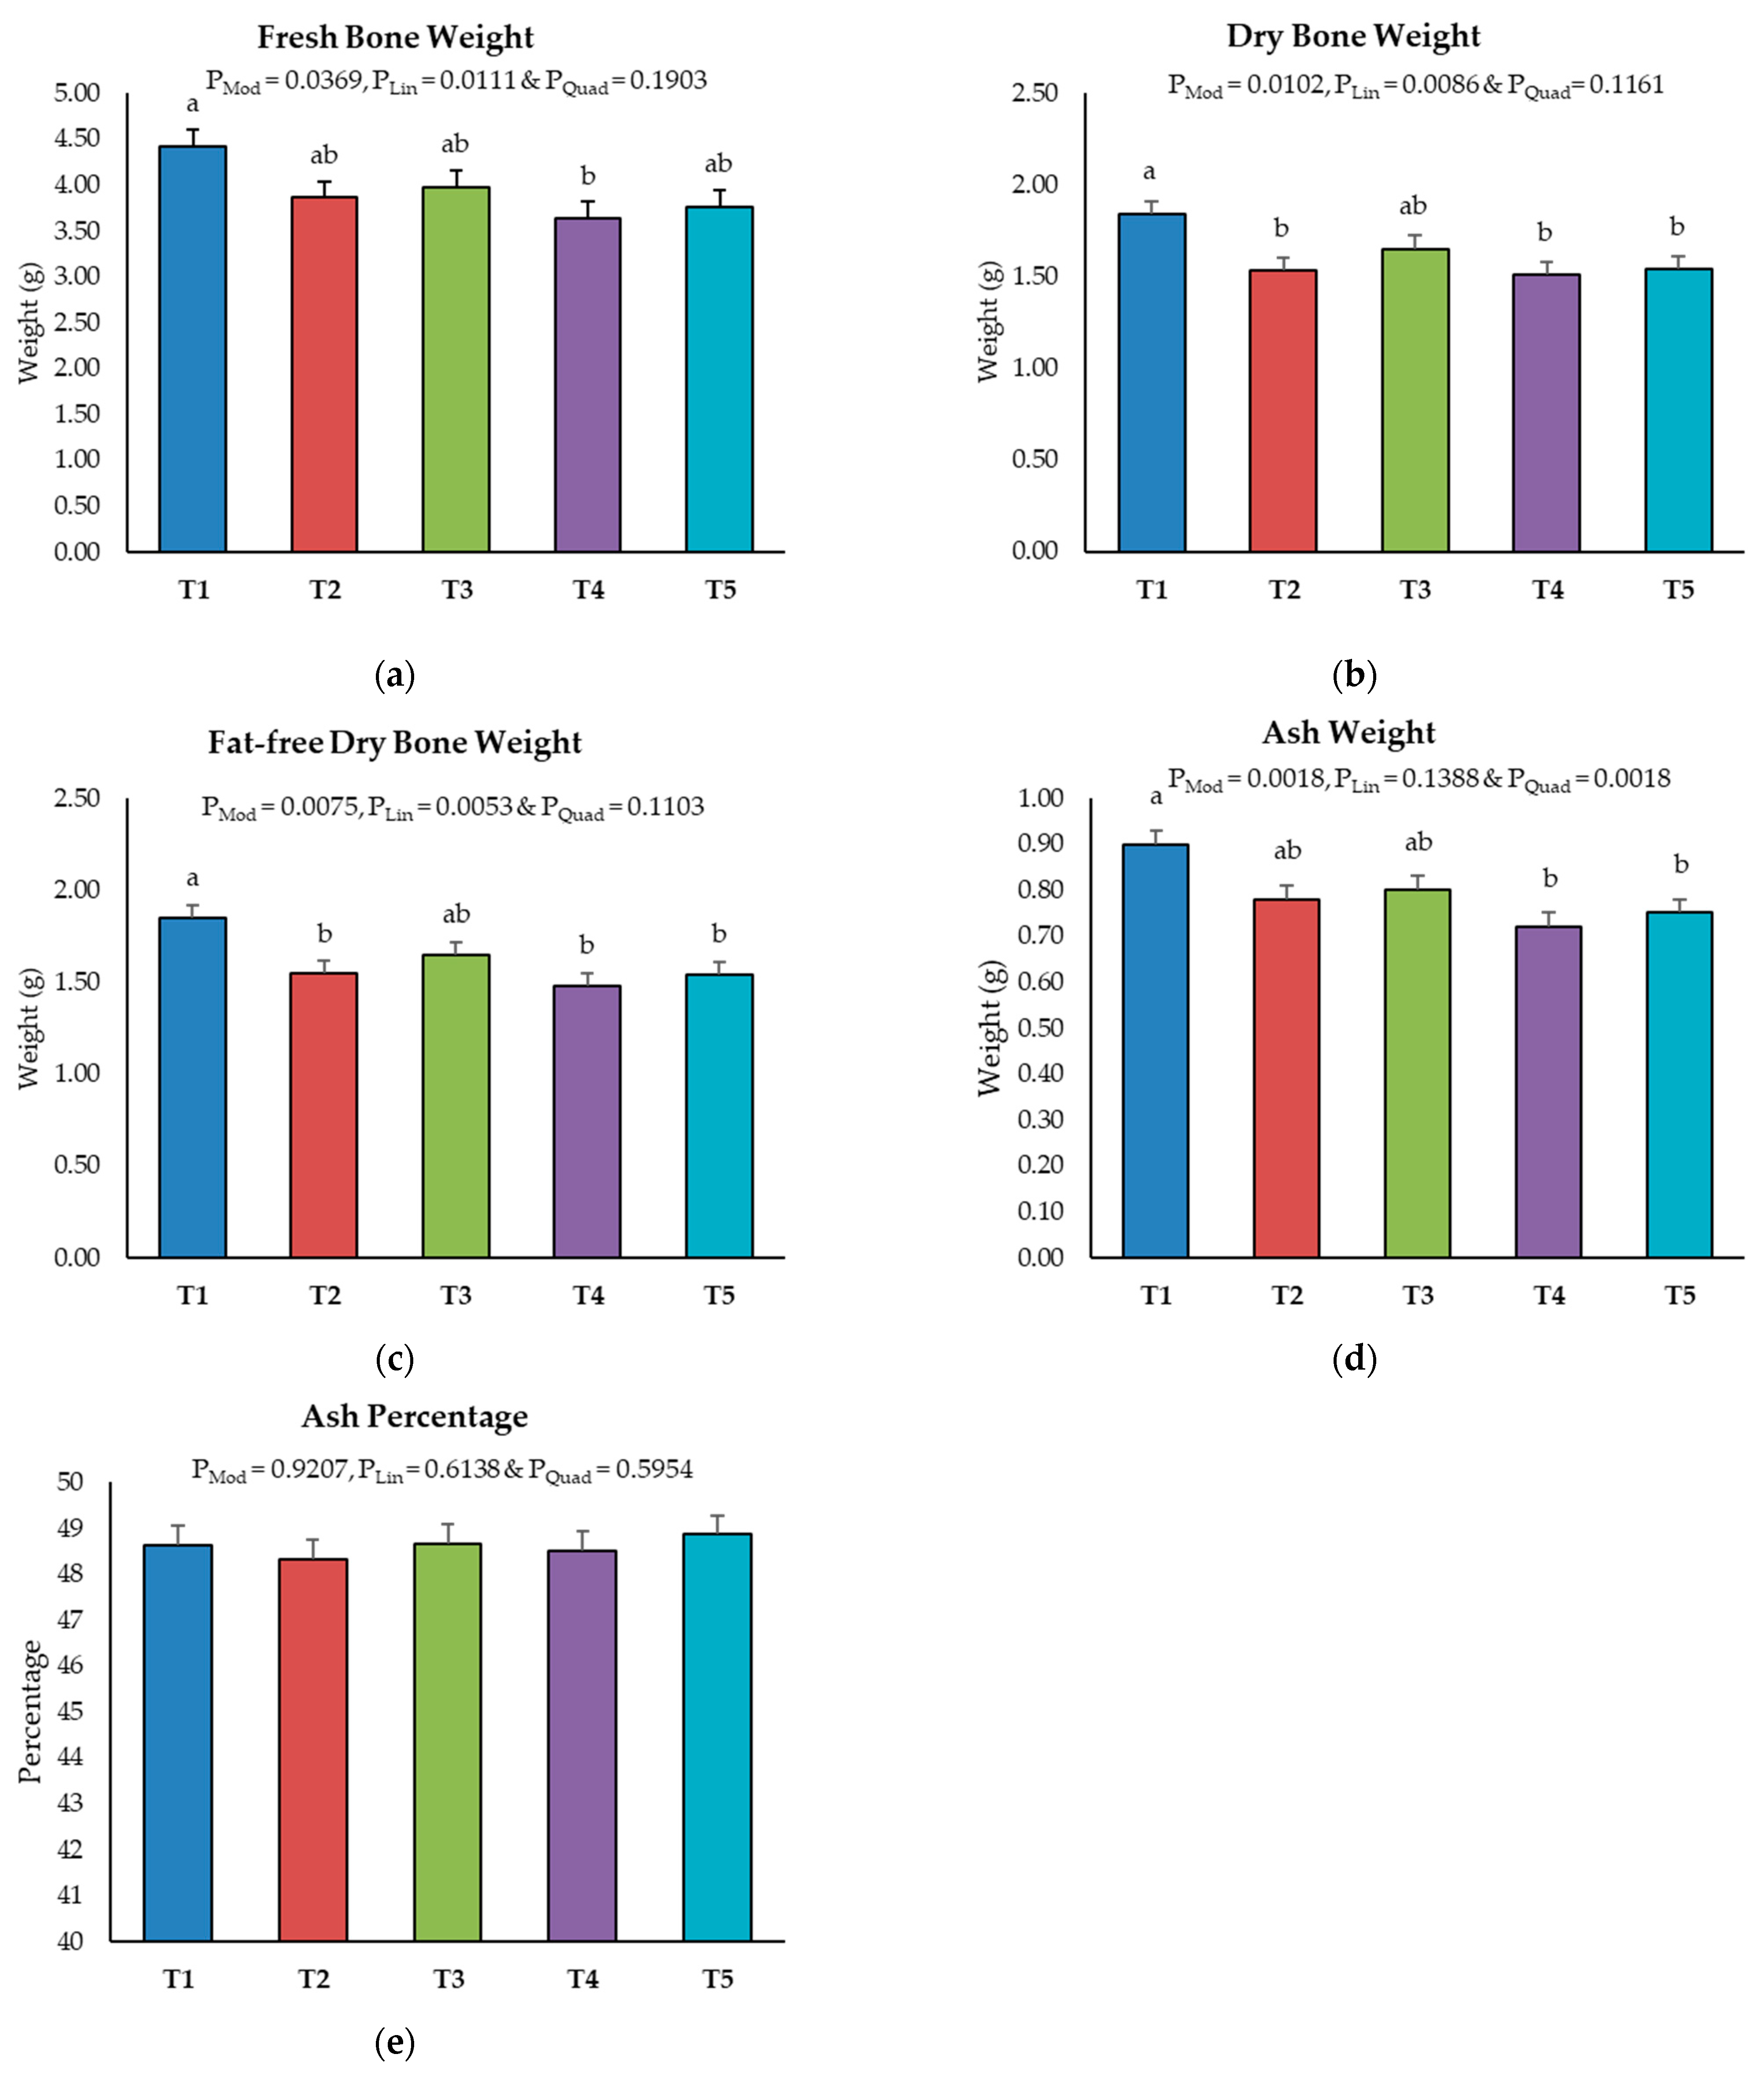
2.3. Bone Ash Content of Tibia Bone

On Day 8, no significant differences were observed in the bone ash parameters among the different AFB1 levels (p > 0.05; Supplementary Table S2). However, by Day 19, a linear reduction in fresh bone weight (FBW), dry bone weight (DBW) and fat-free dry weight (FFDW) were observed with increasing AFB1 levels (PModel < 0.05; PLinear < 0.05; Figure 2a–c). Ash weight (AW) was significantly reduced by AFB1 levels at 230 ppb and above (T3 and T4), compared to the control (T1) (Figure 2d). In contrast, ash percentage was not affected by the tested levels of AFB1 on Day 19 (p > 0.05) (Figure 2e).

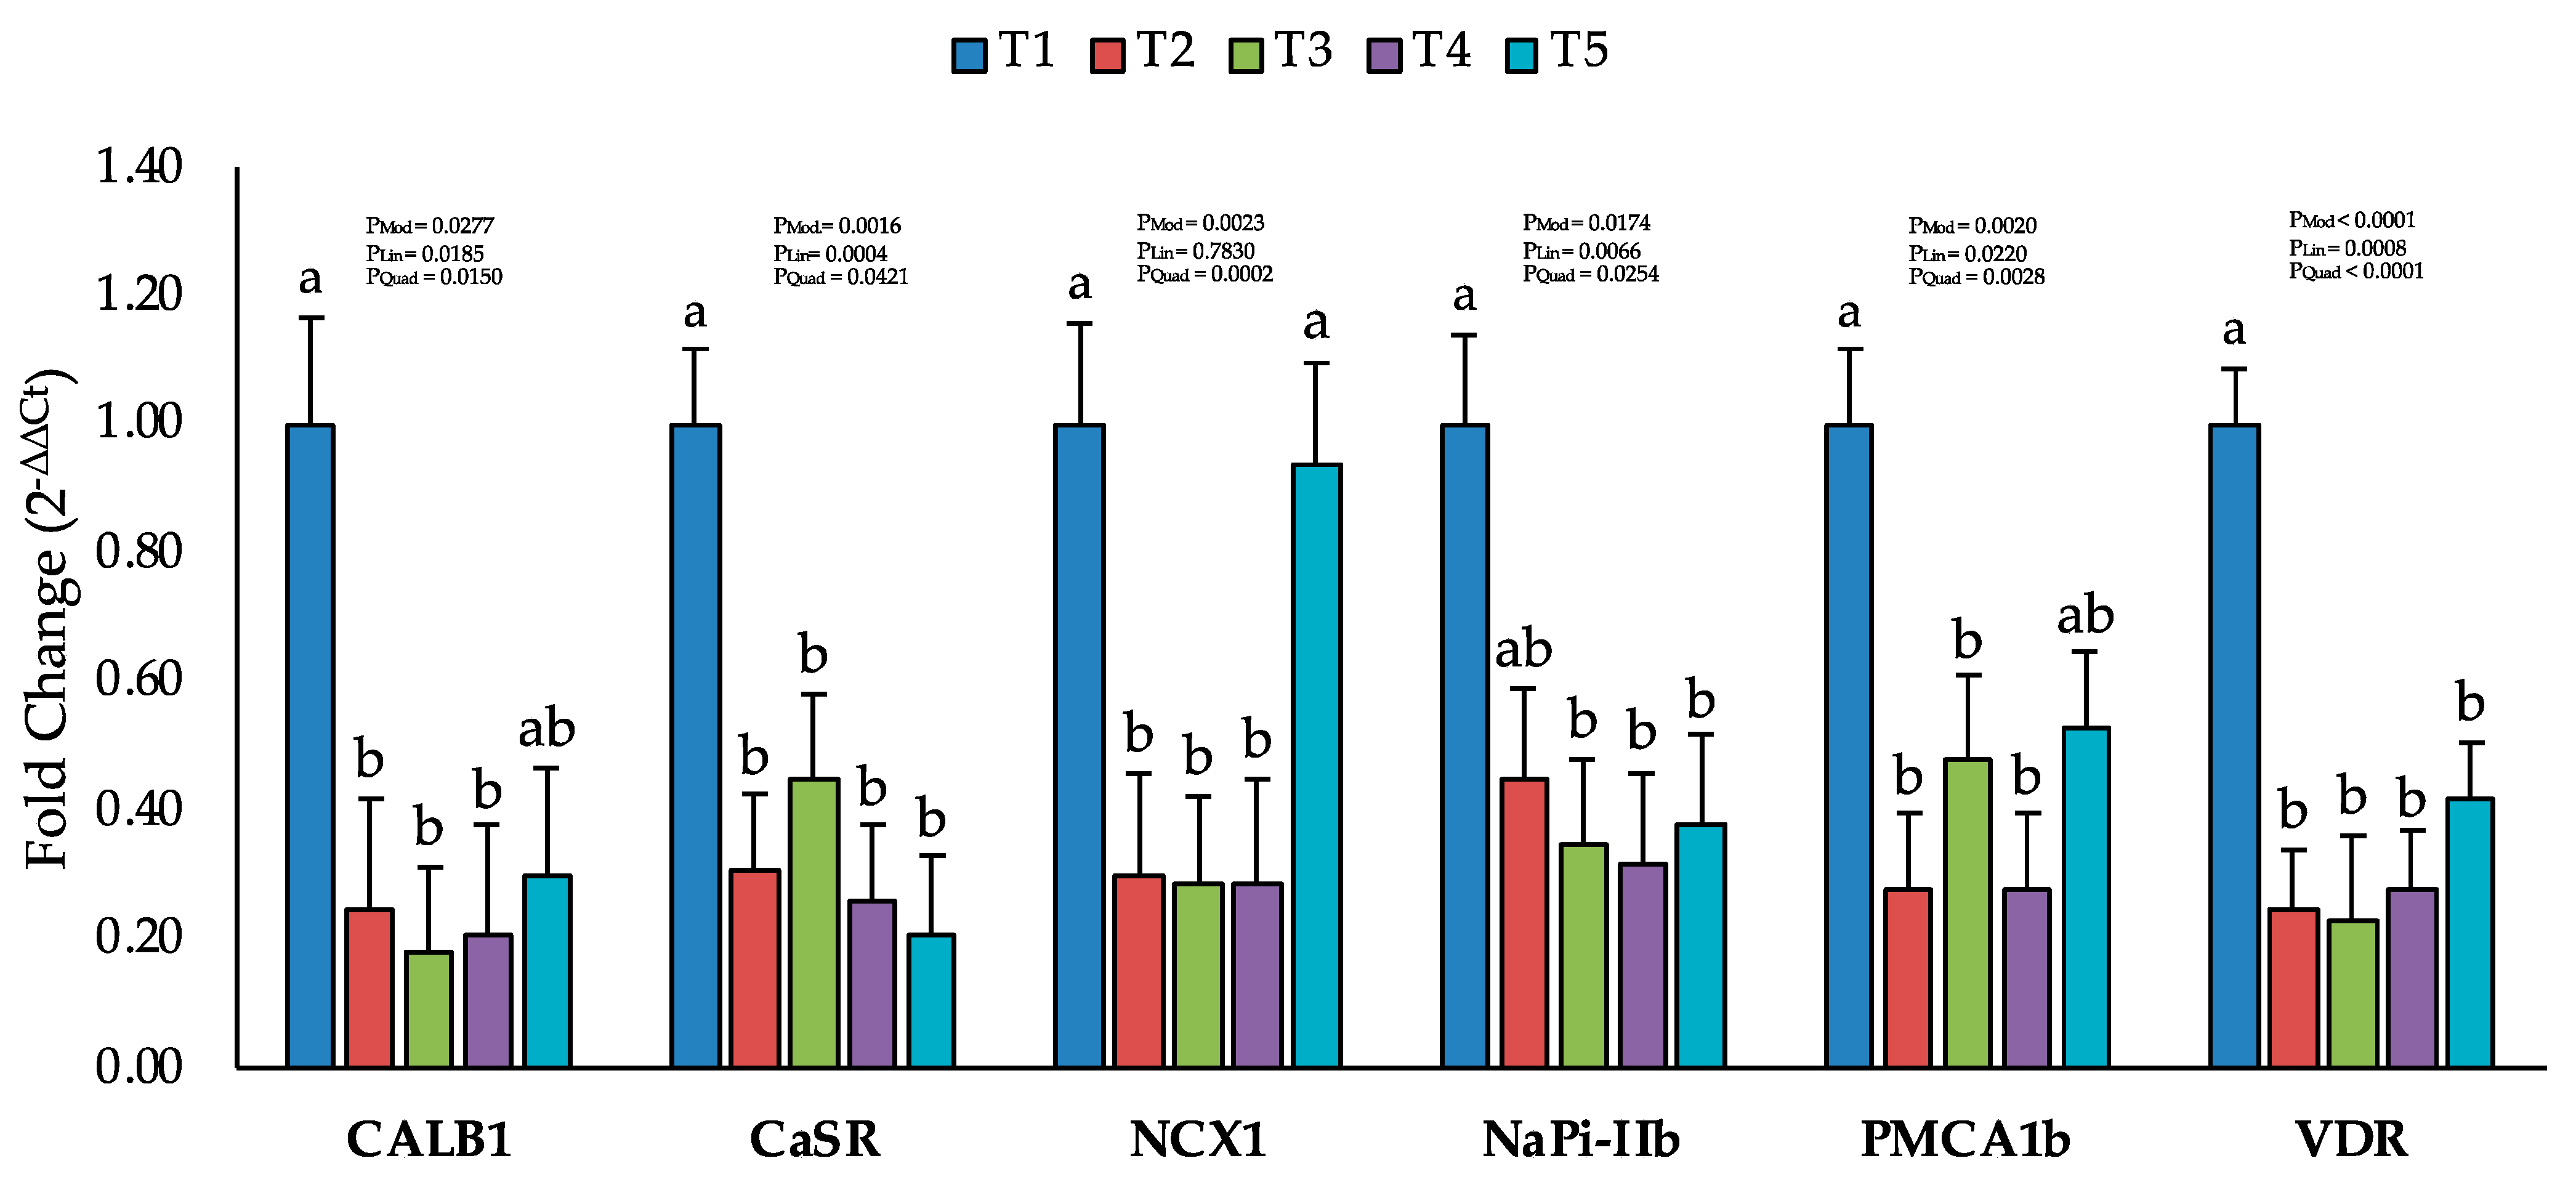
2.4. Changes in the Expression of Calcium and Phosphorus Transporters

On Day 8, the jejunal mRNA expression of VDR and calcium and phosphorus transporters did not differ from the control group (p > 0.05; Supplementary Table S3). However, by Day 19, significant reductions were observed in the mRNA expression of the vitamin D receptor (VDR), calbindin 1 (CALB1), calcium-sensing receptor (CaSR) and type IIb sodium phosphate co-transporter (NaPi-IIb) in the jejunum of broilers with increasing levels of AFB1 (p < 0.05; Figure 3). However, the mRNA expression of the sodium-calcium exchanger (NCX1) and plasma membrane calcium ATPase 2 (PMCA1b) were significantly reduced by AFB1 levels up to T3 (230–260 ppb AFB1) but non-significant at T5 (520–560 ppb AFB1), compared to the T1 group (i.e., less than 2 ppb AFB1).

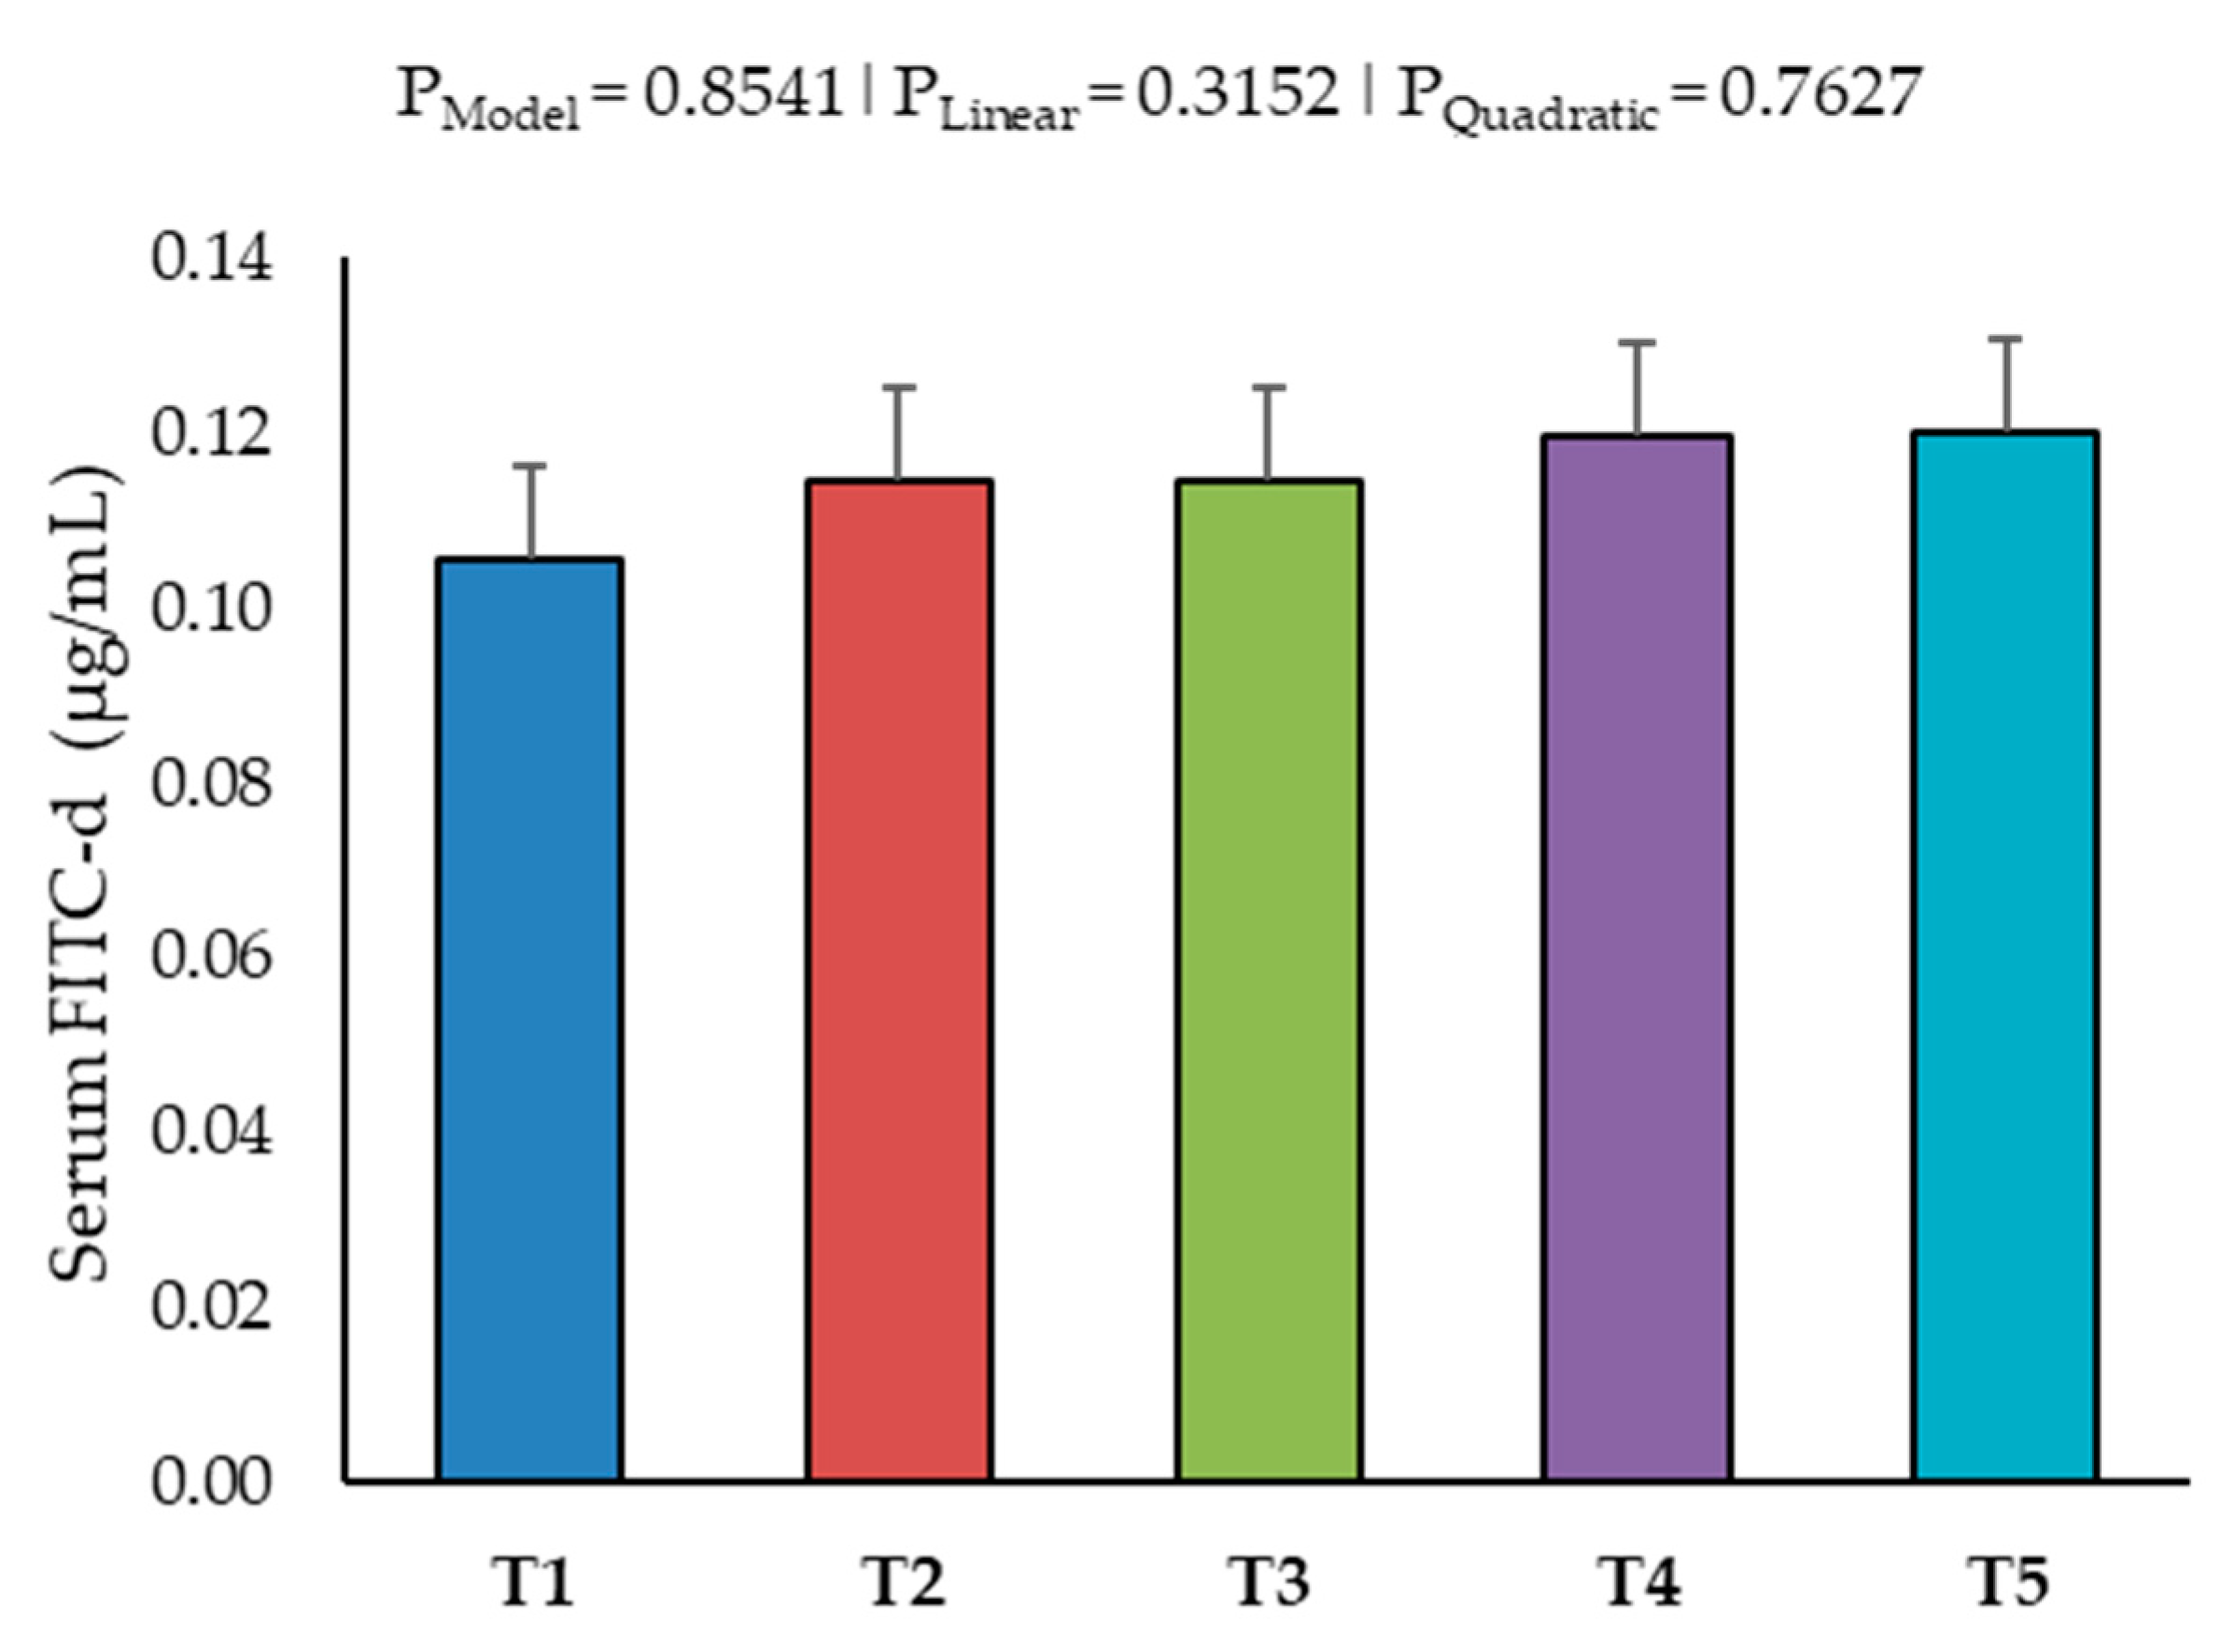
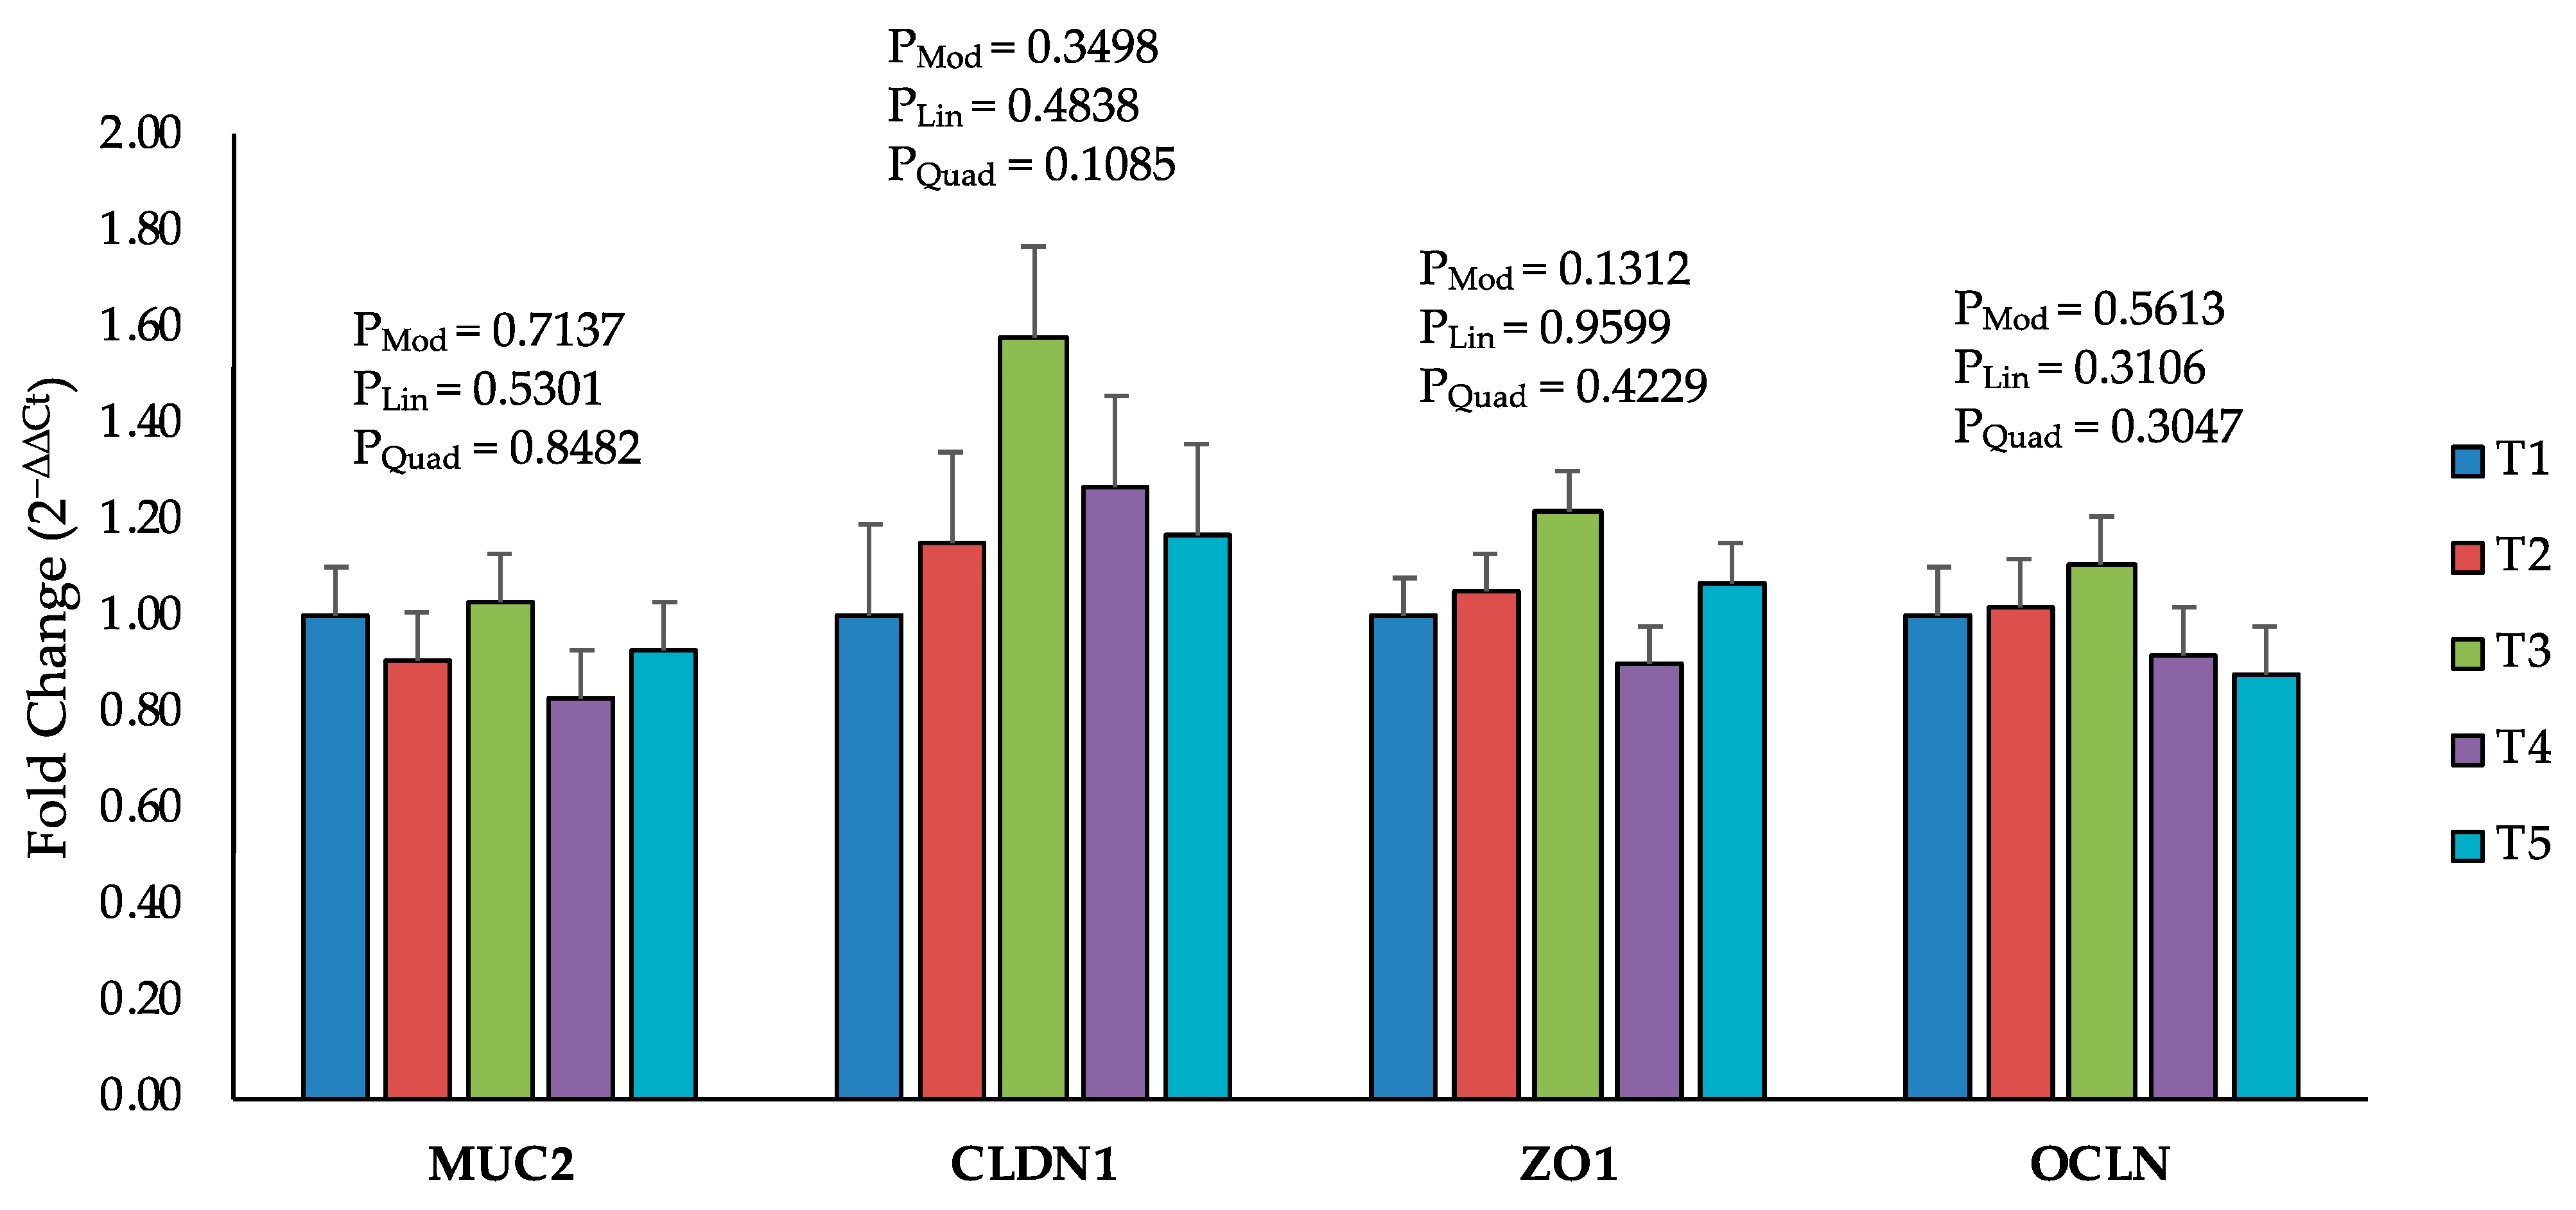
2.5. Intestinal Permeability and Tight Junction Proteins

Intestinal permeability was not affected by AFB1 up to 520–560 ppb on Day 19 (Figure 4).
The mRNA expression of tight junction proteins was not significantly affected by AFB1 up to 520–560 ppb on Day 8 (Supplementary Table S4) and Day 19 (Figure 5).

3. Discussion

Bone disorder is a major challenge for the poultry industry, as it affects the welfare and productivity of the birds [24]. Bone disorders can result from infectious or noninfectious causes, such as bacterial osteomyelitis, viral arthritis, rickets, tibial dyschondroplasia or nutritional factors [25,26]. Birds with bone disorders are often culled, condemned or downgraded at the processing plant, which causes direct economic losses to the poultry producers. Bones serve as essential multi-functional organs, providing structural support, safeguarding the vital organs and functioning as endocrine organs releasing hormones crucial for mineral homeostasis, acid–base balance and serving as reservoirs of energy and minerals [27,28,29]. Despite its pivotal role, the attention to bone health in broiler production has been relatively limited until recently. The high growth rate of modern broilers, leading to significant body weight, has led to the increased susceptibility of these birds to leg weakness and skeletal abnormalities [30]. With AFB1 being a common contaminant in poultry feed in tropical and subtropical regions, the current study used the aflatoxicosis model to explore the potential relationship between bone health and increasing AFB1 exposure. Broilers fed with a low dose of an AFB1 contaminated diet can often maintain normal growth without visible signs of mycotoxicosis, but this does not exclude the possibility of toxic effects on immune function, gut health and liver function, which may lead to bone disorders [31,32].
In the present study, we investigated the effect of increasing doses of AFB1 from <2 ppb to 560 ppb on the bone quality of broiler chickens to determine the threshold dose and duration that induces changes in bone microstructural architectural properties. AFB1 doses up to 560 ppb did not affect the growth performance of broilers raised for 19 days. This is consistent with some previous studies that reported no effects of AFB1 on body weight gain, feed intake and feed conversion ratio of broilers at similar or higher doses administered for a similar duration [7,12,33]. It is possible that a threshold concentration exists, below which AFB1 does not exert a noticeable impact on the physiological processes involved in broiler growth, and the short duration of exposure (19 days) may not have been adequate to manifest growth-related consequences. However, other studies have shown that AFB1 can impair the growth performance of broilers at even lower doses, such as 40 to 500 ppb [34,35,36,37,38]. The discrepancy among these studies may be due to differences in the source and quality of feed ingredients, the presence of other mycotoxins and the nutritional status of the birds. The nutritional status of the birds may affect the absorption, metabolism and excretion of AFB1, as well as the immune response and antioxidant defense against AFB1 toxicity [39,40]. Other mycotoxins in the feed may have synergistic or antagonistic effects on the AFB1 toxicity [7,41]. Therefore, the effects of AFB1 on broiler growth performance may not be linear or dose-dependent but somewhat influenced by multiple factors that modulate the toxicity and metabolism of AFB1.
A significant reduction in tibial ash weight was observed in broilers fed with AFB1 above 230 ppb for 19 days in the current study. Furthermore, the micro-CT analysis revealed impaired trabecular bone structure, as evidenced by the disturbed metaphyseal trabecular pattern and the reduced bone mineral content (BMC) and bone mineral density (BMD) in trabecular bone with AFB1 exposure at 230 ppb or above for 19 days. This study also showed that AFB1 exposure at 230 ppb or above for 19 days reduced the cortical bone structure, as evidenced by the decreased tissue volume (TV), bone volume (BV), tissue surface area (TS) and bone surface area (BS). A metaphyseal segment of the femur bone is the site of active bone remodeling and growth [42], which consists of two types of bone tissue: trabecular and cortical. Trabecular bone is a network of thin plates and rods that provides mechanical support and metabolic functions [43]. Cortical bone is a dense tissue layer surrounding the trabecular bone and provides strength and rigidity [44]. A decrease in the BMC and BMD of trabecular bone with aflatoxicosis indicates the loss of bone strength and metabolic functions [45]. The trabecular bones form a lattice structure, offering a greater surface area for osteoclast attachment, resulting in a higher turnover rate during bone resorption compared to cortical bones [46,47]. The loss in tissue volume and cortical bone volume signifies a reduction in total bone mass associated with aflatoxicosis. In the present study, lower bone mineral content, density and a modified ratio of BV/TV at the metaphyseal trabecular bone may indicate trabecular bone remodeling.
Furthermore, in the present study, the mRNA expression of VDR and calcium and phosphorus transporters were also in line with the decrease in bone mineralization as evidenced by bone ash and micro-CT results. The vitamin D receptor and calcium and phosphorus transporters regulate calcium and phosphorus absorption in the intestine, which are essential for bone mineralization and quality [48]. A decrease in the mRNA expression of these genes implies a decrease in the protein expression and activity of these transporters, which may compromise the intestinal uptake and utilization of calcium and phosphorus [49]. AFB1 is known to have hepatotoxic and immunosuppressive effects in poultry, which may impair liver function and the immune system [3]. The liver is responsible for synthesizing vitamin D, essential for the absorption and metabolism of calcium and phosphorus, the main components of bone minerals [50]. AFB1 as a potent hepatotoxin directly damages liver cells by binding to DNA and causing mutations, triggering oxidative stress and disrupting essential cellular processes [3]. AFB1 has been shown to bind to the VDR, a protein that acts as the receptor for vitamin D [22]. This competitive binding effectively blocks vitamin D from interacting with the VDR, hindering its ability to maintain calcium and phosphorus homeostasis [23]. Chronic exposure to AFB1 can also lead to a decrease in the expression of VDR itself. This further reduces the number of available receptors for vitamin D, compounding the impairment of VDR signaling. Vitamin D deficiency is also linked with an impaired immune system which might further impair the bone remodeling process [51,52]. Therefore, AFB1 may affect the bone microstructure of broiler chickens by disrupting vitamin D synthesis, calcium and phosphorus homeostasis and the bone remodeling process. We also found that AFB1 up to 560 ppb does not affect intestinal permeability and the mRNA expression of tight junction proteins. Similar results were reported in previous studies, suggesting that AFB1 does not induce inflammation in the gastrointestinal tract [53]. AFB1 exhibits high intestinal absorption, meaning it is quickly taken up from the gastrointestinal tract (GIT) into the bloodstream [54,55]. This rapid uptake may limit its contact with the GIT and subsequent detrimental effects on the intestinal epithelium.
Recent studies have proposed a correlation between aflatoxicosis and the initiation of oxidative stress, inflammation and apoptosis, which might also affect bone remodeling [56,57]. Exposure to aflatoxins may trigger a series of cellular responses characterized by an increased production of reactive oxygen species, inflammatory reactions and programmed cell death [58]. These observations contribute to a growing body of evidence supporting the association between aflatoxin exposure and the induction of specific biological pathways, shedding light on potential mechanisms underlying the toxic effects of aflatoxicosis.

4. Conclusions

In conclusion, this study demonstrated that aflatoxin B1 at 230 ppb or higher administered for 19 days disrupted the cortical and trabecular structural formation of the long bones and reduced the cortical tissue volume and bone volume, indicating a reduction in total bone mass. At the molecular level, AFB1 at levels as low as 75 ppb impaired bone homeostasis via disruption of the vitamin D receptor and calcium and phosphorus transporters, potentially contributing to lameness and other bone disorders in broilers.

5. Materials and Methods

5.1. Preparation of Aflatoxin B1 Contaminated Feed

Aflatoxin B1 (AFB1), with a purity exceeding 98%, obtained from Cayman Chemical (Item No.: 11293, Ann Arbor, MI, USA), was utilized in the study. To create a stock solution, 10 mg of AFB1 was dissolved in 30 mL of methanol, following the procedure outlined by [59,60]. The resulting AFB1–methanol solution was thoroughly mixed with 5 kg of basal diet to achieve a 2 mg/kg concentration, forming a premix diet contaminated with AFB1. In parallel, a control diet premix was prepared by mixing 5 kg of the basal diet with an equivalent volume of methanol. Both the contaminated and control premixes were left overnight in a fume hood to facilitate the evaporation of methanol. The premixes were subsequently mixed with the basal diet at various levels to obtain five different levels of exposure: T1 (<2 ppb AFB1), T2 (75–79 ppb AFB1), T3 (150 ppb AFB1), T4 (230–260 ppb AFB1) and T5 (520–560 ppb AFB1). The reported levels of the AFB1 in the diets are based on the analyzed values of the aflatoxin in the finished feed. Strict safety measures, including protective eyewear, personal protective equipment and gloves, were used to prepare and handle the diets to minimize the risk of AFB1 exposure.
Finished feed samples were analyzed for aflatoxin B1 using the HPLC method at the Feed and Environmental Water Laboratory of the University of Georgia. Starter feed contained <2, 79, 150, 260 and 520 ppb of aflatoxin B1, while grower feed contained <2, 75, 150, 230 and 560 ppb of aflatoxin B1, respectively.

5.2. Birds and Experimental Design

A total of 360 one-day-old Cobb500 male broilers were randomly allocated to five treatment groups with six replicates containing 12 birds each. The birds were fed a corn-soybean-based diet with five different levels of aflatoxin B1 (AFB1) for 19 days. Treatment diets were prepared by mixing a basal diet with a premix contaminated with AFB1 to achieve the following target levels in the finished diets: T1 (<2 ppb AFB1), T2 (75–79 ppb AFB1), T3 (150 ppb AFB1), T4 (230–260 ppb AFB1) and T5 (520–560 ppb AFB1). Birds were fed each treatment diet in two phases: starter (0 to 8 days) and grower (9 to 19 days) (Table 3). Birds were raised in environmentally controlled battery cages with ad libitum access to feed and water throughout the experiment. Housing temperature was closely monitored and controlled, starting at 32 °C and gradually decreasing to 23 °C by Day 19. Lighting followed a standard schedule of 23 h light and 1 h dark for the first week, then transitioned to 18 h light and 6 h dark for the remaining 12 days. The birds were checked twice daily to ensure their well-being, and factors such as room temperature, bird condition, mortality and feed and water availability were thoroughly monitored during each inspection to ensure optimal growth and health conditions.
Throughout the study, mortality was recorded, and at the end of each diet phase on Days 8 and 19, body weight and feed intake were recorded at the replicate pen level (i.e., six replicate pens per treatment group). Subsequently, individual bird averages were derived by dividing pen totals by the number of birds, adjusted to the mortality. These individual values were then reported as whole numbers for body weight, body weight gain and feed intake and the hundredth for feed conversion ratio.

5.3. Intestinal Permeability

Intestinal permeability was measured using fluorescein isothiocyanate dextran (FITC-d; MW 4000; Sigma-Aldrich, St. Louis, MO, USA), modified by the method described by a previous study [61]. Briefly, on Day 19, one bird was randomly selected from each cage and orally inoculated with 1 mL of the FITC-d solution (2.2 mg/mL). Blood was collected from the birds two hours post-inoculation and allowed to clot for two hours in the dark at room temperature. After centrifugation at 1500× g for 15 min, serum was collected. A standard curve was generated using serial dilutions of the FITC-d stock, while a dilution buffer was created using pooled serum from birds on a basal diet. Standards and samples were loaded onto black 96-well plates (Greiner BIO-ONE, Monroe, NC, USA), and the FITC-d concentrations were quantified using a spectrophotometer (VICTOR Nivo Multimode Microplate Reader, PerkinElmer, Shelton, CT, USA) at an excitation wavelength of 485 nm and an emission wavelength of 528 nm.

5.4. RNA Extraction and Real-Time RT-PCR

RNA extraction, cDNA synthesis and real-time RT-PCR were performed to investigate the gene expression of the vitamin D receptor, calcium and phosphorus transporter genes and tight junction proteins in the jejunum. RNA was extracted using QIAzol lysis reagent (Qiagen, Valencia, CA, USA), according to the manufacturer’s instructions. The quantity and purity of the RNA were assessed using a NanoDrop™ Eight Spectrophotometer (Thermo Fisher Scientific, Waltham, MA, USA). Reverse transcription was carried out using the High-Capacity cDNA synthesis kit (Applied Biosystems, Foster City, CA, USA), and the obtained cDNA was diluted 10× prior to use in the PCR reaction. The primers used for gene expression analysis are shown in Table 4. Real-time RT-PCR was performed using SYBR Green Master Mix (Bio-Rad, Hercules, CA, USA) with a QuantStudio™ 3 Real-Time PCR System (Thermo Fisher Scientific, Waltham, MA, USA). The final PCR reaction volume was 10 μL, consisting of 5 μL of SYBR Green Master Mix, 2.5 μL of cDNA, 0.5 μL each of forward and reverse primers (10 μM) and 1.5 μL of water. The thermal cycle conditions were as follows: 95 °C denaturation for 5 min, 40 cycles at 95 °C for 15 s, 58 °C for 30 s and 72 °C for 30 s, followed by 95 °C for 15 s, 60 °C for 1 min and 95 °C for 15 s.

5.5. Bone Ash Analysis

The right tibia bones were collected on Days 8 and 19 from one bird per replicate (6 bones/treatment) and stored at −20 °C until bone ash analysis. Bone ash analysis was performed using the parameters reported by [62,63]. Briefly, the initial wet weight of each bone was recorded, followed by drying at 100 °C for 24 h, and dry bone weight was recorded. To obtain the fat-free dry weight, the fat was extracted from the bones with hexane (Fisher Scientific, MA, USA) in a Soxhlet apparatus for 48 h at 70 °C and oven-dried again at 100 °C for 24 h and weighed. The bones were ashed in a furnace at 600 °C overnight, and the ash weight was measured. The bone ash percentage was calculated by dividing the ash weight by the fat-free dry weight.

5.6. Micro-Computed Tomography (Micro-CT) of Femur Bone

The right femur bones were collected from one bird per replicate (6 bones/treatment) at 8 and 19 days of the experiment to evaluate bone morphological and microarchitectural changes using the parameters reported in a previous paper from our lab (Table 5) [64]. Prior to scanning, soft tissues surrounding the bones were removed, and bones were wrapped in a cheesecloth to prevent them from drying as described by [65]. The bone was held in a low-density 50 mL tube, and extra cheesecloth was used to keep the sample firmly inside the tube holder in a vertical orientation. The tube was then mounted on the scanning stage. Skyscan 1275—Micro-CT Scanner (Bruker Corporation, Kontich, Belgium) was used to scan the bones at a source voltage of 75 kV and a source current of 133 μA. Before scanning, an alignment test and flat field correction were performed following the guidelines outlined in the micro-CT manual (Bruker Corporation, Kontich, Belgium). Random movement and 180-degree scanning were utilized to decrease beam hardening. The dynamic range for all samples was established at 0–0.025. The volume of interest is illustrated in Figure 6. A customized process for bone separation was carried out on the 3D model. The separation process was based on the distinct density and morphology traits of each bone part. CTan (Version: 1.16.4.1; Bruker Corporation, Kontich, Belgium) was used to analyze the 3D model. A threshold of 85–255 (grayscale) was applied for all the bone samples. Two solid-state phantoms composed of calcium hydroxyapatite were utilized for calibration.

5.7. Statistical Analysis

The mean and pooled standard error of the mean were calculated for all experimental data. The data were tested for the normality of studentized residuals and homogeneity of variances. One-way ANOVA and Tukey HSD tests were performed using JMP Pro 17 (SAS Institute, Cary, NC, USA) to compare the treatment groups. Statistical significance was set at a p-value < 0.05, and a p-value between 0.05 and 0.1 indicated a tendency toward significance [66]. Linear and quadratic regressions using LSMean contrast in JMP Pro 17 were used to assess the effects of increasing AFB1 doses on each parameter.

Supplementary Materials

The following supporting information can be downloaded at https://www.mdpi.com/article/10.3390/toxins16020078/s1, Supplementary Table S1. Effect of increasing the dosage of an aflatoxin B1 contaminated diet on the microstructure of femoral metaphysis on Day 8; Supplementary Table S2. Effect of increasing the dosage of an aflatoxin B1 contaminated diet on tibial bone parameters on Day 8; Supplementary Table S3. Effect of increasing the dosage of an aflatoxin B1 contaminated diet on mRNA levels of calcium and phosphorus transporter genes on Day 8; Supplementary Table S4. Effect of increasing the dosage of an aflatoxin B1 contaminated diet on mRNA levels of tight junction proteins on Day 8.

Author Contributions

Conceptualization, D.P. and W.K.K.; methodology, D.P., J.W. and W.K.K.; software, D.P.; validation, M.K.S., H.S., J.W. and W.K.K.; formal analysis, D.P. and J.W.; investigation, D.P.; resources, W.K.K.; data curation, D.P., M.K.S., H.S., J.W. and W.K.K.; writing—original draft preparation, D.P.; writing—review and editing, D.P., M.K.S., H.S., J.W. and W.K.K.; visualization, D.P. and W.K.K.; supervision, W.K.K.; project administration, W.K.K.; funding acquisition, W.K.K. All authors have read and agreed to the published version of the manuscript.

Funding

This research received no external funding.

Institutional Review Board Statement

The animal study protocol was approved by the Institutional Animal Care and Use Committee of the University of Georgia (A2021 05-013 and 3 September 2021).

Informed Consent Statement

Not applicable.

Data Availability Statement

The data presented in this study are available on request from the corresponding author.

Acknowledgments

We are grateful to the members of Kim lab for their assistance with the sample collection and laboratory analysis.

Conflicts of Interest

The authors declare no conflicts of interest.

References

  1. Medina, A.; Rodriguez, A.; Magan, N. Effect of Climate Change on Aspergillus Flavus and Aflatoxin B1 Production. Front. Microbiol. 2014, 5, 348. [Google Scholar] [CrossRef]
  2. Kumar, A.; Pathak, H.; Bhadauria, S.; Sudan, J. Aflatoxin Contamination in Food Crops: Causes, Detection, and Management: A Review. Food Prod. Process. Nutr. 2021, 3, 17. [Google Scholar] [CrossRef]
  3. Wang, Y.; Wang, X.; Li, Q. Aflatoxin B1 in Poultry Liver: Toxic Mechanism. Toxicon 2023, 233, 107262. [Google Scholar] [CrossRef]
  4. Dai, Y.; Huang, K.; Zhang, B.; Zhu, L.; Xu, W. Aflatoxin B1-Induced Epigenetic Alterations: An Overview. Food Chem. Toxicol. 2017, 109, 683–689. [Google Scholar] [CrossRef]
  5. Quezada, T.; Cuéllar, H.; Jaramillo-Juárez, F.; Valdivia, A.G.; Reyes, J. Effects of Aflatoxin B(1) on the Liver and Kidney of Broiler Chickens during Development. Comp. Biochem. Physiol. Toxicol. Pharmacol. CBP 2000, 125, 265–272. [Google Scholar] [CrossRef] [PubMed]
  6. Liu, Y.; Wang, W. Aflatoxin B1 Impairs Mitochondrial Functions, Activates ROS Generation, Induces Apoptosis and Involves Nrf2 Signal Pathway in Primary Broiler Hepatocytes. Anim. Sci. J. 2016, 87, 1490–1500. [Google Scholar] [CrossRef] [PubMed]
  7. Tessari, E.N.C.; Oliveira, C.A.F.; Cardoso, A.L.S.P.; Ledoux, D.R.; Rottinghaus, G.E. Effects of Aflatoxin B1 and Fumonisin B1 on Body Weight, Antibody Titres and Histology of Broiler Chicks. Br. Poult. Sci. 2006, 47, 357–364. [Google Scholar] [CrossRef] [PubMed]
  8. Chen, J.; Chen, K.; Yuan, S.; Peng, X.; Fang, J.; Wang, F.; Cui, H.; Chen, Z.; Yuan, J.; Geng, Y. Effects of Aflatoxin B on Oxidative Stress Markers and Apoptosis of Spleens in Broilers. Toxicol. Ind. Health 2016, 32, 278–284. [Google Scholar] [CrossRef] [PubMed]
  9. Lai, Y.; Sun, M.; He, Y.; Lei, J.; Han, Y.; Wu, Y.; Bai, D.; Guo, Y.; Zhang, B. Mycotoxins Binder Supplementation Alleviates Aflatoxin B1 Toxic Effects on the Immune Response and Intestinal Barrier Function in Broilers. Poult. Sci. 2022, 101, 101683. [Google Scholar] [CrossRef] [PubMed]
  10. Ghosh, R.C.; Chauhan, H.V.S.; Jha, G.J. Suppression of Cell-Mediated Immunity by Purified Aflatoxin B1 in Broiler Chicks. Vet. Immunol. Immunopathol. 1991, 28, 165–172. [Google Scholar] [CrossRef] [PubMed]
  11. Guo, H.; Wang, P.; Liu, C.; Chang, J.; Yin, Q.; Wang, L.; Jin, S.; Zhu, Q.; Lu, F. Compound Mycotoxin Detoxifier Alleviating Aflatoxin B1 Toxic Effects on Broiler Growth Performance, Organ Damage and Gut Microbiota. Poult. Sci. 2023, 102, 102434. [Google Scholar] [CrossRef] [PubMed]
  12. Bintvihok, A.; Kositcharoenkul, S. Effect of Dietary Calcium Propionate on Performance, Hepatic Enzyme Activities and Aflatoxin Residues in Broilers Fed a Diet Containing Low Levels of Aflatoxin B1. Toxicon 2006, 47, 41–46. [Google Scholar] [CrossRef] [PubMed]
  13. Paxton, H.; Anthony, N.B.; Corr, S.A.; Hutchinson, J.R. The Effects of Selective Breeding on the Architectural Properties of the Pelvic Limb in Broiler Chickens: A Comparative Study across Modern and Ancestral Populations. J. Anat. 2010, 217, 153–166. [Google Scholar] [CrossRef] [PubMed]
  14. Hartcher, K.M.; Lum, H.K. Genetic Selection of Broilers and Welfare Consequences: A Review. Worlds Poult. Sci. J. 2020, 76, 154–167. [Google Scholar] [CrossRef]
  15. Kim, W.K.; Bloomfield, S.A.; Ricke, S.C. Effects of Age, Vitamin D3, and Fructooligosaccharides on Bone Growth and Skeletal Integrity of Broiler Chicks. Poult. Sci. 2011, 90, 2425–2432. [Google Scholar] [CrossRef]
  16. Shim, M.Y.; Karnuah, A.B.; Anthony, N.B.; Pesti, G.M.; Aggrey, S.E. The Effects of Broiler Chicken Growth Rate on Valgus, Varus, and Tibial Dyschondroplasia. Poult. Sci. 2012, 91, 62–65. [Google Scholar] [CrossRef]
  17. Maurice, D.V.; Bodine, A.B.; Rehrer, N.J. Metabolic Effects of Low Aflatoxin B1 Levels on Broiler Chicks. Appl. Environ. Microbiol. 1983, 45, 980–984. [Google Scholar] [CrossRef]
  18. Ledoux, D.; Rottinghaus, G.; Bermudez, A.; Alonso-Debolt, M. Efficacy of a Hydrated Sodium Calcium Aluminosilicate to Ameliorate the Toxic Effects of Aflatoxin in Broiler Chicks. Poult. Sci. 1999, 78, 204–210. [Google Scholar] [CrossRef]
  19. Zhao, J.; Shirley, R.; Dibner, J.; Uraizee, F.; Officer, M.; Kitchell, M.; Vazquez-Anon, M.; Knight, C. Comparison of Hydrated Sodium Calcium Aluminosilicate and Yeast Cell Wall on Counteracting Aflatoxicosis in Broiler Chicks. Poult. Sci. 2010, 89, 2147–2156. [Google Scholar] [CrossRef]
  20. Gowda, N.K.S.; Ledoux, D.R.; Rottinghaus, G.E.; Bermudez, A.J.; Chen, Y.C. Efficacy of Turmeric (Curcuma Longa), Containing a Known Level of Curcumin, and a Hydrated Sodium Calcium Aluminosilicate to Ameliorate the Adverse Effects of Aflatoxin in Broiler Chicks. Poult. Sci. 2008, 87, 1125–1130. [Google Scholar] [CrossRef]
  21. Costanzo, P.; Santini, A.; Fattore, L.; Novellino, E.; Ritieni, A. Toxicity of Aflatoxin B1 towards the Vitamin D Receptor (VDR). Food Chem. Toxicol. 2015, 76, 77–79. [Google Scholar] [CrossRef] [PubMed]
  22. Persico, M.; Sessa, R.; Cesaro, E.; Dini, I.; Costanzo, P.; Ritieni, A.; Fattorusso, C.; Grosso, M. A Multidisciplinary Approach Disclosing Unexplored Aflatoxin B1 Roles in Severe Impairment of Vitamin D Mechanisms of Action. Cell Biol. Toxicol. 2023, 39, 1275–1295. [Google Scholar] [CrossRef] [PubMed]
  23. Malvandi, A.M.; Shahba, S.; Mehrzad, J.; Lombardi, G. Metabolic Disruption by Naturally Occurring Mycotoxins in Circulation: A Focus on Vascular and Bone Homeostasis Dysfunction. Front. Nutr. 2022, 9, 915681. [Google Scholar] [CrossRef] [PubMed]
  24. Bradshaw, R.H.; Kirkden, R.D.; Broom, D.M. A Review of the Aetiology and Pathology of Leg Weakness in Broilers in Relation to Welfare. Avian Poult. Biol. Rev. 2002, 13, 45–103. [Google Scholar] [CrossRef]
  25. Kierończyk, B.; Rawski, M.; Józefiak, D.; Świątkiewicz, S. Infectious and Non-Infectious Factors Associated with Leg Disorders in Poultry—A Review. Ann. Anim. Sci. 2017, 17, 645–669. [Google Scholar] [CrossRef]
  26. Choppa, V.S.R.; Kim, W.K. A Review on Pathophysiology, and Molecular Mechanisms of Bacterial Chondronecrosis and Osteomyelitis in Commercial Broilers. Biomolecules 2023, 13, 1032. [Google Scholar] [CrossRef]
  27. Guntur, A.R.; Rosen, C.J. Bone As An Endocrine Organ. Endocr. Pract. 2012, 18, 758–762. [Google Scholar] [CrossRef]
  28. Suchacki, K.J.; Roberts, F.; Lovdel, A.; Farquharson, C.; Morton, N.M.; MacRae, V.E.; Cawthorn, W.P. Skeletal Energy Homeostasis: A Paradigm of Endocrine Discovery. J. Endocrinol. 2017, 234, R67–R79. [Google Scholar] [CrossRef]
  29. Rath, N.C.; Durairaj, V. Avian Bone Physiology and Poultry Bone Disorders. In Sturkie’s Avian Physiology; Elsevier: Amsterdam, The Netherlands, 2022; pp. 549–563. ISBN 978-0-12-819770-7. [Google Scholar]
  30. Knowles, T.G.; Kestin, S.C.; Haslam, S.M.; Brown, S.N.; Green, L.E.; Butterworth, A.; Pope, S.J.; Pfeiffer, D.; Nicol, C.J. Leg Disorders in Broiler Chickens: Prevalence, Risk Factors and Prevention. PLoS ONE 2008, 3, e1545. [Google Scholar] [CrossRef] [PubMed]
  31. Magnoli, A.P.; Monge, M.P.; Miazzo, R.D.; Cavaglieri, L.R.; Magnoli, C.E.; Merkis, C.I.; Cristofolini, A.L.; Dalcero, A.M.; Chiacchiera, S.M. Effect of Low Levels of Aflatoxin B1 on Performance, Biochemical Parameters, and Aflatoxin B1 in Broiler Liver Tissues in the Presence of Monensin and Sodium Bentonite. Poult. Sci. 2011, 90, 48–58. [Google Scholar] [CrossRef] [PubMed]
  32. Moran, C.A.; Apajalahti, J.; Yiannikouris, A.; Ojanperä, S.; Kettunen, H. Effects of Low Dietary Aflatoxin B1 on Broiler Liver Concentration without and with Mycosorb® Toxin Binder. J. Appl. Anim. Nutr. 2013, 2, e4. [Google Scholar] [CrossRef]
  33. Tavangar, P.; Gharahveysi, S.; Rezaeipour, V.; Irani, M. Efficacy of Phytobiotic and Toxin Binder Feed Additives Individually or in Combination on the Growth Performance, Blood Biochemical Parameters, Intestinal Morphology, and Microbial Population in Broiler Chickens Exposed to Aflatoxin B1. Trop. Anim. Health Prod. 2021, 53, 335. [Google Scholar] [CrossRef]
  34. Oguz, H.; Kurtoglu, V.; Coskun, B. Preventive Efficacy of Clinoptilolite in Broilers during Chronic Aflatoxin (50 and 100 ppb) Exposure. Res. Vet. Sci. 2000, 69, 197–201. [Google Scholar] [CrossRef] [PubMed]
  35. Xie, K.; He, X.; Hu, G.; Zhang, H.; Chen, Y.; Hou, D.-X.; Song, Z. The Preventive Effect and Mechanisms of Adsorbent Supplementation in Low Concentration Aflatoxin B1 Contaminated Diet on Subclinical Symptom and Histological Lesions of Broilers. Poult. Sci. 2022, 101, 101634. [Google Scholar] [CrossRef] [PubMed]
  36. Giambrone, J.J.; Diener, U.L.; Davis, N.D.; Panangala, V.S.; Hoerr, F.J. Effects of Purified Aflatoxin on Broiler Chickens. Poult. Sci. 1985, 64, 852–858. [Google Scholar] [CrossRef] [PubMed]
  37. Zabiulla, I.; Malathi, V.; Swamy, H.V.L.N.; Naik, J.; Pineda, L.; Han, Y. The Efficacy of a Smectite-Based Mycotoxin Binder in Reducing Aflatoxin B1 Toxicity on Performance, Health and Histopathology of Broiler Chickens. Toxins 2021, 13, 856. [Google Scholar] [CrossRef] [PubMed]
  38. Liu, N.; Wang, J.Q.; Jia, S.C.; Chen, Y.K.; Wang, J.P. Effect of Yeast Cell Wall on the Growth Performance and Gut Health of Broilers Challenged with Aflatoxin B1 and Necrotic Enteritis. Poult. Sci. 2018, 97, 477–484. [Google Scholar] [CrossRef]
  39. Chen, X.; Zhang, Q.; Applegate, T.J. Impact of Dietary Branched Chain Amino Acids Concentration on Broiler Chicks during Aflatoxicosis. Poult. Sci. 2016, 95, 1281–1289. [Google Scholar] [CrossRef]
  40. Chen, X.; Naehrer, K.; Applegate, T.J. Interactive Effects of Dietary Protein Concentration and Aflatoxin B1 on Performance, Nutrient Digestibility, and Gut Health in Broiler Chicks. Poult. Sci. 2016, 95, 1312–1325. [Google Scholar] [CrossRef] [PubMed]
  41. Grenier, B.; Oswald, I. Mycotoxin Co-Contamination of Food and Feed: Meta-Analysis of Publications Describing Toxicological Interactions. World Mycotoxin J. 2011, 4, 285–313. [Google Scholar] [CrossRef]
  42. Allen, M.R.; Burr, D.B. Bone Modeling and Remodeling. In Basic and Applied Bone Biology; Elsevier: Amsterdam, The Netherlands, 2014; pp. 75–90. ISBN 978-0-12-416015-6. [Google Scholar]
  43. Clarke, B. Normal Bone Anatomy and Physiology. Clin. J. Am. Soc. Nephrol. 2008, 3, S131–S139. [Google Scholar] [CrossRef]
  44. Rath, N.C.; Huff, G.R.; Huff, W.E.; Balog, J.M. Factors Regulating Bone Maturity and Strength in Poultry. Poult. Sci. 2000, 79, 1024–1032. [Google Scholar] [CrossRef] [PubMed]
  45. Carbonare, L.D.; Giannini, S. Bone Microarchitecture as an Important Determinant of Bone Strength. J. Endocrinol. Investig. 2004, 27, 99–105. [Google Scholar] [CrossRef] [PubMed]
  46. Chenu, C.; Delmas, P.D. Physiology of Bone Remodeling. In Advances in Organ Biology; Elsevier: Amsterdam, The Netherlands, 1998; Volume 5, pp. 45–64. ISBN 978-0-7623-0390-8. [Google Scholar]
  47. Tompkins, Y.H.; Choi, J.; Teng, P.-Y.; Yamada, M.; Sugiyama, T.; Kim, W.K. Reduced Bone Formation and Increased Bone Resorption Drive Bone Loss in Eimeria Infected Broilers. Sci. Rep. 2023, 13, 616. [Google Scholar] [CrossRef] [PubMed]
  48. Carmeliet, G.; Dermauw, V.; Bouillon, R. Vitamin D Signaling in Calcium and Bone Homeostasis: A Delicate Balance. Best Pract. Res. Clin. Endocrinol. Metab. 2015, 29, 621–631. [Google Scholar] [CrossRef] [PubMed]
  49. Fleet, J.C.; Schoch, R.D. Molecular Mechanisms for Regulation of Intestinal Calcium Absorption by Vitamin D and Other Factors. Crit. Rev. Clin. Lab. Sci. 2010, 47, 181–195. [Google Scholar] [CrossRef] [PubMed]
  50. Proszkowiec-Weglarz, M.; Angel, R. Calcium and Phosphorus Metabolism in Broilers: Effect of Homeostatic Mechanism on Calcium and Phosphorus Digestibility. J. Appl. Poult. Res. 2013, 22, 609–627. [Google Scholar] [CrossRef]
  51. Sharma, M.K.; Regmi, P.; Applegate, T.; Chai, L.; Kim, W.K. Osteoimmunology: A Link between Gastrointestinal Diseases and Skeletal Health in Chickens. Animals 2023, 13, 1816. [Google Scholar] [CrossRef]
  52. Aslam, S.; Garlich, J.; Qureshi, M. Vitamin D Deficiency Alters the Immune Responses of Broiler Chicks. Poult. Sci. 1998, 77, 842–849. [Google Scholar] [CrossRef]
  53. Galarza-Seeber, R.; Latorre, J.D.; Bielke, L.R.; Kuttappan, V.A.; Wolfenden, A.D.; Hernandez-Velasco, X.; Merino-Guzman, R.; Vicente, J.L.; Donoghue, A.; Cross, D.; et al. Leaky Gut and Mycotoxins: Aflatoxin B1 Does Not Increase Gut Permeability in Broiler Chickens. Front. Vet. Sci. 2016, 3, 10. [Google Scholar] [CrossRef]
  54. Ramos, A.J.; Hernández, E. In Situ Absorption of Aflatoxins in Rat Small Intestine. Mycopathologia 1996, 134, 27–30. [Google Scholar] [CrossRef] [PubMed]
  55. Rawal, S.; Coulombe, R.A. Metabolism of Aflatoxin B1 in Turkey Liver Microsomes: The Relative Roles of Cytochromes P450 1A5 and 3A37. Toxicol. Appl. Pharmacol. 2011, 254, 349–354. [Google Scholar] [CrossRef] [PubMed]
  56. Lin, L.; Fu, P.; Chen, N.; Gao, N.; Cao, Q.; Yue, K.; Xu, T.; Zhang, C.; Zhang, C.; Liu, F.; et al. Total Flavonoids of Rhizoma Drynariae Protect Hepatocytes against Aflatoxin B1-Induced Oxidative Stress and Apoptosis in Broiler Chickens. Ecotoxicol. Environ. Saf. 2022, 230, 113148. [Google Scholar] [CrossRef] [PubMed]
  57. Cao, W.; Yu, P.; Yang, K.; Cao, D. Aflatoxin B1: Metabolism, Toxicology, and Its Involvement in Oxidative Stress and Cancer Development. Toxicol. Mech. Methods 2022, 32, 395–419. [Google Scholar] [CrossRef] [PubMed]
  58. Benkerroum, N. Chronic and Acute Toxicities of Aflatoxins: Mechanisms of Action. Int. J. Environ. Res. Public. Health 2020, 17, 423. [Google Scholar] [CrossRef]
  59. Muhammad, I.; Sun, X.; Wang, H.; Li, W.; Wang, X.; Cheng, P.; Li, S.; Zhang, X.; Hamid, S. Curcumin Successfully Inhibited the Computationally Identified CYP2A6 Enzyme-Mediated Bioactivation of Aflatoxin B1 in Arbor Acres Broiler. Front. Pharmacol. 2017, 8, 143. [Google Scholar] [CrossRef] [PubMed]
  60. Li, S.; Han, M.; Zhang, Y.; Ishfaq, M.; Liu, R.; Wei, G.; Zhang, X.; Zhang, X. Effect of Curcumin as Feed Supplement on Immune Response and Pathological Changes of Broilers Exposed to Aflatoxin B1. Biomolecules 2022, 12, 1188. [Google Scholar] [CrossRef]
  61. Baxter, M.F.A.; Merino-Guzman, R.; Latorre, J.D.; Mahaffey, B.D.; Yang, Y.; Teague, K.D.; Graham, L.E.; Wolfenden, A.D.; Hernandez-Velasco, X.; Bielke, L.R.; et al. Optimizing Fluorescein Isothiocyanate Dextran Measurement As a Biomarker in a 24-h Feed Restriction Model to Induce Gut Permeability in Broiler Chickens. Front. Vet. Sci. 2017, 4, 56. [Google Scholar] [CrossRef]
  62. Kim, W.K.; Donalson, L.M.; Herrera, P.; Woodward, C.L.; Kubena, L.F.; Nisbet, D.J.; Ricke, S.C. Research Note: Effects of Different Bone Preparation Methods (Fresh, Dry, and Fat-Free Dry) on Bone Parameters and the Correlations Between Bone Breaking Strength and the Other Bone Parameters. Poult. Sci. 2004, 83, 1663–1666. [Google Scholar] [CrossRef]
  63. Shi, H.; Wang, J.; Teng, P.-Y.; Tompkins, Y.H.; Jordan, B.; Kim, W.K. Effects of Phytase and Coccidial Vaccine on Growth Performance, Nutrient Digestibility, Bone Mineralization, and Intestinal Gene Expression of Broilers. Poult. Sci. 2022, 101, 102124. [Google Scholar] [CrossRef]
  64. Sharma, M.K.; Liu, G.; White, D.L.; Tompkins, Y.H.; Kim, W.K. Graded Levels of Eimeria Challenge Altered the Microstructural Architecture and Reduced the Cortical Bone Growth of Femur of Hy-Line W-36 Pullets at Early Stage of Growth (0–6 Wk of Age). Poult. Sci. 2023, 102, 102888. [Google Scholar] [CrossRef] [PubMed]
  65. Chen, C.; Kim, W.K. The Application of Micro-CT in Egg-Laying Hen Bone Analysis: Introducing an Automated Bone Separation Algorithm. Poult. Sci. 2020, 99, 5175–5183. [Google Scholar] [CrossRef] [PubMed]
  66. Choi, J.; Goo, D.; Sharma, M.K.; Ko, H.; Liu, G.; Paneru, D.; Choppa, V.S.R.; Lee, J.; Kim, W.K. Effects of Different Eimeria Inoculation Doses on Growth Performance, Daily Feed Intake, Gut Health, Gut Microbiota, Foot Pad Dermatitis, and Eimeria Gene Expression in Broilers Raised in Floor Pens for 35 Days. Animals 2023, 13, 2237. [Google Scholar] [CrossRef] [PubMed]
Figure 1. Representative metaphyseal bone structure of femurs on Day 19 after exposure to increasing doses of aflatoxin B1 contaminated diets. The figure depicts cross-sectional images of femoral metaphysis with increasing AFB1 levels from left to right. Each image shows the metaphysis with two distinct regions: outer cortical bone (light grey) and inner trabecular bone (blue). In the femurs from broilers fed diets with higher levels of AFB1 (T4 and T5), there is a clear disruption of the trabecular bone pattern. The blue color network of the trabecular bone appears less dense, with thinner and more fragmented bone strands and spaces between the trabecular bone appear larger. Treatment groups: T1 (<2 ppb AFB1), T2 (75–79 ppb AFB1), T3 (150 ppb AFB1), T4 (230–260 ppb AFB1) and T5 (520–560 ppb AFB1).
Toxins 16 00078 g001
Figure 2. Effect of increasing the dosage of an aflatoxin B1 contaminated diet on tibial bone parameters on Day 19: (a) fresh bone weight; (b) dry bone weight; (c) fat-free dry bone weight; (d) ash weight; (e) ash percentage. The data relate to the mean values of six tibia bone samples per treatment. The x-axis represents the treatment groups: T1 (<2 ppb AFB1), T2 (75–79 ppb AFB1), T3 (150 ppb AFB1), T4 (230–260 ppb AFB1) and T5 (520–560 ppb AFB1). Statistically significant differences between means are indicated by superscript letters (a, b) above the error bars in each panel.
Toxins 16 00078 g002
Figure 3. Effect of increasing the dosage of an aflatoxin B1 contaminated diet on mRNA levels of calcium and phosphorus transporter genes on Day 19. The data are presented as the mean values of fold change in mRNA expression of calcium and phosphorus transporter genes using the 2−ΔΔCt method. The data relate to 6 jejunum samples per treatment. The genes are abbreviated as CALB1 for calbindin 1, CaSR for calcium-sensing receptor, NCX1 for sodium-calcium exchanger 1, NaPi-IIb for sodium-phosphate cotransporter IIb, PMCA1b for plasma membrane calcium ATPase 1b and VDR for the vitamin D receptor. Treatment groups: T1 (<2 ppb AFB1), T2 (75–79 ppb AFB1), T3 (150 ppb AFB1), T4 (230–260 ppb AFB1) and T5 (520–560 ppb AFB1). The p-values provided for the whole model (PMod), linear regression (PLin) and quadratic regression (PQuad). Statistically significant differences between means are indicated by superscript letters (a, b) above the error bars in each panel.
Toxins 16 00078 g003
Figure 4. Effect of increasing the dosage of an aflatoxin B1 contaminated diet on the intestinal permeability on Day 19. The data are presented as the mean blood serum concentrations of fluorescein isothiocyanate dextran (FITC-d) in µg/mL for five treatment groups (n = 6/treatment). Treatment groups: T1 (<2 ppb AFB1), T2 (75–79 ppb AFB1), T3 (150 ppb AFB1), T4 (230–260 ppb AFB1) and T5 (520–560 ppb AFB1). The p-values provided are: PModel for the whole model, PLinear for linear regression and PQuadratic for quadratic regression.
Toxins 16 00078 g004
Figure 5. Effect of increasing the dosage of an aflatoxin B1 contaminated diet on mRNA levels of tight junction proteins on Day 19. The data are presented as the mean values of fold change in mRNA expression of tight-junction-related genes using the 2-ΔΔCt method. The data relate to 6 jejunum samples per treatment. The genes are abbreviated as MUC2 for mucin 2, CLDN1 for claudin 1, ZO1 for zonula occludens and OCLN for occludin. Treatment groups: T1 (<2 ppb AFB1), T2 (75–79 ppb AFB1), T3 (150 ppb AFB1), T4 (230–260 ppb AFB1) and T5 (520–560 ppb AFB1). The p-values are provided for the whole model (PMod), linear regression (PLin) and quadratic regression (PQuad).
Toxins 16 00078 g005
Figure 6. Selection of bone region for micro-computed tomography: (a) Selection of volume-of-interests (VOI), the VOI was chosen to begin from 50 slides (1.25 mm) below the nutrient foramen in the distal femur and to extend 200 slides (5 mm) for analysis. This specific region encompasses cortical bone and trabecular bone, making it an ideal area to represent bone quality; (b) Metaphyseal segment of bone chosen for separation and analysis; (c) Cortical (upper) and trabecular (lower) regions of bone segments separated from metaphyseal bone segment for further analysis.
Toxins 16 00078 g006
Table 1. Effect of increasing dosage of Aflatoxin B1 on growth performance of broilers during 0 to 8, 8 to 19 and 0 to 19 days of the experiment 1.
Items 2Treatment Groups 3SEMp-Values 4
T1T2T3T4T5 PModelPLinearPQuadratic
0–8 days
BW (g)21220820719820060.46750.08670.8741
BWG (g)16616216115215460.46400.08560.8772
FI (g)19719819519519050.88320.36440.6818
FCR (g/g)1.191.221.211.321.240.060.53310.24900.5993
9–19 days
BW (g)705707699693688160.90830.34730.8347
BWG (g)493499492495488150.98980.76180.7738
FI (g)857860859852853230.99900.84310.9025
FCR (g/g)1.741.721.751.721.760.060.98460.82040.8157
0–19 days
BWG (g)659661653647641160.90760.34620.8335
FI (g)10531058105310481044240.99460.70070.8378
FCR (g/g)1.601.601.621.621.630.050.98310.55140.9858
1 The data represent individual bird growth parameters obtained by averaging data from six replicate pens per treatment, with 12 birds per pen for 0–8 days and 9 birds per pen for 9–19 days adjusted with mortality. Values for 0–19 days were calculated by averaging across pens and treatments after individual bird parameters were derived. SEM represents the pooled standard error of the mean for each parameter across all treatments and time points. 2 Items: BW, body weight; BWG, body weight gain; FI, feed intake; FCR, feed conversion ratio. 3 Treatment groups: T1 (<2 ppb AFB1), T2 (75–79 ppb AFB1), T3 (150 ppb AFB1), T4 (230–260 ppb AFB1), T5 (520–560 ppb AFB1). 4 p-values: PModel, p-value for the whole model; PLinear, p-value for the linear regression; PQuadratic, p-value for the quadratic regression.
Table 2. Effect of increasing the dosage of an aflatoxin B1 contaminated diet on the microstructure of femoral metaphysis on Day 19 1.
Bone RegionParameters 2UnitTreatment Groups 3 p-Values 4
T1T2T3T4T5SEMPModelPLinear PQuadratic
TotalBMCg0.077 a0.071 ab0.069 ab0.062 b0.063 b0.0030.02120.00150.523
BMDg/cm30.2800.2720.2730.2770.2620.0100.80260.37260.7833
TVmm3275 a260 ab254 ab226 b240 ab100.04120.00630.3953
BVmm3109 a99 ab96 ab85 b90 ab50.04060.00450.2972
BV/TV%39.6238.3437.7137.8937.471.620.90110.37820.6894
Po.V(cl)mm30.2450.2170.2040.1290.1460.0300.06420.00690.8076
Po.V(op)mm3165.7160.0158.4140.5150.18.50.30870.07810.665
PP%60.3861.6662.2962.1162.531.620.90110.37820.6894
CorticalBMCg0.0570.0510.0510.0450.0480.0030.09070.01750.2361
BMDg/cm30.4750.4910.4950.5150.5170.0100.09220.00750.7665
TVmm3120 a105 ab102 ab89 b94 b60.01890.00200.2178
BVmm399 a89 ab87 ab76 b83 ab50.04290.00750.1968
BV/TV%82.4 b85.0 ab85.0 ab86.3 ab88.1 a1.00.03370.00230.9663
Po.V(cl)mm30.237 a0.197 ab0.191 ab0.115 b0.139 ab0.0290.05000.00600.5907
Po.V(op)mm321.06 a15.58 ab15.06 ab12.80 b10.93 b1.570.00670.00040.4195
PP%17.58 a15.00 ab15.04 ab13.66 ab11.88 b1.040.03370.00230.9663
TrabecularBMCg0.018 a0.017 ab0.016 ab0.015 ab0.012 b0.0010.03310.00260.2792
BMDg/cm30.120 a0.116 ab0.114 ab0.113 ab0.090 b0.0060.02140.00430.1336
TVmm314614614412913880.54770.22190.8596
BVmm37.388.066.446.805.040.860.23280.05310.4096
BV/TV%5.085.44.565.093.710.540.26070.09760.3414
Tb.Thmm0.1220.1510.1340.1480.1250.0170.67060.9540.2572
Conn.Dnmm−39.427.716.018.067.980.790.08090.32240.0259
Tb.Nmm−10.4380.3480.2890.3700.3710.0410.18210.39460.0463
a,b Means within a column not sharing a common letter differ significantly (p < 0.05). 1 The data represent the mean values of six femur bone samples per treatment. SEM represents the pooled standard error of the mean for each parameter across all treatment groups. 2 Parameters: BMC, bone mineral content; BMD, bone mineral density; TV, tissue volume; BV, bone volume; BV/TV, bone volume/tissue volume; Po.V(cl), volume of closed pores; Po.V(op), volume of open pores; Po(tot), total porosity percentage; Tb.Th, trabecular thickness; Conn.Dn, connectivity density; Tb.N, trabecular number. 3 Treatment groups: T1 (<2 ppb AFB1), T2 (75–79 ppb AFB1), T3 (150 ppb AFB1), T4 (230–260 ppb AFB1), T5 (520–560 ppb AFB1). 4 p-values: PModel, p-value for the whole model; PLinear, p-value for the linear regression; PQuadratic, p-value for the quadratic regression.
Table 3. Ingredient composition and calculated nutrient composition of the basal diet for starter and grower phases.
Ingredients, %StarterGrower
Corn58.5063.72
Soybean Meal (48% CP)34.7529.70
Soybean Oil0.500.50
Dicalcium Phosphate2.081.35
Limestone1.021.06
DL-Methionine0.330.32
L-Lysine HCl0.240.27
L-Threonine0.120.12
Common Salt0.400.35
Vitamin Premix 10.100.10
Mineral Premix 20.080.08
Sand1.882.13
Chromic Oxide0.000.30
Total100.00100.00
Calculated Values, %
D.M. 387.6387.20
M.E., Kcal/g 42.902.95
Crude Protein21.5019.50
Calcium0.960.80
Available Phosphorus0.540.40
dLYS1.261.16
dMET0.650.61
1 Supplied per kilogram of diet: vitamin A, 3527 IU; vitamin D3, 1400 ICU; vitamin E, 19.4 IU; vitamin B12, 0.008 mg; Menadione, 1.1 mg; Riboflavin, 3.53 mg; d-Pantothenic Acid, 5.47 mg; Thiamine, 0.97 mg; Niacin, 20.28 mg; vitamin B6, 1.45 mg; Folic Acid, 0.57 mg; Biotin, 0.08 mg. 2 Supplied per kg of diet: Ca, 25.6 mg; Mn, 107.2 mg; Zn, 85.6 mg; Mg, 21.44 mg; Fe, 21.04 mg; Cu, 3.2 mg; I, 0.8 mg; Se, 0.32 mg. 3 D.M., dry matter of feed in percentage. 4 M.E., Kcal/g, metabolizable energy of feed in Kcal/g.
Table 4. Nucleotide sequences of the primers used for real-time RT-PCR.
Gene 1Accession NumberForward PrimerReverse Primer
Housekeeping Genes
GAPDHNM_204305.2 GCTAAGGCTGTGGGGAAAGTTCAGCAGCAGCCTTCACTAC
ACTBNM_205518.2CAACACAGTGCTGTCTGGTGGTAATCGTACTCCTGCTTGCTGATCC
Vitamin D Receptor
VDRNM_205098.2 GCAGCAGAAAGTCATCGACA TGCTGAATTTGCTTCTCACG
Ca and P Transporters
CALB1 NM_205513.2 AAGCAGATTGAAGACTCAAAGC CTGGCCAGTTCAGTAAGCTC
CaSR XM_416491.8 CTGCTTCGAGTGTGTGGACT GATGCAGGATGTGTGGTTCT
NCX1 NM_001398209.1 TCACTGCAGTCGTGTTTGTG AAGAAAACGTTCACGGCATT
NaPi-Ⅱb NM_204474.3 AAAGTGACGTGGACCATG GAGACCGATGGCAAGATCAG
PMCA1b NM_001168002.4 TTAATGCCCGGAAAATTCAC TCCACCAAACTGCACGATAA
Tight Junction Proteins
MUC2NM_001318434.1 ATGCGATGTTAACACAGGACTC GTGGAGCACAGCAGACTTTG
CLDN1NM_001013611.2 TGGAGGATGACCAGGTGAAGA CGAGCCACTCTGTTGCCATA
ZO1XM_015278981.2 CAACTGGTGTGGGTTTCTGAA TCACTACCAGGAGCTGAGAGGTAA
OCLNXM_025144248.1 GTCTGTGGGTTCCTCATCGT GTTCTTCACCCACTCCTCCA
1 GAPDH, glyceraldehyde 3-phosphate dehydrogenase; ACTB, beta actin; CALB1, calbindin 1; CaSR, calcium-sensing receptor; NCX1, sodium-calcium exchanger 1; NaPi-IIb, sodium-phosphate cotransporter; PMCA1b, plasma membrane calcium ATPase 1b; VDR, vitamin D receptor, MUC2, mucin 2; CLDN1, claudin 1; ZO1, zonula occludens 1; OCLN, occludin.
Table 5. Definition of variables used for micro-CT.
AbbreviationVariableDescription of VariablesUnit
BMCBone mineral contentMeasure the bone mineral content of the tissueg
BMDBone mineral densityMeasure the bone mineral content per unit of volumeg/cm3
TVTissue volumeVolume of the entire region of interestmm3
BVBone volumeVolume of the bone segmentmm3
BV/TVBone volume fractionBone volume segment volume as a fraction of tissue volume from the region of interest%
Po.V(cl)Volume of closed poresVolume of closed pore spacemm3
Po.V(op)Volume of open poresVolume of open pore spacemm3
PPPorosity percentageThe volume of pores by total volume of bone%
Tb.ThTrabecular thicknessMean thickness of trabeculae measured using 3-D methodsmm
Conn.DnConnectivity densityA measure of the degree of connectivity of trabeculae normalized by TVmm−3
Tb.NTrabecular numberAverage number of trabeculae per unit of lengthmm−1
Disclaimer/Publisher’s Note: The statements, opinions and data contained in all publications are solely those of the individual author(s) and contributor(s) and not of MDPI and/or the editor(s). MDPI and/or the editor(s) disclaim responsibility for any injury to people or property resulting from any ideas, methods, instructions or products referred to in the content.

