Occurrence of Types A and B Trichothecenes in Cereal Products Sold in Romanian Markets


 , ,
, ,  ,
,  and
and
Abstract
1. Introduction
2. Results
2.1. Detection Limits, Recoveries
2.2. Occurrence of Trichothecenes in Analyzed Samples
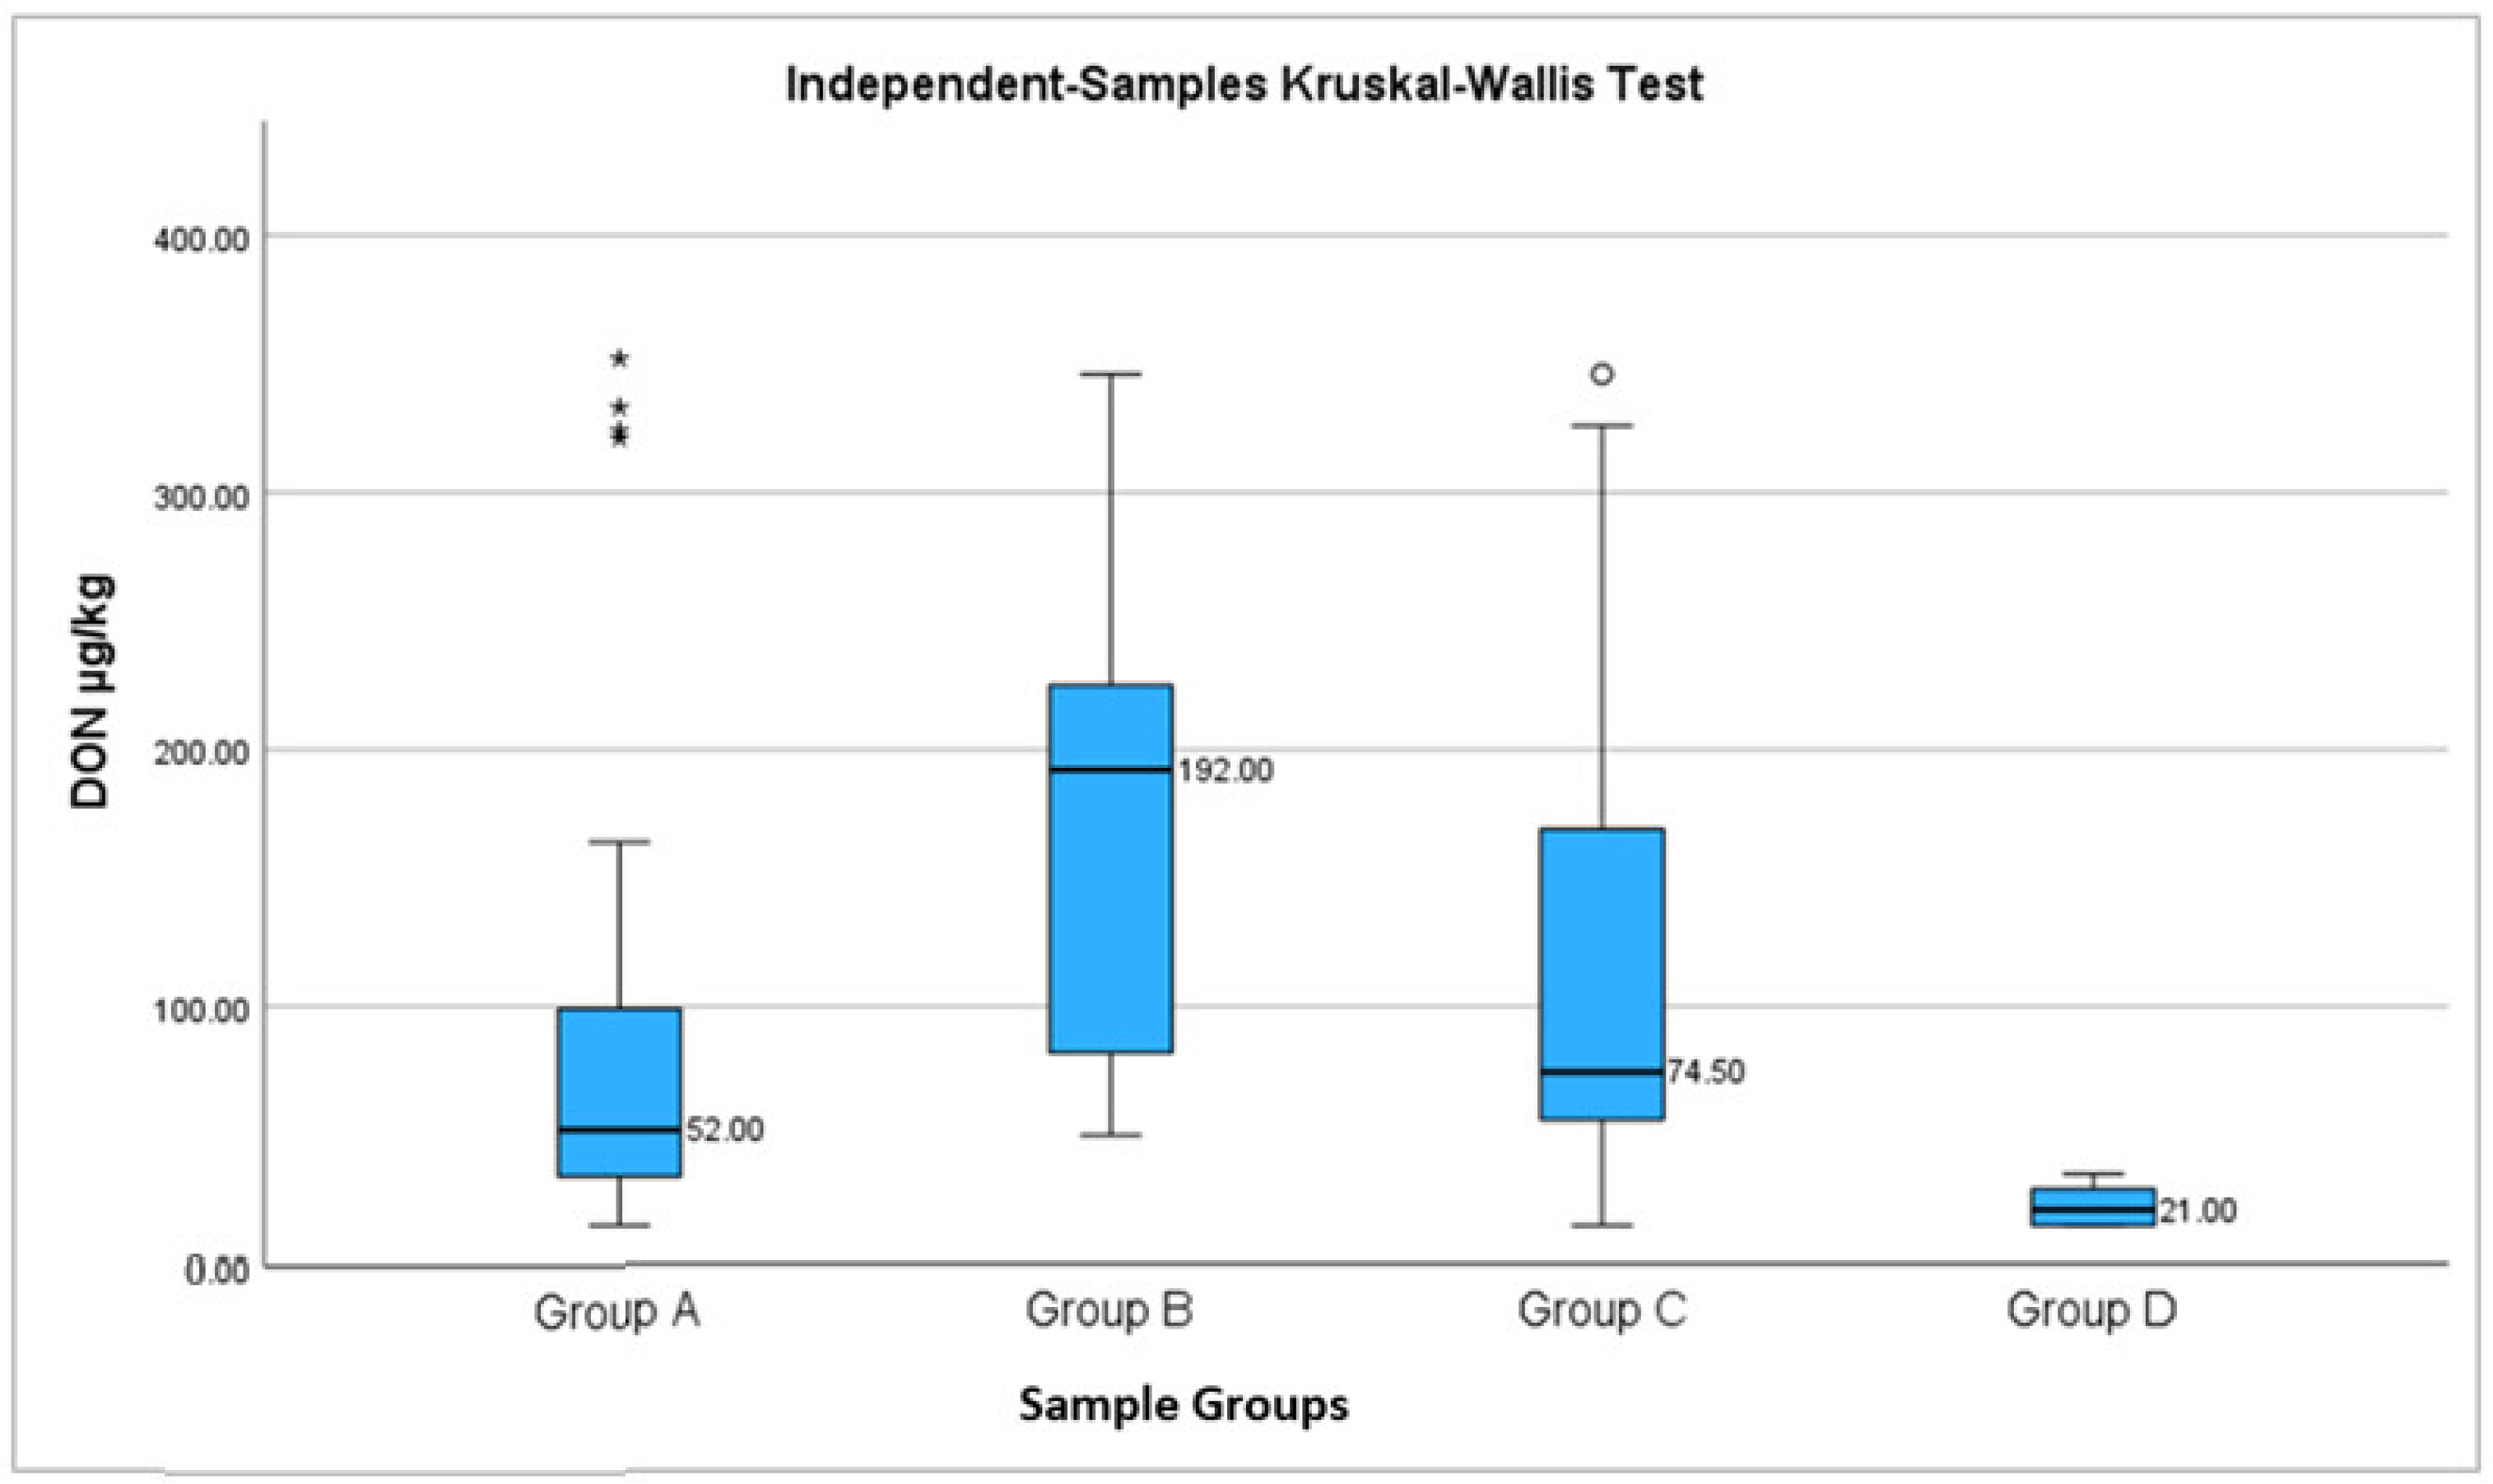
2.2.1. DON Occurrence
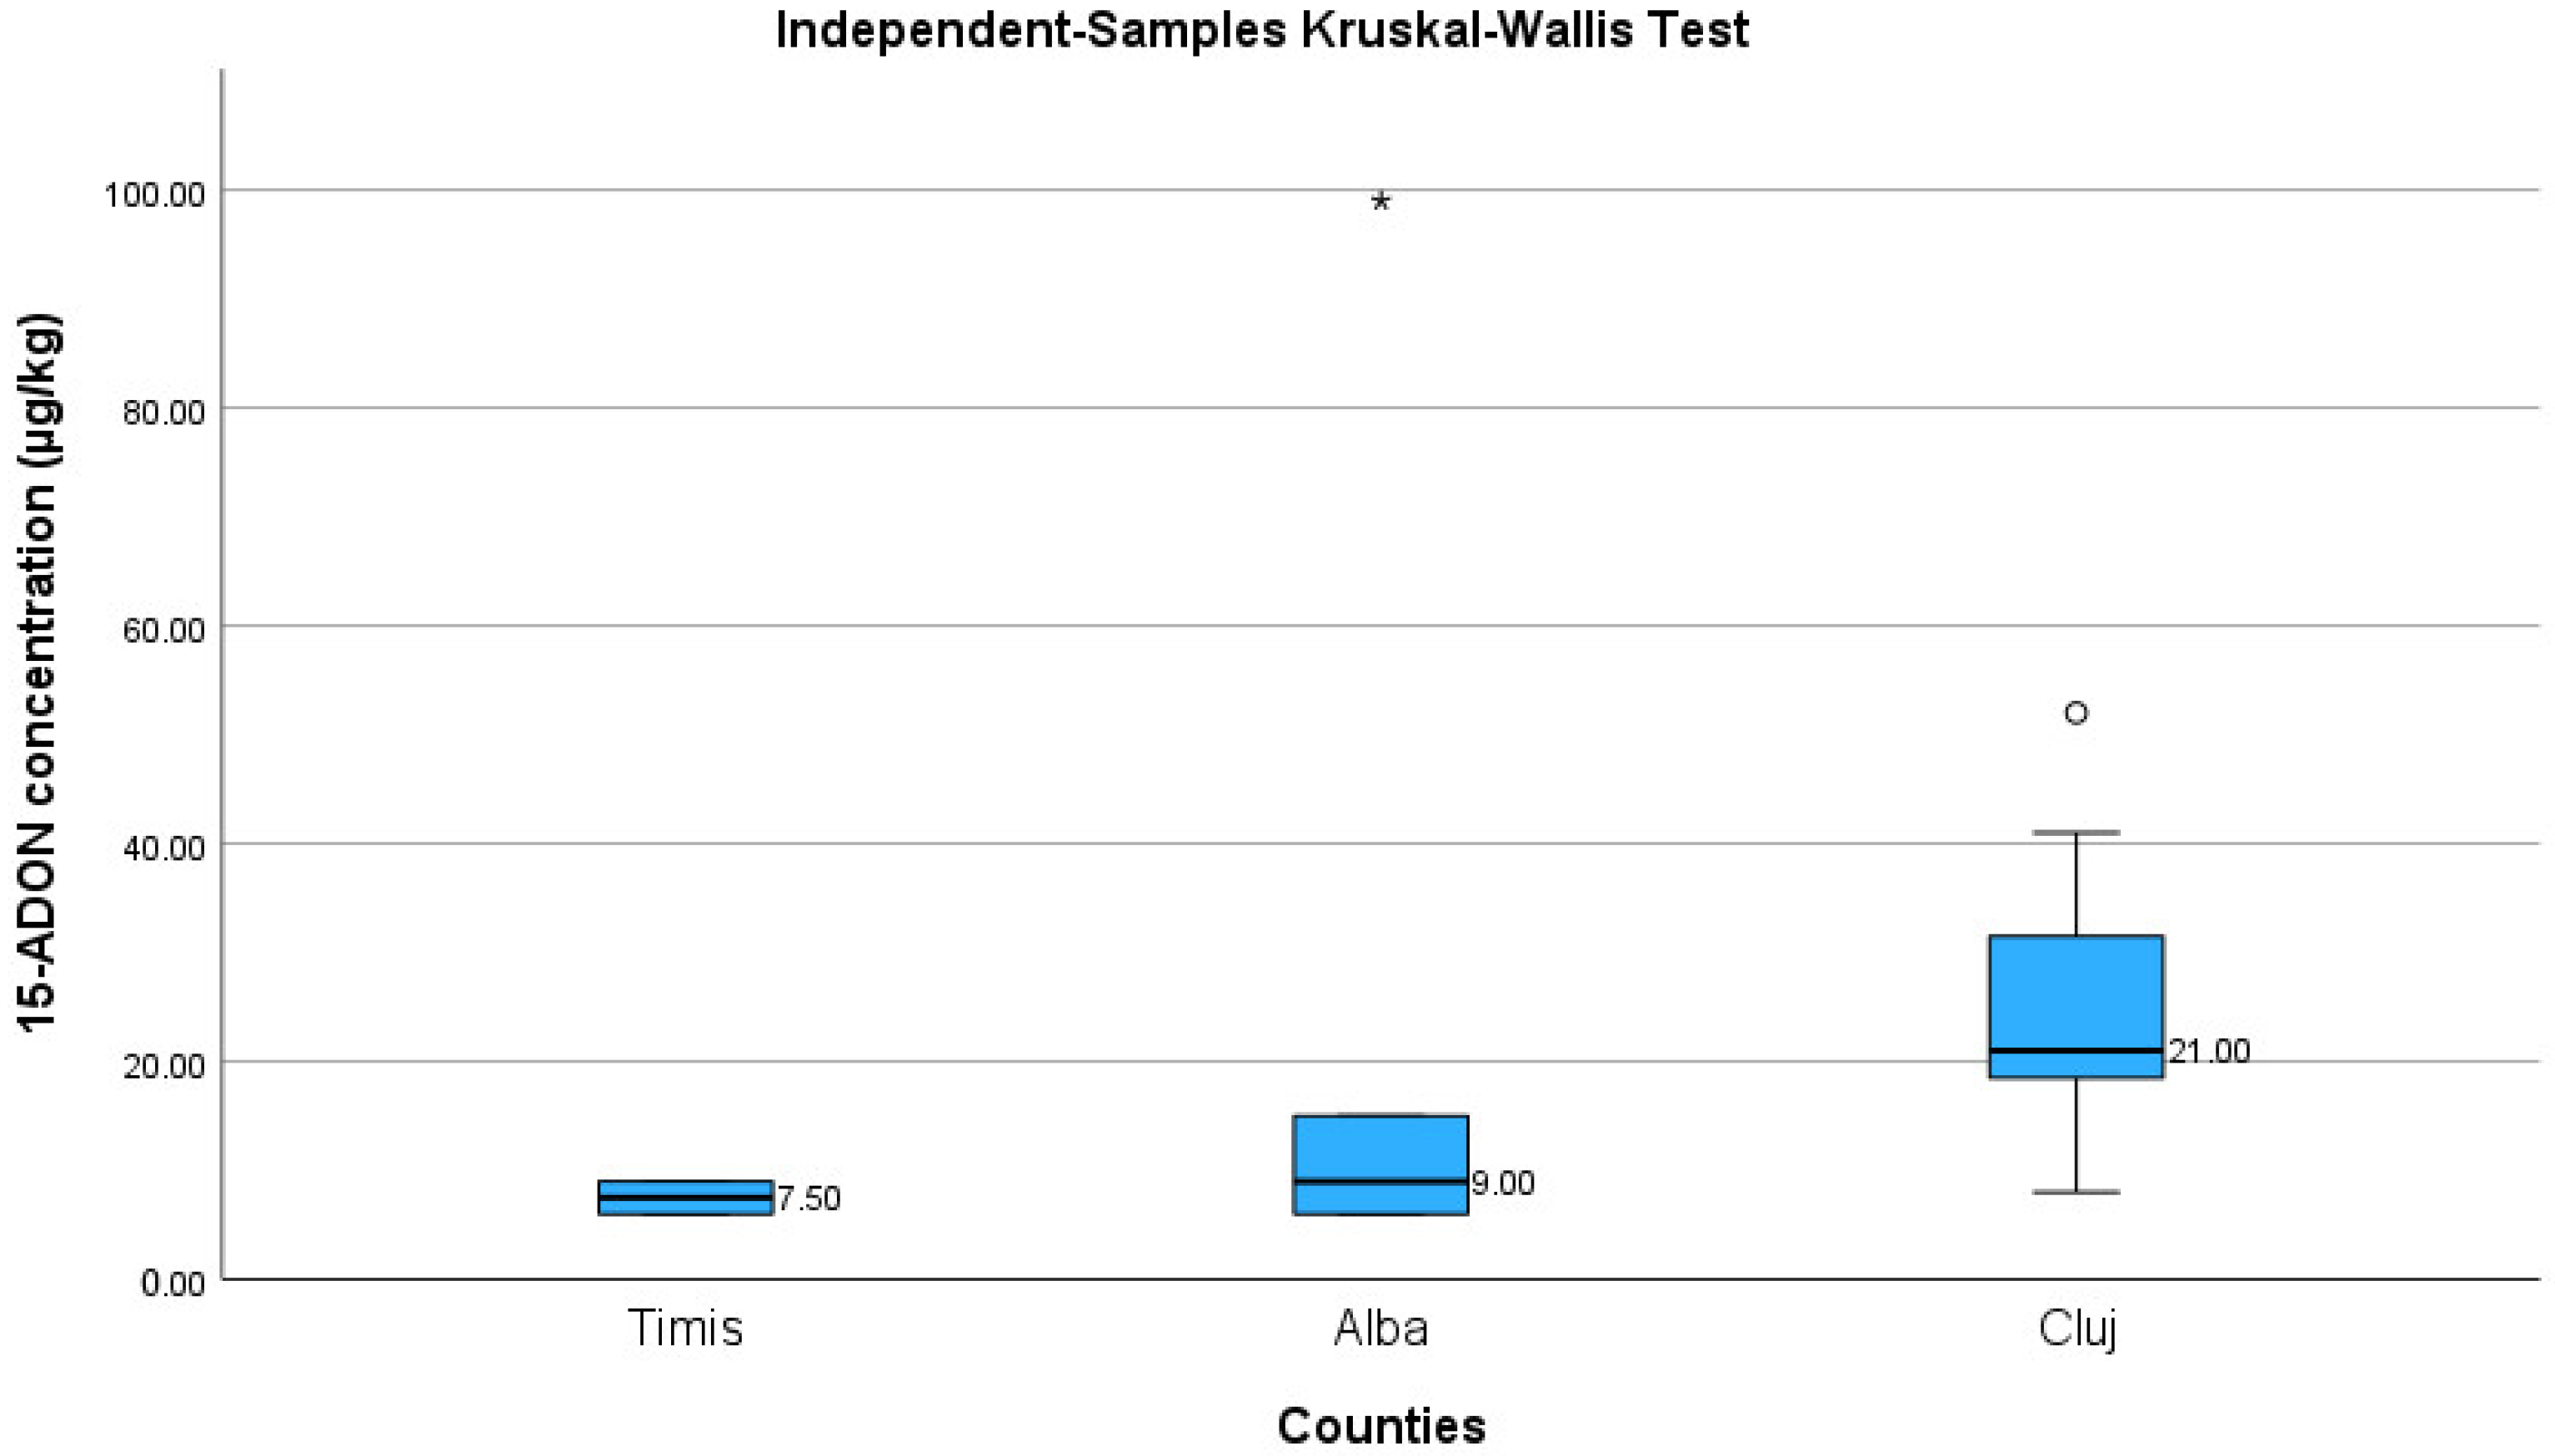
2.2.2. 15-ADON
2.2.3. HT-2 Occurrence
2.2.4. Contamination with Other Trichothecenes
3. Discussion
4. Conclusions
5. Materials and Methods
5.1. Samples
5.2. Chemicals and Reagents
5.3. Extraction, Clean-up and Analysis
5.4. Statistics
Author Contributions
Funding
Institutional Review Board Statement
Informed Consent Statement
Data Availability Statement
Conflicts of Interest
References
- Stanciu, O.; Juan, C.; Berrada, H.; Miere, D.; Loghin, F.; Manes, J. Study on Trichothecene and Zearalenone Presence in Romanian Wheat Relative to Weather Conditions. Toxins 2019, 11, 163. [Google Scholar] [CrossRef] [PubMed]
- González-Osnaya, L.; Cortés, C.; Soriano, J.M.; Moltó, J.C.; Mañes, J. Occurrence of deoxynivalenol and T-2 toxin in bread and pasta commercialized in Spain. Food Chem. 2011, 124, 156–161. [Google Scholar] [CrossRef]
- Khaneghah, A.M.; Fakhri, Y.; Raeisi, S.; Armoon, B.; Sant’Ana, A.S. Prevalence and concentration of ochratoxin A, zearalenone, deoxynivalenol and total aflatoxin in cereal-based products: A systematic review and meta-analysis. Food Chem. Toxicol. 2018, 118, 830–848. [Google Scholar] [CrossRef] [PubMed]
- Belluco, B.; de Camargo, A.C.; da Gloria, E.M.; Dias, C.T.d.S.; Button, D.C.; Calori-Domingues, M.A. Deoxynivalenol in wheat milling fractions: A critical evaluation regarding ongoing and new legislation limits. J. Cereal Sci. 2017, 77, 284–290. [Google Scholar] [CrossRef]
- Institutul National de Statistica Romania. Producția Vegetală la Principalele Culturi în Anul 2022 (Date Provizorii). Available online: https://insse.ro/cms/sites/default/files/com_presa/com_pdf/prod_veg_r22.pdf (accessed on 16 June 2023).
- Busko, M.; Stuper, K.; Jelen, H.; Góral, T.; Chmielewski, J.; Tyrakowska, B.; Perkowski, J. Comparison of Volatiles Profile and Contents of Trichothecenes Group B, Ergosterol, and ATP of Bread Wheat, Durum Wheat, and Triticale Grain Naturally Contaminated by Mycobiota. Front. Plant Sci. 2016, 7, 1243. [Google Scholar] [CrossRef]
- Foroud, N.A.; Baines, D.; Gagkaeva, T.Y.; Thakor, N.; Badea, A.; Steiner, B.; Bürstmayr, M.; Bürstmayr, H. Trichothecenes in Cereal Grains—An Update. Toxins 2019, 11, 634. [Google Scholar] [CrossRef]
- Jedidi, I.; Mateo, E.M.; Marın, P.; Jimenez, M.; Said, S.; Gonzalez-Jaen, M.T. Contamination of Wheat, Barley, and Maize Seeds with Toxigenic Fusarium Species and Their Mycotoxins in Tunisia. J. AOAC Int. 2021, 104, 959–967. [Google Scholar] [CrossRef]
- Cerqueira, M.B.R.; de Borba, V.S.; Rodrigues, M.H.P.; Silveira, S.O.; Badiale-Furlong, E.; Kupski, L. Reliable and Accessible Method for Trichothecenes Type B Determination in Oat Products. Food Anal. Methods 2023, 16, 83–95. [Google Scholar] [CrossRef]
- Lenc, L. Fusarium head blight (FHB) and Fusarium populations in grain of winter wheat grown in different cultivation systems. J. Plant Prot. Res. 2015, 55, 94–109. [Google Scholar] [CrossRef]
- McCormick, S.P.; Stanley, A.M.; Stover, N.A.; Alexander, N.J. Trichothecenes: From simple to complex mycotoxins. Toxins 2011, 3, 802–814. [Google Scholar] [CrossRef]
- Lemos, A.C.; De Borba, V.S.; Badiale-Furlong, E. The impact of wheat-based food processing on the level of trichothecenes and their modified forms. Trends Food Sci. Technol. 2021, 111, 89–99. [Google Scholar] [CrossRef]
- Rychlik, M.; Humpf, H.U.; Marko, D.; Danicke, S.; Mally, A.; Berthiller, F.; Klaffke, H.; Lorenz, N. Proposal of a comprehensive definition of modified and other forms of mycotoxins including “masked” mycotoxins. Mycotoxin Res. 2014, 30, 197–205. [Google Scholar] [CrossRef]
- Vendl, O.; Berthiller, F.; Crews, C.; Krska, R. Simultaneous determination of deoxynivalenol, zearalenone, and their major masked metabolites in cereal-based food by LC-MS-MS. Anal. Bioanal. Chem. 2009, 395, 1347–1354. [Google Scholar] [CrossRef]
- Berthiller, F.; Krska, R.; Domig, K.J.; Kneifel, W.; Juge, N.; Schuhmacher, R.; Adam, G. Hydrolytic fate of deoxynivalenol-3-glucoside during digestion. Toxicol. Lett. 2011, 206, 264–267. [Google Scholar] [CrossRef]
- Berthiller, F.; Dall’Asta, C.; Schuhmacher, R.; Lemmens, M.; Adam, G.; Krska, R. Masked mycotoxins: Determination of a deoxynivalenol glucoside in artificially and naturally contaminated wheat by liquid chromatography-Tandem mass spectrometry. J. Agric. Food Chem. 2005, 53, 3421–3425. [Google Scholar] [CrossRef]
- Berthiller, F.; Dall’Asta, C.; Corradini, R.; Marchelli, R.; Sulyok, M.; Krska, R.; Adam, G.; Schuhmacher, R. Occurrence of deoxynivalenol and its 3-D-glucoside in wheat and maize. Food Addit. Contam. A 2009, 26, 507–511. [Google Scholar] [CrossRef]
- Desmarchelier, A.; Seefelder, W. Survey of deoxynivalenol and deoxynivalenol-3- glucoside in cereal-based products by liquid chromatography electrospray ionization tandem mass spectrometry. World Mycotoxin J. 2011, 4, 29–35. [Google Scholar] [CrossRef]
- Lancova, K.; Hajslova, J.; Poustka, J.; Krplova, A.; Zachariasova, M.; Dostalek, P.; Sachambula, L. Transfer of Fusarium mycotoxins and ‘masked’ deoxynivalenol (deoxynivalenol-3- glucoside) from field barley through malt to beer. Food Addit. Contam. A 2008, 25, 732–744. [Google Scholar] [CrossRef]
- Kostelanska, M.; Hajslova, J.; Zachariasova, M.; Malachova, A.; Kalachova, K.; Poustka, J.; Fiala, J.; Scott, P.M.; Berthiller, F.; Krska, R. Occurrence of deoxynivalenol and its major conjugate, deoxynivalenol-3-glucoside, in beer and some brewing intermediates. J. Agric. Food Chem. 2009, 57, 3187–3194. [Google Scholar] [CrossRef]
- Nazari, L.; Pattori, E.; Terzi, V.; Morcia, C.; Rossi, V. Influence of temperature on infection, growth, and mycotoxin production by Fusarium langsethiae and F. sporotrichioides in durum wheat. Food Microbiol. 2014, 39, 19–26. [Google Scholar] [CrossRef]
- Gab-Allah, M.A.; Choi, K.; Kim, B. Type B Trichothecenes in Cereal Grains and Their Products: Recent Advances on Occurrence, Toxicology, Analysis and Post-Harvest Decontamination Strategies. Toxins 2023, 15, 85. [Google Scholar] [CrossRef] [PubMed]
- De Angelis, E.; Monaci, L.; Pascale, M.; Visconti, A. Fate of deoxynivalenol, T-2 and HT-2 toxins and their glucoside conjugates from flour to bread: An investigation by high-performance liquid chromatography high-resolution mass spectrometry. Food Addit. Contam. Part A. 2013, 30, 345–355. [Google Scholar] [CrossRef] [PubMed]
- Commission Regulation (EU). 2023/915 of 25 April 2023 on Maximum Levels for Certain Contaminants in Food and Repealing Regulation (EC) No 1881/2006. OJEU 2023, 119, 103–157. Available online: https://eur-lex.europa.eu/legal-content/EN/TXT/PDF/?uri=CELEX:32023R0915 (accessed on 12 May 2023).
- Joint FAO/WHO Expert Committee on Foods Additives. Safety Evaluation of Certain Mycotoxins in Food/Prepared by the Fifty-Sixth Meeting of the Joint FAO/WHO Expert Committee on Food Additives (JECFA); FAO: Rome, Italy, 2001; Volume 74, p. 700. [Google Scholar]
- European Food Safety Authority Panel on Contaminants in the Food Chain. Scientific opinion on the risks for animal and public health related to the presence of T-2 andHT-2 toxin in food and feed. EFSA J. 2011, 9, 2481. [Google Scholar] [CrossRef]
- Valenzano, S.; Lippolis, V.; Pascale, M.; De Marco, V.; Maragos, C.M.; Suman, M.; Visconti, A. Determination of Deoxynivalenol in Wheat Bran and Whole-Wheat Flour by Fluorescence Polarization Immunoassay. Food Anal. Methods 2014, 7, 806–813. [Google Scholar] [CrossRef]
- Ibanez-Vea, M.; Lizarraga, E.; Gonzalez-Penas, E. Simultaneous determination of type-A and type-B trichothecenes in barley samples by GC-MS. Food Control 2011, 22, 1428–1434. [Google Scholar] [CrossRef]
- Carballo, D.; Font, G.; Ferrer, E.; Berrada, H. Evaluation of Mycotoxin Residues on Ready-to-Eat Food by Chromatographic Methods Coupled to Mass Spectrometry in Tandem. Toxins 2018, 10, 243. [Google Scholar] [CrossRef]
- Oueslati, S.; Berrada, H.; Juan-Garcia, A.; Manes, J.; Juan, C. Mycotoxin determination on Tunisian Cereals-Based Food and Evaluation of the Population Exposure. Food Anal. Methods 2020, 13, 1271–1281. [Google Scholar] [CrossRef]
- Vidal, A.; Bendicho, J.; Sanchis, V.; Ramos, A.J.; Marin, S. Stability and kinetics of leaching of deoxynivalenol, deoxynivalenol-3-glucoside and ochratoxin A during boiling of wheat spaghettis. Food Res. Int. 2016, 85, 182–190. [Google Scholar] [CrossRef]
- Pereira, V.L.; Fernandes, J.O.; Cunha, S.C. Comparative assessment of three cleanup procedures after QuEChERS extraction for determination of trichothecenes (type A and type B) in processed cereal-based baby foods by GC–MS. Food Chem. 2015, 182, 143–149. [Google Scholar] [CrossRef]
- Polak-Sliwinska, M.; Paszczyk, B. Trichothecenes in Food and Feed, Relevance to Human and Animal Health and Methods of Detection: A Systematic Review. Molecules 2021, 26, 454. [Google Scholar] [CrossRef]
- Gagiu, V.; Mateescu, E.; Armeanu, I.; Dobre, A.A.; Smeu, I.; Cucu, M.E.; Oprea, O.A.; Iorga, E.; Belc, N. Post-Harvest Contamination with Mycotoxins in the Context of the Geographic and Agroclimatic Conditions in Romania. Toxins 2018, 10, 533. [Google Scholar] [CrossRef]
- Tabuc, C.; Marin, D.; Guerre, P.; Sesan, T.; Bailly, J.D. Molds and Mycotoxin Content of Cereals in Southeastern Romania. J. Food Prot. 2009, 72, 662–665. [Google Scholar] [CrossRef]
- Gagiu, V.; Mateescu, E.; Smeu, I.; Dobre, A.A.; Cucu, M.E.; Oprea, O.A.; Iorga, E.; Belc, N. A survey of the cereal contamination with deoxynivalenol in Romania, for 2011–2013 period. Rom. Biotechnol. Lett. 2017, 22, 12240–12249. [Google Scholar]
- Schollenberger, M.; Lauber, U.; Terry-Jara, H.; Suchy, S.; Drochner, W.; Muller, H. Determination of eight trichothecenes by gas chromatography mass-spectrometry after sample clean-up by a two-stage solid phase extraction. J. Chromatogr. 1998, A815, 123–132. [Google Scholar] [CrossRef]
- Ferreira, I.; Fernandes, J.O.; Cunha, S.C. Optimization and validation of a method based in a QuEChERS procedure and gas chromatography–mass spectrometry for the determination of multi-mycotoxins in popcorn. Food Control 2012, 27, 188–193. [Google Scholar] [CrossRef]
- Ambrus, A.; Szeitznė-Szabó, M.; Zentai, A.; Sali, J.; Szabó, I.J. Exposure of consumers to deoxynivalenol from consumption of white bread in Hungary. Food Addit. Contam. 2011, 28, 209–217. [Google Scholar] [CrossRef]
- Commission Regulation (EC). No 401/2006 of 23 February 2006 laying down the methods of sampling and analysis for the official control of the levels of mycotoxins in foodstuffs. Off. J. Eur. Union. 2006, 70, 129. [Google Scholar]
- Rodríguez-Carrasco, Y.; Berrada, H.; Font, G.; Manes, J. Multi-mycotoxin analysis in wheat semolina using an acetonitrile-based extraction procedure and gas chromatography–tandem mass spectrometry. J. Chromatogr. 2012, 1270, 28–40. [Google Scholar] [CrossRef]
- Cunha, S.C.; Fernandes, J.O. Development and validation of a method based on a QuEChERS procedure and heart-cutting GC-MS for determination of five mycotoxins in cereal products. J. Sep. Sci. 2010, 33, 600–609. [Google Scholar] [CrossRef]
- Schollenberger, M.; Drochner, W.; Rüfle, M.; Suchy, S.; Terry-Jara, H.; Müller, H.M. Trichothecene toxins in different groups of conventional and organic bread of the German market. J. Food Compos. Anal. 2005, 18, 69–78. [Google Scholar] [CrossRef]
- Wu, L.; Zhang, H.; Hu, X.; Zhang, Y.; Sun, L.; Li, W.; Wang, B. Deacetylation of 3-acetyl-deoxynivalenol in wheat flour is mediated by water-soluble proteins during the making of Chinese steamed bread. Food Chem. 2020, 303, 125341. [Google Scholar] [CrossRef] [PubMed]
- Kochiieru, Y.; Mankeviciene, A.; Janaviciene, S.; Jonaviciene, A.; Ceseviciene, J. The influence of milling and sifting processes on deoxynivalenol distribution in whole-wheat flour and its products. World Mycotoxin. J. 2019, 12, 133–140. [Google Scholar] [CrossRef]
- Malachova, A.; Dzuman, Z.; Veprikova, Z.; Vaclavikova, M.; Zachariasova, M.; Hajslova, J. Deoxynivalenol, deoxynivalenol-3-glucoside, and enniatins: The major mycotoxins found in cereal-based products on the Czech market. J. Agric. Food Chem. 2011, 59, 12990–12997. [Google Scholar] [CrossRef]
- Kostelanska, M.; Dzuman, Z.; Malachova, A.; Capouchova, I.; Prokinova, E.; Skerikova, A.; Hajslova, J. Effects of milling and baking technologies on levels of deoxynivalenol and its masked form deoxynivalenol-3-glucoside. J. Agric. Food Chem. 2011, 59, 9303–9312. [Google Scholar] [CrossRef]
- Khaneghah, A.M.; Martins, L.M.; von Hertwig, A.M.; Bertoldo, R.; Sant’Ana, A.S. Deoxynivalenol and its masked forms: Characteristics, incidence, control and fate during wheat and wheat based products processing—A review. Trends Food Sci. Technol. 2018, 71, 13–24. [Google Scholar] [CrossRef]
- Alexa, E.; Dehelean, C.A.; Poiana, M.A.; Radulov, I.; Cimpean, A.M.; Bordean, D.M.; Tulcan, C.; Pop, G. The occurrence of mycotoxins in wheat from western Romania and histopathological impact as effect of feed intake. Chem. Cent. J. 2013, 7, 99. [Google Scholar] [CrossRef]
- Bryła, M.; Ksieniewicz-Wozniak, E.; Waskiewicz, A.; Szymczyk, K.; Jedrzejczak, R. Natural Occurrence of Nivalenol, Deoxynivalenol, and Deoxynivalenol-3-Glucoside in Polish Winter Wheat. Toxins 2018, 10, 81. [Google Scholar] [CrossRef]
- Xu, W.; Han, X.; Li, F. Co-occurrence of multi-mycotoxins in wheat grains harvested in Anhui province, China. Food Control 2019, 96, 180–185. [Google Scholar] [CrossRef]
- Liu, Y.; Lu, Y.; Wang, L.; Chang, F.; Yang, L. Occurrence of deoxynivalenol in wheat, Hebei Province, China. Food Chem. 2016, 197, 1271–1274. [Google Scholar] [CrossRef]
- Pokrzywa, P.; Cieślik, E.; Surma, M. Effect of storage conditions on the formation of type A and B trichothecenes in cereal products. Ann. Agric Environ. Med. 2019, 26, 260–265. [Google Scholar] [CrossRef]
- Autoritatea Naţională Sanitară Veterinară şi Pentru Siguranţa Alimentelor (ANSVSA) Norme Metodologice din 30 Martie 2016 de Aplicare a Programului de Supraveghere și Control în Domeniul Siguranței Alimen-Telor. Ordinul nr. 35/2016 Publicat în Monitorul Oficial al României, Partea I, nr. 303 din 20 Aprilie 2016. Available online: https://legislatie.just.ro/Public/DetaliiDocumentAfis/265834 (accessed on 11 June 2023).
- European Commission. Commission Decision of 12 August 2002 implementing Council Directive 96/23/EC concerning the performance of analytical methods and the interpretation of results. Off. J. Eur. Communities 2022, L221, 8–36. [Google Scholar]


| Toxin | Detection Limit (µg/kg) | Spiking Concentration (µg/kg) | Recoveries (%) and Standard Deviations (%) | ||
|---|---|---|---|---|---|
| Wheat | Bread | Pasta | |||
| NIV | 20 | 500 | 55 ± 7.9 | 68 ± 14.7 | 57 ± 6.5 |
| 200 | 64 ± 5.3 | 68 ± 4.5 | 69 ± 6.2 | ||
| FUS-X | 10 | 500 | 69 ± 10.6 | 88 ± 4.6 | 68 ± 7.3 |
| 200 | 71 ± 3.9 | 91 ± 6.1 | 85 ± 6.9 | ||
| DON | 10 | 500 | 95 ± 3.4 | 88 ± 2.6 | 103 ± 4.9 |
| 200 | 88 ± 7.9 | 93 ± 7.1 | 94 ± 8.2 | ||
| 15-ADON | 4 | 500 | 83 ± 5.2 | 97 ± 4.4 | 81 ± 0.5 |
| 200 | 90 ± 8.1 | 93 ± 5.4 | 91 ± 3.3 | ||
| 3-ADON | 9 | 500 | 63 ± 10.1 | 86 ± 7.1 | 64 ± 3.4 |
| 200 | 69 ± 9.2 | 88 ± 11.3 | 77 ± 11.9 | ||
| T-2 | 3 | 500 | 83 ± 10.6 | 103 ± 8.2 | 79 ± 8.6 |
| 200 | 81 ± 6.2 | 94 ± 4.1 | 91 ± 5.8 | ||
| HT-2 | 2 | 500 | 75 ± 4.9 | 87 ± 3.8 | 77 ± 7.1 |
| 200 | 72 ± 8.2 | 83 ± 4.5 | 79 ± 6.3 | ||
| T-2 TRIOL | 6 | 500 | 65 ± 9.6 | 79 ± 6.1 | 67 ± 9.1 |
| 200 | 68 ± 8.5 | 77 ± 10.1 | 67 ± 4.4 | ||
| T-2 TETRAOL | 45 | 500 | 55 ± 12.1 | 64 ± 7.3 | 55 ± 13.4 |
| 200 | 60 ± 9.2 | 62 ± 8.7 | 58 ± 10.2 | ||
| SCIRP | 5 | 500 | 63 ± 0.6 | 78 ± 10.3 | 62 ± 9.8 |
| 200 | 62 ± 4.3 | 67 ± 6.9 | 62 ± 11.2 | ||
| MAS | 2 | 500 | 70 ± 4.7 | 89 ± 5.1 | 70 ± 5.5 |
| 200 | 67 ± 5.5 | 86 ± 4.5 | 71 ± 4.8 | ||
| DAS | 6 | 500 | 76 ± 15.1 | 107 ± 6.5 | 70 ± 5.3 |
| 200 | 76 ± 10.2 | 104 ± 8.9 | 72 ± 6.8 | ||
| NEO | 4 | 500 | 80 ± 11.8 | 99 ± 6.7 | 78 ± 9.1 |
| 200 | 78 ± 9.4 | 102 ± 6.1 | 76 ± 5.7 | ||
| Sample Type | Toxin Detected | No. of Positive Samples | Range (µg/kg) |
|---|---|---|---|
| Group A | DON | 29 | 15–352 |
| HT-2 | 1 | 3 | |
| T-2 | 1 | 5 | |
| Group B | DON | 13 | 50–346 |
| Group C | DON | 14 | 15–326 |
| Group D | DON | 15 | 15–35 |
| Group E | |||
| Subgroup E1 | DON | 12 | 70–1346 |
| 15-DON | 2 | 6–9 | |
| HT-2 | 7 | 3–7 | |
| Subgroup E2 | DON | 8 | 21–3395 |
| 15-DON | 5 | 6–99 | |
| DAS | 1 | 19 | |
| HT-2 | 4 | 5–8 | |
| T-2 | 1 | 7 | |
| Subgroup E3 | DON | 18 | 41–2048 |
| 15-DON | 8 | 8–52 | |
| HT-2 | 10 | 3–18 | |
| NIV | 1 | 30 |
| Group A | Group B | Group C | Group D | ||
|---|---|---|---|---|---|
| N | 29 | 13 | 14 | 15 | |
| Mean | 96.65 | 178.38 | 114.92 | 22.13 | |
| Median | 52.00 | 192.00 | 74.50 | 21.00 | |
| Std. Deviation | 103.01 | 102.16 | 105.13 | 7.27 | |
| Range | 337.00 | 296.00 | 331.00 | 20.00 | |
| Minimum | 15.00 | 50.00 | 15.00 | 15.00 | |
| Maximum | 352.00 | 346.00 | 346.00 | 35.00 | |
| Percentiles | 25 | 33.00 | 78.00 | 51.75 | 15.00 |
| 50 | 52.00 | 192.00 | 74.50 | 21.00 | |
| 75 | 101.50 | 268.00 | 173.75 | 30.00 | |
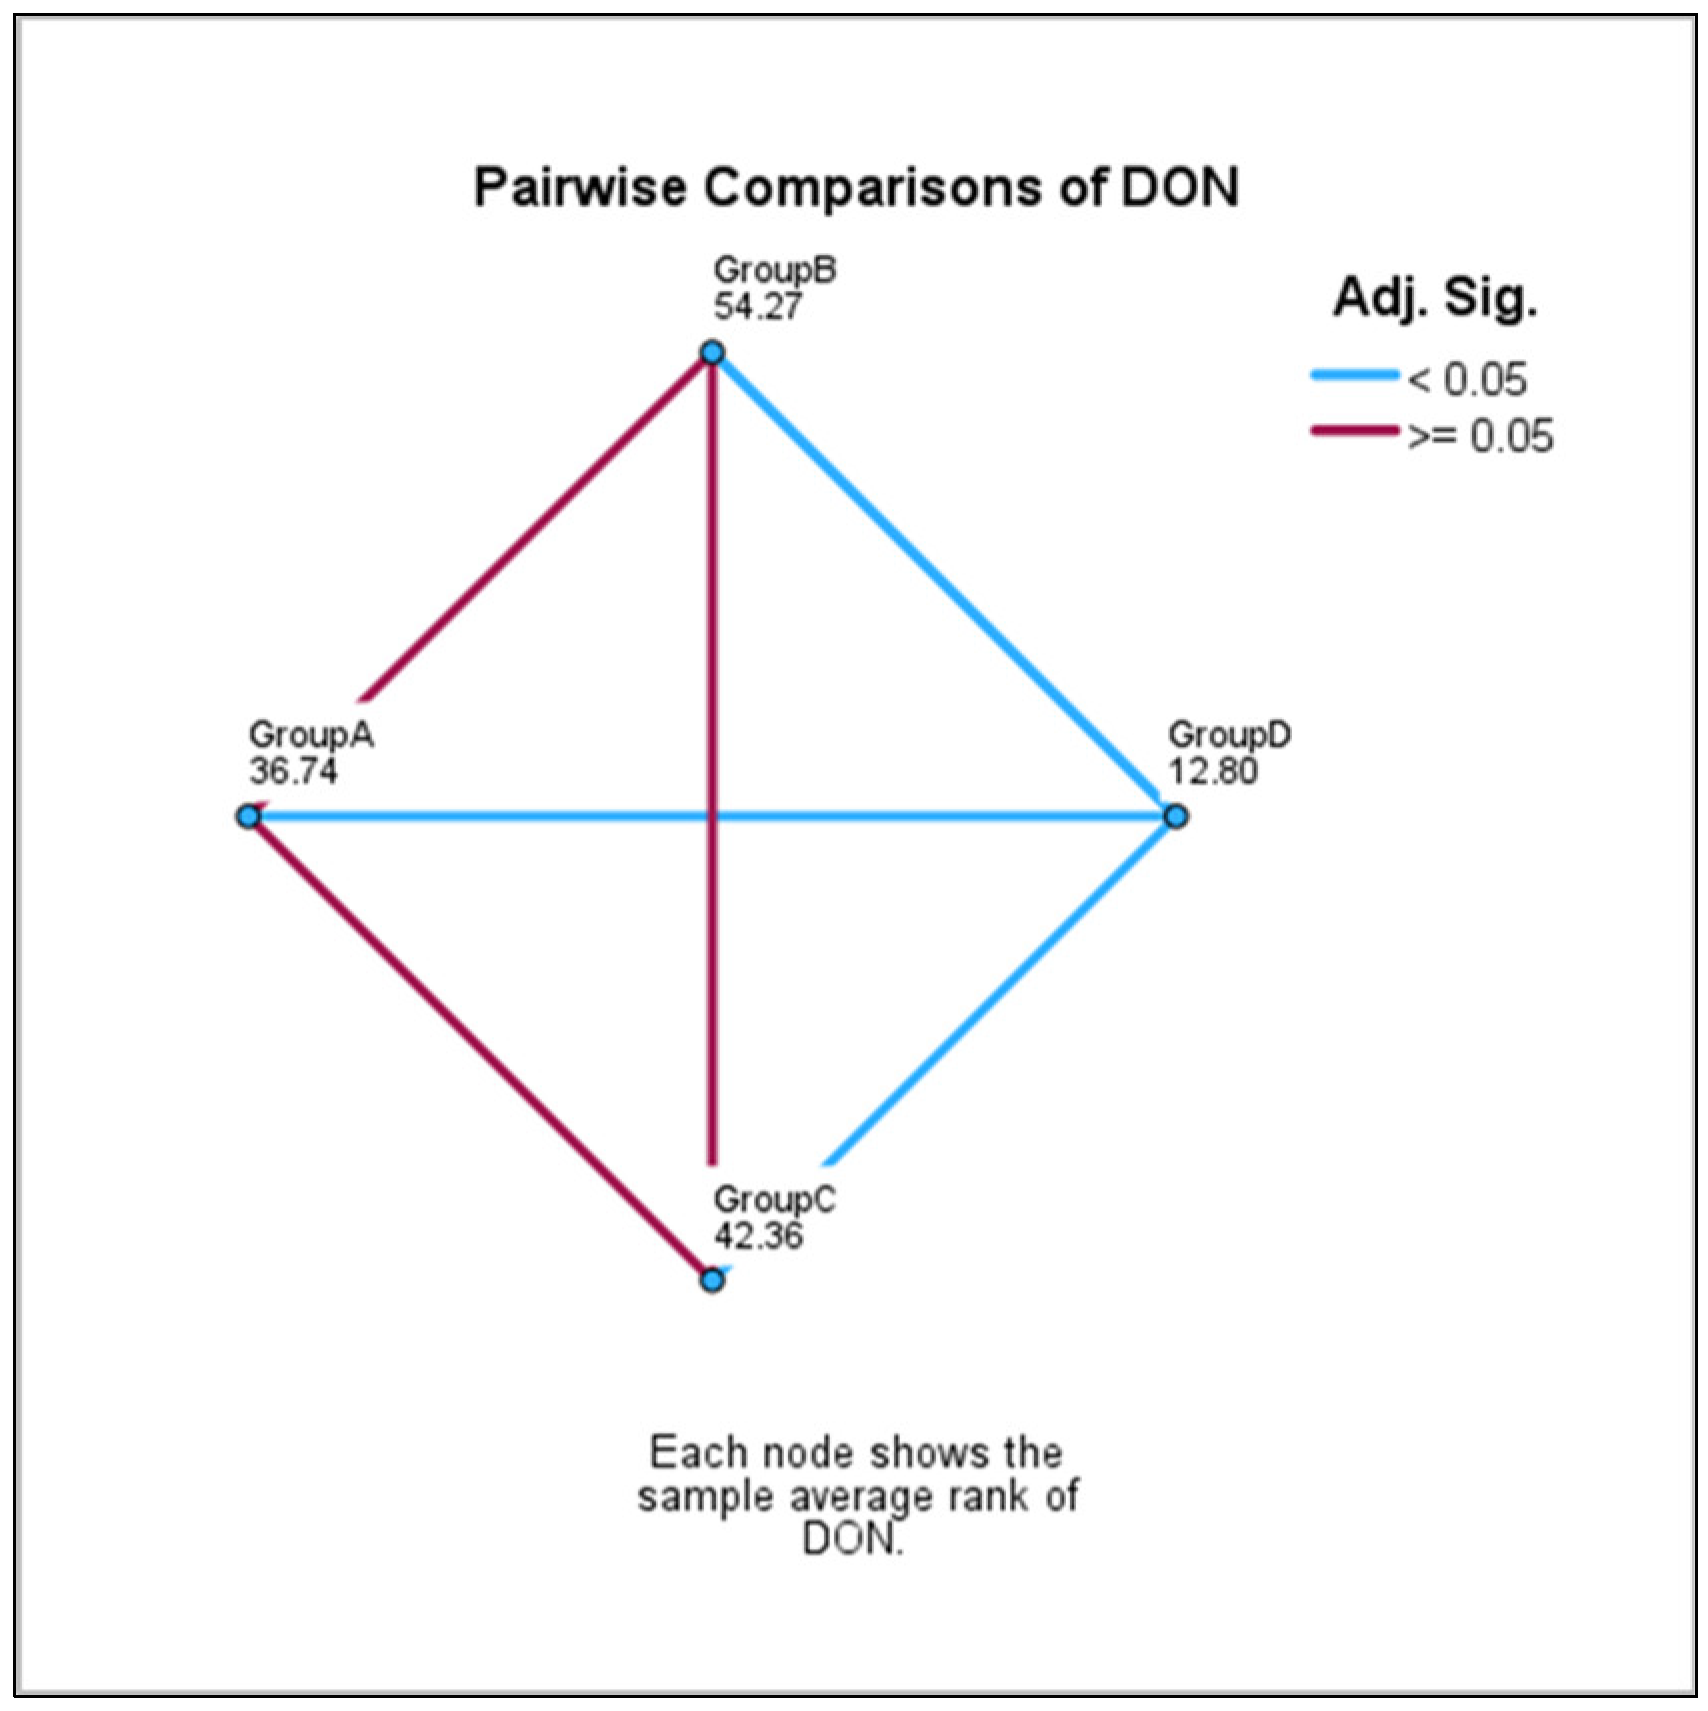
| Sample1-Sample2 | Test Statistic | Std. Error | Std. Test Statistic | Sig. | Adj. Sig.a |
|---|---|---|---|---|---|
| GroupD-GroupA | 23.94 | 6.55 | 3.65 | <0.001 | 0.002 ** |
| GroupD-GroupC | 29.55 | 7.66 | 3.85 | <0.001 | 0.001 *** |
| GroupD-GroupB | 41.46 | 7.81 | 5.30 | <0.001 | 0.000 *** |
| GroupA-GroupC | −5.61 | 6.71 | −0.83 | 0.403 | 1.000 NS |
| GroupA-GroupB | −17.52 | 6.88 | −2.54 | 0.011 | 0.065 NS |
| GroupC-GroupB | 11.91 | 7.94 | 1.50 | 0.134 | 0.802 NS |
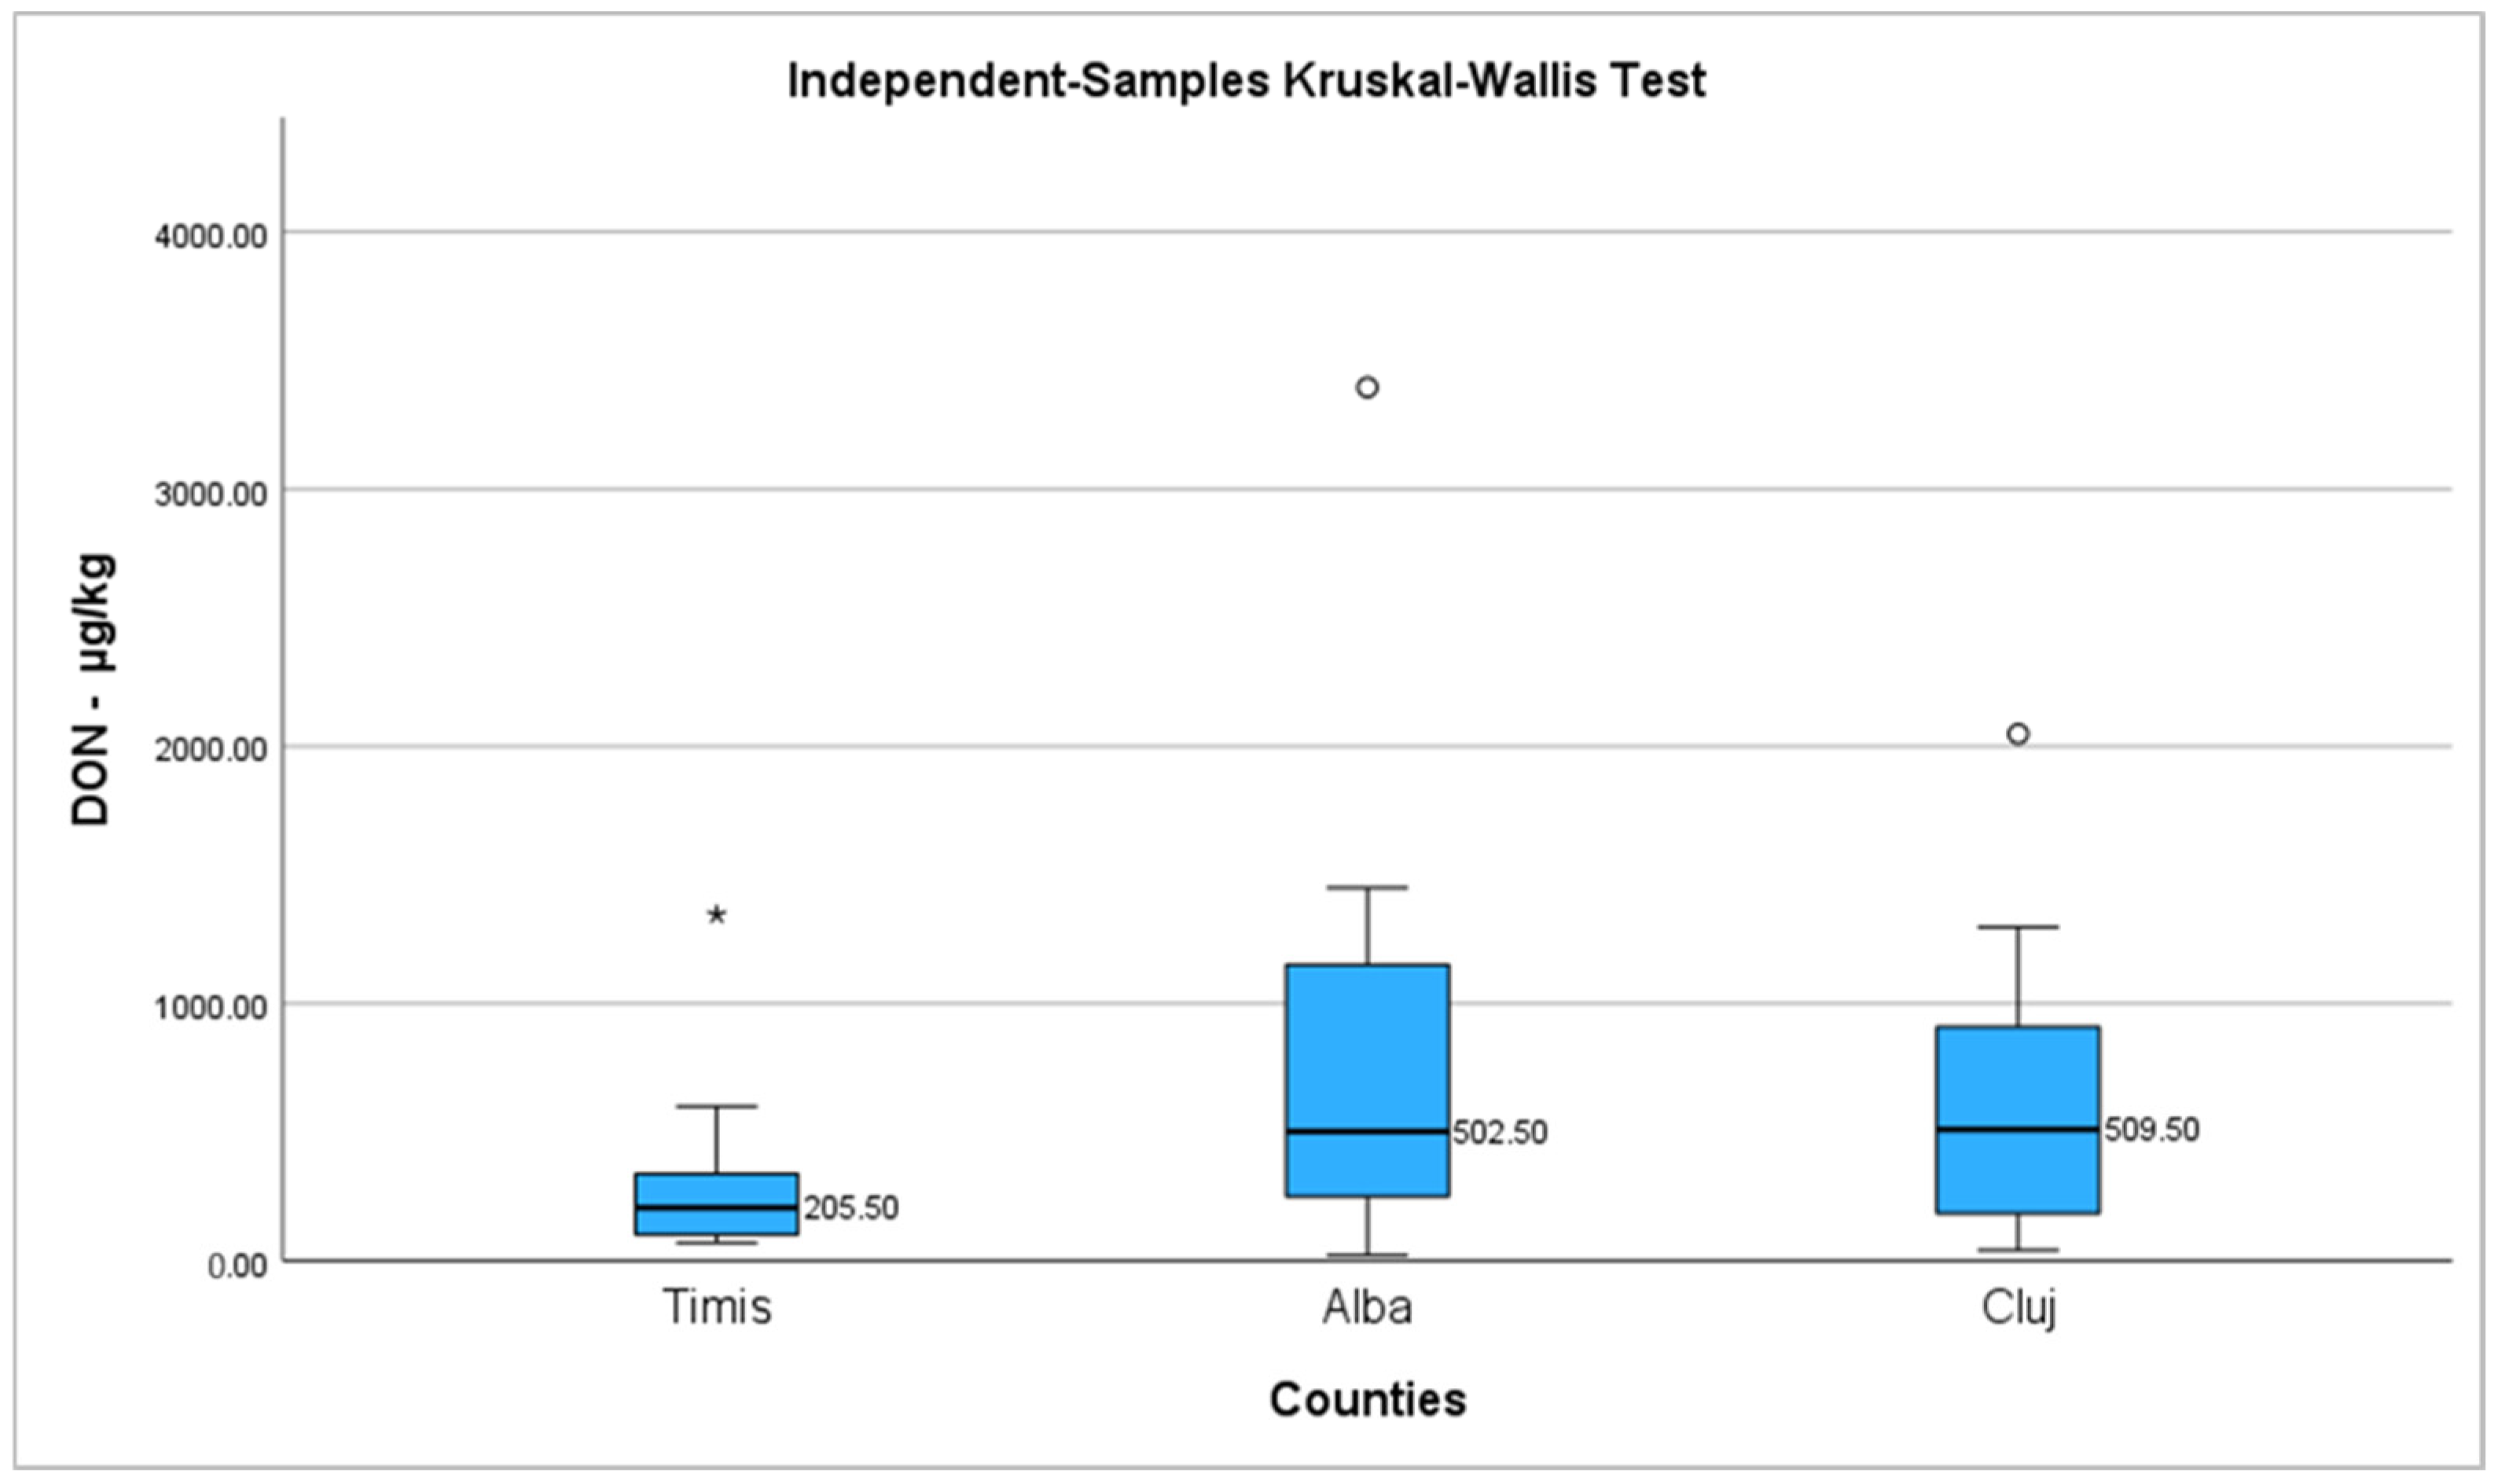
| Timis | Alba | Cluj | ||
|---|---|---|---|---|
| N | 12 | 8 | 18 | |
| Mean | 315.16 | 903.00 | 604.11 | |
| Median | 205.50 | 502.50 | 509.50 | |
| Std. Deviation | 359.96 | 1100.04 | 521.50 | |
| Range | 1276.00 | 3374.00 | 2007.00 | |
| Minimum | 70.00 | 21.00 | 41.00 | |
| Maximum | 1346.00 | 3395.00 | 2048.00 | |
| Percentiles | 25 | 100.75 | 220.75 | 169.25 |
| 50 | 205.50 | 502.50 | 509.50 | |
| 75 | 387.00 | 1300.50 | 933.75 | |
| Timis | Alba | Cluj | ||
|---|---|---|---|---|
| N | 2 | 5 | 8 | |
| Mean | 7.50 | 27.00 | 25.25 | |
| Median | 7.50 | 9.00 | 21.00 | |
| Std. Deviation | 2.12 | 40.41 | 14.15 | |
| Range | 3.00 | 93.00 | 44.00 | |
| Minimum | 6.00 | 6.00 | 8.00 | |
| Maximum | 9.00 | 99.00 | 52.00 | |
| Percentiles | 25 | 6.00 | 6.00 | 17.75 |
| 50 | 7.50 | 9.00 | 21.00 | |
| 75 | . | 57.00 | 36.25 | |
| Timis | Alba | Cluj | ||
|---|---|---|---|---|
| N | 7 | 4 | 10 | |
| Mean | 5.00 | 6.25 | 9.20 | |
| Median | 5.00 | 6.00 | 9.50 | |
| Std. Deviation | 1.29 | 1.50 | 4.31 | |
| Range | 4.00 | 3.00 | 15.00 | |
| Minimum | 3.00 | 5.00 | 3.00 | |
| Maximum | 7.00 | 8.00 | 18.00 | |
| Percentiles | 25 | 4.00 | 5.00 | 5.75 |
| 50 | 5.00 | 6.00 | 9.50 | |
| 75 | 6.00 | 7.75 | 11.25 | |
| (I) Counties | (J) Counties | Mean Difference (I-J) | Std. Error | Sig. | 95% Confidence Interval | |
|---|---|---|---|---|---|---|
| Lower Bound | Upper Bound | |||||
| Timis | Alba | −1.25 | 2.00 | 0.809 NS | −6.36 | 3.86 |
| Cluj | −4.20 | 1.57 | 0.040 * | −8.22 | −0.17 | |
| Alba | Timis | 1.25 | 2.00 | 0.809 NS | −3.86 | 6.36 |
| Cluj | −2.95 | 1.89 | 0.289 NS | −7.78 | 1.88 | |
| Cluj | Timis | 4.20 | 1.57 | 0.040 * | 0.17 | 8.22 |
| Alba | 2.95 | 1.89 | 0.289 NS | −1.88 | 7.78 | |
| Mycotoxin | Mass Ranges Used for Quantification |
|---|---|
| DON | 471–473 |
| 15-ADON | 471–473 |
| 3-ADON | 531–533 |
| NIV | 583–585 |
| FUS-X | 529–531 |
| T-2 | 401–403 |
| HT-2 | 455–457 |
| T-2 TRIOL | 569–571 |
| T-2 TETRAOL | 569–571 |
| DAS | 403–405 |
| MAS | 457–459 |
| SCIRP | 411–413 |
| NEO | 401–403 |
Disclaimer/Publisher’s Note: The statements, opinions and data contained in all publications are solely those of the individual author(s) and contributor(s) and not of MDPI and/or the editor(s). MDPI and/or the editor(s) disclaim responsibility for any injury to people or property resulting from any ideas, methods, instructions or products referred to in the content. |
© 2023 by the authors. Licensee MDPI, Basel, Switzerland. This article is an open access article distributed under the terms and conditions of the Creative Commons Attribution (CC BY) license (https://creativecommons.org/licenses/by/4.0/).
Share and Cite
Macri, A.M.; Nagy, A.-L.; Daina, S.; Toma, D.; Pop, I.D.; Nadăș, G.C.; Cătoi, A.F. Occurrence of Types A and B Trichothecenes in Cereal Products Sold in Romanian Markets. Toxins 2023, 15, 466. https://doi.org/10.3390/toxins15070466
Macri AM, Nagy A-L, Daina S, Toma D, Pop ID, Nadăș GC, Cătoi AF. Occurrence of Types A and B Trichothecenes in Cereal Products Sold in Romanian Markets. Toxins. 2023; 15(7):466. https://doi.org/10.3390/toxins15070466
Chicago/Turabian StyleMacri, Adrian Maximilian, Andras-Laszlo Nagy, Sorana Daina, Diana Toma, Ioana Delia Pop, George Cosmin Nadăș, and Adriana Florinela Cătoi. 2023. "Occurrence of Types A and B Trichothecenes in Cereal Products Sold in Romanian Markets" Toxins 15, no. 7: 466. https://doi.org/10.3390/toxins15070466
APA StyleMacri, A. M., Nagy, A.-L., Daina, S., Toma, D., Pop, I. D., Nadăș, G. C., & Cătoi, A. F. (2023). Occurrence of Types A and B Trichothecenes in Cereal Products Sold in Romanian Markets. Toxins, 15(7), 466. https://doi.org/10.3390/toxins15070466