A Higher Dose of Staphylococcus aureus Enterotoxin B Led to More Th1 and Lower Th2/Th1 Ratio in Th Cells

 ,
,  , , , and
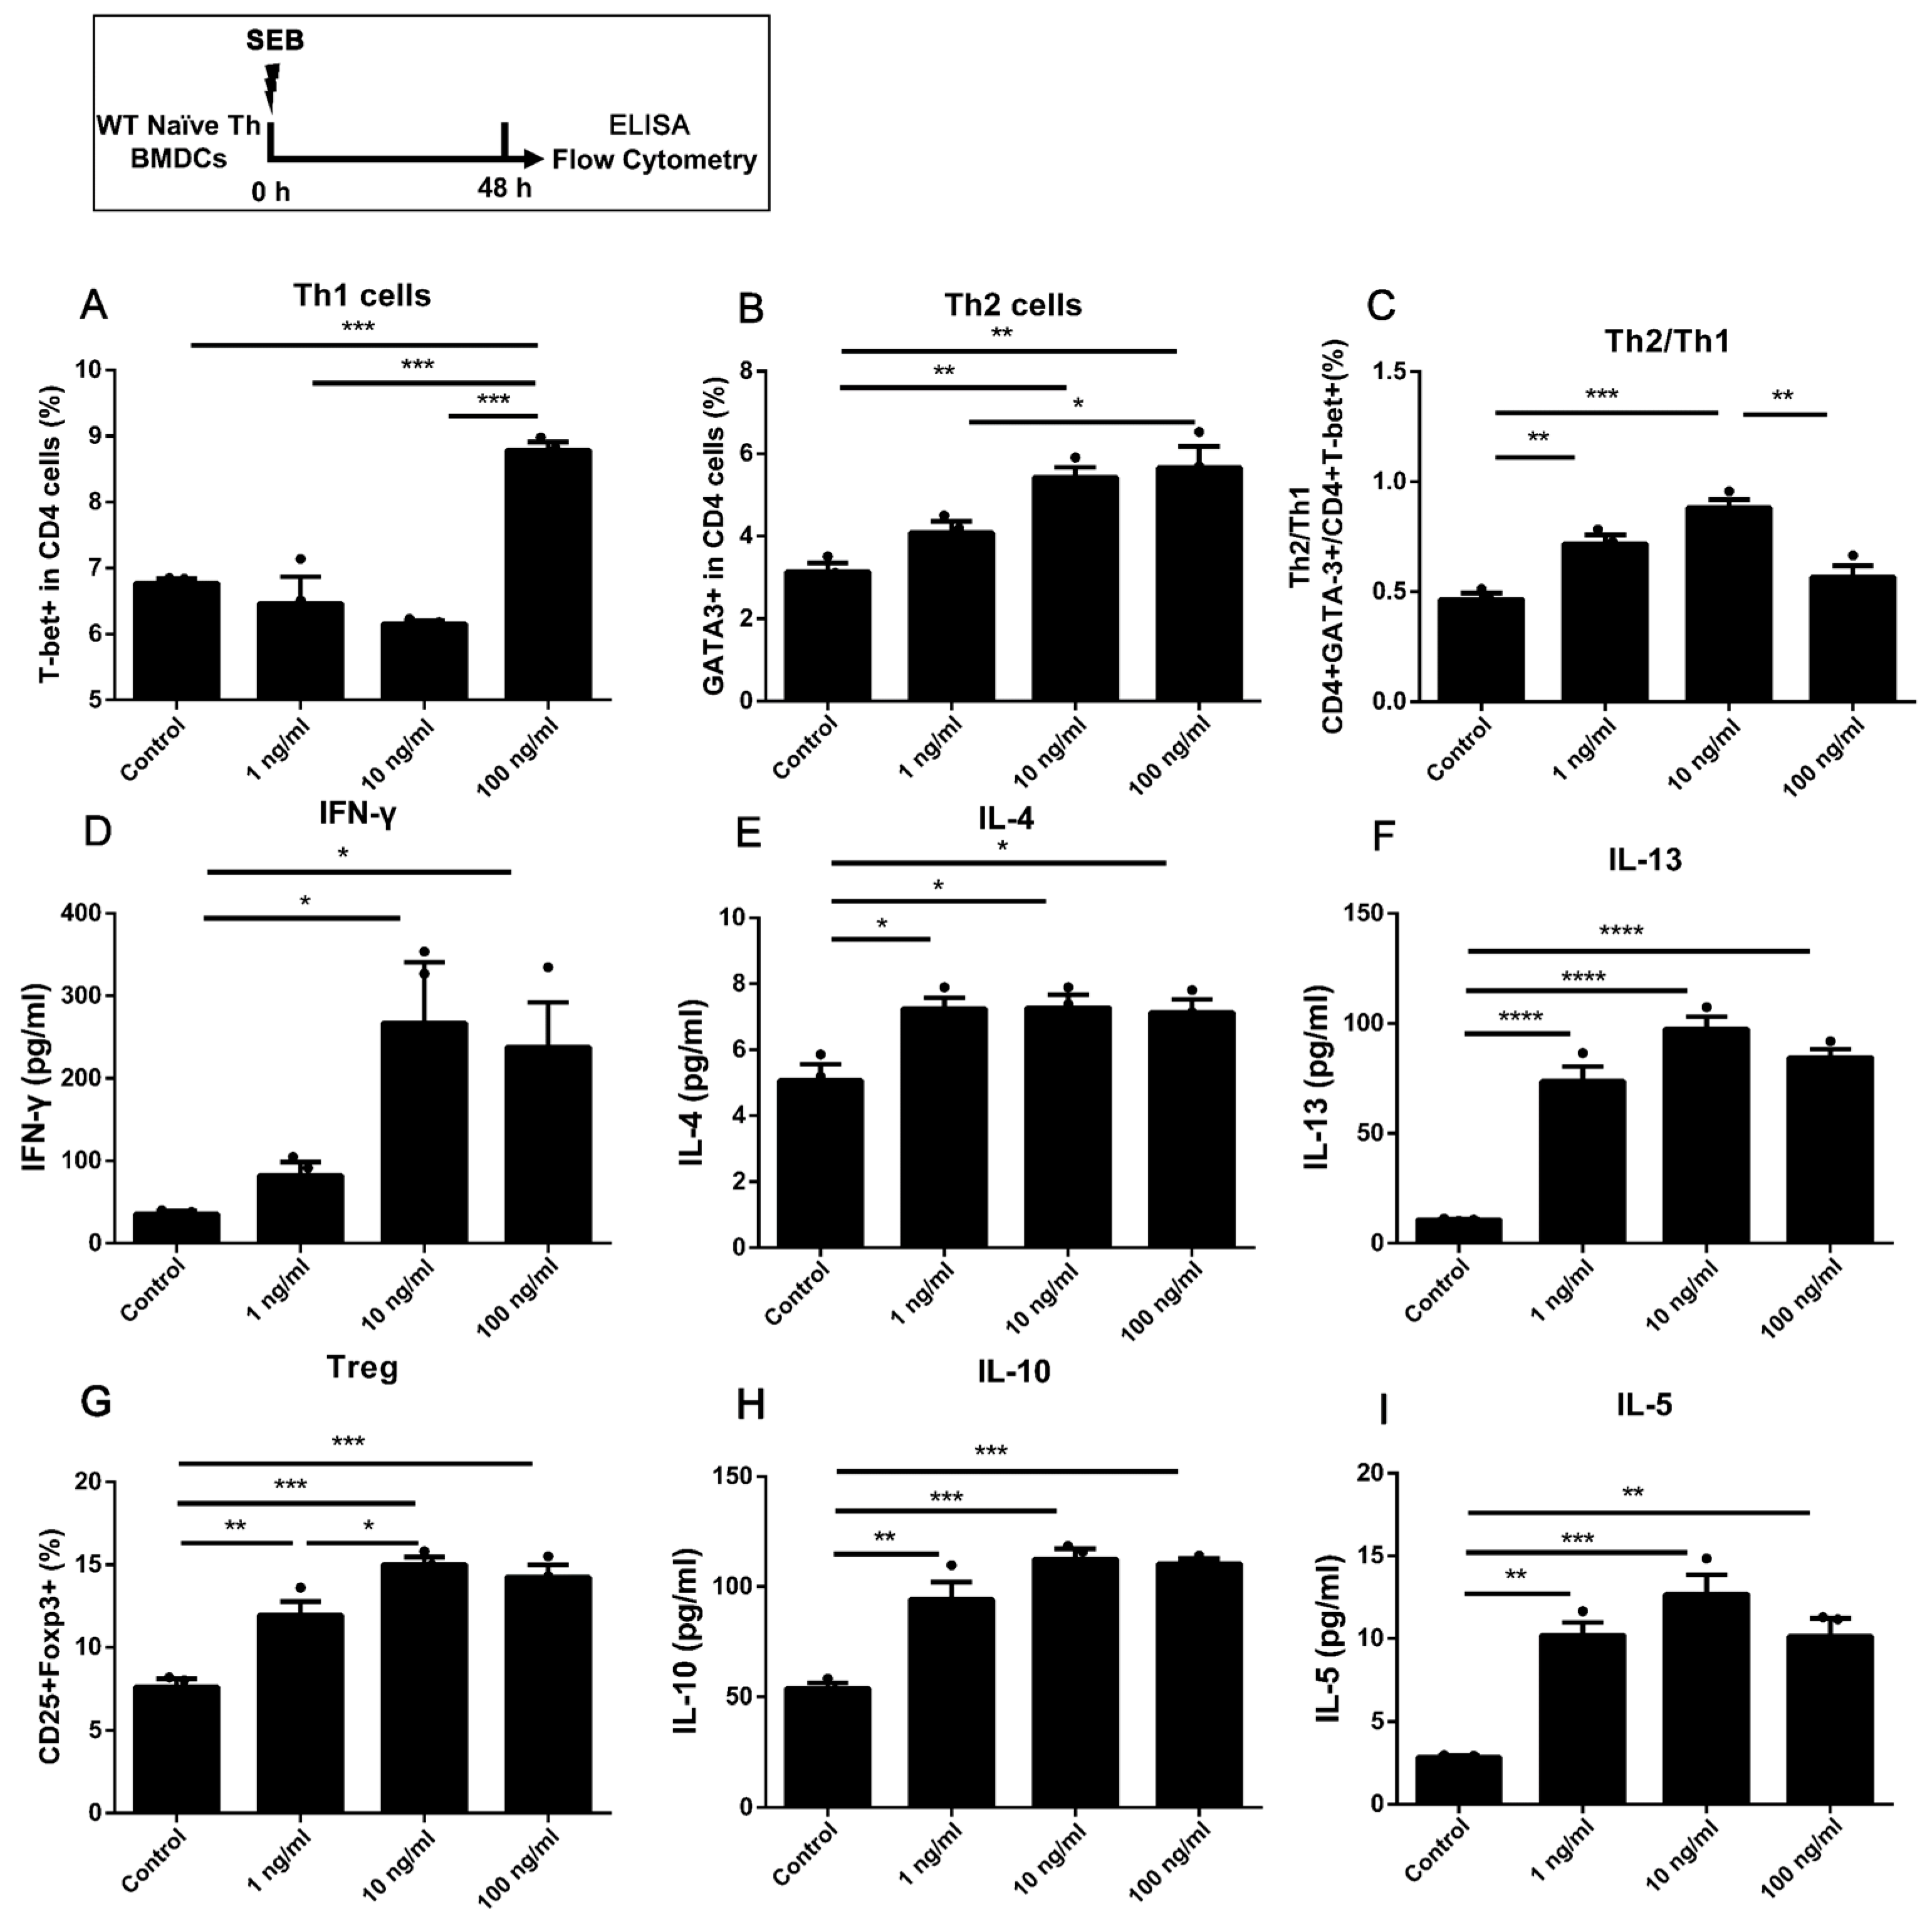
Abstract
1. Introduction
2. Results
2.1. Stimulating 1 ng/mL SEB Could Induce the Differentiation of Th2 and Treg Cells in Co-Culture with BMDCs
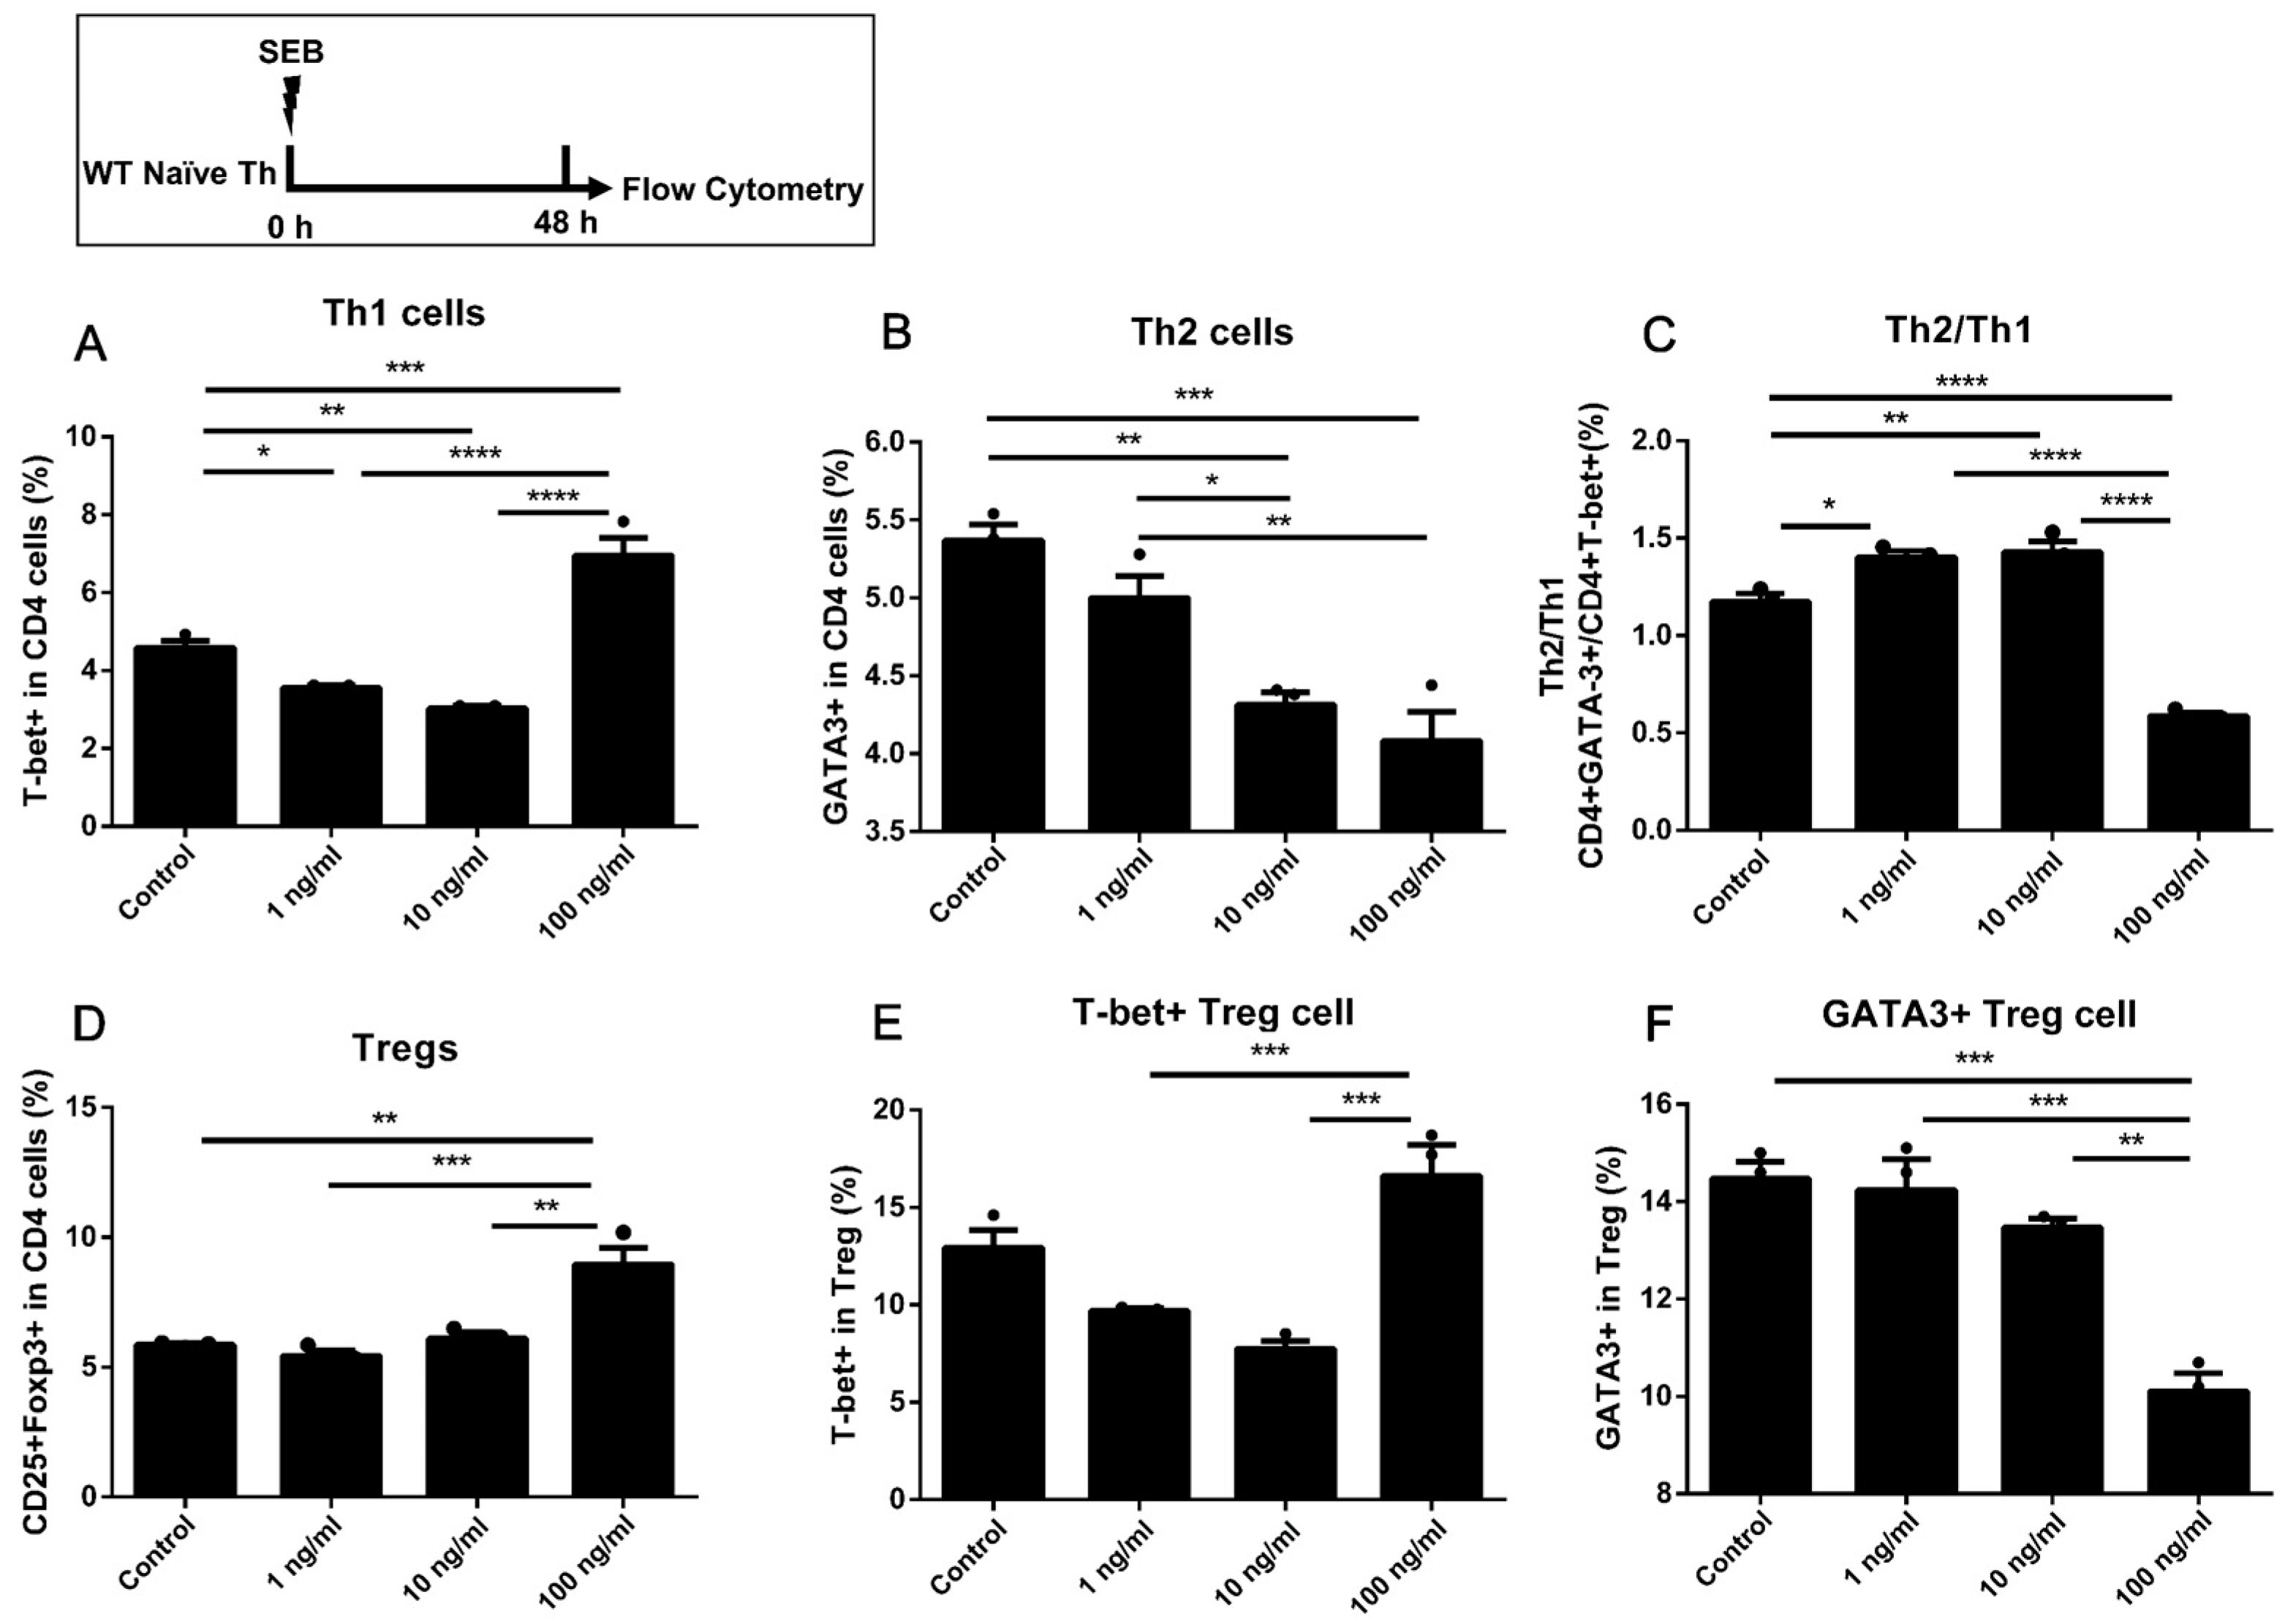
2.2. The Naïve Th Cells Alone Stimulated with a Higher Dose of SEB Tended to Have More Th1 and Less Th2 Differentiation
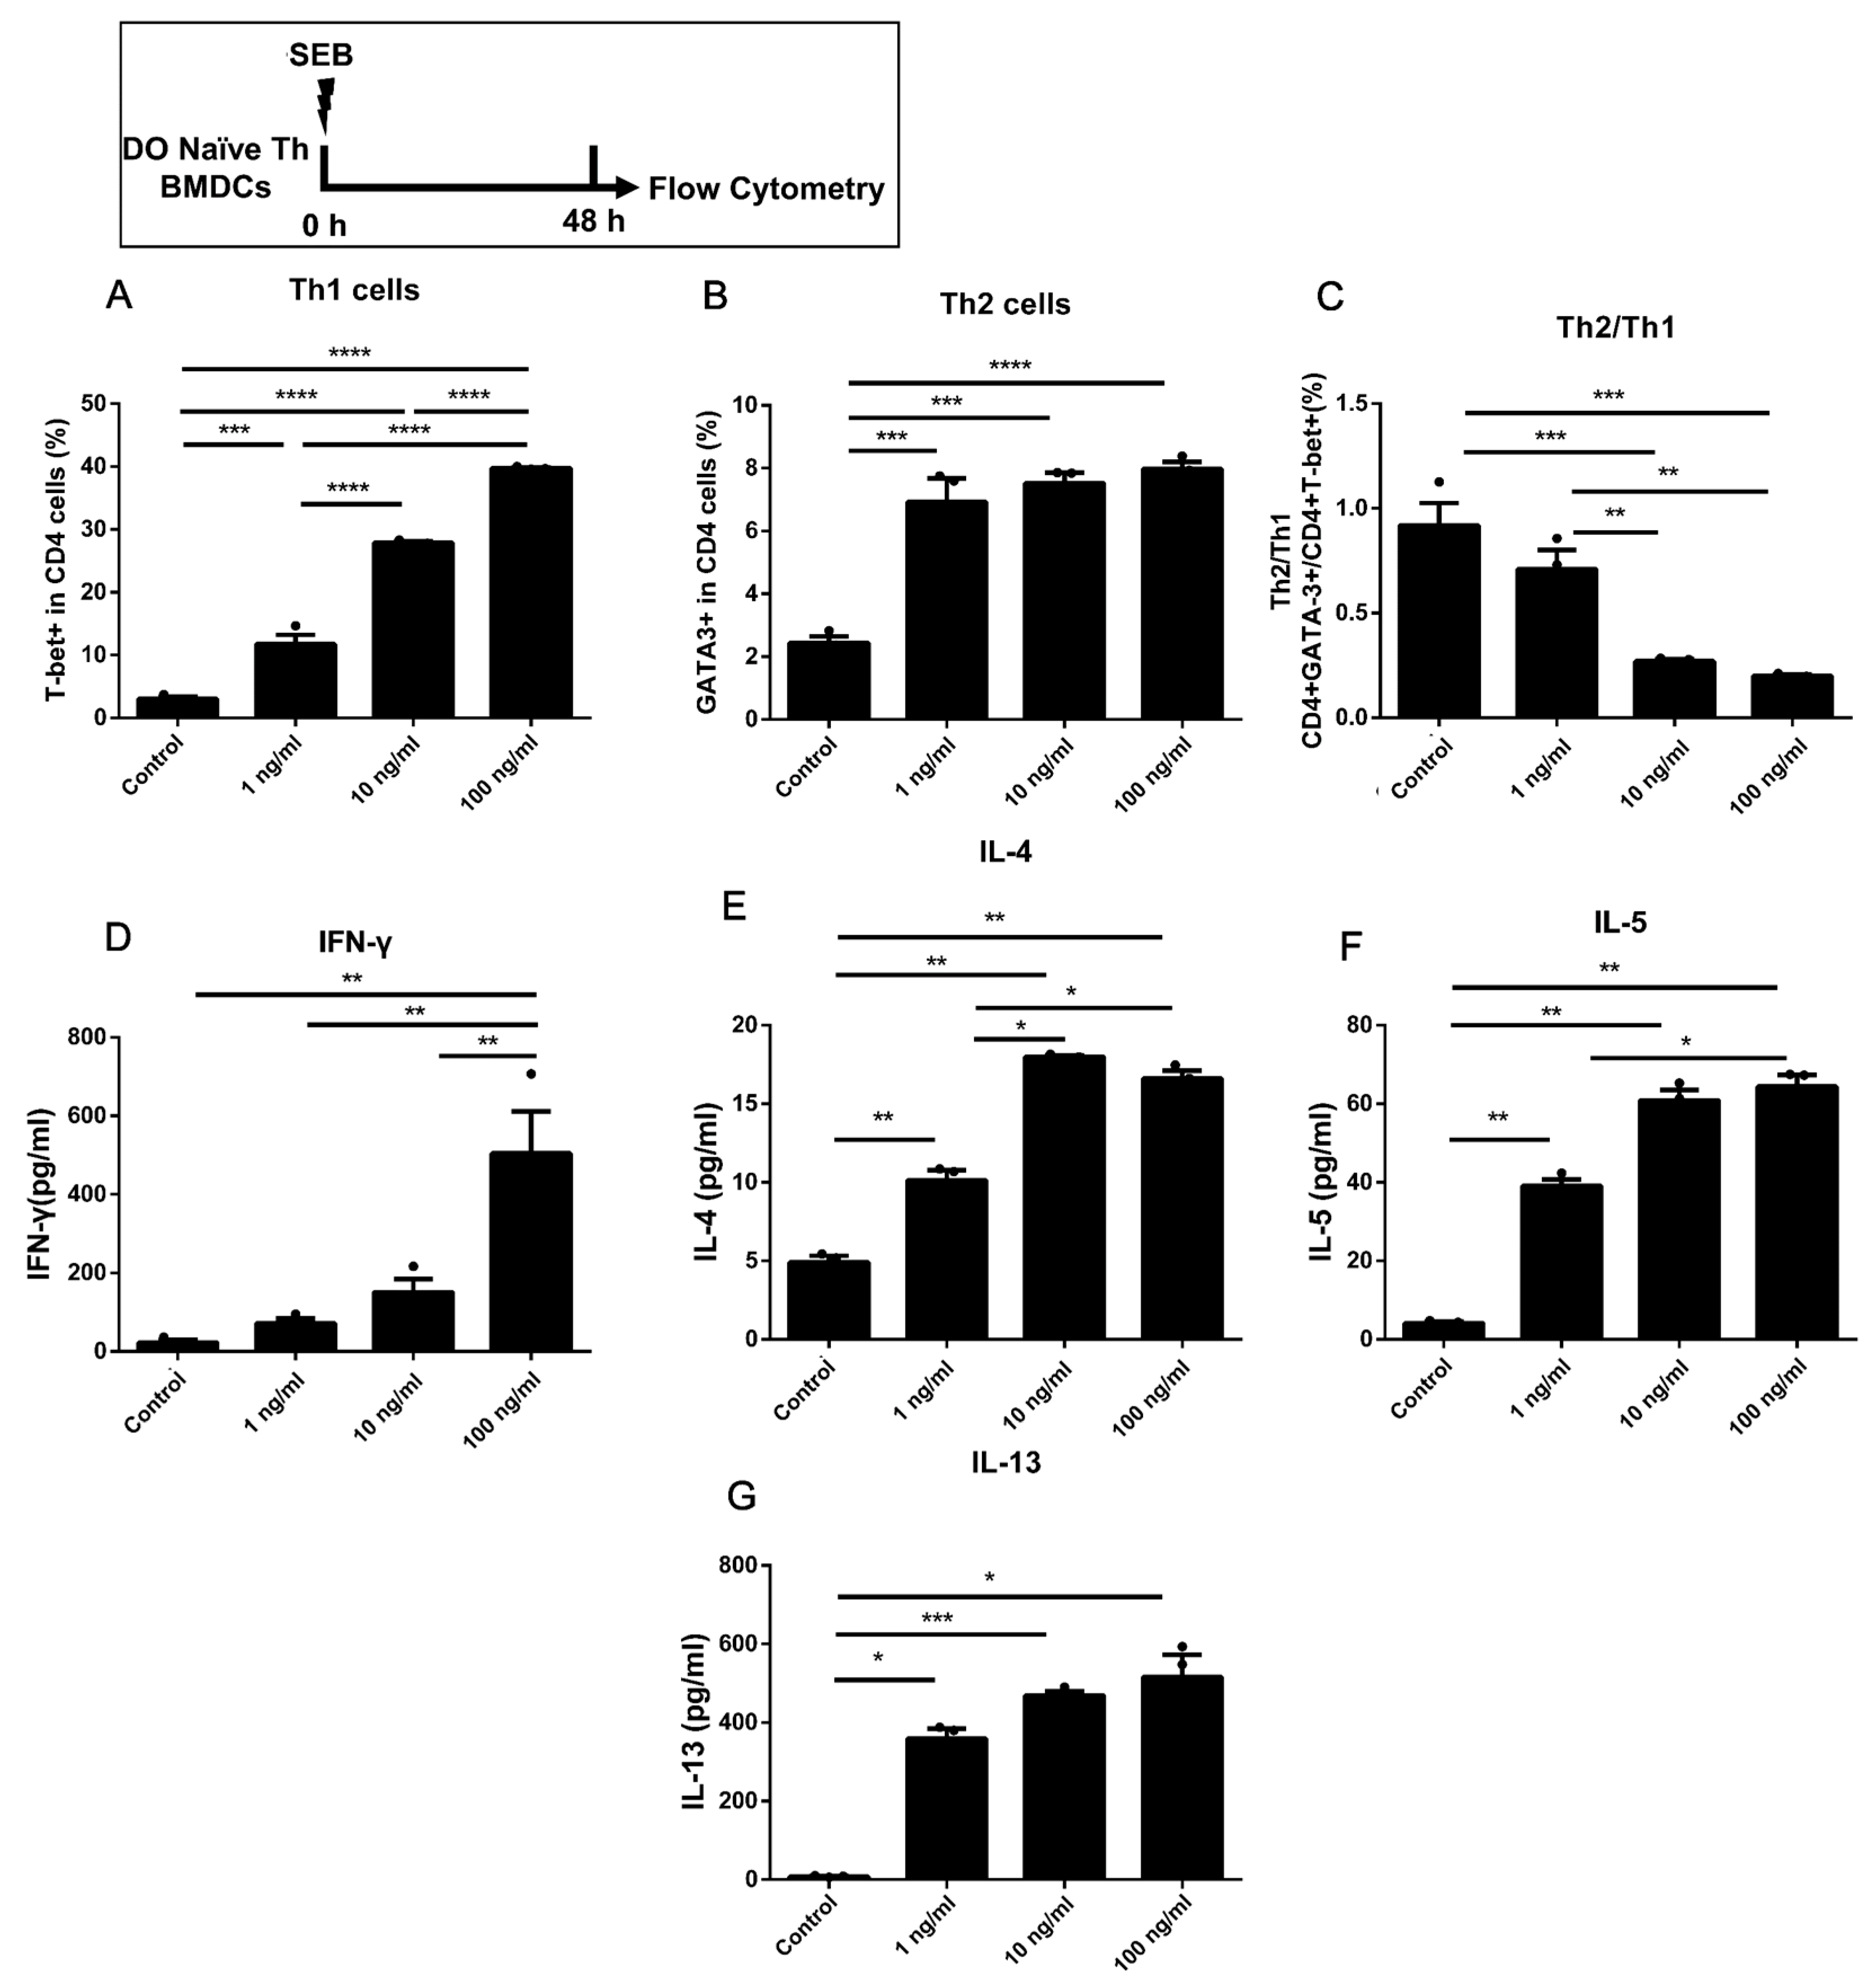
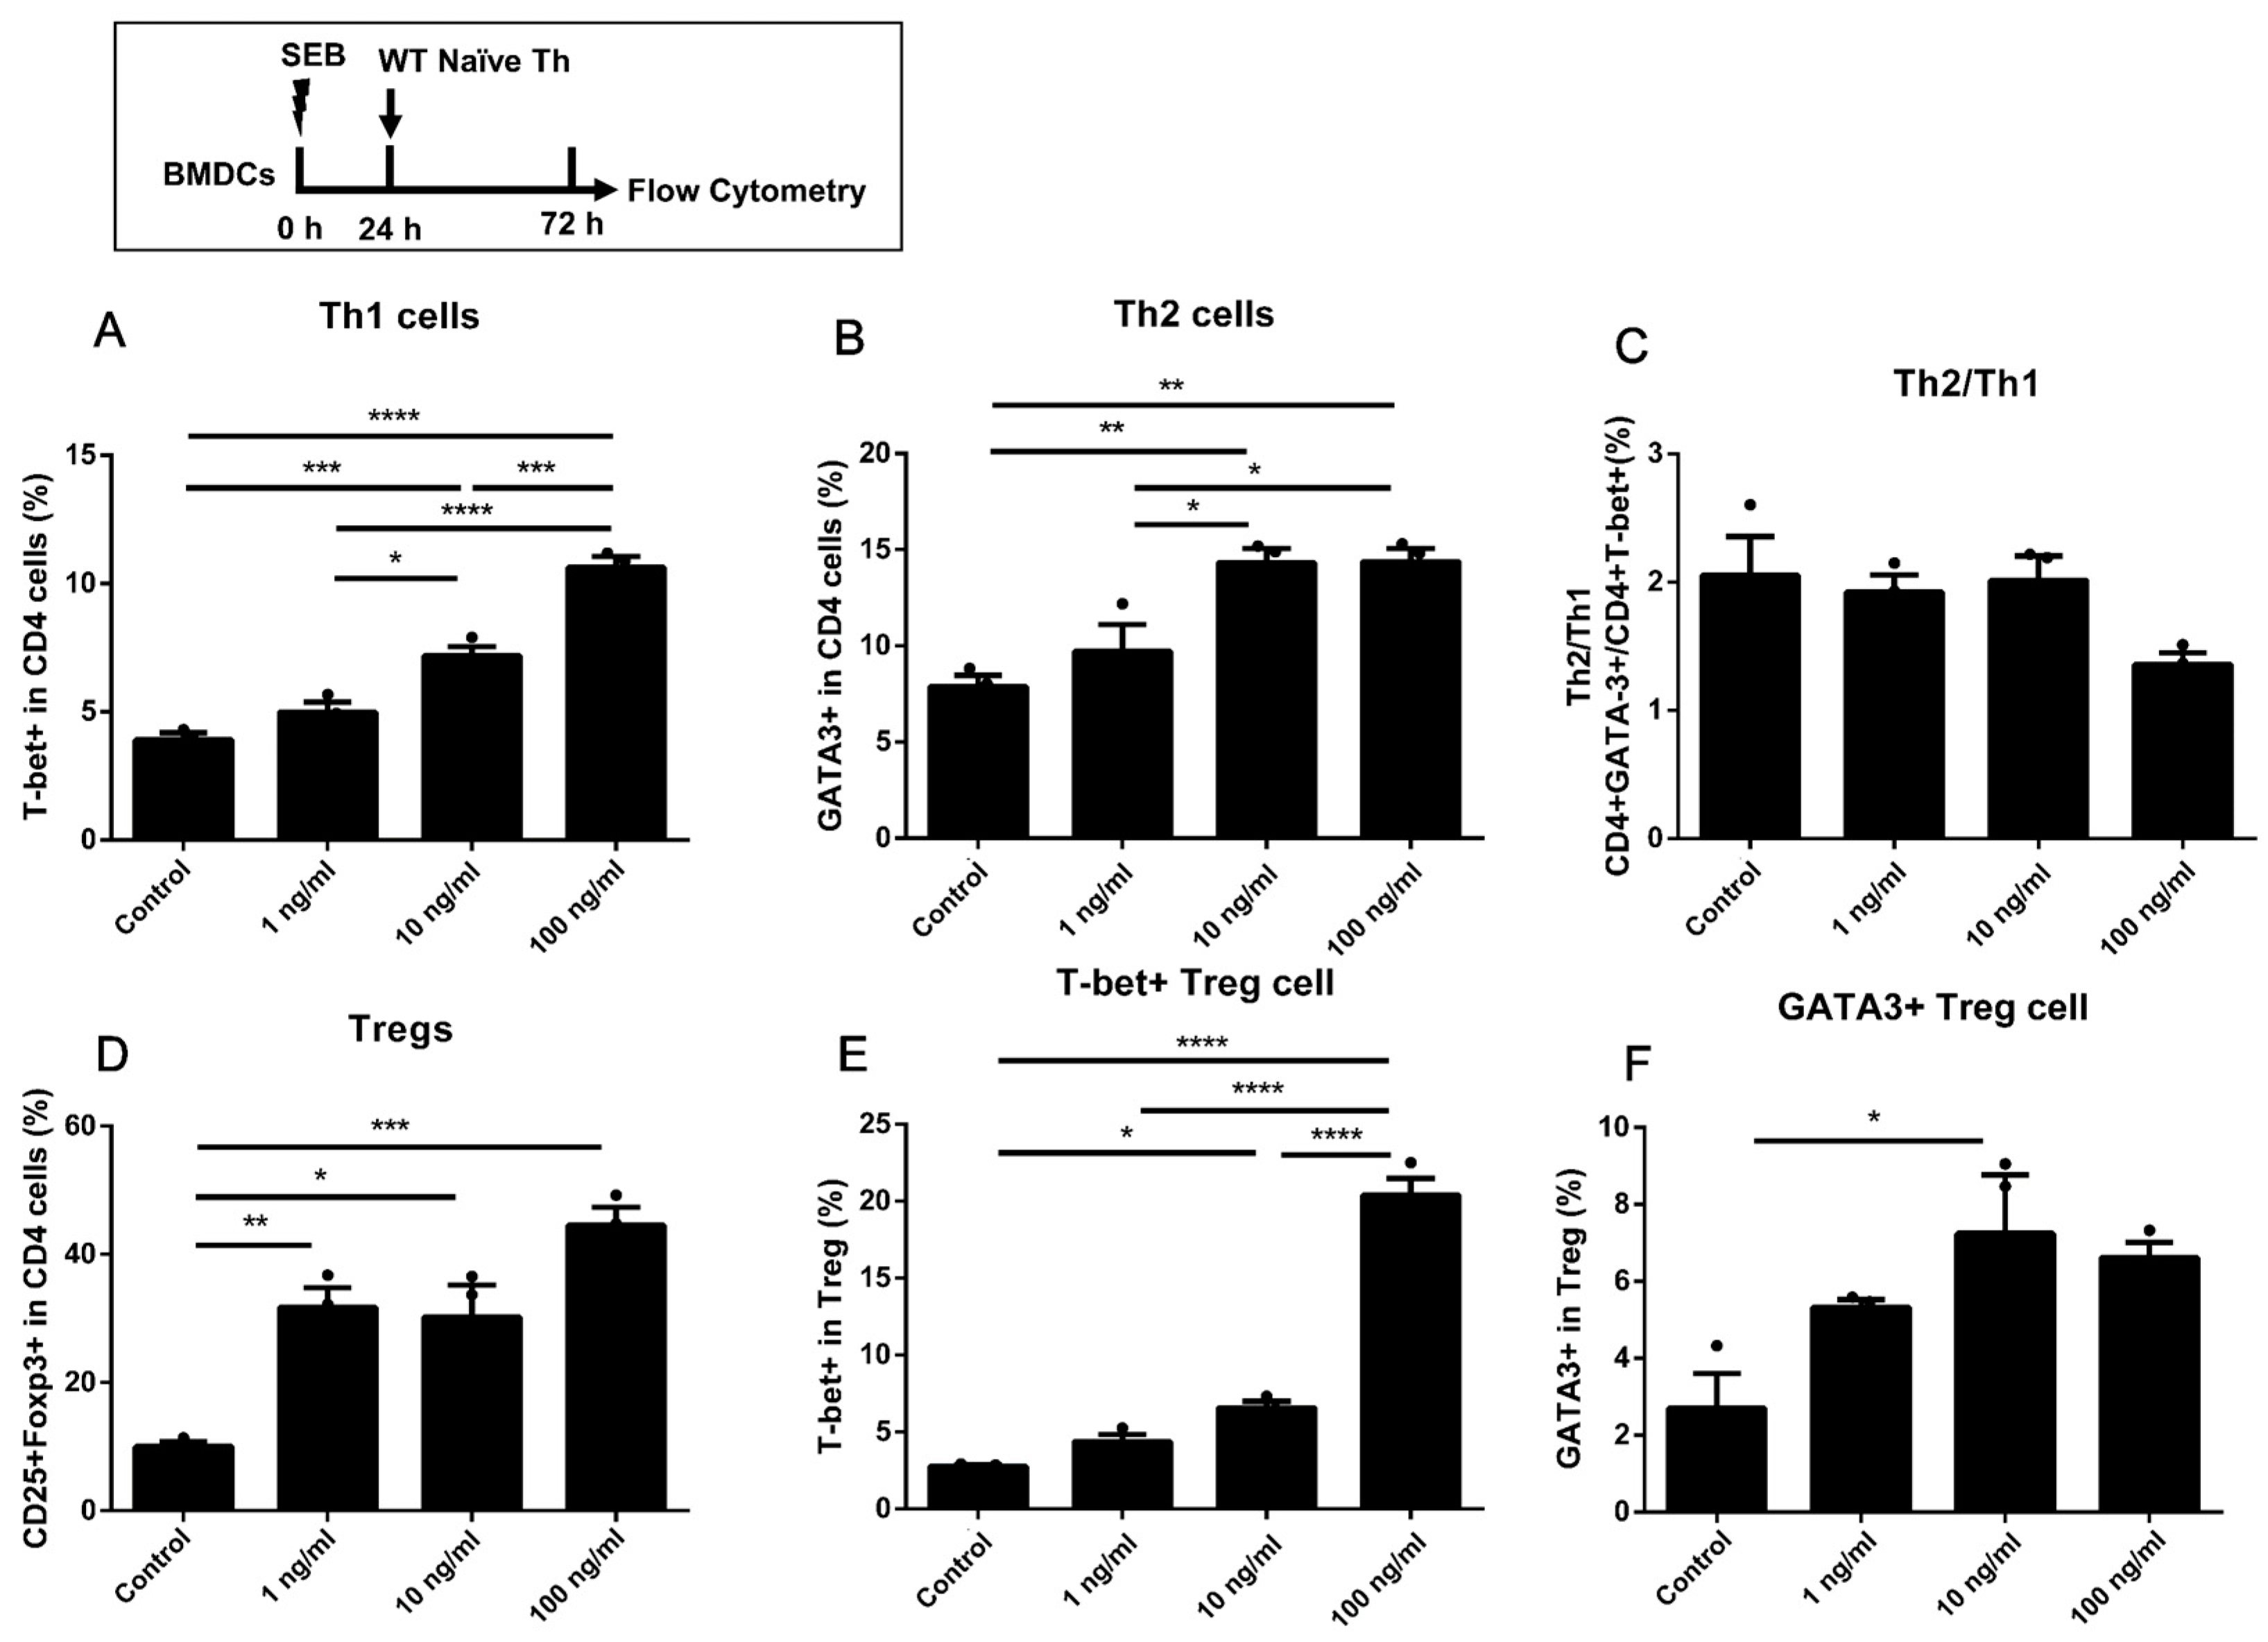
2.3. Dose-Dependent Up-Regulation of Th1 and Treg in DO11.10 Naïve T Cells Could Be Induced by the Stimulation of SEB in Co-Culture with BMDCs
2.4. The Activation of Naïve T Cells Could Be Induced by Co-Culture with BMDCs Pre-Stimulated with Higher Doses of SEB
2.5. More Th1 but Less Th2 Differentiation Was Found in the High Dose of SEB Group Compared to the Low Dose
3. Discussion
4. Conclusions
5. Materials and Methods
5.1. Generation of BMDCs and Isolation of Spleen Naïve CD4 T Cells
5.2. Cell Stimulation
5.3. Flow Cytometry and Antibodies
5.4. ELISAs
5.5. Statistical Analysis
Supplementary Materials
Author Contributions
Funding
Institutional Review Board Statement
Informed Consent Statement
Data Availability Statement
Conflicts of Interest
References
- Kadariya, J.; Smith, T.C.; Thapaliya, D. Staphylococcus aureus and staphylococcal food-borne disease: An ongoing challenge in public health. BioMed Res. Int. 2014, 189, 2099–2109. [Google Scholar] [CrossRef]
- Schlievert, P.M.; Strandberg, K.L.; Lin, Y.-C.; Peterson, M.L.; Leung, D.Y.M. Secreted virulence factor comparison between methicillin-resistant and methicillin-sensitive Staphylococcus aureus, and its relevance to atopic dermatitis. J. Allergy Clin. Immunol. 2010, 125, 39–49. [Google Scholar] [CrossRef] [PubMed]
- Ceccarelli, F.; Perricone, C.; Olivieri, G.; Cipriano, E.; Spinelli, F.R.; Valesini, G.; Conti, F. Staphylococcus aureus Nasal Carriage and Autoimmune Diseases: From Pathogenic Mechanisms to Disease Susceptibility and Phenotype. Int. J. Mol. Sci. 2019, 20, 5624. [Google Scholar] [CrossRef] [PubMed]
- Gagnaire, J.; Verhoeven, P.O.; Grattard, F.; Rigaill, J.; Lucht, F.; Pozzetto, B.; Berthelot, P.; Botelho-Nevers, E. Epidemiology and clinical relevance of Staphylococcus aureus intestinal carriage: A systematic review and meta-analysis. Expert Rev. Anti. Infect. Ther. 2017, 15, 767–785. [Google Scholar] [CrossRef]
- Argudin, M.A.; Mendoza, M.C.; Rodicio, M.R. Food poisoning and Staphylococcus aureus enterotoxins. Toxins 2010, 2, 1751–1773. [Google Scholar] [CrossRef]
- Aik, J.; Turner, R.M.; Kirk, M.D.; Heywood, A.E.; Newall, A.T. Evaluating food safety management systems in Singapore: A controlled interrupted time-series analysis of foodborne disease outbreak reports. Food Control 2020, 117, 107324. [Google Scholar] [CrossRef]
- Kaempfer, R. Bacterial Superantigen Toxins, CD28, and Drug Development. Toxins 2018, 10, 459. [Google Scholar] [CrossRef]
- Verreault, D.; Ennis, J.; Whaley, K.; Killeen, S.Z.; Karauzum, H.; Aman, M.J.; Holtsberg, R.; Doyle-Meyers, L.; Didier, P.J.; Zeitlin, L.; et al. Effective Treatment of Staphylococcal Enterotoxin B Aerosol Intoxication in Rhesus Macaques by Using Two Parenterally Administered High-Affinity Monoclonal Antibodies. Antimicrob. Agents Chemother. 2019, 63, e02049-18. [Google Scholar] [CrossRef]
- Hamad, A.R.A.; Marrack, P.; Kappler, J.W. Transcytosis of staphylococcal superantigen toxins. J. Exp. Med. 1997, 185, 1447–1454. [Google Scholar] [CrossRef]
- Yan, H.; Yi, H.; Xia, L.; Zhan, Z.; He, W.; Cao, J.; Yang, P.-C.; Liu, Z. Staphylococcal enterotoxin B suppresses Alix and compromises intestinal epithelial barrier functions. J. Biomed. Sci. 2014, 21, 29. [Google Scholar] [CrossRef]
- Martens, K.; Seys, S.F.; Alpizar, Y.A.; Schrijvers, R.; Bullens, D.M.A.; Breynaert, C.; Lebeer, S.; Steelant, B. Staphylococcus aureus enterotoxin B disrupts nasal epithelial barrier integrity. Clin. Exp. Allergy 2021, 51, 87–98. [Google Scholar] [CrossRef]
- Cook, E.; Wang, X.; Robiou, N.; Fries, B.C. Measurement of staphylococcal enterotoxin B in serum and culture supernatant with a capture enzyme-linked immunosorbent assay. Clin. Vaccine Immunol. 2007, 14, 1094–1101. [Google Scholar] [CrossRef] [PubMed]
- Rajagopalan, G.; Sen, M.M.; Singh, M.; Murali, N.S.; Nath, K.A.; Iijima, K.; Kita, H.; Leontovich, A.A.; Gopinathan, U.; Patel, R.; et al. Intranasal exposure to staphylococcal enterotoxin B elicits an acute systemic inflammatory response. Shock 2006, 25, 647–656. [Google Scholar] [CrossRef] [PubMed]
- Bhatti, A.R.; Micusan, V.V. Intestinal immune-response induced in mice by staphylococcal-enterotoxin-B. Comp. Immunol. Microbiol. Infect. Dis. 1995, 18, 9–16. [Google Scholar] [CrossRef] [PubMed]
- Brosnahan, A.J.; Schlievert, P.M. Gram-positive bacterial superantigen outside-in signaling causes toxic shock syndrome. Febs J. 2011, 278, 4649–4667. [Google Scholar] [CrossRef]
- Chen, H.; Zhang, J.; He, Y.; Lv, Z.; Liang, Z.; Chen, J.; Li, P.; Liu, J.; Yang, H.; Tao, A.; et al. Exploring the Role of Staphylococcus aureus in Inflammatory Diseases. Toxins 2022, 14, 464. [Google Scholar] [CrossRef]
- Cook-Mills, J.M.; Kaplan, M.H.; Turner, M.J.; Kloepfer, K.M.; Kumar, R. Exposure: Staphylococcus aureus skin colonization predisposes to food allergy in the Learning Early about Allergy to Peanut (LEAP) and LEAP-On studies. J. Allergy Clin. Immunol. 2019, 144, 404–406. [Google Scholar] [CrossRef]
- Liu, T.; He, S.H.; Zheng, P.Y.; Zhang, T.Y.; Wang, B.Q.; Yang, P.C. Staphylococcal enterotoxin B increases TIM4 expression in human dendritic cells that drives naive CD4 T cells to differentiate into Th2 cells. Mol. Immunol. 2007, 44, 3580–3587. [Google Scholar] [CrossRef]
- Jorde, I.; Hildebrand, C.B.; Kershaw, O.; Lucke, E.; Stegemann-Koniszewski, S.; Schreiber, J. Modulation of Allergic Sensitization and Allergic Inflammation by Staphylococcus aureus Enterotoxin B in an Ovalbumin Mouse Model. Front. Immunol. 2020, 11, 592186. [Google Scholar] [CrossRef]
- Hon, K.L.; Tsang, K.Y.C.; Kung, J.S.C.; Leung, T.F.; Lam, C.W.K.; Wong, C.K. Clinical Signs, Staphylococcus and Atopic Eczema-Related Seromarkers. Molecules 2017, 22, 291. [Google Scholar] [CrossRef]
- Biggs, T.C.; Hayes, S.M.; Harries, P.G.; Allan, R.N.; Walls, A.F.; Pender, S.L.F.; Salib, R.J. Immunological profiling of key inflammatory drivers of nasal polyp formation and growth in chronic rhinosinusitis. Rhinology 2019, 57, 336–342. [Google Scholar] [CrossRef] [PubMed]
- Liu, X.Y.; Xu, L.Z.; Luo, X.Q.; Geng, X.R.; Liu, Z.Q.; Yang, L.T.; Yang, G.; Chen, S.; Liu, Z.G.; Li, H.B.; et al. Forkhead box protein-3 (Foxp3)-producing dendritic cells suppress allergic response. Allergy 2017, 72, 908–917. [Google Scholar] [CrossRef] [PubMed]
- Craig-Meyer, D.; Garcia, S.M.; Milbourne, D.; Murray, C.; Cadwallader, K. An investigative study to evaluate differences between responses in human, cynomolgus monkey and minipig in whole blood and peripheral blood mononuclear cells (PBMCs) using an in vitro assay to detect SEB-induced IL-2, IFN gamma and TNF alpha. Toxicol. Lett. 2021, 350, S101–S102. [Google Scholar] [CrossRef]
- Kunkl, M.; Amormino, C.; Caristi, S.; Tedeschi, V.; Fiorillo, M.T.; Levy, R.; Popugailo, A.; Kaempfer, R.; Tuosto, L. Binding of Staphylococcal Enterotoxin B (SEB) to B7 Receptors Triggers TCR- and CD28-Mediated Inflammatory Signals in the Absence of MHC Class II Molecules. Front. Immunol. 2021, 12, 723689. [Google Scholar] [CrossRef]
- Liu, T.; Liang, X.; Li, T.L.; Ma, J.; Yang, J.F.; Yang, P.C. Staphylococcal enterotoxin B compromises the immune tolerant status in the airway mucosa. Clin. Exp. Allergy 2012, 42, 375–382. [Google Scholar] [CrossRef]
- Oh, Y.J.; Shin, J.H.; Won, H.Y.; Hwang, E.S. Anti-proliferative Activity of T-bet. Immune Netw. 2015, 15, 199–205. [Google Scholar] [CrossRef]
- Kitz, A.; Dominguez-Villar, M. Molecular mechanisms underlying Th1-like Treg generation and function. Cell. Mol. Life Sci. 2017, 74, 4059–4075. [Google Scholar] [CrossRef]
- Lefebvre, D.E.; Ross, N.; Kocmarek, A.L.; Cowell, S.; Dai, S.; Qiao, C.; Curran, I.; Koerner, T.; Bondy, G.S.; Fine, J.H. In vitro immunomodulation of splenocytes from DO11.10 mice by the food colouring agent amaranth. Food Chem. Toxicol. Int. J. Publ. Br. Ind. Biol. Res. Assoc. 2017, 110, 395–401. [Google Scholar] [CrossRef]
- Rodstrom, K.E.J.; Elbing, K.; Lindkvist-Petersson, K. Structure of the Superantigen Staphylococcal Enterotoxin B in Complex with TCR and Peptide-MHC Demonstrates Absence of TCR-Peptide Contacts. J. Immunol. 2014, 193, 1998–2004. [Google Scholar] [CrossRef]
- Kunkl, M.; Amormino, C.; Caristi, S.; Tedeschi, V.; Fiorillo, M.T.; Levy, R.; Popugailo, A.; Kaempfer, R.; Tuosto, L. Staphylococcal enterotoxin B (SEB) activates TCR- and CD28-mediated inflammatory signals in the absence of MHC class II molecules. Eur. J. Immunol. 2021, 51, 204. [Google Scholar] [CrossRef]
- Hirahara, K.; Aoki, A.; Nakayama, T. Pathogenic helper T cells. Allergol. Int. 2021, 70, 169–173. [Google Scholar] [CrossRef] [PubMed]
- Zhou, J.-R.; Yamada, R.; Huruiti, E.; Kitahara, N.; Nakamura, H.; Fang, J.; Nohara, T.; Yokomizo, K. Ripe Tomato Saponin Esculeoside A and Sapogenol Esculeogenin A Suppress CD4+T Lymphocyte Activation by Modulation of Th2/Th1/Treg Differentiation. Nutrients 2022, 14, 2021. [Google Scholar] [CrossRef]
- Hwang, K.-A.; Hwang, Y.J.; Hwang, H.-J.; Lee, S.H.; Kim, Y.J. Sword Bean (Canavalia gladiata) Pod Exerts Anti-Allergic and Anti-Inflammatory Effects through Modulation of Th1/Th2 Cell Differentiation. Nutrients 2022, 14, 2853. [Google Scholar] [CrossRef] [PubMed]
- Aoki-Yoshida, A.; Yamada, K.; Hachimura, S.; Sashihara, T.; Ikegami, S.; Shimizu, M.; Totsuka, M. Enhancement of Oral Tolerance Induction in DO11.10 Mice by Lactobacillus gasseri OLL2809 via Increase of Effector Regulatory T Cells. PLoS ONE 2016, 11, e0158643. [Google Scholar] [CrossRef]
- Haruna, T.; Kariya, S.; Fujiwara, T.; Higaki, T.; Makihara, S.; Kanai, K.; Fujiwara, R.; Iwasaki, S.; Noguchi, Y.; Nishizaki, K.; et al. Association between impaired IL-10 production following exposure to Staphylococcus aureus enterotoxin B and disease severity in eosinophilic chronic rhinosinusitis. Allergol. Int. 2018, 67, 392–398. [Google Scholar] [CrossRef]
- Won, J.; Jo, A.; Gil, C.H.; Kim, S.; Shin, H.; Kim, H.J. Inhaled delivery of recombinant interferon-lambda restores allergic inflammation after development of asthma by controlling Th2-and Th17-cell-mediated immune responses. Int. Immunopharmacol. 2022, 112, 109180. [Google Scholar] [CrossRef] [PubMed]
- Xiang, R.; Xu, Y.; Zhang, W.; Kong, Y.-G.; Tan, L.; Chen, S.-M.; Deng, Y.-Q.; Tao, Z.-Z. Semaphorin 3A inhibits allergic inflammation by regulating immune responses in a mouse model of allergic rhinitis. Int. Forum Allergy Rhinol. 2019, 9, 528–537. [Google Scholar] [CrossRef] [PubMed]
- Tu, L.; Chen, J.; Zhang, H.; Duan, L. Interleukin-4 Inhibits Regulatory T Cell Differentiation through Regulating CD103+Dendritic Cells. Front. Immunol. 2017, 8, 214. [Google Scholar] [CrossRef] [PubMed]
- Schmalzl, A.; Leupold, T.; Kreiss, L.; Waldner, M.; Schuermann, S.; Neurath, M.F.; Becker, C.; Wirtz, S. Interferon regulatory factor 1 (IRF-1) promotes intestinal group 3 innate lymphoid responses during Citrobacter rodentium infection. Nat. Commun. 2022, 13, 5730. [Google Scholar] [CrossRef]
- Xu, G.; Xia, J.H.; Zhou, H.; Yu, C.Z.; Zhang, Y.; Zuo, K.J.; Shi, J.B.; Li, H.B. Interleukin-6 is essential for Staphylococcal exotoxin B-induced T regulatory cell insufficiency in nasal polyps. Clin. Exp. Allergy 2009, 39, 829–837. [Google Scholar] [CrossRef]
- Wang, X.-T.; Liu, Z.-Q.; Zheng, P.-Y.; Yang, P.-C.; Luo, Y.; Lu, G.-F.; Zhang, L.-L. Interaction of TIM4-TIM1 decreases the function of CD4(+)CD25(+)Treg in intestine in food allergic mice. Life Sci. J.-Acta Zhengzhou Univ. Overseas Ed. 2011, 8, 93–99. [Google Scholar]
- Jin, D.; Sprent, J. GM-CSF Culture Revisited: Preparation of Bulk Populations of Highly Pure Dendritic Cells from Mouse Bone Marrow. J. Immunol. 2018, 201, 3129–3139. [Google Scholar] [CrossRef] [PubMed]


Disclaimer/Publisher’s Note: The statements, opinions and data contained in all publications are solely those of the individual author(s) and contributor(s) and not of MDPI and/or the editor(s). MDPI and/or the editor(s) disclaim responsibility for any injury to people or property resulting from any ideas, methods, instructions or products referred to in the content. |
© 2023 by the authors. Licensee MDPI, Basel, Switzerland. This article is an open access article distributed under the terms and conditions of the Creative Commons Attribution (CC BY) license (https://creativecommons.org/licenses/by/4.0/).
Share and Cite
Yuan, J.; Xu, X.; Wang, Z.; Tong, P.; Meng, X.; Wu, Y.; Li, X.; Gao, J.; Chen, H. A Higher Dose of Staphylococcus aureus Enterotoxin B Led to More Th1 and Lower Th2/Th1 Ratio in Th Cells. Toxins 2023, 15, 363. https://doi.org/10.3390/toxins15060363
Yuan J, Xu X, Wang Z, Tong P, Meng X, Wu Y, Li X, Gao J, Chen H. A Higher Dose of Staphylococcus aureus Enterotoxin B Led to More Th1 and Lower Th2/Th1 Ratio in Th Cells. Toxins. 2023; 15(6):363. https://doi.org/10.3390/toxins15060363
Chicago/Turabian StyleYuan, Jin, Xiaoqian Xu, Zhongliang Wang, Ping Tong, Xuanyi Meng, Yong Wu, Xin Li, Jinyan Gao, and Hongbing Chen. 2023. "A Higher Dose of Staphylococcus aureus Enterotoxin B Led to More Th1 and Lower Th2/Th1 Ratio in Th Cells" Toxins 15, no. 6: 363. https://doi.org/10.3390/toxins15060363
APA StyleYuan, J., Xu, X., Wang, Z., Tong, P., Meng, X., Wu, Y., Li, X., Gao, J., & Chen, H. (2023). A Higher Dose of Staphylococcus aureus Enterotoxin B Led to More Th1 and Lower Th2/Th1 Ratio in Th Cells. Toxins, 15(6), 363. https://doi.org/10.3390/toxins15060363