Co-Occurrence of Mycotoxins in Feed for Cattle, Pigs, Poultry, and Sheep in Navarra, a Region of Northern Spain


Abstract

1. Introduction
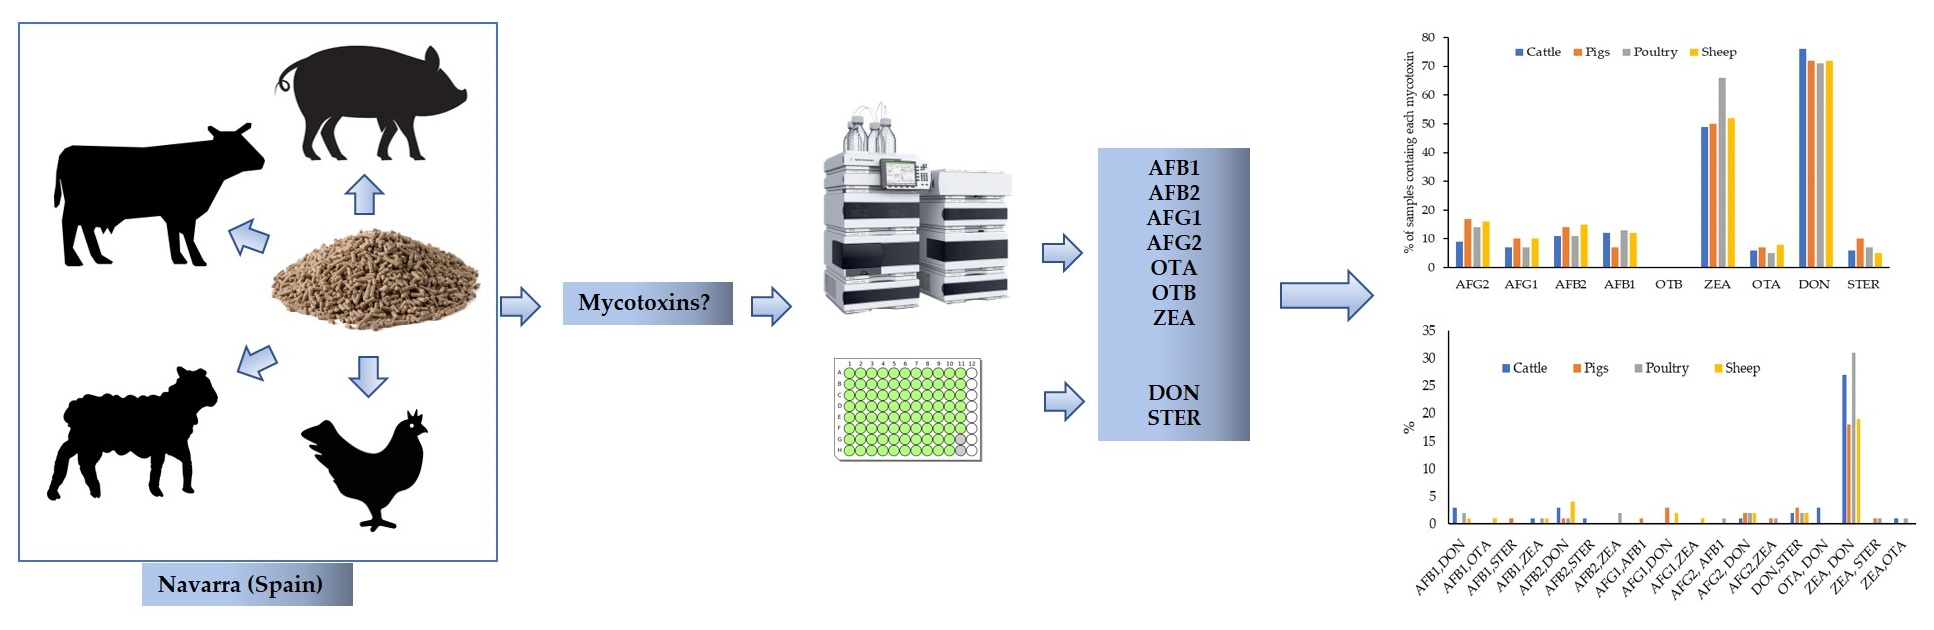
2. Results
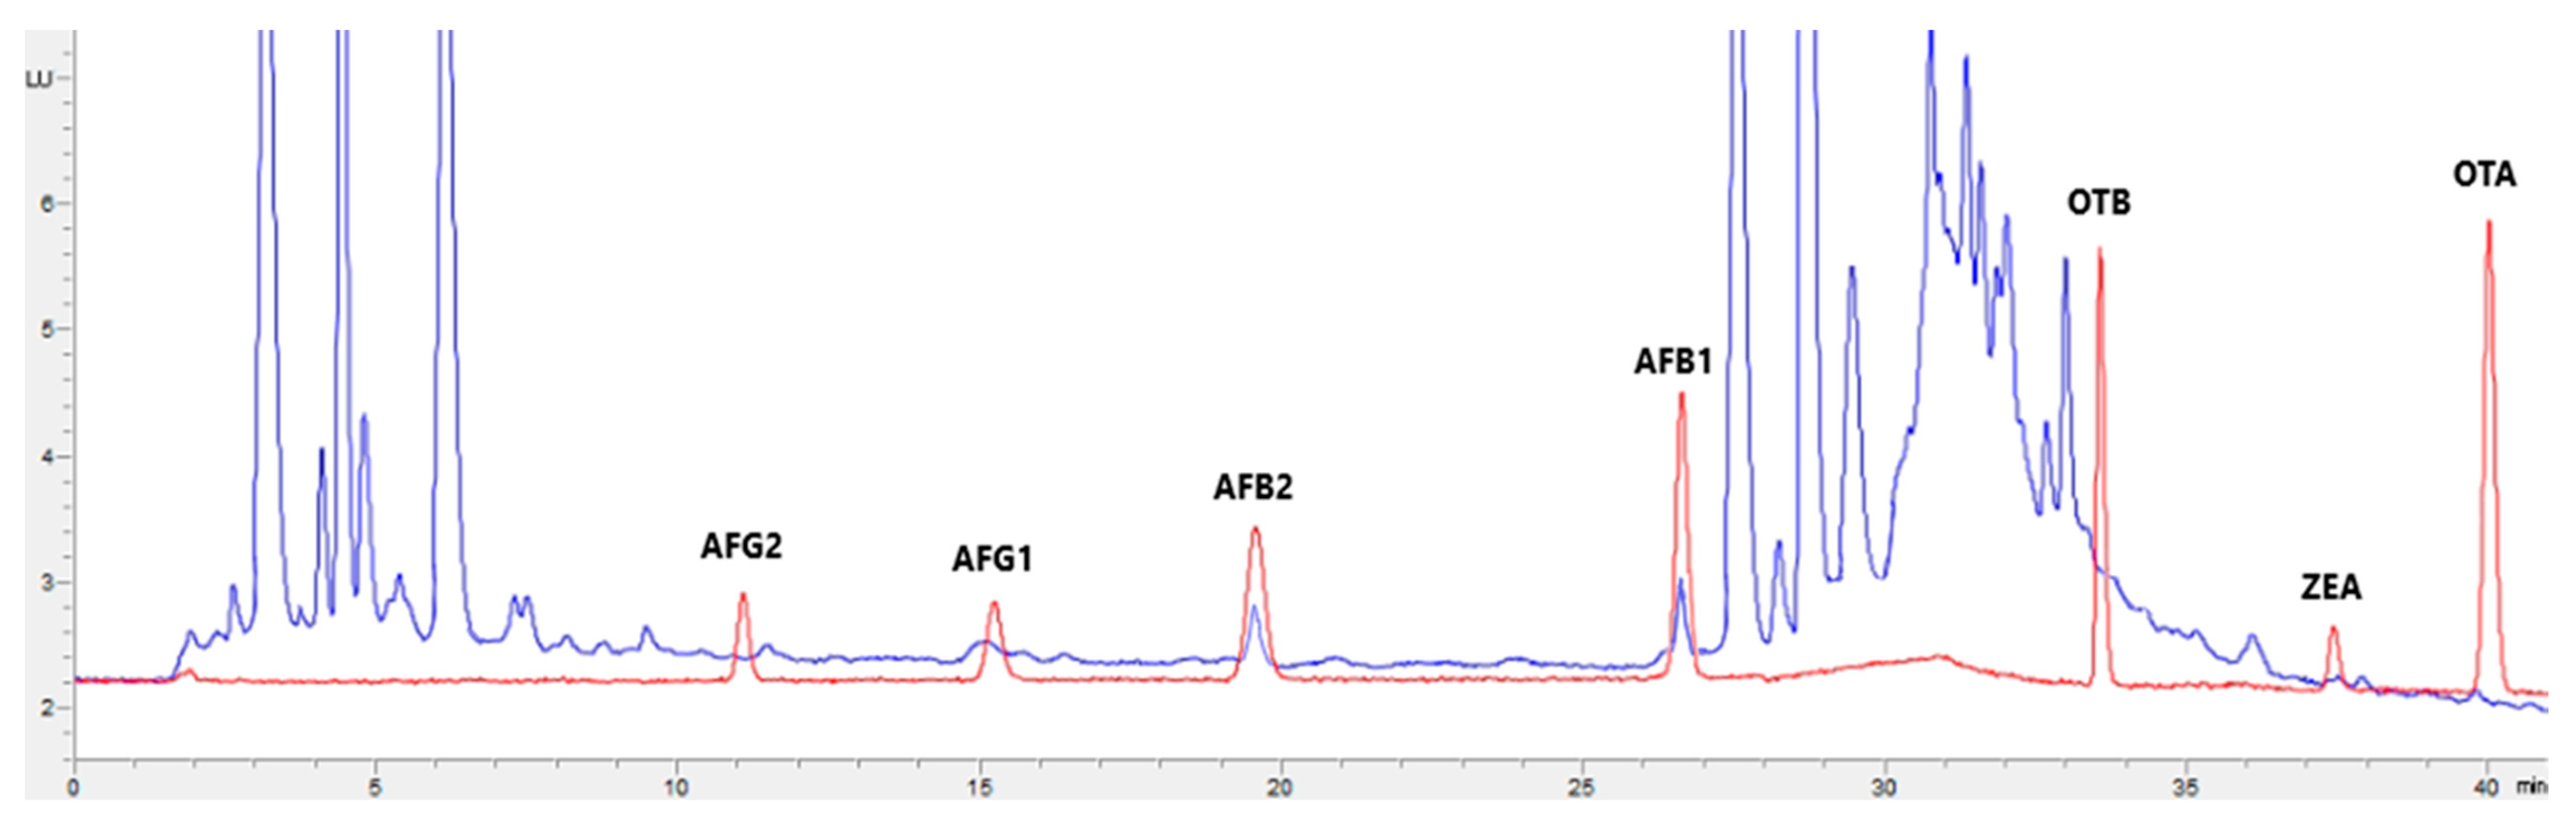
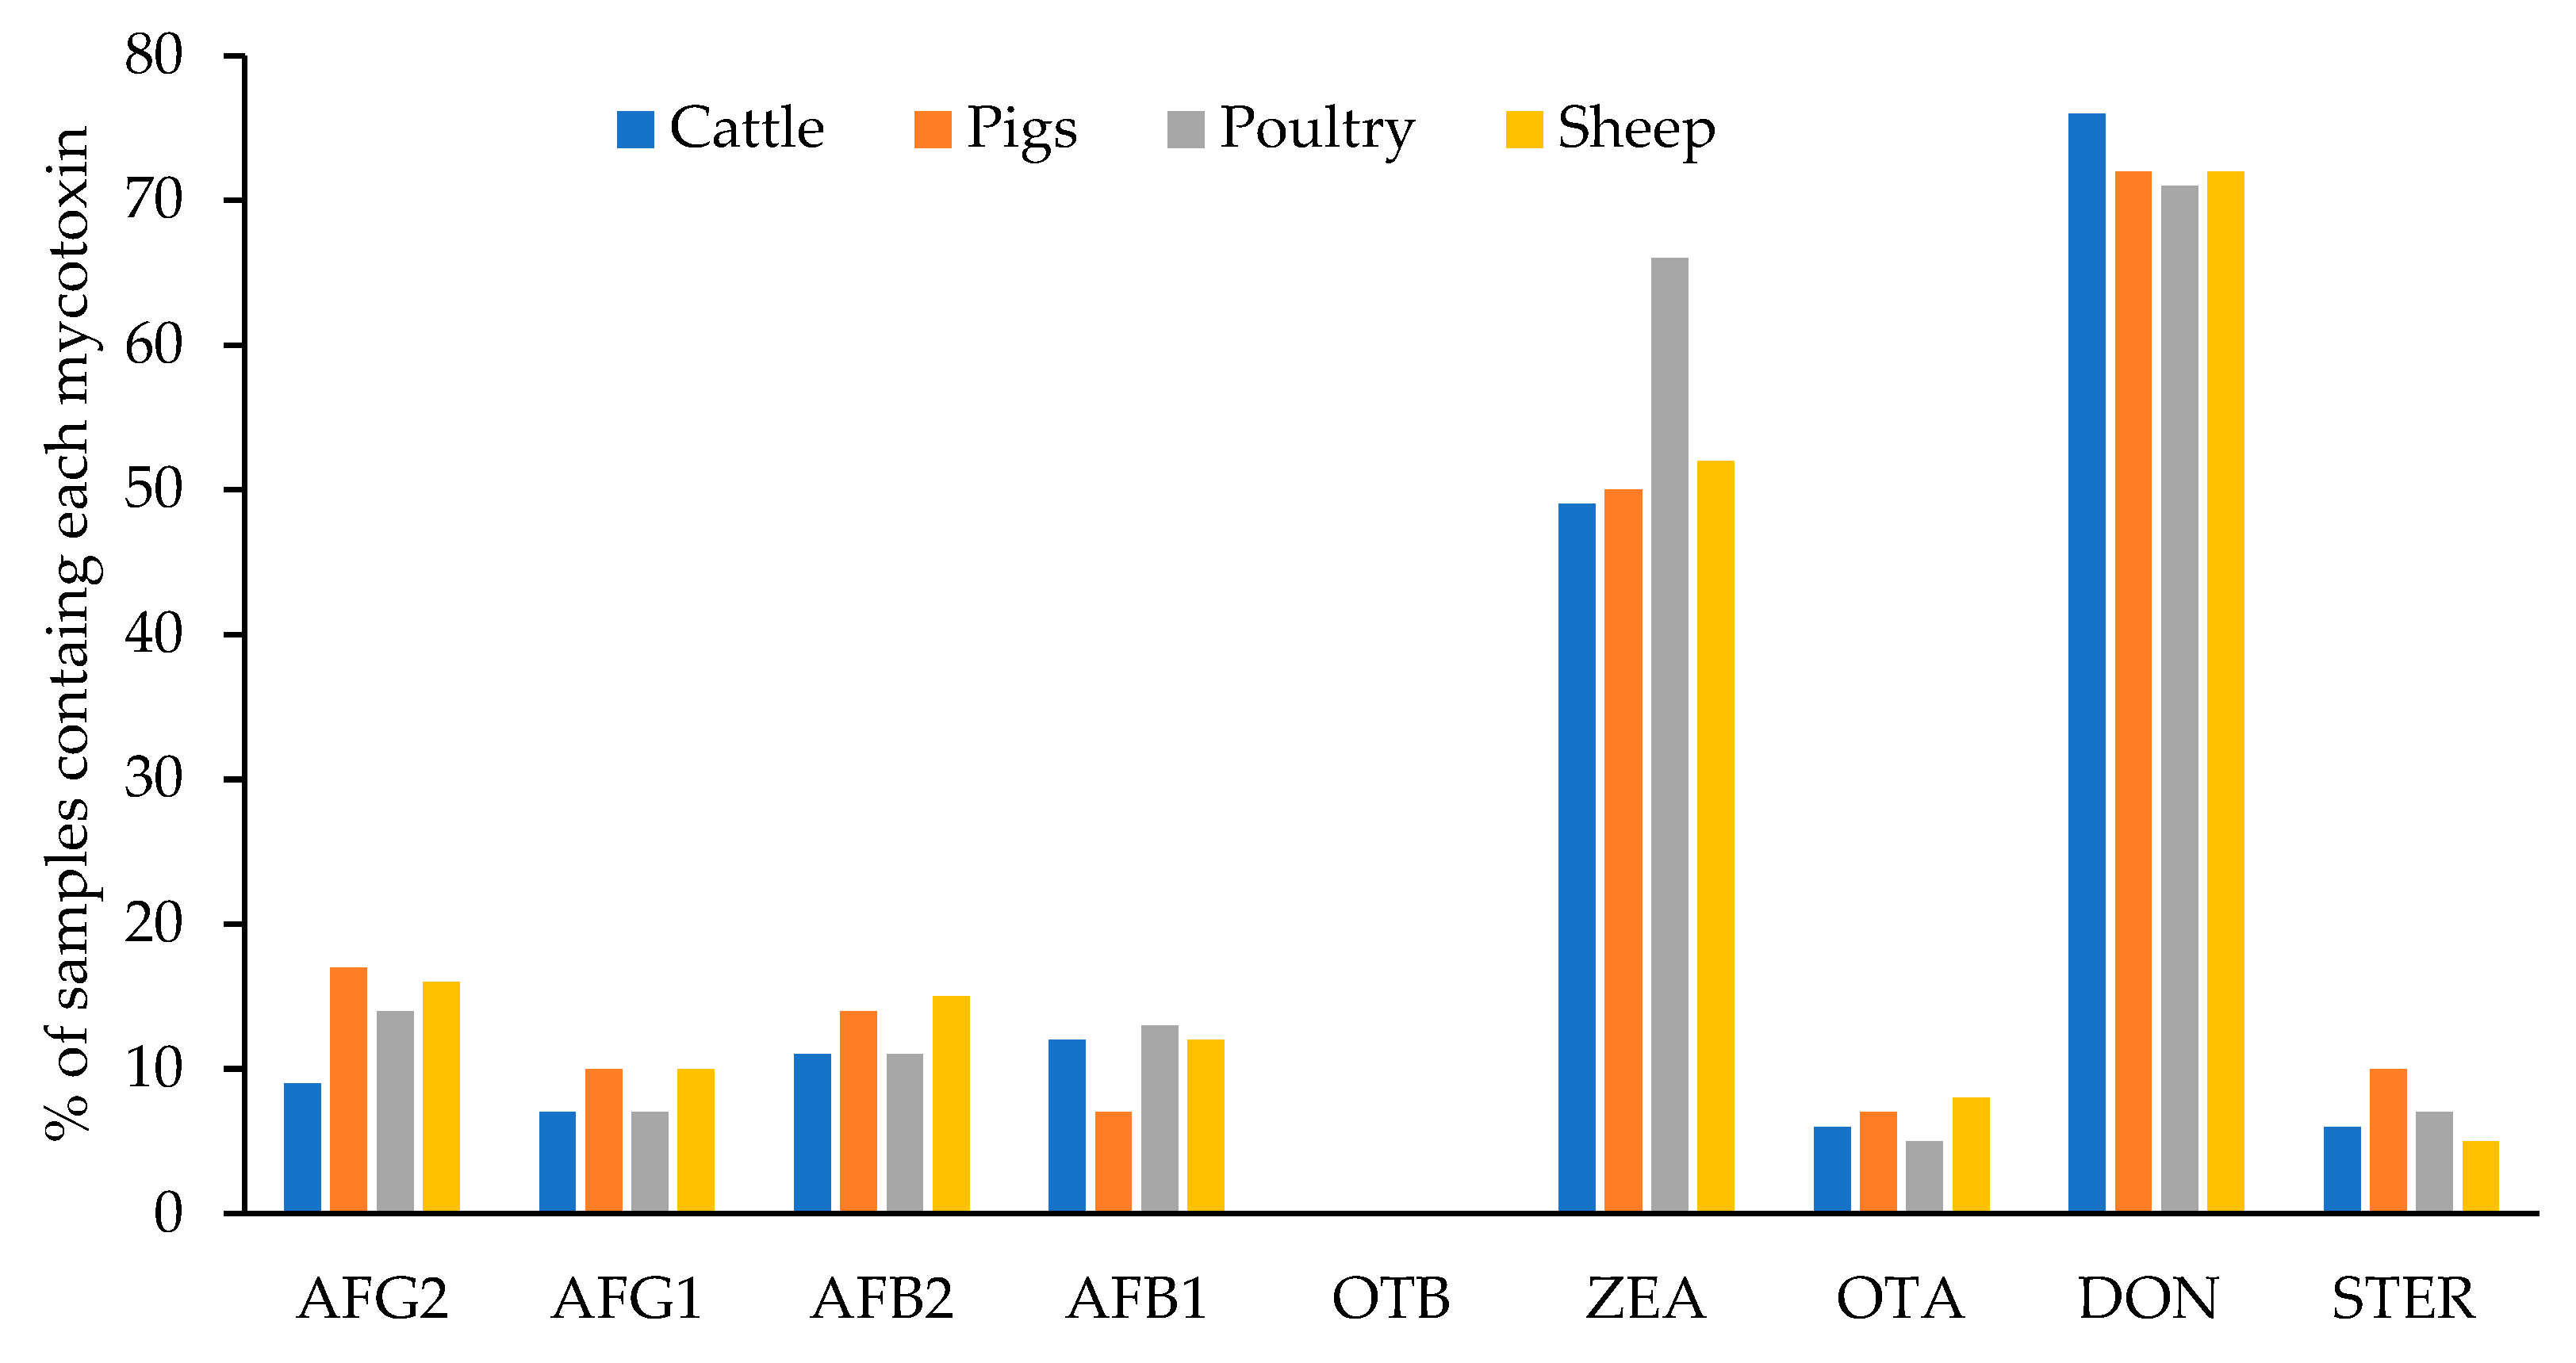
2.1. Presence of Mycotoxins
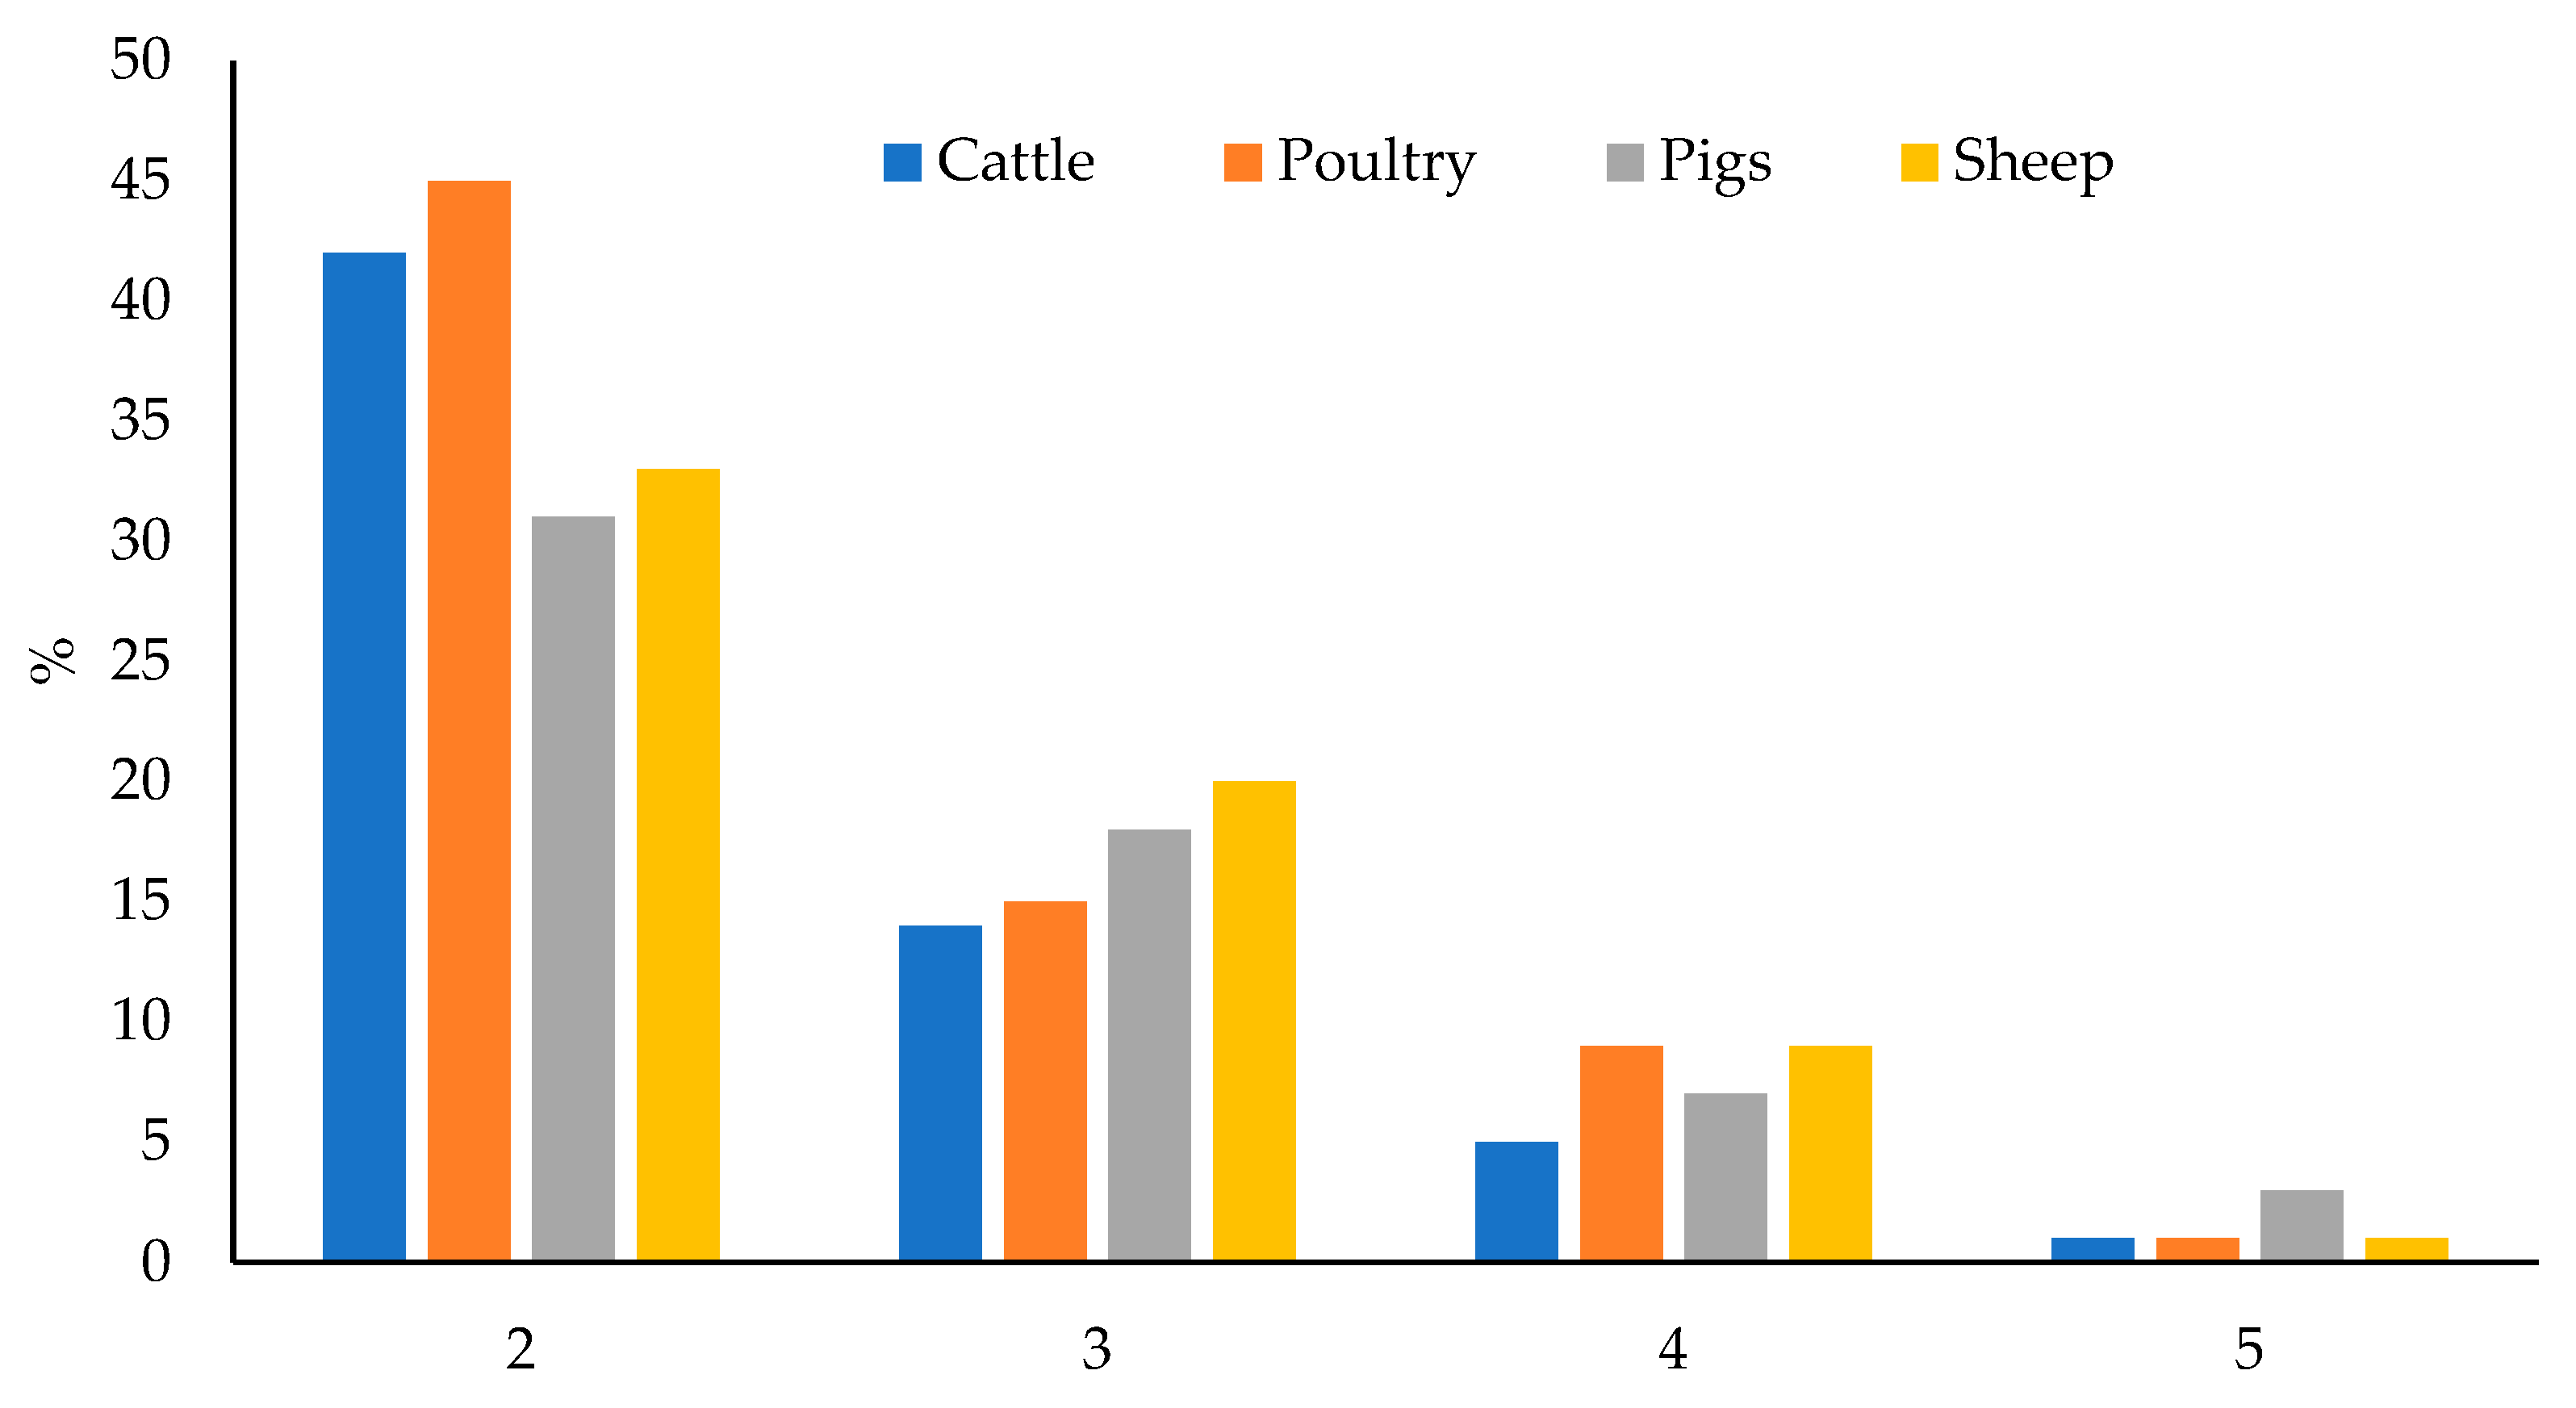
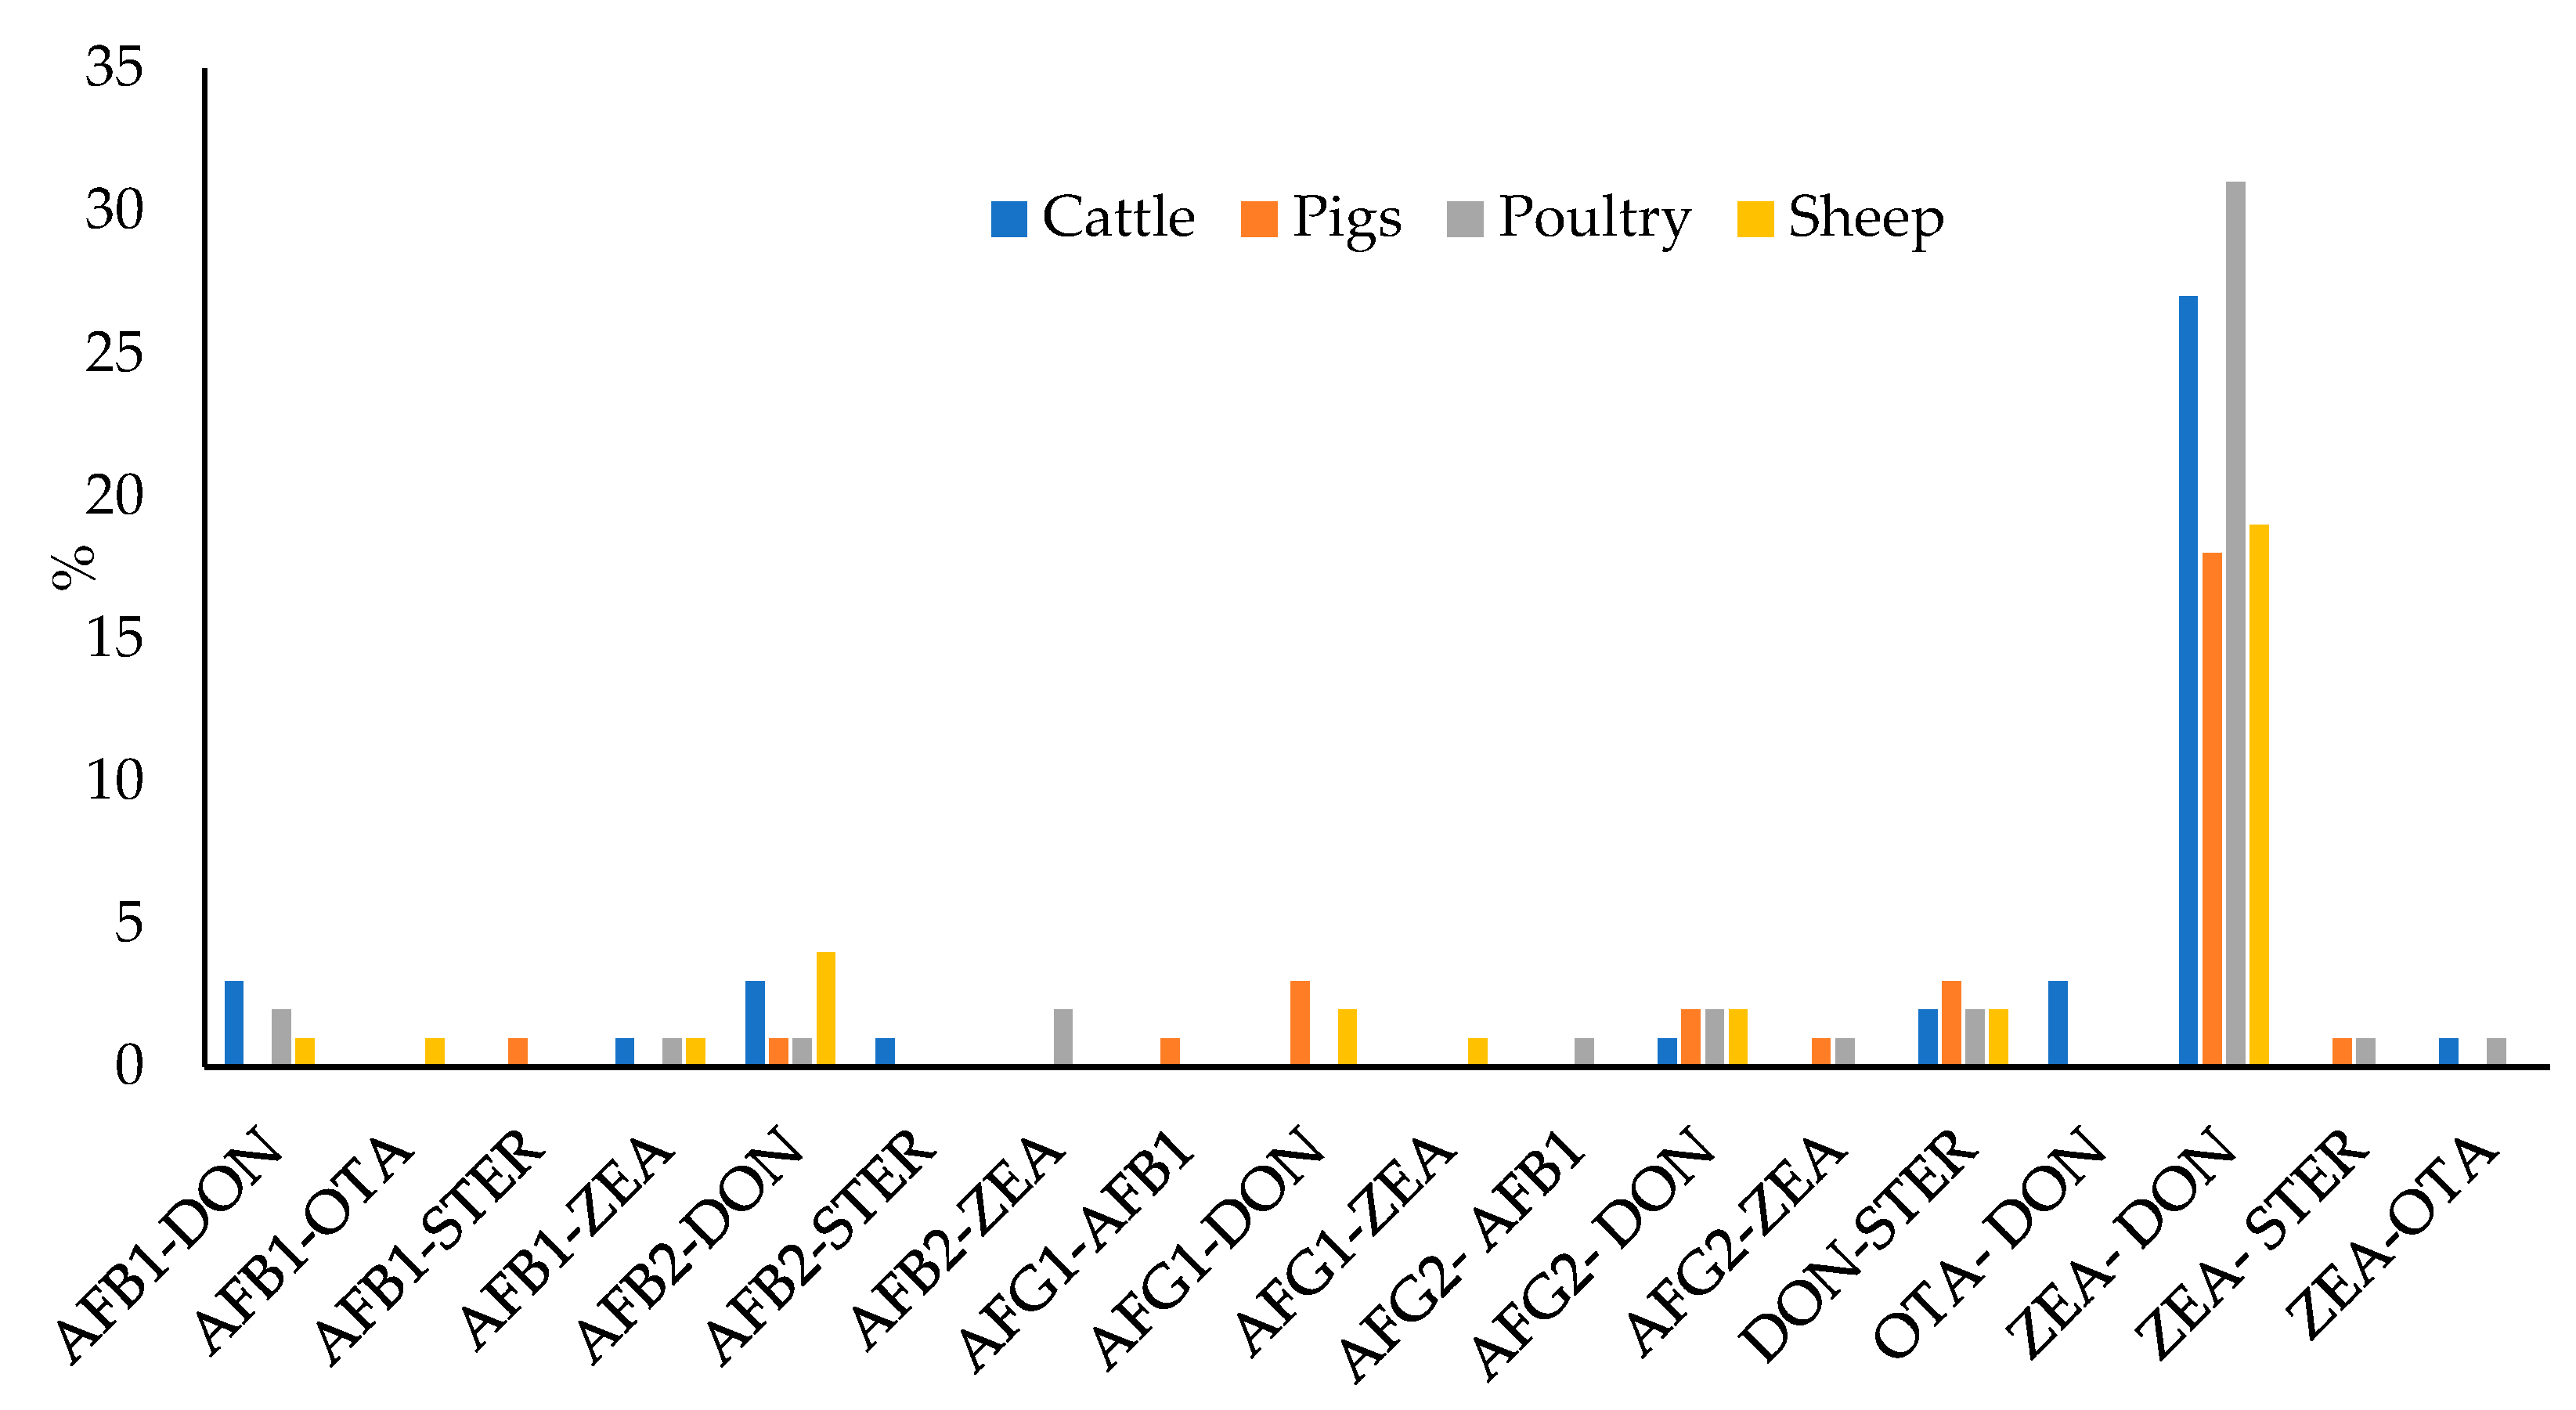
2.2. Co-Occurrence of Mycotoxins
3. Discussion
3.1. Aflatoxins
3.2. Ochratoxin A
3.3. Zearalenone
3.4. Deoxynivalenol
3.5. Sterigmatocystin
3.6. Co-Occurrence
4. Conclusions
5. Materials and Methods
5.1. Chemical and Reagents
5.2. Mycotoxin Standards
5.3. Safety Precautions
5.4. Animal Feed Samples
5.5. Mycotoxin Solutions and Calibrators Preparation
5.6. Sample Preparation
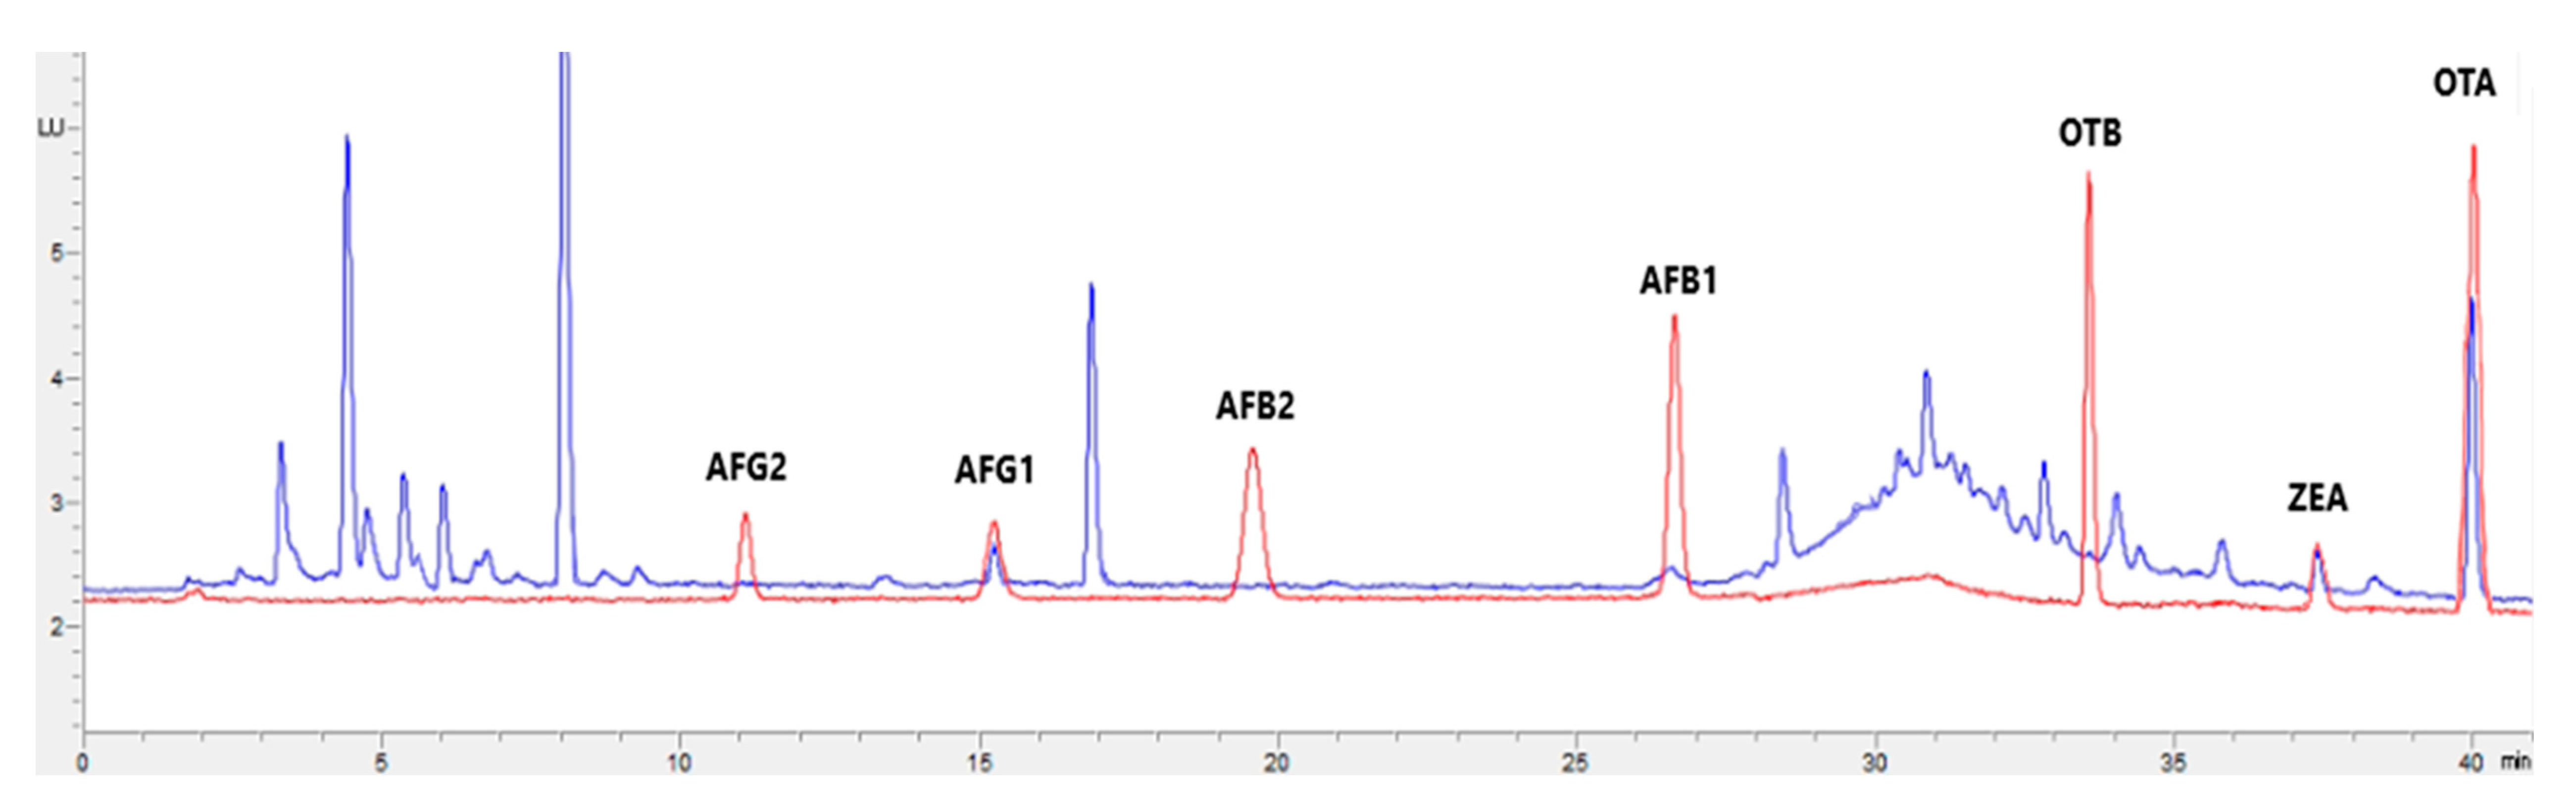
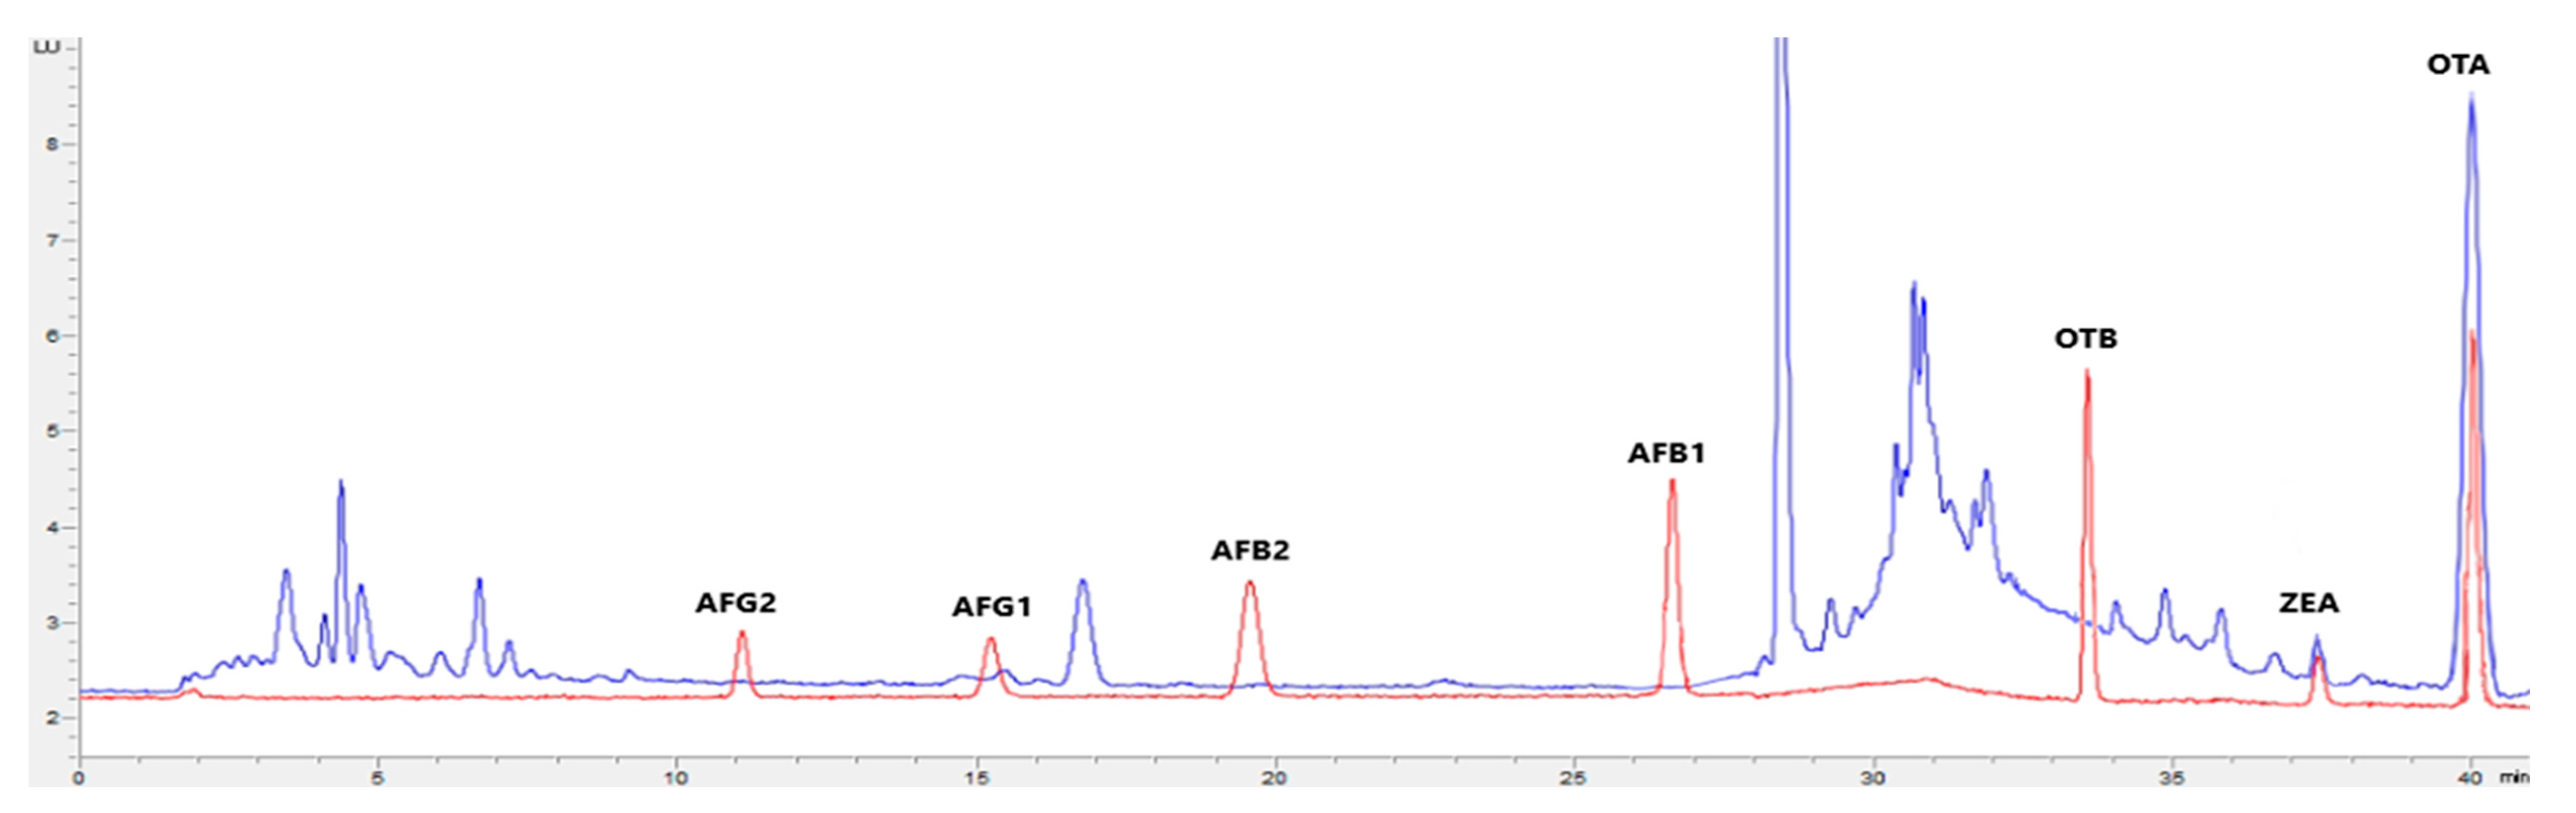
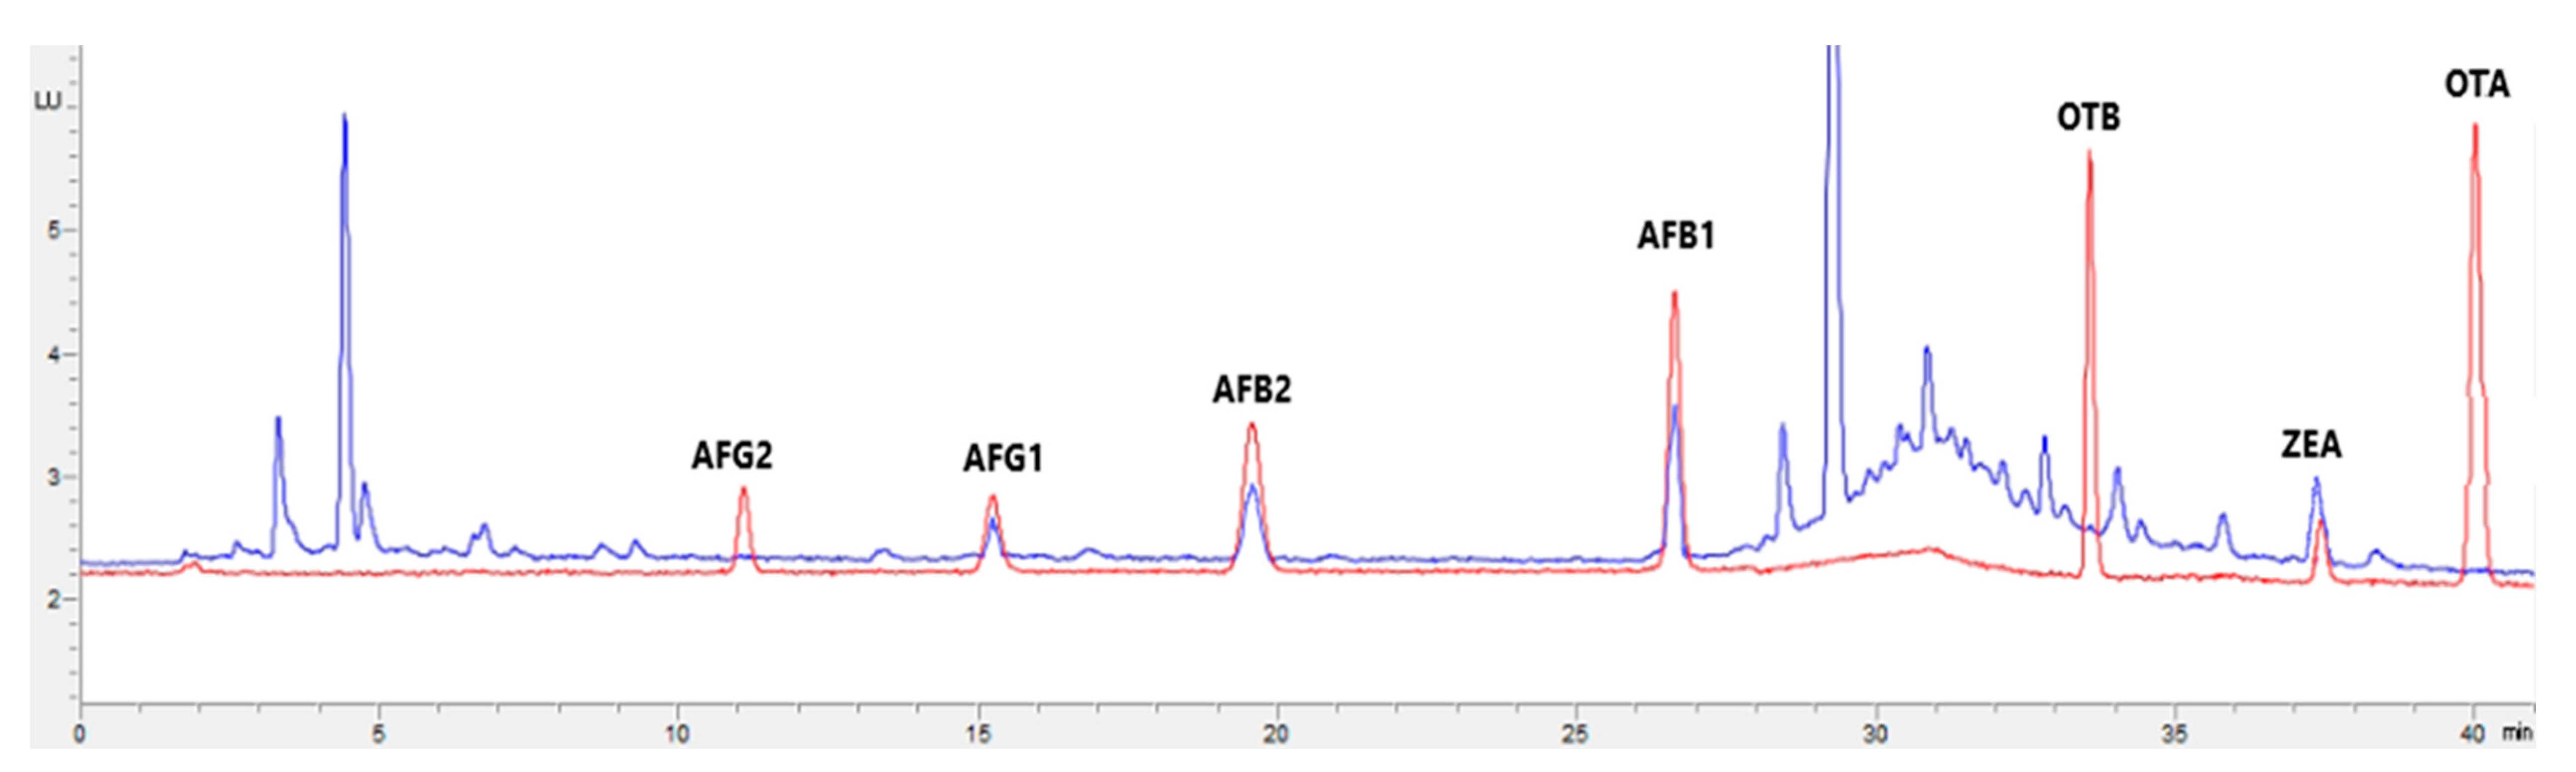
5.7. Mycotoxin Analytical Methods
5.8. Analysis of Samples
5.9. Treatment of Results
Supplementary Materials
Author Contributions
Funding
Institutional Review Board Statement
Informed Consent Statement
Data Availability Statement
Acknowledgments
Conflicts of Interest
Abbreviations
| ACN | Acetonitrile |
| AFB1 | Aflatoxin B1 |
| AFB2 | Aflatoxin B2 |
| AFG1 | Aflatoxin G1 |
| AFG2 | Aflatoxin G2 |
| AFs | Aflatoxins |
| ANOVA | Analysis of variance |
| DON | Deoxynivalenol |
| EFSA | European Food Safety Authority |
| ELISA | Enzyme-linked immunosorbent assay |
| EU | European Union |
| FB1 | Fumonisin B1 |
| FB2 | Fumonisin B2 |
| FLD | Fluorescence detector |
| FUMs | Fumonisins |
| IARC | International Agency of Research in Cancer |
| LC | Liquid chromatography |
| LOD | Limit of detection |
| LOQ | Limit of quantification |
| MeOH | Methanol |
| OTA | Ochratoxin A |
| OTB | Ochratoxin B |
| rpm | Revolutions per minute |
| RSD | Relative standard deviation |
| STER | Sterigmatocystin |
| UVE | Photochemical reactor for the derivatization of aflatoxins with UV light |
| ZEA | Zearalenone |
References
- Khodaei, D.; Javanmardi, F.; Khaneghah, A.M. The Global Overview of the Occurrence of Mycotoxins in Cereals: A Three-Year Survey. Curr. Opin. Food Sci. 2021, 39, 36–42. [Google Scholar] [CrossRef]
- Mousavi Khaneghah, A.; Fakhri, Y.; Raeisi, S.; Armoon, B.; Sant’Ana, A.S. Prevalence and Concentration of Ochratoxin A, Zearalenone, Deoxynivalenol and Total Aflatoxin in Cereal-Based Products: A Systematic Review and Meta-Analysis. Food Chem. Toxicol. 2018, 118, 830–848. [Google Scholar] [CrossRef]
- Peng, W.-X.; Marchal, J.L.M.; van der Poel, A.F.B. Strategies to Prevent and Reduce Mycotoxins for Compound Feed Manufacturing. Anim. Feed Sci. Technol. 2018, 237, 129–153. [Google Scholar] [CrossRef]
- Santos Pereira, C.; Cunha, C.S.; Fernandes, J.O. Prevalent Mycotoxins in Animal Feed: Occurrence and Analytical Methods. Toxins 2019, 11, 290. [Google Scholar] [CrossRef]
- Buszewska-Forajta, M. Mycotoxins, Invisible Danger of Feedstuff with Toxic Effect on Animals. Toxicon 2020, 182, 34–53. [Google Scholar] [CrossRef]
- Adegbeye, M.J.; Reddy, P.R.K.; Chilaka, C.A.; Balogun, O.B.; Elghandour, M.M.M.Y.; Rivas-Caceres, R.R.; Salem, A.Z.M. Mycotoxin Toxicity and Residue in Animal Products: Prevalence, Consumer Exposure and Reduction Strategies—A Review. Toxicon 2020, 177, 96–108. [Google Scholar] [CrossRef]
- Berthiller, F.; Crews, C.; Dall’Asta, C.; Saeger, S.D.; Haesaert, G.; Karlovsky, P.; Oswald, I.P.; Seefelder, W.; Speijers, G.; Stroka, J. Masked Mycotoxins: A Review. Mol. Nutr. Food Res. 2013, 57, 165–186. [Google Scholar] [CrossRef]
- Mattson, J. Mixtures in the Real World: The Importance of Plant Self-Defense Toxicants, Mycotoxins, and the Human Diet ☆. Toxicol. Appl. Pharmacol. 2007, 223, 125–132. [Google Scholar] [CrossRef] [PubMed]
- Tolosa, J.; Rodríguez-Carrasco, Y.; Ruiz, M.J.; Vila-Donat, P. Multi-Mycotoxin Occurrence in Feed, Metabolism and Carry-over to Animal-Derived Food Products: A Review. Food Chem. Toxicol. 2021, 158, 112661. [Google Scholar] [CrossRef]
- Pulina, G.; Battacone, G.; Brambilla, G.; Cheli, F.; Danieli, P.P.; Masoero, F.; Pietri, A.; Ronchi, B. An Update on the Safety of Foods of Animal Origin and Feeds. Ital. J. Anim. Sci. 2014, 13, 3571. [Google Scholar] [CrossRef]
- Pinotti, L.; Ottoboni, M.; Giromini, C.; Dell’Orto, V.; Cheli, F. Mycotoxin Contamination in the EU Feed Supply Chain: A Focus on Cereal Byproducts. Toxins 2016, 8, 45. [Google Scholar] [CrossRef] [PubMed]
- Mitchell, N.J.; Bowers, E.; Hurburgh, C.; Wu, F. Potential Economic Losses to the US Corn Industry from Aflatoxin Contamination. Food Addit. Contam. Part A 2016, 33, 540–550. [Google Scholar] [CrossRef]
- European Parliament and Council Regulation (EC) No 767/2009 of the European Parliament and of the Council of 13 July 2009 on the Placing on the Market and Use of Feed. Off. J. Eur. Union 2009, L 229, 1–28.
- Eskola, M.; Kos, G.; Elliott, C.T.; Hajšlová, J.; Mayar, S.; Krska, R. Worldwide Contamination of Food-Crops with Mycotoxins: Validity of the Widely Cited ‘FAO Estimate’ of 25%. Crit. Rev. Food Sci. Nutr. 2020, 60, 2773–2789. [Google Scholar] [CrossRef]
- Jouany, J.P. Methods for Preventing, Decontaminating and Minimizing the Toxicity of Mycotoxins in Feeds. Anim. Feed Sci. Technol. 2007, 137, 342–362. [Google Scholar] [CrossRef]
- Gruber-Dorninger, C.; Jenkins, T.; Schatzmayr, G. Global Mycotoxin Occurrence in Feed: A Ten-Year Survey. Toxins 2019, 11, 375. [Google Scholar] [CrossRef]
- Battilani, P.; Rossi, V.; Giorni, P.; Pietri, A.; Gualla, A.; van der Fels-Klerx, H.J.; Booij, C.J.H.; Moretti, A.; Logrieco, A.; Miglietta, F.; et al. Modelling, Predicting and Mapping the Emergence of Aflatoxins in Cereals in the EU Due to Climate Change. EFSA Support. Publ. 2012, 9, 223E. [Google Scholar] [CrossRef]
- Medina, Á.; González-Jartín, J.M.; Sainz, M.J. Impact of Global Warming on Mycotoxins. Curr. Opin. Food Sci. 2017, 18, 76–81. [Google Scholar] [CrossRef]
- Van der Fels-Klerx, H.J.; Liu, C.; Battilani, P. Modelling Climate Change Impacts on Mycotoxin Contamination. World Mycotoxin J. 2016, 9, 717–726. [Google Scholar] [CrossRef]
- Miraglia, M.; Marvin, H.J.P.; Kleter, G.A.; Battilani, P.; Brera, C.; Coni, E.; Cubadda, F.; Croci, L.; De Santis, B.; Dekkers, S.; et al. Climate Change and Food Safety: An Emerging Issue with Special Focus on Europe. Food Chem. Toxicol. 2009, 47, 1009–1021. [Google Scholar] [CrossRef]
- Smith, M.-C.; Madec, S.; Coton, E.; Hymery, N. Natural Co-Occurrence of Mycotoxins in Foods and Feeds and Their in Vitro Combined Toxicological Effects. Toxins 2016, 8, 94. [Google Scholar] [CrossRef]
- Bullerman, L.B.; Bianchini, A. Stability of Mycotoxins during Food Processing. Int. J. Food Microbiol. 2007, 119, 140–146. [Google Scholar] [CrossRef] [PubMed]
- Binder, E.M.; Tan, L.M.; Chin, L.J.; Handl, J.; Richard, J. Worldwide Occurrence of Mycotoxins in Commodities, Feeds and Feed Ingredients. Anim. Feed Sci. Technol. 2007, 137, 265–282. [Google Scholar] [CrossRef]
- Twarużek, M.; Skrzydlewski, P.; Kosicki, R.; Grajewski, J. Mycotoxins Survey in Feed Materials and Feedingstuffs in Years 2015–2020. Toxicon 2021, 202, 27–39. [Google Scholar] [CrossRef] [PubMed]
- Alshannaq, A.; Yu, J.-H. Occurrence, Toxicity, and Analysis of Major Mycotoxins in Food. Int. J. Environ. Res. Public Health 2017, 14, 632. [Google Scholar] [CrossRef]
- European Commission Commission Recommendation of 17 August 2006 on the Presence of Deoxynivalenol, Zearalenone, Ochratoxin A, T-2 and HT-2 and Fumonisins in Products Intended for Animal Feeding. Off. J. Eur. Union 2006, 49, 7–9.
- European Commission Directive 2002/32/EC of The European Parliament and of The Council of 7 May 2002 on Undesirable Substances in Animal Feed. Off. J. Eur. Union 2019, L289, 32–36.
- Gruber-Dorninger, C.; Novak, B.; Nagl, V.; Berthiller, F. Emerging Mycotoxins: Beyond Traditionally Determined Food Contaminants. J. Agric. Food Chem. 2017, 65, 7052–7070. [Google Scholar] [CrossRef]
- International Agency for Research on Cancer. IARC Overall Evaluations of Carcinogenicity: An Updating of IARC Monographs Volumes 1 to 42; International Agency for Research on Cancer: Lyon, France, 1987; Volume 46. [Google Scholar]
- Viegas, C.; Nurme, J.; Piecková, E.; Viegas, S. Sterigmatocystin in Foodstuffs and Feed: Aspects to Consider. Mycology 2020, 11, 91–104. [Google Scholar] [CrossRef] [PubMed]
- Arce-López, B.; Lizarraga, E.; Irigoyen, Á.; González-Peñas, E. Human Biomonitoring of 19 Mycotoxins in a Region of Northern Spain. Toxins 2020, 12, 750. [Google Scholar] [CrossRef] [PubMed]
- Romera, D.; Mateo, E.M.; Mateo-Castro, R.; Gómez, J.V.; Gimeno-Adelantado, J.V.; Jiménez, M. Determination of Multiple Mycotoxins in Feedstuffs by Combined Use of UPLC–MS/MS and UPLC–QTOF–MS. Food Chem. 2018, 267, 140–148. [Google Scholar] [CrossRef]
- Bervis, N.; Lorán, S.; Juan, T.; Carramiñana, J.J.; Herrera, A.; Ariño, A.; Herrera, M. Field Monitoring of Aflatoxins in Feed and Milk of High-Yielding Dairy Cows under Two Feeding Systems. Toxins 2021, 13, 201. [Google Scholar] [CrossRef]
- Arroyo-Manzanares, N.; Rodríguez-Estévez, V.; Arenas-Fernández, P.; García-Campaña, A.M.; Gámiz-Gracia, L. Occurrence of Mycotoxins in Swine Feeding from Spain. Toxins 2019, 11, 342. [Google Scholar] [CrossRef]
- Pestka, J.J. Deoxynivalenol: Toxicity, Mechanisms and Animal Health Risks. Anim. Feed Sci. Technol. 2007, 137, 283–298. [Google Scholar] [CrossRef]
- Díaz Nieto, C.H.; Granero, A.M.; Zon, M.A.; Fernández, H. Sterigmatocystin: A Mycotoxin to Be Seriously Considered. Food Chem. Toxicol. 2018, 118, 460–470. [Google Scholar] [CrossRef]
- Bernhoft, A.; Christensen, E.; Er, C.; Tukun, F.L.; Johannessen, G. The Surveillance Programme for Feed Materials, Complete and Complementary Feed in Norway 2019—Mycotoxins, Fungi; Norwegian Veterinary Institute: Oslo, Norway, 2020. [Google Scholar]
- Gruber-Dorninger, C.; Jenkins, T.; Schatzmayr, G. Multi-Mycotoxin Screening of Feed and Feed Raw Materials from Africa. World Mycotoxin J. 2018, 11, 369–383. [Google Scholar] [CrossRef]
- Changwa, R.; Abia, W.; Msagati, T.; Nyoni, H.; Ndleve, K.; Njobeh, P. Multi-Mycotoxin Occurrence in Dairy Cattle Feeds from the Gauteng Province of South Africa: A Pilot Study Using UHPLC-QTOF-MS/MS. Toxins 2018, 10, 294. [Google Scholar] [CrossRef] [PubMed]
- Khoshal, A.K.; Novak, B.; Martin, P.G.P.; Jenkins, T.; Neves, M.; Schatzmayr, G.; Oswald, I.P.; Pinton, P. Co-Occurrence of DON and Emerging Mycotoxins in Worldwide Finished Pig Feed and Their Combined Toxicity in Intestinal Cells. Toxins 2019, 11, 727. [Google Scholar] [CrossRef] [PubMed]
- Ma, R.; Zhang, L.; Liu, M.; Su, Y.-T.; Xie, W.-M.; Zhang, N.-Y.; Dai, J.-F.; Wang, Y.; Rajput, S.; Qi, D.-S.; et al. Individual and Combined Occurrence of Mycotoxins in Feed Ingredients and Complete Feeds in China. Toxins 2018, 10, 113. [Google Scholar] [CrossRef]
- Tolosa, J.; Rodríguez-Carrasco, Y.; Ferrer, E.; Mañes, J. Identification and Quantification of Enniatins and Beauvericin in Animal Feeds and Their Ingredients by LC-QTRAP/MS/MS. Metabolites 2019, 9, 33. [Google Scholar] [CrossRef] [PubMed]
- Vicente, A.M.; Donézar, M. Mapa de Cultivos y Aprovechamientos de Navarra; Departamento de Agricultura, Ganadería y Alimentación del Gobierno de Navarra: San Juan, Puerto Rico, 2005; Available online: https://www.navarra.es/mapacultivos/MemoriaMCAcompleta.pdf (accessed on 21 February 2023).
- Li, X.; Ma, W.; Ma, Z.; Zhang, Q.; Li, H. The Occurrence and Contamination Level of Ochratoxin A in Plant and Animal-Derived Food Commodities. Molecules 2021, 26, 6928. [Google Scholar] [CrossRef] [PubMed]
- Muñoz-Solano, B.; González-Peñas, E. Mycotoxin Determination in Animal Feed: An LC-FLD Method for Simultaneous Quantification of Aflatoxins, Ochratoxins and Zearelanone in This Matrix. Toxins 2020, 12, 374. [Google Scholar] [CrossRef] [PubMed]
- European Commission. Commission Recommendation 401/2006 of 23 February 2006 laying down the methods of sampling and analysis for the official control of the levels of mycotoxins in foodstuffs. Off. J. Eur. Union 2006, 70, 12–34. [Google Scholar]
- European Commission. Guidance Document on Identification of Mycotoxins in Food and Feed. SANTE/12089/2016. Available online: https://food.ec.europa.eu/system/files/2017-05/cs_contaminants_sampling_guid-doc-ident-mycotoxins.pdf (accessed on 12 February 2023).
- European Commission. Commission decision of 12 August 2002 implementing Council Directive 96/23/EC concerning the performance of analytical methods and the interpretation of results (2002/657/EC). Off. J. Eur. Communities 2002, 221, 8–36. [Google Scholar]


| Parameter | AFG2 | AFG1 | AFB2 | AFB1 | OTB | ZEA | OTA | DON | STER |
|---|---|---|---|---|---|---|---|---|---|
| % Positive (>LOD) | 9.0 | 7.0 | 11.0 | 12.0 | 0 | 49.0 | 6.0 | 76.0 | 6.0 |
| Mean positive samples (µg/kg) | 1.7 | 2.9 * | 1.5 | 3.4 | <LOD * | 133.4 | 6.3 | 177.8 | 3.3 |
| Mean (µg/kg) | <LOD | <LOD | <LOD | <LOD | <LOD | 65.4 | <LOD | 135.1 | <LOQ * |
| Median (µg/kg) | <LOD | <LOD | <LOD | <LOD | <LOD | <LOD | <LOD | 79.3 | <LOQ |
| 1st Quartile (µg/kg) | <LOD | <LOD | <LOD | <LOD | <LOD | <LOD | <LOD | 123.0 | <LOQ |
| 3rd Quartile (µg/kg) | <LOD | <LOD | <LOD | <LOD | <LOD | 98.7 | <LOD | 189.0 | <LOQ |
| Maximum (µg/kg) | 3.3 | 3.4 | 3.2 | 5.4 | <LOD | 413.0 | 7.7 | 574.0 | 4.7 |
| Parameter | AFG2 | AFG1 | AFB2 | AFB1 | OTB | ZEA | OTA | DON | STER |
|---|---|---|---|---|---|---|---|---|---|
| % Positive (>LOD) | 17.0 | 10.0 | 14.0 | 7.0 | 0 | 50.0 | 7.0 | 72.0 | 10.0 |
| Mean positive samples (µg/kg) | 1.9 | 4.1 | 2.1 | 5.3 | <LOD | 162.3 | 22.9 | 157.5 | 3.6 |
| Mean (µg/kg) | <LOD * | <LOD | <LOD | <LOD | <LOD | 81.2 * | <LOD | 113.4 | <LOQ * |
| Median (µg/kg) | <LOD | <LOD | <LOD | <LOD | <LOD | <LOD | <LOD | <LOQ | <LOQ |
| 1st Quartile (µg/kg) | <LOD | <LOD | <LOD | <LOD | <LOD | 27.0 | <LOD | 101.0 | <LOQ |
| 3rd Quartile (µg/kg) | <LOD | <LOD | <LOD | <LOD | <LOD | 88.4 | <LOD | 162.8 | <LOQ |
| Maximum (µg/kg) | 4.4 | 6.0 | 3.9 | 6.2 | <LOD | 816.0 | 65.5 | 410.0 | 6.1 |
| Parameter | AFG2 | AFG1 | AFB2 | AFB1 | OTB | ZEA | OTA | DON | STER |
|---|---|---|---|---|---|---|---|---|---|
| % Positive (>LOD) | 14.0 | 7.0 | 11.0 | 13.0 | 0 | 66.0 | 5.0 | 71.0 | 7.0 |
| Mean positive samples (µg/kg) | 2.0 | 4.3 | 1.7 | 5.0 | <LOD * | 150.0 | 18.1 | 255.3 | 3.4 |
| Mean (µg/kg) | <LOD | <LOD | <LOD | <LOD | <LOD | 99.0 | <LOD | 176.0 | <LOQ * |
| Median (µg/kg) | <LOD | <LOD | <LOD | <LOD | <LOD | 70.5 * | <LOD | 178.0 | <LOQ |
| 1st Quartile (µg/kg) | <LOD | <LOD | <LOD | <LOD | <LOD | <LOD | <LOD | <LOQ | <LOQ |
| 3rd Quartile (µg/kg) | <LOD | <LOD | <LOD | <LOD | <LOD | 144.5 | <LOD | 259.8 | <LOQ |
| Maximum (µg/kg) | 3.9 | 5.6 | 3.1 | 6.9 | <LOD | 489.0 | 23.2 | 755.0 | 5.1 |
| Parameter | AFG2 | AFG1 | AFB2 | AFB1 | OTB | ZEA | OTA | DON | STER |
|---|---|---|---|---|---|---|---|---|---|
| % Positive (>LOD) | 16.0 | 10.0 | 15.0 | 12.0 | 0 | 52.0 | 8.0 | 72.0 | 5.0 |
| Mean positive samples (µg/kg) | 1.9 | 4.3 | 2.0 | 4.4 | <LOD * | 201.3 | 21.3 | 238.3 | 3.7 |
| Mean (µg/kg) | <LOD | <LOD | <LOD | <LOD | <LOD | 104.7 | <LOD | 171.5 | <LOQ * |
| Median (µg/kg) | <LOD | <LOD | <LOD | <LOD | <LOD | 55.5 * | <LOD | 130.0 | <LOQ |
| 1st Quartile (µg/kg) | <LOD | <LOD | <LOD | <LOD | <LOD | <LOD | <LOD | <LOQ | <LOQ |
| 3rd Quartile (µg/kg) | <LOD | <LOD | <LOD | <LOD | <LOD | 158.3 | <LOD | 287.8 | <LOQ |
| Maximum (µg/kg) | 4.0 | 6.5 | 4.9 | 6.1 | <LOD | 658.0 | 45.3 | 887.0 | 5.6 |
| Mycotoxin | Total Samples | Positives | Percentage of Positives | Max. Value Found µg/kg | Samples Collection | Year of Publication | Reference |
|---|---|---|---|---|---|---|---|
| AFB1 | 100 | 12 | 12 | 5.4 | 2019–2020 | - | This study |
| 6 | 2 | 33.3 | <2 | 2012–2014 | 2018 | [32] | |
| 22 | 19 | 86 | 5.2 | 2015–2016 | 2021 | [33] | |
| Total | 128 | 33 | 25.8 | 5.4 | 2012–2020 | ||
| AFB2 | 100 | 11 | 11 | 3.2 | 2019–2020 | - | This study |
| 6 | 0 | 0 | <4 | 2012–2014 | 2018 | [32] | |
| Total | 106 | 11 | 10.4 | 3.2 | 2012–2020 | ||
| AFG1 | 100 | 7 | 7 | 3.4 | 2019–2020 | - | This study |
| 6 | 0 | 0 | <4 | 2012–2014 | 2018 | [32] | |
| Total | 106 | 7 | 6.6 | 3.4 | 2012–2020 | ||
| AFG2 | 100 | 9 | 9 | 3.3 | 2019–2020 | - | This study |
| 6 | 0 | 0 | <4 | 2012–2014 | 2018 | [32] | |
| Total | 106 | 9 | 8.5 | 3.3 | 2012–2020 | ||
| DON | 100 | 76 | 76 | 574 | 2019–2020 | - | This study |
| 6 | 1 | 16.7 | 289.9 | 2012–2014 | 2018 | [32] | |
| Total | 106 | 77 | 72.6 | 574 | 2012–2020 | ||
| OTA | 100 | 6 | 6 | 7.7 | 2019–2020 | - | This study |
| 6 | 2 | 33.3 | <25 | 2012–2014 | 2018 | [32] | |
| Total | 106 | 8 | 7.5 | 7.7 | 2012–2020 | ||
| STER | 100 | 6 | 6 | 4.7 | 2019–2020 | - | This study |
| Total | 100 | 6 | 6 | 4.7 | 2019–2020 | ||
| ZEA | 100 | 49 | 49 | 413 | 2019–2020 | - | This study |
| 6 | 1 | 16.7 | 88.2 | 2012–2014 | 2018 | [32] | |
| Total | 106 | 50 | 47.2 | 413.0 | 2012–2020 |
| Mycotoxin | Total Samples | Positives | Percentage of Positives | Max. Value Found µg/kg | Samples Collection | Year of Publication | Reference |
|---|---|---|---|---|---|---|---|
| AFB1 | 100 | 7 | 7 | 6.2 | 2019–2020 | - | This study |
| 226 | 7 | 3.1 | 2.9 | 2017 | 2019 | [34] | |
| 20 | 3 | 15 | <2 | 2012–2014 | 2018 | [32] | |
| Total | 346 | 17 | 4.9 | 6.2 | 2012–2020 | ||
| AFB2 | 100 | 14 | 14 | 3.9 | 2019–2020 | - | This study |
| 20 | 0 | 0 | <4 | 2012–2014 | 2018 | [32] | |
| 226 | 3 | 1.3 | 1.1 | 2017 | 2019 | [34] | |
| Total | 346 | 17 | 4.9 | 6.2 | 2012–2020 | ||
| AFG1 | 100 | 10 | 10 | 6 | 2019–2020 | - | This study |
| 226 | 2 | 0.9 | 0.4 | 2017 | 2019 | [34] | |
| 20 | 0 | 0 | <4 | 2012–2014 | 2018 | [32] | |
| Total | 346 | 12 | 3.5 | 6 | 2012–2020 | ||
| AFG2 | 100 | 17 | 17 | 4.4 | 2019–2020 | - | This study |
| 226 | 0 | 0 | 2017 | 2019 | [34] | ||
| 20 | 0 | 0 | <4 | 2012–2014 | 2018 | [32] | |
| Total | 346 | 17 | 4.9 | 4.4 | 2012–2020 | ||
| DON | 100 | 72 | 72 | 410 | 2019–2020 | - | This study |
| 226 | 10 | 4.4 | 555 | 2017 | 2019 | [34] | |
| 20 | 1 | 5 | 254.9 | 2012–2014 | 2018 | [32] | |
| Total | 346 | 83 | 23.9 | 4.4 | 2012–2020 | ||
| OTA | 100 | 7 | 7 | 65.5 | 2019–2020 | - | This study |
| 226 | 0 | 0 | 2017 | 2019 | [34] | ||
| 20 | 8 | 40 | <25 | 2012–2014 | 2018 | [32] | |
| Total | 346 | 15 | 4.3 | 65.5 | 2012–2020 | ||
| STER | 100 | 10 | 10 | 6.1 | 2019–2020 | - | This study |
| 226 | 5 | 2.2 | 308 | 2017 | 2019 | [34] | |
| Total | 326 | 15 | 4.6 | 308 | 2012–2020 | ||
| ZEA | 100 | 50 | 50 | 816 | 2019–2020 | - | This study |
| 226 | 16 | 7.0 | 956 | 2017 | 2019 | [34] | |
| 20 | 2 | 10 | <50 | 2012–2014 | 2018 | [32] | |
| Total | 346 | 68 | 19.6 | 956 | 2012–2020 |
| Mycotoxin | Total Samples | Positives | Percentage of Positives | Max. Value Found µg/kg | Samples Collection | Year of Publication | Reference |
|---|---|---|---|---|---|---|---|
| AFB1 | 100 | 13 | 13 | 6.9 | 2019–2020 | - | This study |
| 9 | 1 | 11 | <2 | 2012–2014 | 2018 | [32] | |
| Total | 109 | 14 | 12.8 | 6.9 | 2012–2020 | ||
| AFB2 | 100 | 11 | 11 | 3.1 | 2019–2020 | - | This study |
| 9 | 0 | 0 | <4 | 2012–2014 | 2018 | [32] | |
| Total | 109 | 11 | 10.1 | 3.1 | 2012–2020 | ||
| AFG1 | 100 | 7 | 7 | 5.6 | 2019–2020 | - | This study |
| 9 | 0 | 0 | <4 | 2012–2014 | 2018 | [32] | |
| Total | 109 | 7 | 6.4 | 5.6 | 2012–2020 | ||
| AFG2 | 100 | 14 | 14 | 3.9 | 2019–2020 | - | This study |
| 9 | 0 | 0 | <4 | 2012–2014 | 2018 | [32] | |
| Total | 109 | 14 | 12.8 | 3.9 | 2012–2020 | ||
| DON | 100 | 71 | 71 | 755 | 2019–2020 | - | This study |
| 9 | 1 | 11.1 | <250 | 2012–2014 | 2018 | [32] | |
| Total | 109 | 72 | 66.1 | 755 | 2012–2020 | ||
| OTA | 100 | 5 | 5 | 23.2 | 2019–2020 | - | This study |
| 9 | 1 | 11.1 | <25 | 2012–2014 | 2018 | [32] | |
| Total | 109 | 6 | 5.5 | 23.2 | 2012–2020 | ||
| STER | 100 | 7 | 7 | 5.1 | 2019–2020 | - | This study |
| Total | 100 | 7 | 7.0 | 5.1 | 2019–2020 | ||
| ZEA | 100 | 66 | 66 | 489 | 2019–2020 | - | This study |
| 9 | 1 | 11.1 | <50 | 2012–2014 | 2018 | [32] | |
| Total | 109 | 67 | 61.5 | 489 | 2012–2020 |
| Mycotoxin | Total Samples | Positives | Percentage of Positives | Max. Value Found µg/kg | Samples Collection | Year of Publication | Reference |
|---|---|---|---|---|---|---|---|
| AFB1 | 100 | 12 | 12 | 6.1 | 2019–2020 | - | This study |
| 17 | 1 | 5.9 | <2 | 2012–2014 | 2018 | [32] | |
| Total | 117 | 13 | 11.1 | 6.1 | 2012–2020 | ||
| AFB2 | 100 | 15 | 15 | 4.9 | 2019–2020 | - | This study |
| 17 | 0 | 0 | <4 | 2012–2014 | 2018 | [32] | |
| Total | 117 | 15 | 12.8 | 4.9 | 2012–2020 | ||
| AFG1 | 100 | 10 | 10 | 6.5 | 2019–2020 | - | This study |
| 17 | 0 | 0 | <4 | 2012–2014 | 2018 | [32] | |
| Total | 117 | 10 | 8.5 | 6.5 | 2012–2020 | ||
| AFG2 | 100 | 16 | 16 | 4 | 2019–2020 | - | This study |
| 17 | 0 | 0 | <4 | 2012–2014 | 2018 | [32] | |
| Total | 117 | 16 | 13.7 | 4 | 2012–2020 | ||
| DON | 100 | 72 | 72 | 887 | 2019–2020 | - | This study |
| 17 | 2 | 11.8 | <250 | 2012–2014 | 2018 | [32] | |
| Total | 117 | 74 | 63.2 | 887 | 2012–2020 | ||
| OTA | 100 | 8 | 8 | 45.3 | 2019–2020 | - | This study |
| 17 | 5 | 29.4 | <25 | 2012–2014 | 2018 | [32] | |
| Total | 117 | 13 | 11.1 | 45.3 | 2012–2020 | ||
| STER | 100 | 5 | 5 | 5.6 | 2019–2020 | - | This study |
| Total | 100 | 5 | 5 | 5.6 | 2012–2020 | ||
| ZEA | 100 | 52 | 52 | 658 | 2019–2020 | - | This study |
| 17 | 3 | 17.6 | 104.4 | 2012–2014 | 2018 | [32] | |
| Total | 117 | 55 | 47.0 | 658 | 2012–2020 |
| Mycotoxin | Total Samples | Positives (>LOQ) | Percentage of Positives | Max. Value Found (µg/kg) | EU Regulation (µg/kg) | Percentage> EU Regulation | Percentage> EU Lowest Maximum Levels in Southern Europe [16] |
|---|---|---|---|---|---|---|---|
| AFB1 | 700 | 77 | 11.0 | 6.9 | 5–20 [27] | 1.1 | 7.4 |
| AFB2 | 678 | 54 | 8.0 | 4.9 | - | ||
| AFG1 | 678 | 36 | 5.3 | 6.5 | - | ||
| AFG2 | 678 | 56 | 8.3 | 4.4 | - | ||
| DON | 678 | 306 | 45.1 | 887 | 900–5000 [26] | 0 | 11.7 |
| OTA | 678 | 42 | 6.2 | 65.5 | 50–100 [26] | 0.15 | 0.9 |
| STER | 626 | 33 | 5.3 | 308 | - | ||
| ZEA | 678 | 240 | 35.4 | 956 | 100–500 [26] | 2.5 | 11.8 |
| AFG2 | AFG1 | AFB2 | AFB1 | OTB | ZEA | OTA | |
|---|---|---|---|---|---|---|---|
| Range (µg/kg) | 1.26–12.6 | 4–40 | 1.26–12.6 | 4–40 | 10–100 | 84–840 | 10–100 |
| LOQ (µg/kg) | 1.26 | 4 | 1.26 | 4 | 10 | 84 | 10 |
| LOD (µg/kg) | 0.63 | 2 | 0.63 | 2 | 5 | 42 | 5 |
Disclaimer/Publisher’s Note: The statements, opinions and data contained in all publications are solely those of the individual author(s) and contributor(s) and not of MDPI and/or the editor(s). MDPI and/or the editor(s) disclaim responsibility for any injury to people or property resulting from any ideas, methods, instructions or products referred to in the content. |
© 2023 by the authors. Licensee MDPI, Basel, Switzerland. This article is an open access article distributed under the terms and conditions of the Creative Commons Attribution (CC BY) license (https://creativecommons.org/licenses/by/4.0/).
Share and Cite
Muñoz-Solano, B.; González-Peñas, E. Co-Occurrence of Mycotoxins in Feed for Cattle, Pigs, Poultry, and Sheep in Navarra, a Region of Northern Spain. Toxins 2023, 15, 172. https://doi.org/10.3390/toxins15030172
Muñoz-Solano B, González-Peñas E. Co-Occurrence of Mycotoxins in Feed for Cattle, Pigs, Poultry, and Sheep in Navarra, a Region of Northern Spain. Toxins. 2023; 15(3):172. https://doi.org/10.3390/toxins15030172
Chicago/Turabian StyleMuñoz-Solano, Borja, and Elena González-Peñas. 2023. "Co-Occurrence of Mycotoxins in Feed for Cattle, Pigs, Poultry, and Sheep in Navarra, a Region of Northern Spain" Toxins 15, no. 3: 172. https://doi.org/10.3390/toxins15030172
APA StyleMuñoz-Solano, B., & González-Peñas, E. (2023). Co-Occurrence of Mycotoxins in Feed for Cattle, Pigs, Poultry, and Sheep in Navarra, a Region of Northern Spain. Toxins, 15(3), 172. https://doi.org/10.3390/toxins15030172