Article

Occurrence and Dietary Exposure Assessment to Enniatin B through Consumption of Cereal-Based Products in Spain and the Catalonia Region

1
Technology, Engineering and Science of Food Department, AGROTECNIO-CERCA Center, University of Lleida, 25198 Lleida, Spain
2
Oniris, INRAE, LABERCA, 44300 Nantes, France
*
Author to whom correspondence should be addressed.
Toxins 2023, 15(1), 24; https://doi.org/10.3390/toxins15010024
Submission received: 28 November 2022 / Revised: 20 December 2022 / Accepted: 23 December 2022 / Published: 29 December 2022

Abstract

:
Enniatin B (ENNB) is a mycotoxin produced by moulds from the Fusarium genera and its toxic effects are still not fully elucidated, hence a safe reference exposure value has not been established yet. ENNB is the most prevalent emerging mycotoxin and is widely found in cereal-based products, nevertheless, there are no comprehensive exposure assessment studies. For that reason, the aim of this study was to characterise the occurrence of ENNB and estimate the exposure of the Spanish and Catalan populations. A total of 347 cereal-based products were collected in 2019 and were analysed using liquid chromatography-tandem mass spectrometry. Consumption data were obtained from the national food consumption surveys (ENALIA) and a regional survey conducted in Catalonia. The global exposure was estimated using deterministic and probabilistic methods. The results showed a high occurrence of close to 100% in all foodstuffs, with a range from 6 to 269 µg/kg, and a strong correlation with the levels of deoxynivalenol. Children aged one–nine years were the most exposed, showing mean estimates in the range 308–324 ng/kg bw/day and 95th percentiles 697–781 ng/kg bw/day. This study stresses the need for further toxicological data to establish reference doses and conclude formal risk assessment, accounting for the co-occurrence with deoxynivalenol.
Key Contribution: Enniatin B was widely detected in cereal-based food from Spain intended for human consumption, co-occurring with deoxynivalenol. The most exposed population group was children aged one to nine years.

1. Introduction

Mycotoxins are chemical substances synthesised by some filamentous fungi in response to stress conditions [1]. The presence of mycotoxins in the food chain is mainly due to mould growth in cereal crops in the field, but poor storage conditions can favor mycotoxins’ presence as well [2]. To date, about three hundred mycotoxins have been identified and almost thirty of them may cause adverse effects on human health [3]. Due to the toxic nature of mycotoxins, the European Commission has established a maximum value in food products for aflatoxins, ochratoxin A, patulin, deoxynivalenol (DON), zearalenone, fumonisins B1 and B2, and toxins T-2 and HT-2 [4]. Nonetheless, the European Commission has not established a maximum level for other emerging mycotoxins, like enniatins (ENN). In 2014, the European Food Safety Authority (EFSA) CONTAM Panel considered that there were not enough data to establish a Tolerable Daily Intake (TDI) and/or an Acute Reference Dose for the sum of ENN mycotoxins [5].
The toxicity of ENN is related to their ionophoric properties by forming complexes with alkali metal ions and increasing the cationic permeability of membranes [6]. Furthermore, effects on cell viability and apoptosis induction were observed by the high permeation from blood to the brain across the blood-brain barrier [7]. Recent evidence suggests that Enniatin B (ENNB) can produce Reactive Oxygen Species (ROS) targeting the intestinal barrier [8], affecting the embryonic development in mice [9], and impairing the reproductive function of cattle in vitro [10]. An interactive effect of ENNB with DON has been observed in piglets, which in combination led to decreased weight gain and diversity of gut microbiome [11].
Among the four ENN isoforms (A, A1, B, and B1), ENNB is the most relevant metabolite in terms of occurrence, which is produced by Fusarium species and is usually found in cereals, flour, and their derived food products [12,13,14,15,16]. Noteworthy, since moulds of the Fusarium genus can produce several mycotoxins [12], it is common to find multiple Fusarium mycotoxins co-occurring in cereal-based foodstuffs [17]. The characterization of their co-occurrence is further stressed by the reported joint effects of ENNB with other Fusarium mycotoxins, with the potential of enhancing their toxic effects [18,19].
The main exposure pathway to mycotoxins among the general human population is through diet, hence dietary exposure modelling becomes a suitable tool to estimate global exposure. Despite several comprehensive studies assessing the exposure of populations to main mycotoxins [3,20,21,22,23], to the best of our knowledge, there is no study focusing on ENNB. Thus, the present study aims at characterising the occurrence of ENNB in cereal-based food commonly consumed in Spain and estimating the dietary exposure of the general population, with a special focus on the region of Catalonia.

2. Results and Discussion

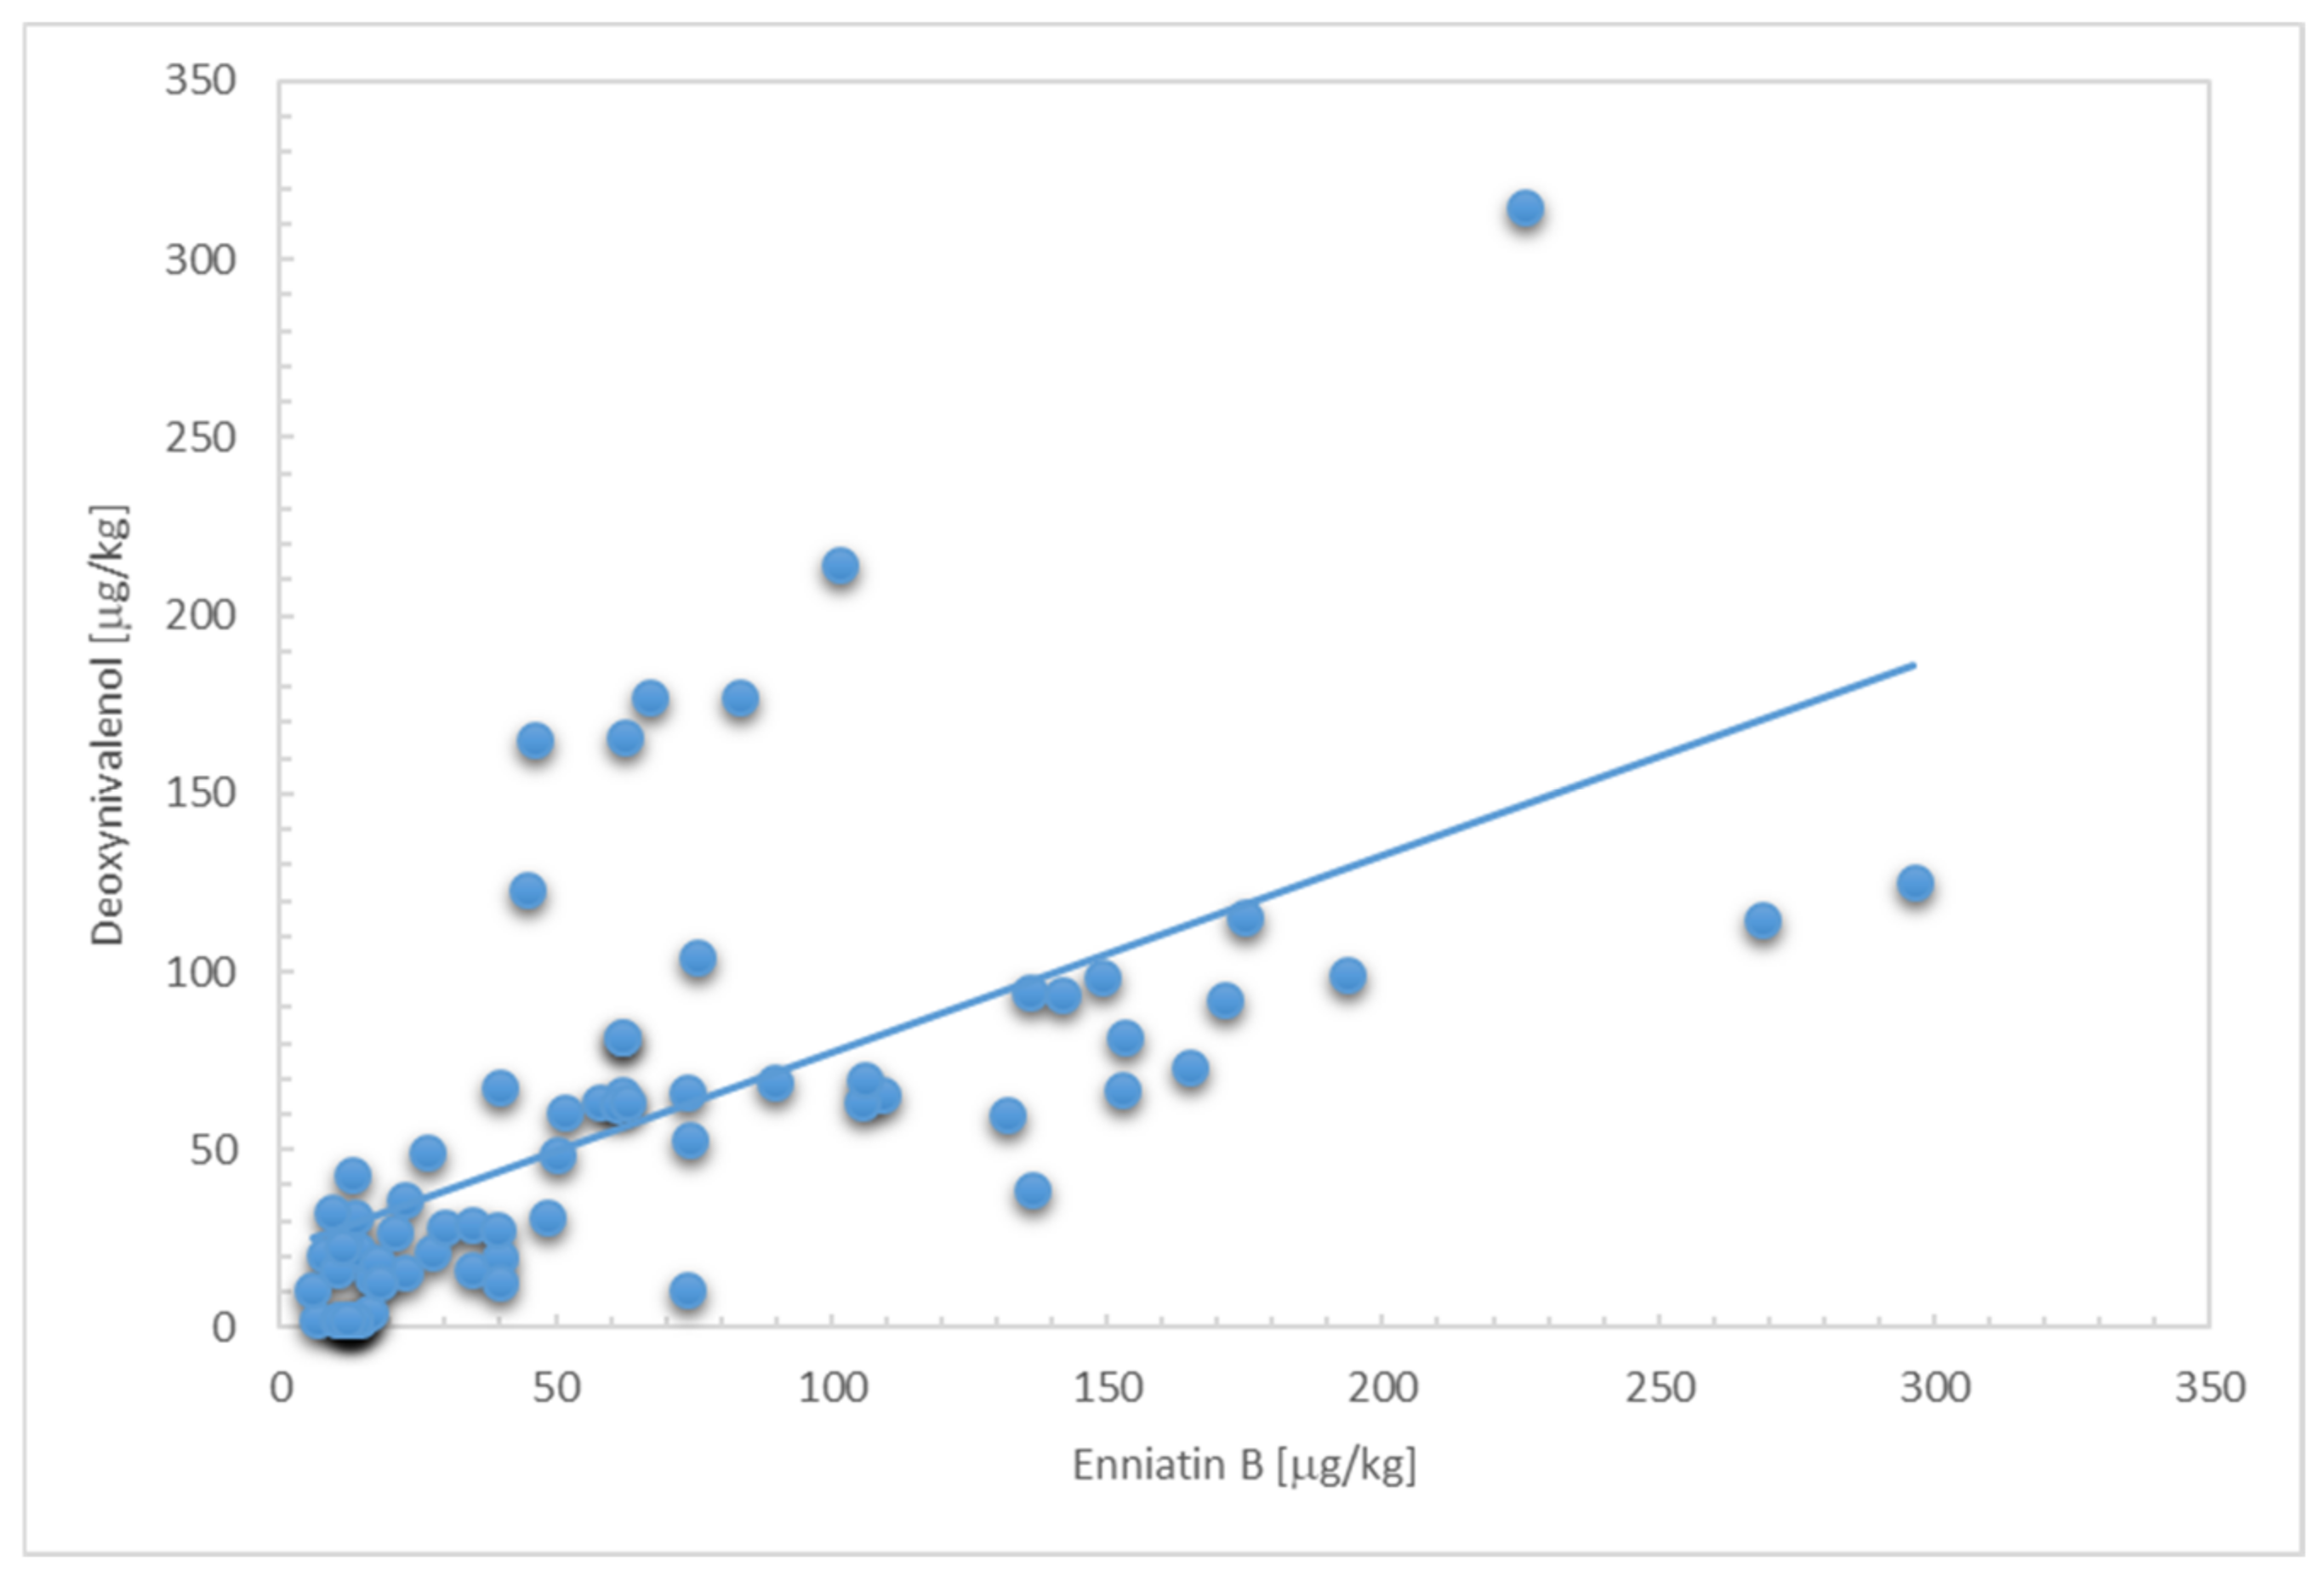
2.1. Occurrence of Enniatin B

Among the 23 mycotoxins analysed, only ENNB and DON (reported elsewhere [24]) were detected above the limit of detection (LOD: 2 µg/kg) in all analysed composites, whereas in baby food it was found only in 28% of samples (Table 1). Bread rusks were the most contaminated food item followed by tin bread (mean of 178.68 and 163.32 µg/kg, respectively), whereas baby food showed the lowest contamination values (mean of 6.71 µg/kg). Sweet bakery products also showed lower contamination values than the other bakery products (between 11 and 24 µg/kg for muffins, other cookies, cookies, and cakes). Conversely, the lower contamination levels of wholegrain bread than white or tin bread were unexpected because commonly the most contaminated part of grain is removed during the processing of white bread [25,26]. Considering the fact that the baking processes may equally affect the stability of ENN, we attributed these slight differences to the different origins of flours with different background contamination levels. Previous studies conducted in Spain showed similar values in pasta, within a range from 0.50 to 122.13 µg/kg in dry pasta and 0.50 g to 33.13 µg/kg in fresh pasta [27], and a range of 0.23 to 10.54 µg/kg in pizza dough [28], a product that we did not analyse but has a resemblance to bread. Infant formula was also analysed; ENNB1, ENNA, and ENNA1 but not ENNB were detected [29].
Some studies conducted in other countries showed, in general, lower occurrence values than those found in Spain; for instance, a mean of 25 µg/kg in pasta from Italy [30]. Lower values than the present study were also reported in the Netherlands, with a mean of 16 µg/kg in bread, 28 µg/kg in breakfast cereals, or 8.7 µg/kg in pasta [31]. Consistent values with our findings were reported in biscuits and cookies from the Netherlands (mean 15 µg/kg). In Tunisia, a range of 0.05 to 1.1 µg/kg in white bread, 0.39 to 10.7 µg/kg in wholegrain bread, and 0.05 to 1.6 µg/kg in biscuits, were found [32]. Likewise, a range between 0.37 to 1.05 µg/kg was detected in cereal-based products from China [33]. In the case of food for children, in the Netherlands 17 µg/kg were found in bread, 16 µg/kg in breakfast cereals, and 58 µg/kg in rye and maize products [31]. In Austria, a range from <0.4 to 40 µg/kg was reported in infant foods [34]. In Tunisia, ranges from 22 to 93 µg/kg in breakfast cereals, and 6 to 8 µg/kg in infant cereals were found [35].
We found that the concentration of ENNB was strongly and positively correlated with the levels of DON (Figure 1), previously analysed in the same samples [24], with a Pearson correlation coefficient of 0.627 (p < 0.0001). Several samples showed concentrations systematically above the trend line, corresponding to wholegrain bread. Globally, the concentrations of ENNB exceeded those of DON, showing an average ratio ENNB:DON of 1.8 (range 0.3–6.8). The type of food item contributed to explaining the variability of ratios of concentrations, for instance, the mean ratio in wholegrain bread was 0.4, whereas in cookies, 2.3. These differences may be a consequence of the differential effects of food processing among both mycotoxins [25]. These results further support the need for a mixed risk assessment of ENNB combined with DON, especially in light of potential synergistic effects reported in toxicological studies [18].

2.2. Consumption of Cereal-Based Foods

Consumption patterns of cereal-based food among the population of Spain and the Catalonia region were described elsewhere [24]. Briefly, the most consumed cereal-based products among the Spanish young population (under 18 years) was white bread, followed by cookies and pasta, whereas the remainder of the foodstuffs were consumed occasionally (Table 2). Among adults, bread and pasta accounted for the most consumed food products in terms of percentage of consumers and average consumption, showing some slight differences among Spain and the Catalonia region, and Spain (Supplemental Table S1).

2.3. Exposure Assessment of Enniatin B among Adult Population

Exposure estimates among the adult population from Spain and the Catalonia region are summarized in Table 3. Median estimates were in the range between 105 and 174 ng/kg bw/day, whereas the 95th percentile ranged between 202 and 452 ng/kg bw/day. Slight differences were observed between age groups and studied regions; the group aged 18–40 years old showed the highest estimates, especially for Spain, irrespective of the exposure assessment method (probabilistic vs. deterministic). The main contributor to ENNB exposure for the Spanish adult population (Supplemental Figure S1) was white bread (53.6–62%) followed by pasta (17.2–20.1%), and tin bread (10.6–19.5%). For the Catalonian, pasta was the main contributor (33.2–36.5%), white bread (15.8–25.5%), and breakfast cereals (13.2–18.6%).
Dietary exposure to ENNB has seldom been addressed in previous studies, or even rarely considered in total diet studies [36]. The few available studies (summarized in Table 4) showed that our results were lower than those estimates provided by the EFSA Contam Panel for the European countries and cross-countries estimates (mean 420–1820 ng/kg bw/day and P95 910–3280 ng/kg bw/day). Nonetheless, our figures are in the range of those previously estimated in the Netherlands with a median of 47.3 ng/kg bw/day to 54.4 ng/kg bw/day, and a P95 of 113 ng/kg bw/day to 124 ng/kg bw/day [37]. The estimates in Algeria using contamination data on raw wheat showed exposure estimates of 13,960 ng/kg bw/day [17], and the highest value was from Austria, with 40,000 ng/kg bw/day [34], about 400 times higher than the ones found in our work.

2.4. Exposure Assessment of Enniatin B among Infant and Adolescent Population

The exposure estimates for the young population under 18 years old are shown in Table 5. Catalonian exposure was calculated only with the infant food consumption of infants up to three years old, for which we considered two scenarios, a Lower Bound (LB) scenario where censored contamination data was substituted by 0, and an Upper Bound (UB) scenario where censored data was substituted by a LOD of 2 µg/kg. The estimation of both scenarios showed an exposure below 100 ng/kg bw/day, except for P95 and P99 of UB, with estimates of 129.1 ng/kg bw/day for P95 and 166.6 ng/kg bw/day for P99 only with infant formula consumption. For the estimation of the minor population from Spain, we followed the same methodology as for the adult population and with the same food groups. The exposure estimates were strongly determined by the age group, with children aged one–nine years being the most exposed with median and 95th percentile estimates in the ranges 264–266 and 697–710 ng/kg bw/day, respectively. Little differences were observed between exposure assessment methods. The population between 0 and 11 months old showed the lowest exposure estimation, which could be related to the consumption data in Table 2, where this age group’s consumption was almost limited to white bread and cookies, whereas the other age groups showed a wider consumption pattern (e.g., 50% of pasta consumers).
The highest contributor to ENNB exposure was white bread (45.5–54.1%), crackers (34.0–39.5%), and the third one was basic cookies for 0–11 month old infants (18.6%), cookies (3.4–6.4%) for children between three and nine years old, and pasta (3.1%) for those aged 10 to 17 year (Supplemental Figure S2). As found for adults, the high consumption of white bread played an important role in exposure contribution, and pasta contributed as well but had less relevance in minors than in adults. The fate of ENNB during pasta cooking is still not clear. Some authors suggested that ENNB suffers from thermal degradation [27], but results from other authors showed 80–100% of ENNB retention during cooking due to hydrophobic characteristics [39]. Further studies will be necessary to clarify these differences.
The exposure results from our study were lower than other previously published studies (Table 5). In Europe, the mean range of exposure to ENNB ranged from 47.3 to 40,000 ng/kg bw/day [5,34,37], whereas the mean range of our study ranged from 28.32 to 266.0 ng/kg bw/day (including all methods). These large differences suggest a need for further ENNB studies to refine the exposure assessments. In addition, some differences between the existing studies can account for that variability, like the number of volunteers, the number of samples, the contamination values, the different consumption patterns among the cultures, and time-frames. For instance, among non-EU countries, China showed the lowest mean exposure to ENNB in the infant population (2 ng/kg bw/day) [38], whereas similar exposure estimations to our study were found in Tunisia [35].

3. Conclusions

To the best of our knowledge, this is the first comprehensive exposure assessment study of the emergent mycotoxin ENNB. The results support the widespread presence of this emergent mycotoxin in cereal-based food highly consumed in Spain. The median levels ranged between 10 µg/kg (muffins) to 193 µg/kg (bread rusks). A high correlation between ENNB and DON concentrations was found, with mean ENNB:DON ratios of 1.8 (range 0.3–6.8). Children aged one–nine years were the most exposed group with mean and 95th percentile estimates in the ranges 308–324 ng/kg bw/day and 95th percentile 697–781 ng/kg bw/day, respectively. The main contributor to the exposure to ENNB for all ages and regions was white bread and pasta, except for babies, which was white bread. These results also highlight the relevance of adult food (e.g., bread and pasta) on global exposure estimates among infants transitioning their diet at early ages. Globally, these results support the need for further toxicological data of ENNB alone and in combination with DON to conduct formal risk characterisation of this emergent toxin.

4. Materials and Methods

4.1. Food Sampling and Preparation

The overall methodology for sampling has been described elsewhere [24]. Between 24 April 2019 and 14 May 2019, a total of 220 different cereal-based food samples were collected from different establishments, according to the type of sample. From bakeries among the four Catalan provinces (Lleida, Tarragona, Barcelona, and Girona), a total of 127 samples of white bread and wholemeal bread samples were collected (Supplemental Table S2). Breakfast cereals, pasta, bakery products like tin bread (white tin bread), bread rusks, and crackers, and sweet bakery products like cookies (which were basic cookies), other cookies (which include chocolate cookies, cream cookies, butter cookies, tea cookies, and digestive cookies), muffins and cakes, were collected from three different types of distributors: hypermarkets (group 1), supermarkets (group 2) and local distributors (group 3). The 32 baby food samples were collected by brand, not by location.
Firstly, the samples were dried at 40 °C before their homogenization and milling (except bread and baby food) which was performed in a Thermomix 3000 obtained from Vorwerk (Wuppertal, Germany). Once milled, samples were mixed by groups in analytical composites, obtaining a total of 27 composites (three composites per product). For bread, 4 composites were obtained by combining the individual samples from each Catalonian region. The 32 individual samples of baby food were analysed separately.

4.2. Chemical Analysis of Mycotoxins

Deepoxi-deoxynivalenol (DOM) in a concentration of 50.3 µg/mL was used as an internal standard, purchased from Sigma Aldrich (St. Louis, MO, USA). Composites were spiked with 50 ppb of this standard. For the extraction, 2 g from each composite (or individual sample in the case of baby food) were placed in a Falcon tube with 18 mL of the extraction solvent, which was a mixture of acetonitrile (analytical reagent grade 99.99%) purchased from Fischer Scientific (Loughborough, UK), bi-distilled water, and formic acid (analytical reagent grade 98–100%) obtained from Fischer Scientific (Leicestershire, UK) in a proportion of 60:37:3, respectively. Falcon tubes were placed in a minitron orbital shaker from INFORS AG CH-4103 HT (Bottmingen, Switzerland) at 200 rpm for 30 min. After that, a previously prepared mixture of 4 g of magnesium sulphate anhydrous (technical grade 96%) obtained from PanReac Applichem (Darmstadt, Germany) with 1 g of sodium chloride (reagent grade ≥ 99.5%) purchased from Fischer Scientific (Loughborough, UK) was added and manually shaken for 60 s and shaken again in the orbital shaker for 30 min. After that time, the mixture was centrifuged at 3000 rpm for 10 min in a centrifuge Universal 320R purchased from Hettich (Tuttlingen, Germany). 7 mL of the organic fraction was taken and placed in a glass tube to evaporate the solvent at 40 °C under a gentle stream of nitrogen.
For the greasy samples, the mixture of the sample and the extraction solvent was centrifuged at 5000 rpm for 5 min, after that, 10 mL of n-hexane 96% obtained from Scharlab (Sentmenat, Spain) was added and shaken again in the orbital shaker at 200 rpm for 30 min. Once shaken, the mixture was centrifuged one more time at 5000 rpm for 5 min, and the hexane was discarded by decantation. The rest of the procedure followed the same method as for the other samples.
The above-mentioned extraction methods were performed as requested by the laboratory of the Centre of Excellence in Mycotoxicology and Public Health, Department of Bioanalysis, Faculty of Pharmaceutical Sciences, Ghent University (Ghent, Belgium), which also performed the determination and quantification of multi-mycotoxins in the evaporated extracts.

4.3. UPLC-MS/MS Analysis Procedure

The liquid chromatography-tandem mass multi-detection method allowed the quantification of 23 toxins as previously reported in the reference method [40]. The sample analysis was performed in a Waters® Acquity UPLC system coupled to a Quattro XEVO TQS mass spectrometer (Waters®, Manchester, UK). The software used for data acquisition and processing was MassLynx™ version 4.1 and QuanLynx® version 4.1 (Waters®, Manchester, UK). Separation of analytes was carried out by an HSS T-3 column (2.1 × 100 mm, 1.8 μm) (Waters®, Manchester, UK). Two different mobile phases were used, mobile phase A (water/methanol/acetic acid; 94/5/1, v/v/v) and mobile phase B (methanol/water/acetic acid; 97/2/1, v/v/v), both buffered with 5 mM ammonium acetate and were set at a flow rate of 0.3 mL/min. The total run time was 28 min. Five µL of sample was injected into the UPLC system.
The ESI-source was operated both in negative and positive mode (ESI− and ESI+), and parameters were optimized and programmed for all measurements as follows: source and desolvation temperatures were 150 °C and 200 °C, respectively; the capillary voltage was 30 kV and nitrogen was applied as spray gas. The argon collision gas pressure was 9 × 10⁻⁶ bar, the cone gas, and desolvation gas flow were 150 and 550 L/h, respectively. The LOD was 2 μg/kg and method validation showed apparent recoveries between 97 and 108%, well within the range 80–110% established by Commission Decision 2002/657/EC.

4.4. Cereal-Based Food Consumption Data

4.4.1. National-Based Consumption Data

Consumption data of general Spanish population were obtained from the National Dietary Survey on the Child and Adolescent Population in Spain (ENALIA) and the Spanish National dietary survey in adults, elderly, and pregnant women (ENALIA2) conducted by the Spanish Agency for Consumer Affairs, Food Safety and Nutrition (AESAN) [41]. The design, protocol, and methodology of the ENALIA studies, following the EFSA “EU Menu” guidance recommendations, have been described in other studies as well [42].
ENALIA is a dietary recall conducted between 2012 and 2014 that was based on two non-consecutive 1-day food diaries for children aged 6 months to 10 years, and two 24-h dietary recalls for 11 to 17-year-old children and adolescents, separated by at least 14 days to ensure that information best resembled usual dietary intake.
On the other hand, ENALIA2 consisted of a dietary survey conducted between 2013 and 2015 with a sample of 900 adults/elderly and 133 pregnant women. The food intake was evaluated with two non-consecutive days (at least 14 days in between) 24-h recalls and a Food Propensity Questionnaire [41].

4.4.2. Regional-Based Consumption Data

A self-administered online food frequency questionnaire (FFQ) was conducted for the most consumed cereal-based foods in the region of Catalonia, which may represent a source of Fusarium mycotoxins exposure, to obtain individual consumption data. The semi-quantitative FFQ described in other studies as well [43] was completed between 8 May 2019 and 1 July 2019 by 1564 adult Catalan people divided into four age ranges: 18–25 years old (N = 562), 26–40 years old (N = 307), 41–60 years old (N = 401) and elder people above 60 years old (N = 295).
The consumption data were normalised by dividing the consumption of the food by the individual body weight (bw), and the result was expressed as g of food/kg bw/day. The previously published cereal-based infant food consumption data was used to provide specific exposure estimates in the region [43].

4.5. Exposure Assessment

Deterministic and probabilistic methods were used in the present work to combine the contamination data with the consumption data.
Using Equation (1), we combined the summary contamination data and the consumption data assuming independence between consumption (Cπ,j) and contamination (Tj) to perform the deterministic method [43].
E ^ π 0 = j = 1 p C ¯ π 0 ,   j · T j ¯
where: E ^ π 0 is the normalised exposure of sample population π0;   C ¯ π 0 ,   j is the arithmetic mean of normalised consumption of food j by population π0 and T j ¯ is the arithmetic mean of contamination of food j.
The probabilistic method used in this work consisted of a semi-parametric method (SP) previously described in other studies [43,44].
Firstly, with graphical methods and the Anderson-Darling statistics support, we attempted to fit the probability density functions (pdf) on consumption datasets. Next, with EnviroPRA v1.0 package R software [45], we did 10,000 iterations to sample the normalised consumption of the food j from its respective pdf and integrate it with the mean level of mycotoxin contamination of the food j using again the Equation (1) to estimate the individual exposure profiles.
We considered the fixed arithmetic mean contamination in the probabilistic models to estimate the individual common exposures and related chronic risk instead of drawing acute exposure profiles. In both probabilistic methods, 10,000 iterations were considered.

Supplementary Materials

The following supporting information can be downloaded at: https://www.mdpi.com/article/10.3390/toxins15010024/s1; Table S1. Normalised consumption (g/kg bw/day) of cereal-based products for adult population from Catalonia Region and for all Spain; Table S2. Inventory of individual samples and composites prepared for the analysis for each food group; Figure S1. Contribution of cereal-based products to exposure of enniatin B to the Spanish population of 18–40 years old group (A), 41–60 years old group (B) and >60 years old group (C); Figure S2. Contribution of cereal-based products to exposure of enniatin B to the 0-11 months old group (A), 12–35 months old group (B), 3–9 years old group (C) and 10–17 years old group (D).

Author Contributions

Conceptualization, V.S., S.M., A.J.R. and G.C.-S.; methodology, V.S., S.M., A.J.R. and G.C.-S.; software, J.A.G. and G.C.-S.; validation, V.S., S.M. and A.J.R.; formal analysis, J.A.G. and G.C.-S.; investigation, J.A.G. and G.C.-S.; resources, V.S.; data curation, J.A.G. and G.C.-S.; writing—original draft preparation, J.A.G. and G.C.-S.; writing—review and editing, V.S., S.M. and A.J.R.; visualization, J.A.G.; supervision, V.S., S.M., A.J.R. and G.C.-S.; project administration, V.S., S.M. and A.J.R.; funding acquisition, V.S. All authors have read and agreed to the published version of the manuscript.

Funding

This research was funded by the Catalan Agency of Food Safety (ACSA) (SA-2019-391) and the Agency for Management of University and Research Grants (AGAUR) with a doctoral fellowship (2021 FI_B 00129; 2022 FI_B1 00033).

Institutional Review Board Statement

Not applicable.

Informed Consent Statement

Not applicable.

Data Availability Statement

The raw contamination data is available upon request. Spanish food consumption data is property and managed by the Spanish Agency for Consumer Affairs Food Safety and Nutrition, Spanish Minister of Consumer Affairs and Social Welfare.

Acknowledgments

We thank AESAN for providing us with ENALIA and ENALIA2 consumption data, the Catalan Agency of Food Safety (ACSA) for funding (SA-2019-391) and the Agency for Management of University and Research Grants (AGAUR) for granting JA Gallardo a doctoral fellowship (2021 FI_B 00129; 2022 FI_B1 00033).

Conflicts of Interest

The authors declare no conflict of interest.

References

  1. Gao, Y.; Meng, L.; Liu, H.; Wang, J.; Zheng, N. The Compromised Intestinal Barrier Induced by Mycotoxins. Toxins 2020, 12, 619. [Google Scholar] [CrossRef] [PubMed]
  2. Cano-Sancho, G.; Marín, S.; Ramos, A.J.; Sanchis, V. Micotoxines Estudi de Dieta Total a Catalunya 2008–2009; Agència de Salut Pública de Catalunya: Barcelona, Spain, 2009. [Google Scholar]
  3. Marin, S.; Ramos, A.J.; Cano-Sancho, G.; Sanchis, V. Mycotoxins: Occurrence, Toxicology, and Exposure Assessment. Food Chem. Toxicol. 2013, 60, 218–237. [Google Scholar] [CrossRef]
  4. Commission Regulation European Commission Regulation. EC 1881/2006, Setting Maximum Levels for Certain Contamination Foodstuffs. Off. J. Eur. Union 2006, 49, 1–15. [Google Scholar]
  5. European Food Safety Authority (EFSA). Scientific Opinion on the Risks to Human and Animal Health Related to the Presence of Beauvericin and Enniatins in Food and Feed. EFSA J. 2014, 12, 3802. [Google Scholar] [CrossRef]
  6. Prosperini, A.; Berrada, H.; Ruiz, M.J.; Caloni, F.; Coccini, T.; Spicer, L.J.; Perego, M.C.; Lafranconi, A. A Review of the Mycotoxin Enniatin B. Front. Public Health 2017, 5, 304. [Google Scholar] [CrossRef] [PubMed]
  7. Krug, I.; Behrens, M.; Esselen, M.; Humpf, H.U. Transport of Enniatin B and Enniatin B1 across the Blood-Brain Barrier and Hints for Neurotoxic Effects in Cerebral Cells. PLoS ONE 2018, 13, e197406. [Google Scholar] [CrossRef] [PubMed]
  8. Bertero, A.; Fossati, P.; Tedesco, D.E.A.; Caloni, F. Beauvericin and Enniatins: In Vitro Intestinal Effects. Toxins 2020, 12, 686. [Google Scholar] [CrossRef]
  9. Huang, C.-H.; Wang, F.-T.; Chan, W.-H. Enniatin B Induces Dosage-Related Apoptosis or Necrosis in Mouse Blastocysts Leading to Deleterious Effects on Embryo Development. Drug Chem. Toxicol. 2022, 45, 1449–1460. [Google Scholar] [CrossRef]
  10. Chiminelli, I.; Spicer, L.J.; Maylem, E.R.S.; Caloni, F. In Vitro Effects of Enniatin A on Steroidogenesis and Proliferation of Bovine Granulosa Cells. Toxins 2022, 14, 714. [Google Scholar] [CrossRef]
  11. Novak, B.; Lopes Hasuda, A.; Ghanbari, M.; Mayumi Maruo, V.; Bracarense, A.P.F.R.L.; Neves, M.; Emsenhuber, C.; Wein, S.; Oswald, I.P.; Pinton, P.; et al. Effects of Fusarium Metabolites Beauvericin and Enniatins Alone or in Mixture with Deoxynivalenol on Weaning Piglets. Food Chem. Toxicol. 2021, 158, 112719. [Google Scholar] [CrossRef]
  12. European Food Safety Authority (EFSA). In Vivo Toxicity and Genotoxicity of Beauvericin and Enniatins. Combined Approach to Study in Vivo Toxicity and Genotoxicity of Mycotoxins Beauvericin (BEA) and Enniatin B (ENNB). EFSA Support. Publ. 2018, 15, 1406E. [Google Scholar] [CrossRef] [Green Version]
  13. Ederli, L.; Beccari, G.; Tini, F.; Bergamini, I.; Bellezza, I.; Romani, R.; Covarelli, L. Enniatin B and Deoxynivalenol Activity on Bread Wheat and on Fusarium Species Development. Toxins 2021, 13, 728. [Google Scholar] [CrossRef] [PubMed]
  14. Gautier, C.; Pinson-Gadais, L.; Richard-Forget, F. Fusarium Mycotoxins Enniatins: An Updated Review of Their Occurrence, the Producing Fusarium Species, and the Abiotic Determinants of Their Accumulation in Crop Harvests. J. Agric. Food Chem. 2020, 68, 4788–4798. [Google Scholar] [CrossRef] [PubMed]
  15. Yoshinari, T.; Suzuki, Y.; Sugita-Konishi, Y.; Ohnishi, T.; Terajima, J. Occurrence of Beauvericin and Enniatins in Wheat Flour and Corn Grits on the Japanese Market, and Their Co-Contamination with Type B Trichothecene Mycotoxins. Food Addit. Contam. Part A 2016, 33, 1620–1626. [Google Scholar] [CrossRef]
  16. André, A.; Müller, N.; Chetschik, I. Occurrence of Zearalenone and Enniatin B in Swiss Wheat Grains and Wheat Flours. Appl. Sci. 2022, 12, 10566. [Google Scholar] [CrossRef]
  17. Mahdjoubi, C.K.; Arroyo-Manzanares, N.; Hamini-Kadar, N.; García-Campaña, A.M.; Mebrouk, K.; Gámiz-Gracia, L. Multi-Mycotoxin Occurrence and Exposure Assessment Approach in Foodstuffs from Algeria. Toxins 2020, 12, 194. [Google Scholar] [CrossRef] [Green Version]
  18. Fernández-Blanco, C.; Font, G.; Ruiz, M.J. Interaction Effects of Enniatin B, Deoxinivalenol and Alternariol in Caco-2 Cells. Toxicol. Lett. 2016, 241, 38–48. [Google Scholar] [CrossRef]
  19. Kolf-Clauw, M.; Sassahara, M.; Lucioli, J.; Rubira-Gerez, J.; Alassane-Kpembi, I.; Lyazhri, F.; Borin, C.; Oswald, I.P. The Emerging Mycotoxin, Enniatin B1, down-Modulates the Gastrointestinal Toxicity of T-2 Toxin in Vitro on Intestinal Epithelial Cells and Ex Vivo on Intestinal Explants. Arch. Toxicol. 2013, 87, 2233–2241. [Google Scholar] [CrossRef]
  20. Vin, K.; Rivière, G.; Leconte, S.; Cravedi, J.P.; Fremy, J.M.; Oswald, I.P.; Roudot, A.C.; Vasseur, P.; Jean, J.; Hulin, M.; et al. Dietary Exposure to Mycotoxins in the French Infant Total Diet Study. Food Chem. Toxicol. 2020, 140, 111301. [Google Scholar] [CrossRef]
  21. Franco, L.T.; Oliveira, C.A.F. Assessment of Occupational and Dietary Exposures of Feed Handling Workers to Mycotoxins in Rural Areas from São Paulo, Brazil. Sci. Total Environ. 2022, 837, 155763. [Google Scholar] [CrossRef]
  22. European Food Safety Authority (EFSA) Deoxynivalenol in Food and Feed: Occurrence and Exposure. EFSA J. 2013, 11, 3379. [CrossRef]
  23. Cano-Sancho, G.; Sanchis, V.; Ramos, A.J.; Marín, S. Effect of Food Processing on Exposure Assessment Studies with Mycotoxins. Food Addit. Contam. Part A 2013, 30, 867–875. [Google Scholar] [CrossRef] [PubMed]
  24. Gallardo, J.A.; Marin, S.; Ramos, A.J.; Cano-Sancho, G.; Sanchis, V. Deterministic and Probabilistic Dietary Exposure Assessment to Deoxynivalenol in Spain and the Catalonia Region. Toxins 2022, 14, 506. [Google Scholar] [CrossRef] [PubMed]
  25. Schaarschmidt, S.; Fauhl-Hassek, C. The Fate of Mycotoxins During the Processing of Wheat for Human Consumption. Compr. Rev. Food Sci. Food Saf. 2018, 17, 556–593. [Google Scholar] [CrossRef] [Green Version]
  26. Zhang, Y.; Pei, F.; Fang, Y.; Li, P.; Zhao, Y.; Shen, F.; Zou, Y.; Hu, Q. Comparison of Concentration and Health Risks of 9 Fusarium Mycotoxins in Commercial Whole Wheat Flour and Refined Wheat Flour by Multi-IAC-HPLC. Food Chem. 2019, 275, 763–769. [Google Scholar] [CrossRef]
  27. Serrano, A.B.; Font, G.; Mañes, J.; Ferrer, E. Emerging Fusarium Mycotoxins in Organic and Conventional Pasta Collected in Spain. Food Chem. Toxicol. 2013, 51, 259–266. [Google Scholar] [CrossRef]
  28. Quiles, J.M.; Saladino, F.; Mañes, J.; Fernández-Franzón, M.; Meca, G. Occurrence of Mycotoxins in Refrigerated Pizza Dough and Risk Assessment of Exposure for the Spanish Population. Food Chem. Toxicol. 2016, 94, 19–24. [Google Scholar] [CrossRef]
  29. Serrano, A.B.; Meca, G.; Font, G.; Ferrer, E. Risk Assessment of Beauvericin, Enniatins and Fusaproliferin Present in Follow-up Infant Formula by Invitro Evaluation of the Duodenal and Colonic Bioaccessibility. Food Control 2014, 42, 234–241. [Google Scholar] [CrossRef]
  30. Juan, C.; Mañes, J.; Raiola, A.; Ritieni, A. Evaluation of Beauvericin and Enniatins in Italian Cereal Products and Multicereal Food by Liquid Chromatography Coupled to Triple Quadrupole Mass Spectrometry. Food Chem. 2013, 140, 755–762. [Google Scholar] [CrossRef]
  31. López, P.; De Rijk, T.; Sprong, R.C.; Mengelers, M.J.B.; Castenmiller, J.J.M.; Alewijn, M. A Mycotoxin-Dedicated Total Diet Study in the Netherlands in 2013: Part II-Occurrence. World Mycotoxin. J. 2016, 9, 89–108. [Google Scholar] [CrossRef]
  32. Oueslati, S.; Berrada, H.; Juan-García, A.; Mañes, J.; Juan, C. Multiple Mycotoxin Determination on Tunisian Cereals-Based Food and Evaluation of the Population Exposure. Food Anal. Methods 2020, 13, 1271–1281. [Google Scholar] [CrossRef]
  33. Sun, D.; Qiu, N.; Zhou, S.; Lyu, B.; Zhang, S.; Li, J.; Zhao, Y.; Wu, Y. Development of Sensitive and Reliable UPLC-MS/MS Methods for Food Analysis of Emerging Mycotoxins in China Total Diet Study. Toxins 2019, 11, 166. [Google Scholar] [CrossRef] [PubMed] [Green Version]
  34. Braun, D.; Eiser, M.; Puntscher, H.; Marko, D.; Warth, B. Natural Contaminants in Infant Food: The Case of Regulated and Emerging Mycotoxins. Food Control 2021, 123, 107676. [Google Scholar] [CrossRef]
  35. Oueslati, S.; Berrada, H.; Mañes, J.; Juan, C. Presence of Mycotoxins in Tunisian Infant Foods Samples and Subsequent Risk Assessment. Food Control 2018, 84, 362–369. [Google Scholar] [CrossRef]
  36. Carballo, D.; Tolosa, J.; Ferrer, E.; Berrada, H. Dietary Exposure Assessment to Mycotoxins through Total Diet Studies. A Review. Food Chem. Toxicol. 2019, 128, 8–20. [Google Scholar] [CrossRef]
  37. Sprong, R.C.; De Wit-Bos, L.; Te Biesebeek, J.D.; Alewijn, M.; Lopez, P.; Mengelers, M.J.B. A Mycotoxin-Dedicated Total Diet Study in the Netherlands in 2013: Part III-Exposure and Risk Assessment. World Mycotoxin. J. 2016, 9, 109–127. [Google Scholar] [CrossRef]
  38. Ji, X.; Xiao, Y.; Wang, W.; Lyu, W.; Wang, X.; Li, Y.; Deng, T.; Yang, H. Mycotoxins in Cereal-Based Infant Foods Marketed in China: Occurrence and Risk Assessment. Food Control 2022, 138, 108998. [Google Scholar] [CrossRef]
  39. De Nijs, M.; Van den Top, H.; De Stoppelaar, J.; Lopez, P.; Mol, H. Fate of Enniatins and Deoxynivalenol during Pasta Cooking. Food Chem. 2016, 213, 763–767. [Google Scholar] [CrossRef]
  40. Monbaliu, S.; Van Poucke, C.; Detavernier, C.; Dumoulin, F.; Van De Velde, M.; Schoeters, E.; Van Dyck, S.; Averkieva, O.; Van Peteghem, C.; De Saeger, S. Occurrence of Mycotoxins in Feed as Analyzed by a Multi-Mycotoxin LC-MS/MS Method. J. Agric. Food Chem. 2010, 58, 66–71. [Google Scholar] [CrossRef]
  41. Marcos, S.V.; Rubio, M.J.; Sanchidrián, F.R.; De Robledo, D. Spanish National Dietary Survey in Adults, Elderly and Pregnant Women. EFSA Support. Publ. 2016, 13, 4–11. [Google Scholar] [CrossRef] [Green Version]
  42. López-Sobaler, A.M.; Aparicio, A.; Rubio, J.; Marcos, V.; Sanchidrián, R.; Santos, S.; Pérez-Farinós, N.; Dal-Re, M.Á.; Villar-Villalba, C.; Yusta-Boyo, M.J.; et al. Adequacy of Usual Macronutrient Intake and Macronutrient Distribution in Children and Adolescents in Spain: A National Dietary Survey on the Child and Adolescent Population, ENALIA 2013–2014. Eur. J. Nutr. 2019, 58, 705–719. [Google Scholar] [CrossRef] [PubMed]
  43. Cano-Sancho, G.; Gauchi, J.-P.; Sanchis, V.; Marín, S.; Ramos, A.J. Quantitative Dietary Exposure Assessment of the Catalonian Population (Spain) to the Mycotoxin Deoxynivalenol. Food Addit. Contam. Part A 2011, 28, 1098–1109. [Google Scholar] [CrossRef] [PubMed]
  44. Gauchi, J.-P.; Leblanc, J.-C. Quantitative Assessment of Exposure to the Mycotoxin Ochratoxin A in Food. Risk Anal. 2002, 22, 219–234. [Google Scholar] [CrossRef] [PubMed]
  45. US EPA Technical. Panel Guiding Principles for Monte Carlo Analysis; US EPA: Washington, DC, USA, 1997; pp. 1–35. [Google Scholar]
Figure 1. Scatter plot depicting the associations between concentration levels of enniatin B and deoxynivalenol in cereal-based foodstuffs, excluding infant food. Nine samples with non-detected levels of deoxynivalenol were assigned the limit of detection of 2 µg/kg.
Toxins 15 00024 g001
Table 1. Occurrence of enniatin B (µg/kg) in analysed cereal-based foodstuff.
nDFMeanMedianMinMax
White bread4100103.5105.162.16142.0
Wholemeal bread410074.4675.1146.30101.3
Tin bread3100163.3175.174.70225.4
Bread rusks3100178.7193.673.75268.7
Crackers310069.1548.3222.67136.5
Cookies310020.6013.7313.2434.82
Other cookies310019.4811.896.6639.88
Muffins310011.6810.367.9016.79
Cakes310023.4227.6212.9729.67
Breakfast cereals3100113.8148.939.65153.0
Pasta3100110.639.6247.19152.5
Baby food *32286.714.652.5316.79
* Individual contamination values of baby food analysed by brands. Abbreviations: n, number of analysed composites. DF, detection frequency (% of samples above the limit of detection at 2 µg/kg).
Table 2. Normalised consumption (g/kg bw/day) of cereal-based products for the population under 18 years old from ENALIA survey in Spain. Mean levels and standard deviation (SD) were computed considering only consumers identified as percentage of consumers (% cons).
FoodAgeN%MeanSD
GroupTotalCons
White bread 0–11 months18243%1.130.82
12–35 months33379%1.811.21
3–9 years old58995%1.590.88
10–17 years old62797%1.150.61
Wholegrain bread0–11 months1821%0.890.41
12–35 months3332%3.643.14
3–9 years old5896%1.440.77
10–17 years old6279%0.980.60
Bread rusks0–11 months----
12–35 months3334%0.780.74
3–9 years old5895%0.560.47
10–17 years old6273%0.330.15
Crackers0–11 months1825%0.310.11
12–35 months33312%0.982.20
3–9 years old5895%0.920.96
10–17 years old6275%0.550.64
Cookies0–11 months18281%1.040.55
12–35 months33374%1.370.83
3–9 years old58948%1.270.78
10–17 years old62734%0.790.50
Other cookies0–11 months----
12–35 months3331%1.540.95
3–9 years old5893%1.621.10
10–17 years old6272%1.301.12
Muffins0–11 months1821%3.33-
12–35 months33310%2.551.06
3–9 years old58916%1.730.79
10–17 years old62716%1.080.59
Cake0–11 months----
12–35 months3330.30%7.89-
3–9 years old5891%3.911.93
10–17 years old6272%2.060.83
Breakfast cereals0–11 months1822%2.923.18
12–35 months3333%1.751.35
3–9 years old5899%1.130.95
10–17 years old6278%0.690.49
Pasta0–11 months1829%2.281.60
12–35 months33349%2.381.70
3–9 years old58958%1.761.32
10–17 years old62759%1.100.92
Table 3. Exposure to enniatin B (ng/kg bw/day) among the adult population. The estimates were calculated with the deterministic and probabilistic method through consumption of cereal-based food from the Catalonia region and Spain considering only consumers using the upper bound scenario for left-censored data.
MethodRegionAge GroupMedianMeanSDMinP75P95P99
DeterministicCatalonia18–40130.6138.172.337.14178.8269.2350.0
41–60109.1114.959.867.22143.2222.5299.7
>60105.3111.454.344.79146.1202.8259.7
Spain18–40172.6196.3132.86.77260.2423.7565.2
41–60152.2170.1100.74.69219.4338.1453.4
>60144.5154.293.911.79213.7338.6396.9
ProbabilisticCatalonia18–40131.0138.568.100.00180.3261.5327.4
41–60109.5116.661.950.00153.7228.3290.1
>60105.4112.055.450.00146.2213.0263.8
Spain18–40174.0199.0137.60.00267.6452.4651.5
41–60148.2174.6123.00.00234.0405.2583.3
>60133.6161.0125.80.00214.2391.5606.0
Abbreviations: SD, standard deviation.
Table 4. Summary of exposure assessments to enniatin B among adult population reported in previous studies.
CountryContamination
Data
GroupConsumption
Data
Mean Estimated Exposure
(ng/kg bw/Day)
Reference
MeanP95
Summary European countries Infants 420–6502070–2120[5]
Toddlers 1130–18202170–2930
Other
children
870–18001510–3210
Adolescents 550–10701070–2030
Adults 470–1560910–3280
Elderly 610–1710980–3120
Very Elderly 660–15001040–2100
Netherlands 2–6 years oldn = 55151131–144 (P50)240–262 [37]
n = 16177–69 years oldn = 381947.3–54.4 (P50)113–124
Austrian = 59 6 months old 40,000 [34]
Tunisian = 115Adults 3.95 [32]
Children 7.7
n = 117Children 36–357 [35]
Algerian = 30
(wheat)
Adults 13.96 [17]
Chinan = 820<3 years oldn = 20,1722050 (P97.5)[38]
Table 5. Exposure to enniatin B (ng/kg bw/day) among the population under 18 years. The estimates were calculated with the deterministic and probabilistic method through the consumption of cereal-based food from the Catalonia region and Spain considering only consumers.
MethodRegionAge GroupnMedianMeanSDMinimumP75P95P99
Deterministic LBCatalonia0–36 months13328.3229.4522.150.7941.6873.2794.57
Deterministic UB0–36 months13349.8951.8739.011.473.40129.1166.6
DeterministicSpain0–11 months18245.96100.8133.65.72120.5328.0622.2
12–35 months333263.9324.2262.15.42458.6797.51181.3
3–9 years589264.3313.0199.610.47404.8710.2970.5
10–17 years627182.2213.0131.811.63270.8447.2673.2
ProbabilisticSpain0–11 months10,00046.2194.82123.00.00132.6327.6590.0
12–35 months10,000254.5308.4234.50.00422.3780.81092.2
3–9 years10,000266.0310.8201.10.00401.0697.11032.9
10–17 years10,000185.7224.2154.20.00283.18511.7813.5
Abbreviations: SD, standard deviation; LB, lower-bound; UB, upper-bound.
Disclaimer/Publisher’s Note: The statements, opinions and data contained in all publications are solely those of the individual author(s) and contributor(s) and not of MDPI and/or the editor(s). MDPI and/or the editor(s) disclaim responsibility for any injury to people or property resulting from any ideas, methods, instructions or products referred to in the content.

