Article

Active Expression of Genes for Protein Modification Enzymes in Habu Venom Glands

1
Division of Genomics, Medical Institute of Bioregulation, Kyushu University, Fukuoka 812-8582, Japan
2
Department of Biological Chemistry, Graduate School of Agricultural Science, Tohoku University, Sendai 980-8572, Japan
3
Marine Genomics Unit, Okinawa Institute of Science, Technology Graduate University, Onna 904-0495, Japan
4
Institute of Multidisciplinary Research for Advanced Material, Tohoku University, Sendai 980-8577, Japan
5
Department of Biomolecular Science, Graduate School of Life Sciences, Tohoku University, Sendai 980-8577, Japan
*
Authors to whom correspondence should be addressed.
Toxins 2022, 14(5), 300; https://doi.org/10.3390/toxins14050300
Submission received: 14 January 2022 / Revised: 9 April 2022 / Accepted: 16 April 2022 / Published: 22 April 2022
(This article belongs to the Section Animal Venoms)

Abstract

:
Genes encoding snake venom toxins have been studied extensively. However, genes involved in the modification and functioning of venom proteins are little known. Protobothrops is a genus of pit vipers, which are venomous and inhabit the Nansei (Southwest) islands of Japan, Taiwan China, Vietnam, Thailand, Myanmar, Nepal, Bhutan, and India. Our previous study decoded the genome of Protobothrops flavoviridis, a species endemic to the Nansei Islands, Japan, and revealed unique evolutionary processes of some venom genes. In this study, we analyzed genes that are highly expressed in venom glands to survey genes for candidate enzymes or chaperone proteins involved in toxin folding and modification. We found that, in addition to genes that encode venom proteins and ribosomal proteins, genes that encode protein disulfide isomerase (PDI) family members (orthologs of human P4HB and PDIA3), Selenoprotein M (SELENOM), and Calreticulin (CALR) are highly expressed in venom glands. Since these enzymes or chaperones are involved in protein modification and potentially possess protein folding functions, we propose that P4HB, SELENOM, CALR, and PDIA3 encode candidate enzymes or chaperones to confer toxic functions upon the venom transcriptome.
Key Contribution: P4HB and PDIA3 from the PDI gene family, the selenoprotein, SELENOM, and the ER-resident protein, CALR, are highly expressed in venom glands of habus (Protobothrops flavoviridis), suggesting the most likely involvement of these proteins in protein folding and modification during snake venom production.

1. Introduction

Several crotalid snakes inhabit the Nansei (southwestern) Islands of Japan (Amami-Oshima, Tokunoshima, Okinawa, and Sakishima) and Taiwan [1]. They include Protobothrops flavoviridis (Amami-Oshima, Tokunoshima, and Okinawa islands), Ovophis okinavensis (Amami-Oshima, Tokunoshima, and Okinawa islands), P. elegans (Ishigaki and Iriomote islands of the Sakishima Islands), P. mucrosquamatus (Taiwan), and Trimeresurus stejnegeri (Taiwan) (The Reptile Database: http://www.reptile-database.org/ (accessed on 31 March 2019)). From the point of view of snake envenomation in Japan, the habu, P. flavoviridis, is the greatest threat to people, with more than 1000 people bitten per year, and a fatality rate of 1% [2].
To clarify snake venom repertoires, as well as the evolution and physiological function of these venoms, many proteomic and transcriptomic studies have been performed [3,4,5]. These have revealed that snake venom proteins are produced as isoforms with various physiological functions and considerable inter- and intraspecific variation. This diversification of venom proteins may be caused by various molecular evolutionary mechanisms, including the accelerated evolution of venom genes [6,7,8,9] and alternative splicing of transcripts [10].
Since genomic information is essential for further studies on snake venom, we decoded the P. flavoviridis genome in 2018 [9]. In that study, we identified 60 venom genes belonging to 18 protein families. Interestingly, those genes arose through multiple duplication processes, resulting in many paralogs for each gene [9]. The habu genome analysis also demonstrated that six protein families (metalloproteinase (MP), serine protease (SP), C-type lectin-like proteins (CTLP), phospholipase A2 (PLA2), three-finger toxins (3FTX), and cysteine-rich secretory proteins (CRISP)) show accelerated evolution [9].
However, there are many questions to be answered in order to understand snake venom evolution, physiology, and pharmacology. One important question concerns how venom proteins are processed post-translationally to acquire their toxic functions. For example, one of the salient characteristics of venom proteins and peptides from venomous snakes, scorpions, spiders, and sea snails is that they are rich in disulfide bonds that stabilize their 3D structures [11,12]. PLA2s, which are major habu venom components, contain seven disulfide bonds. Type III svMPs, such as flavorase, HR1A, HR1B, and HVI1, possess 17 disulfide bonds, and a metalloprotease domain with disintegrin-like and cysteine (Cys)-rich domains at the C-terminus. In addition, CTLP, 3FTXs, and CRISP family proteins also contain four or more disulfide bonds. Furthermore, a certain type of CTLP forms an interchain disulfide bond with type III MPs, resulting in type IV MPs [13]. Thus, most P. flavoviridis snake venom proteins are Cys-rich proteins. It is thought that venom proteins pass through several modification processes to assume fully functional forms.
As mentioned above, although studies of venom transcriptomes have been conducted for many venomous snakes [3,4,5], there is little information on non-toxin transcripts expressed in venom glands. Moreover, there are even fewer reports focused on genes for enzymes that modify protein structure. Rokyta et al. (2012) [14] carried out transcriptomic analyses of venom glands of the eastern diamondback rattlesnake (Crotalus adamanteus) and found that genes for protein disulfide isomerases (PDIs) are highly expressed in the venom glands. In addition, Luna et al. (2013) [15] carried out proteomic analysis of the venom glands of Bothrops jararaca and found that proteins from the endoplasmic reticulum (ER), such as PDI and GPR78, and cytoplasmic proteins, such as 40S ribosomal protein, are enriched in venom glands. We expect that more genes involved in protein-modification functions are also highly expressed in venom glands of habus. Thus, to identify genes for candidate enzymes or chaperones of venom protein modification in P. flavoviridis, we carried out comprehensive transcriptomic analyses of venom glands and other organs. Here, we propose P4HB, PDIA3, SELENOM, and CALR as candidate enzyme genes for regulating/modifying venom proteins, since these genes are suggested to be strongly associated with the oxidative folding of venom proteins with multiple disulfide bonds.

2. Results

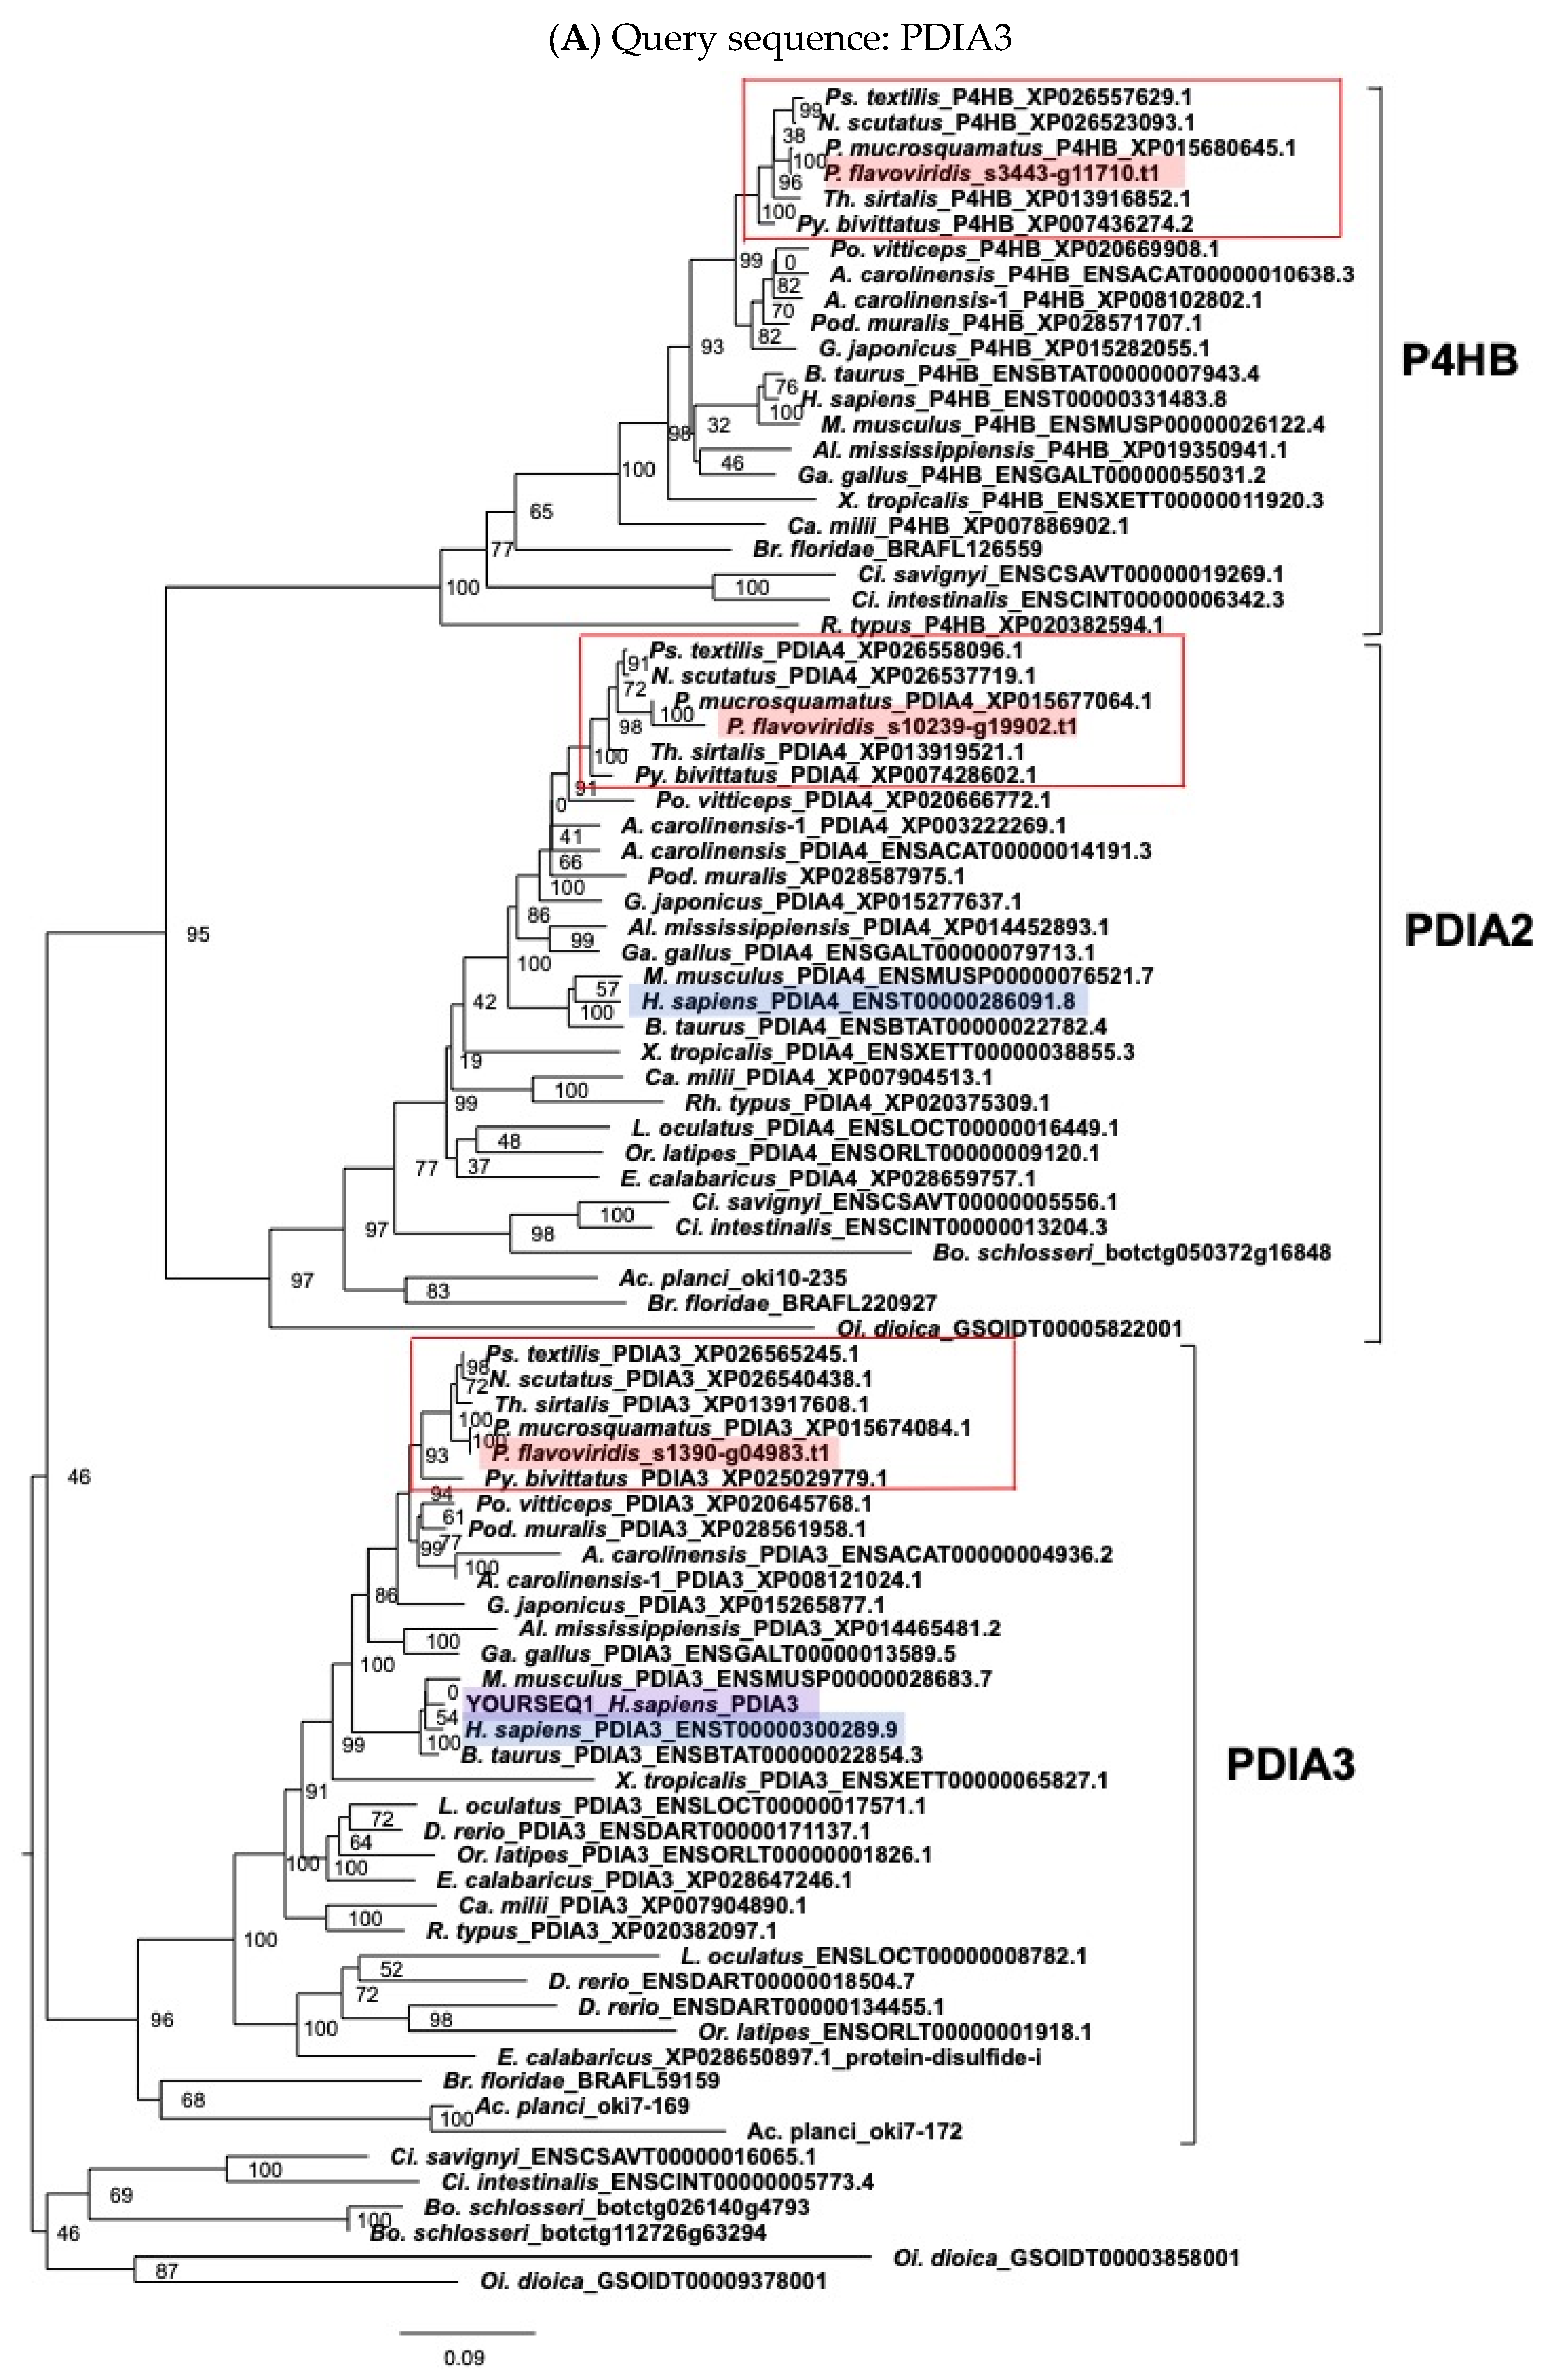
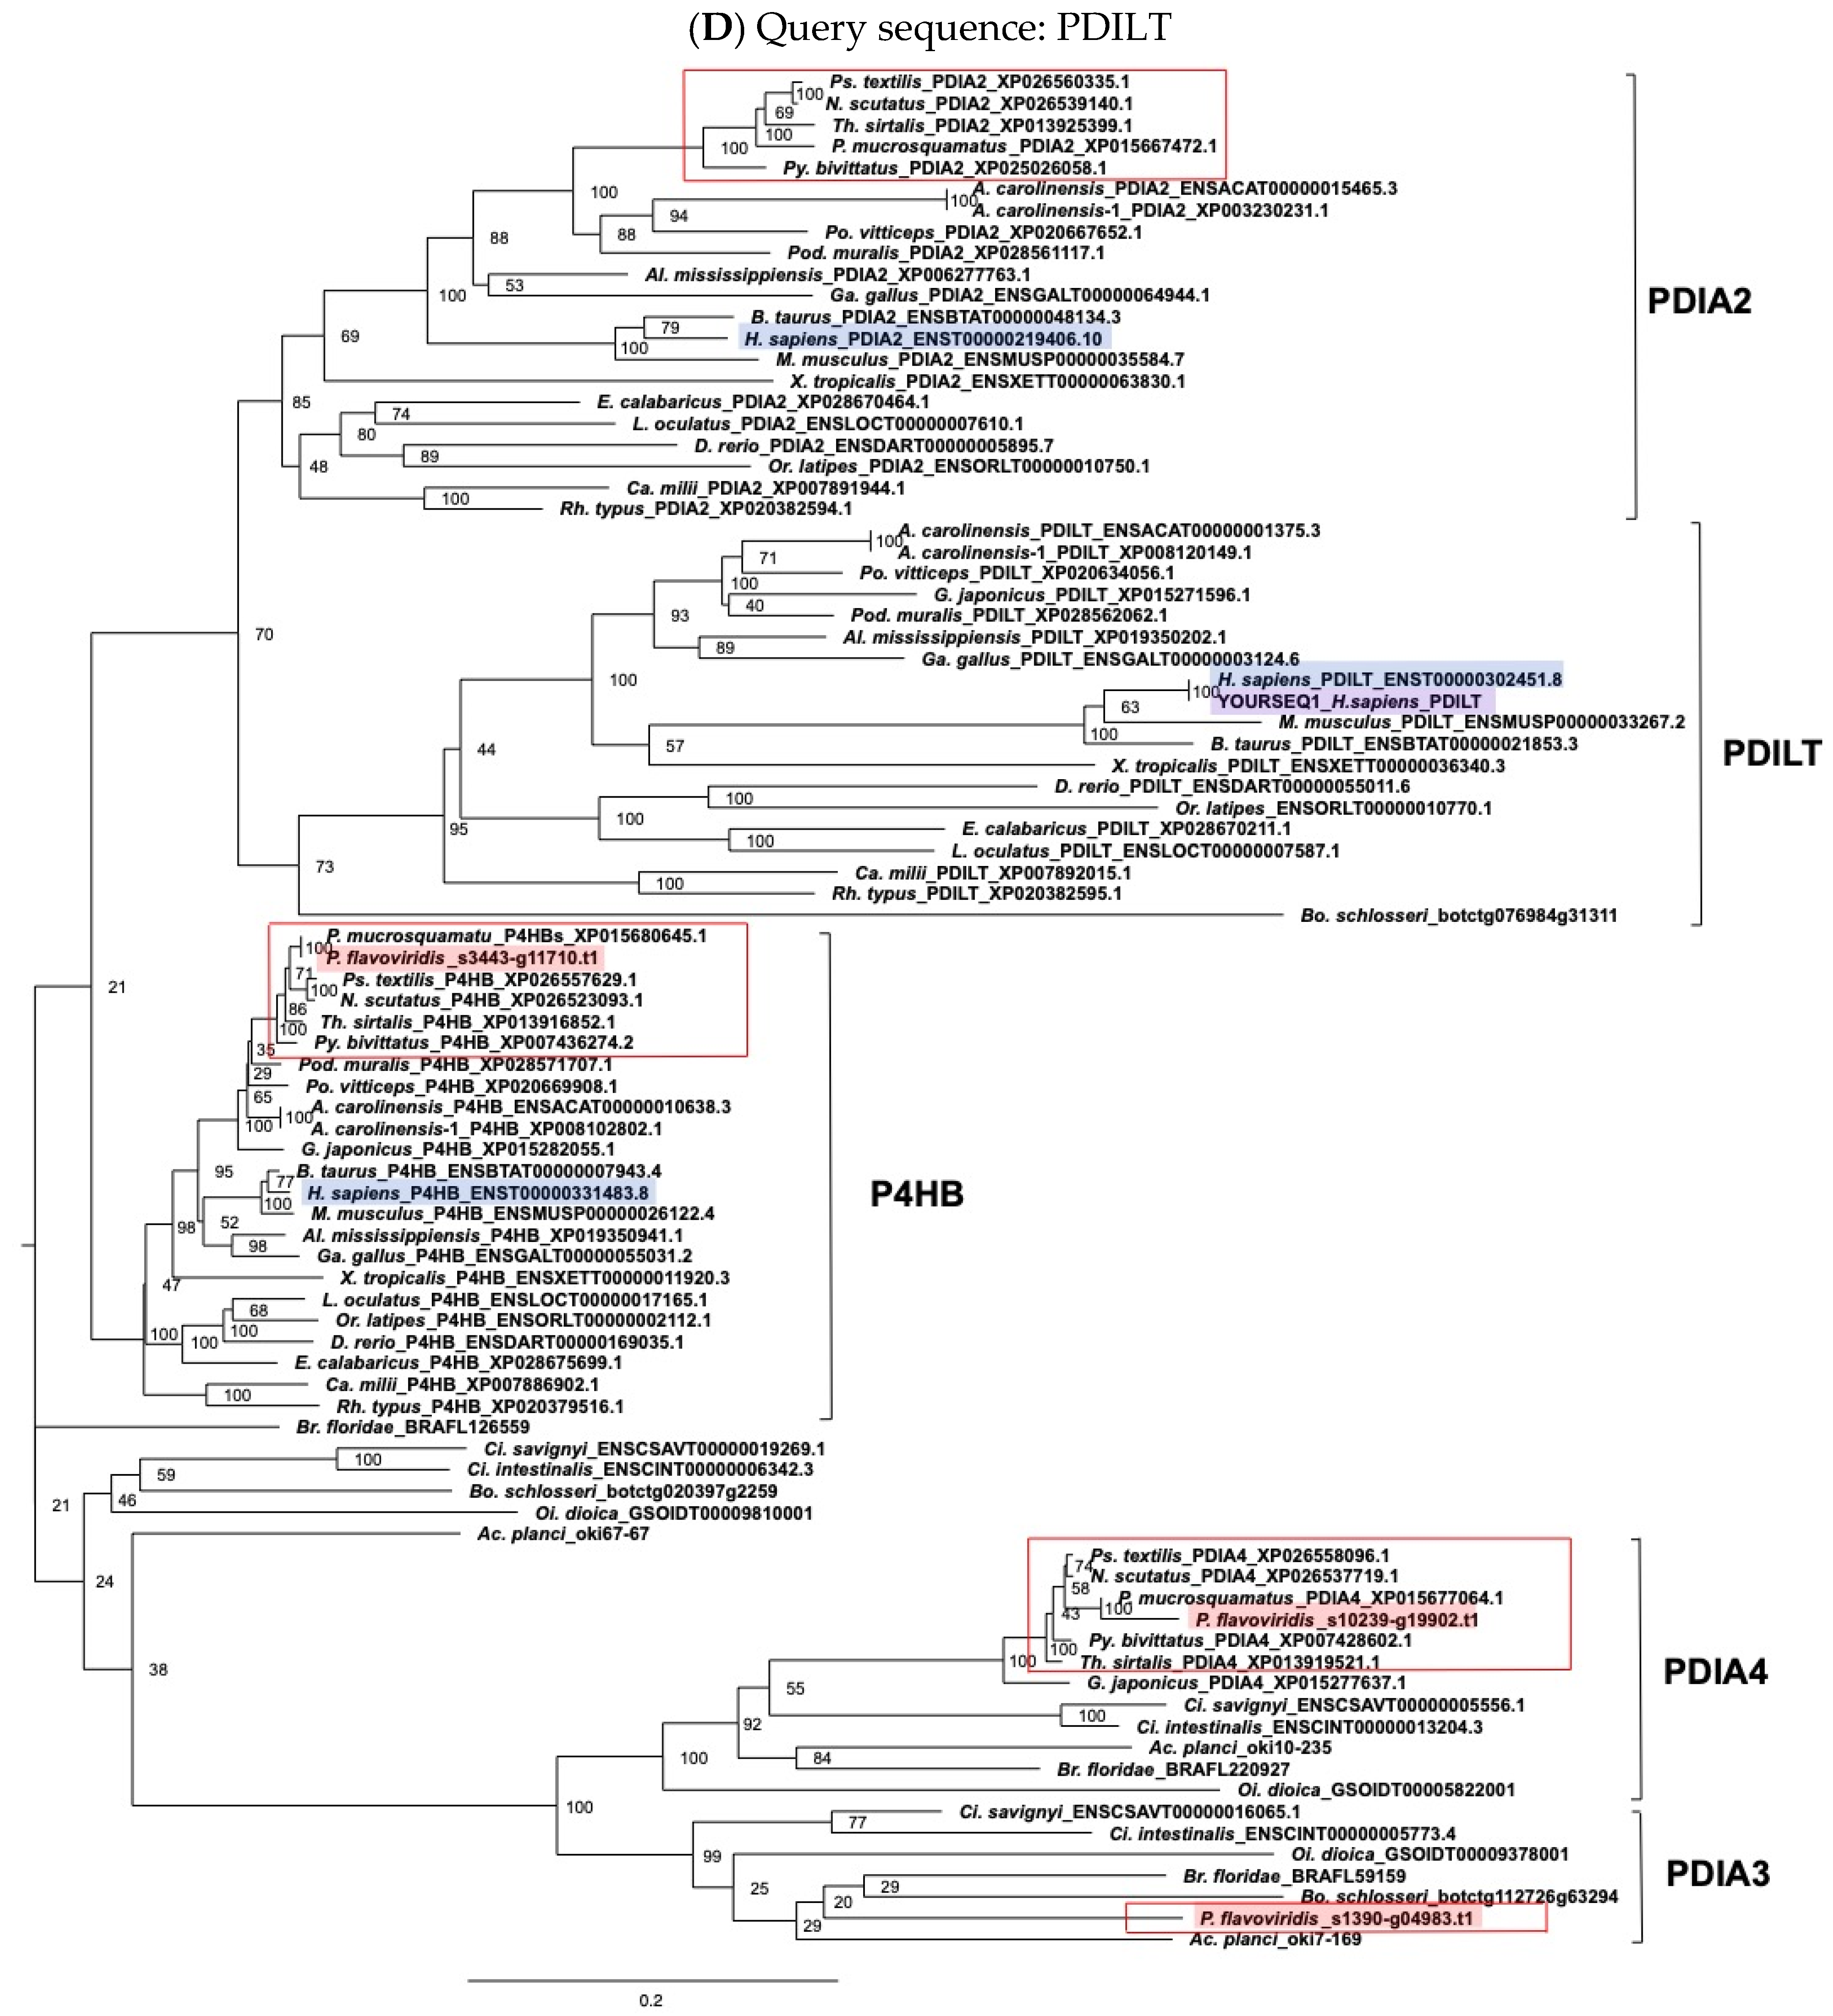
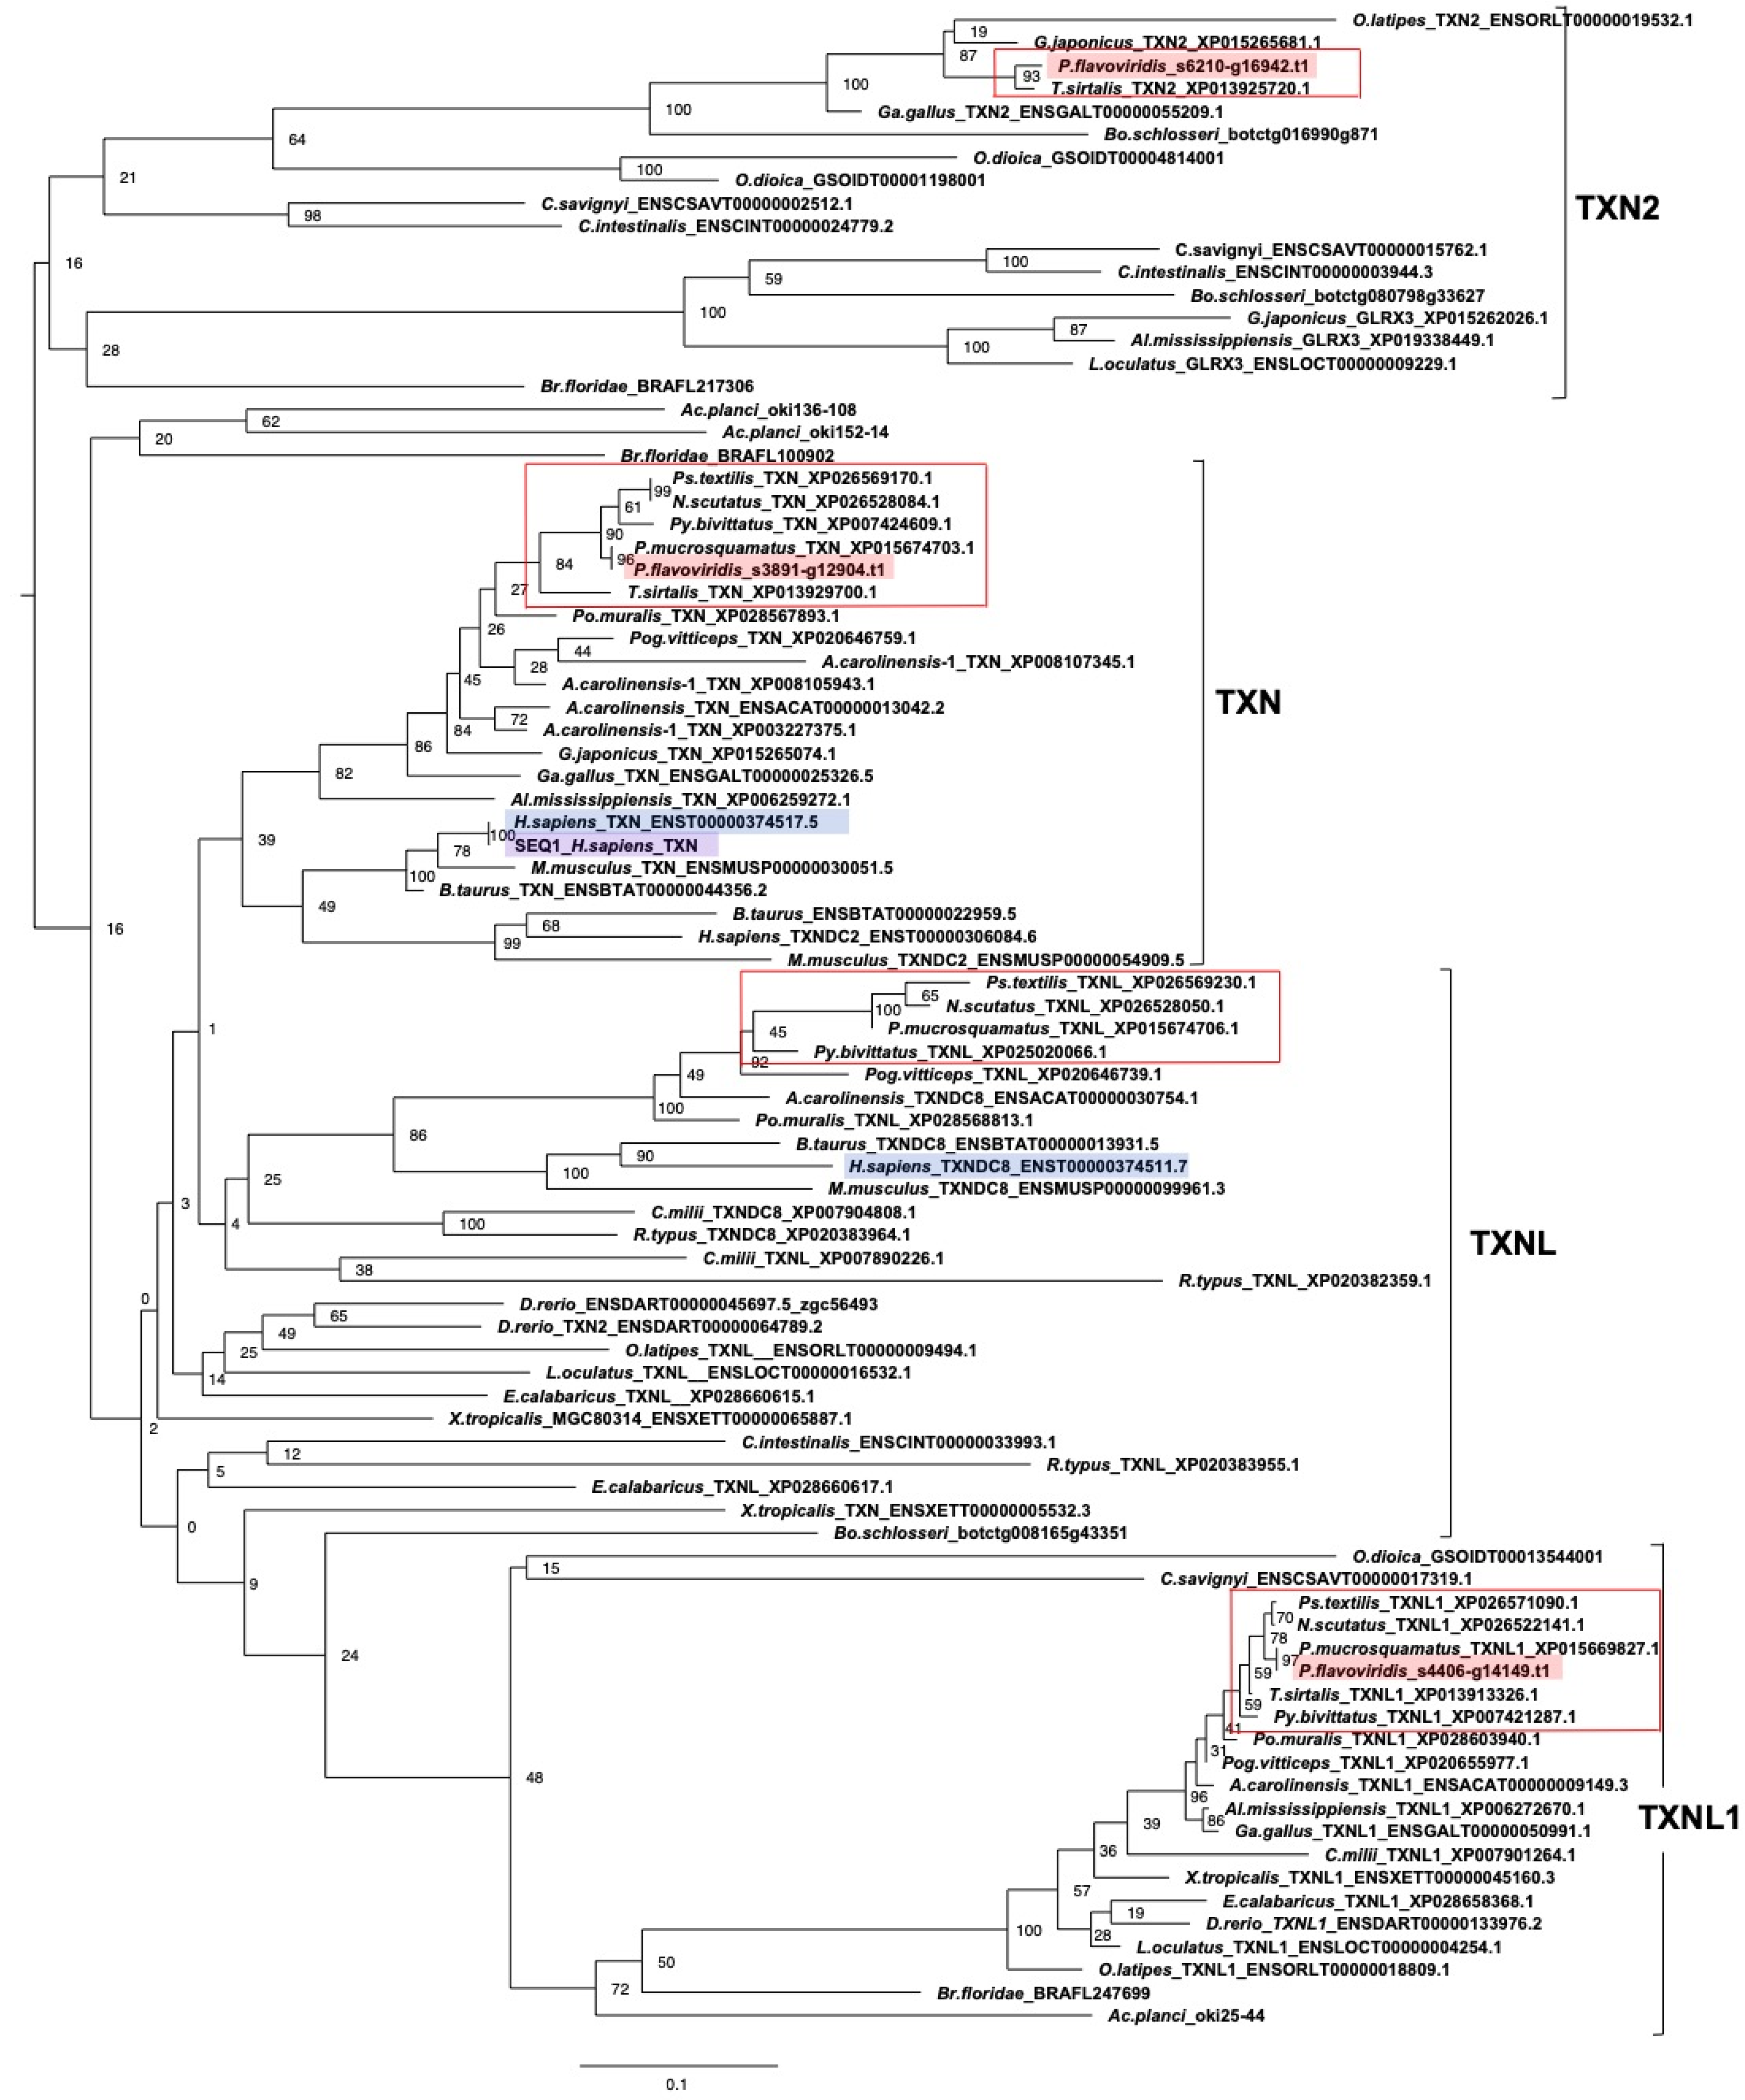
2.1. Identification of Candidate Genes for Modification, Folding, and Quality Control of Venom Proteins

In the Protobothrops flavoviridis whole-genome decoding project, we carried out thorough transcriptomic analyses of 20 organs and tissues of an adult snake, which included the venom gland (sample name: venom gland-specimen#1), venom fang-forming tissue, lung, liver, kidney, small intestine, colon, stomach, pancreas, heart, masseter muscle, brain (brain-specimen#1), eye, nose, pit organ, spleen, and ovary (accession # DRA006600, see Supplementary Table S2 of Shibata et al. [9]). In addition, we also analyzed mRNAs of the venom gland (venom gland-specimen#2), brain (brain-specimen#2), and accessory gland of another adult, as well as the neonate venom gland, and fetal fibroblasts from a neonate. We carried out comprehensive comparative analyses of these data to identify genes for enzymes with protein modification functions. All mRNAs were identified and characterized from habu whole-genomic information [9]. We expected that genes for venom-protein modification enzymes would also be more highly expressed in venom glands than in other organs and tissues, such as in digestive organs.
We first identified the 50 genes that are most highly expressed in habu venom glands (Table 1 and Supplementary Table S1). Based on the number of transcripts per million reads (TPM), there were no differences between the expression profiles of the two brains. The two venom glands also showed similar profiles of highly expressed genes. However, there were different numbers of venom protein genes in these two specimens (Table 1 and Supplementary Table S1). The venom gland from the second adult specimen included more venom protein genes (19 genes) (Table 1) than that from the first specimen (12 genes) (Supplementary Table S1), suggesting that the second specimen (Table 1) may have been actively synthesizing venom (Supplementary Table S1). Therefore, we profiled the expression of protein modification enzymes in the venom gland from the second specimen as a main focus (Table 1).
Table 1 shows the 50 most highly expressed genes in the venom gland from the second specimen. Fourteen of the top sixteen genes were categorized as venom protein genes: including bradykinin-potentiating and C-type natriuretic peptides (CNP01), svPLA2-02 and -03, svMP06, svPLA2-01, -07, and -08, svMP07 and -08, svCTLP06, and -07, svMP04, svCLTP08, svMP05, svSP04 and LAAO01 (Table 1), which were all the same as in the venom gland from the other adult specimen except for svSP04 and LAAO01 (Supplementary Table S1). Moreover, other venom protein genes, such as CRISP01 and 02, svSP11, svMP09 and -10, svMP01, and sv5Nase, were also included in the top 50 genes of only the second adult specimen (Table 1).
Interestingly, we found that a gene for protein disulfide isomerase (PDI), also known as the beta-subunit of prolyl 4-hydroxylase (P4HB), was the ninth most highly expressed gene in one adult venom gland (Table 1) and the sixth most highly expressed in the other specimen (Supplementary Table S1). In addition, genes for Selenoprotein M, Calreticulin, and protein disulfide isomerase A3 (SELENOM, CALR and PDIA3) were ranked as the 19th, 23rd, and 31st most highly expressed genes, respectively (Table 1). These four genes are likely involved in the folding and quality control of venom proteins. The high expression profiles of these genes were further confirmed with another venom gland from the first adult specimen and in neonate venom glands (Figure 1 and Table 2). The high expression of PDI genes in habu venom glands was consistent with the PDI expression profile of Crotalus adamanteus [14], suggesting that snake venom glands actively express genes not only for toxic proteins, but also for enzymes that fold and modify proteins in other vertebrate tissues.
Table 1 also shows that many genes associated with translation and protein biosynthesis, including 40S and 60S ribosomal proteins, elongation factor 1 (EF1)-alpha 1 and EF1-beta are highly expressed in habu venom glands, an observation reported previously [14,15].

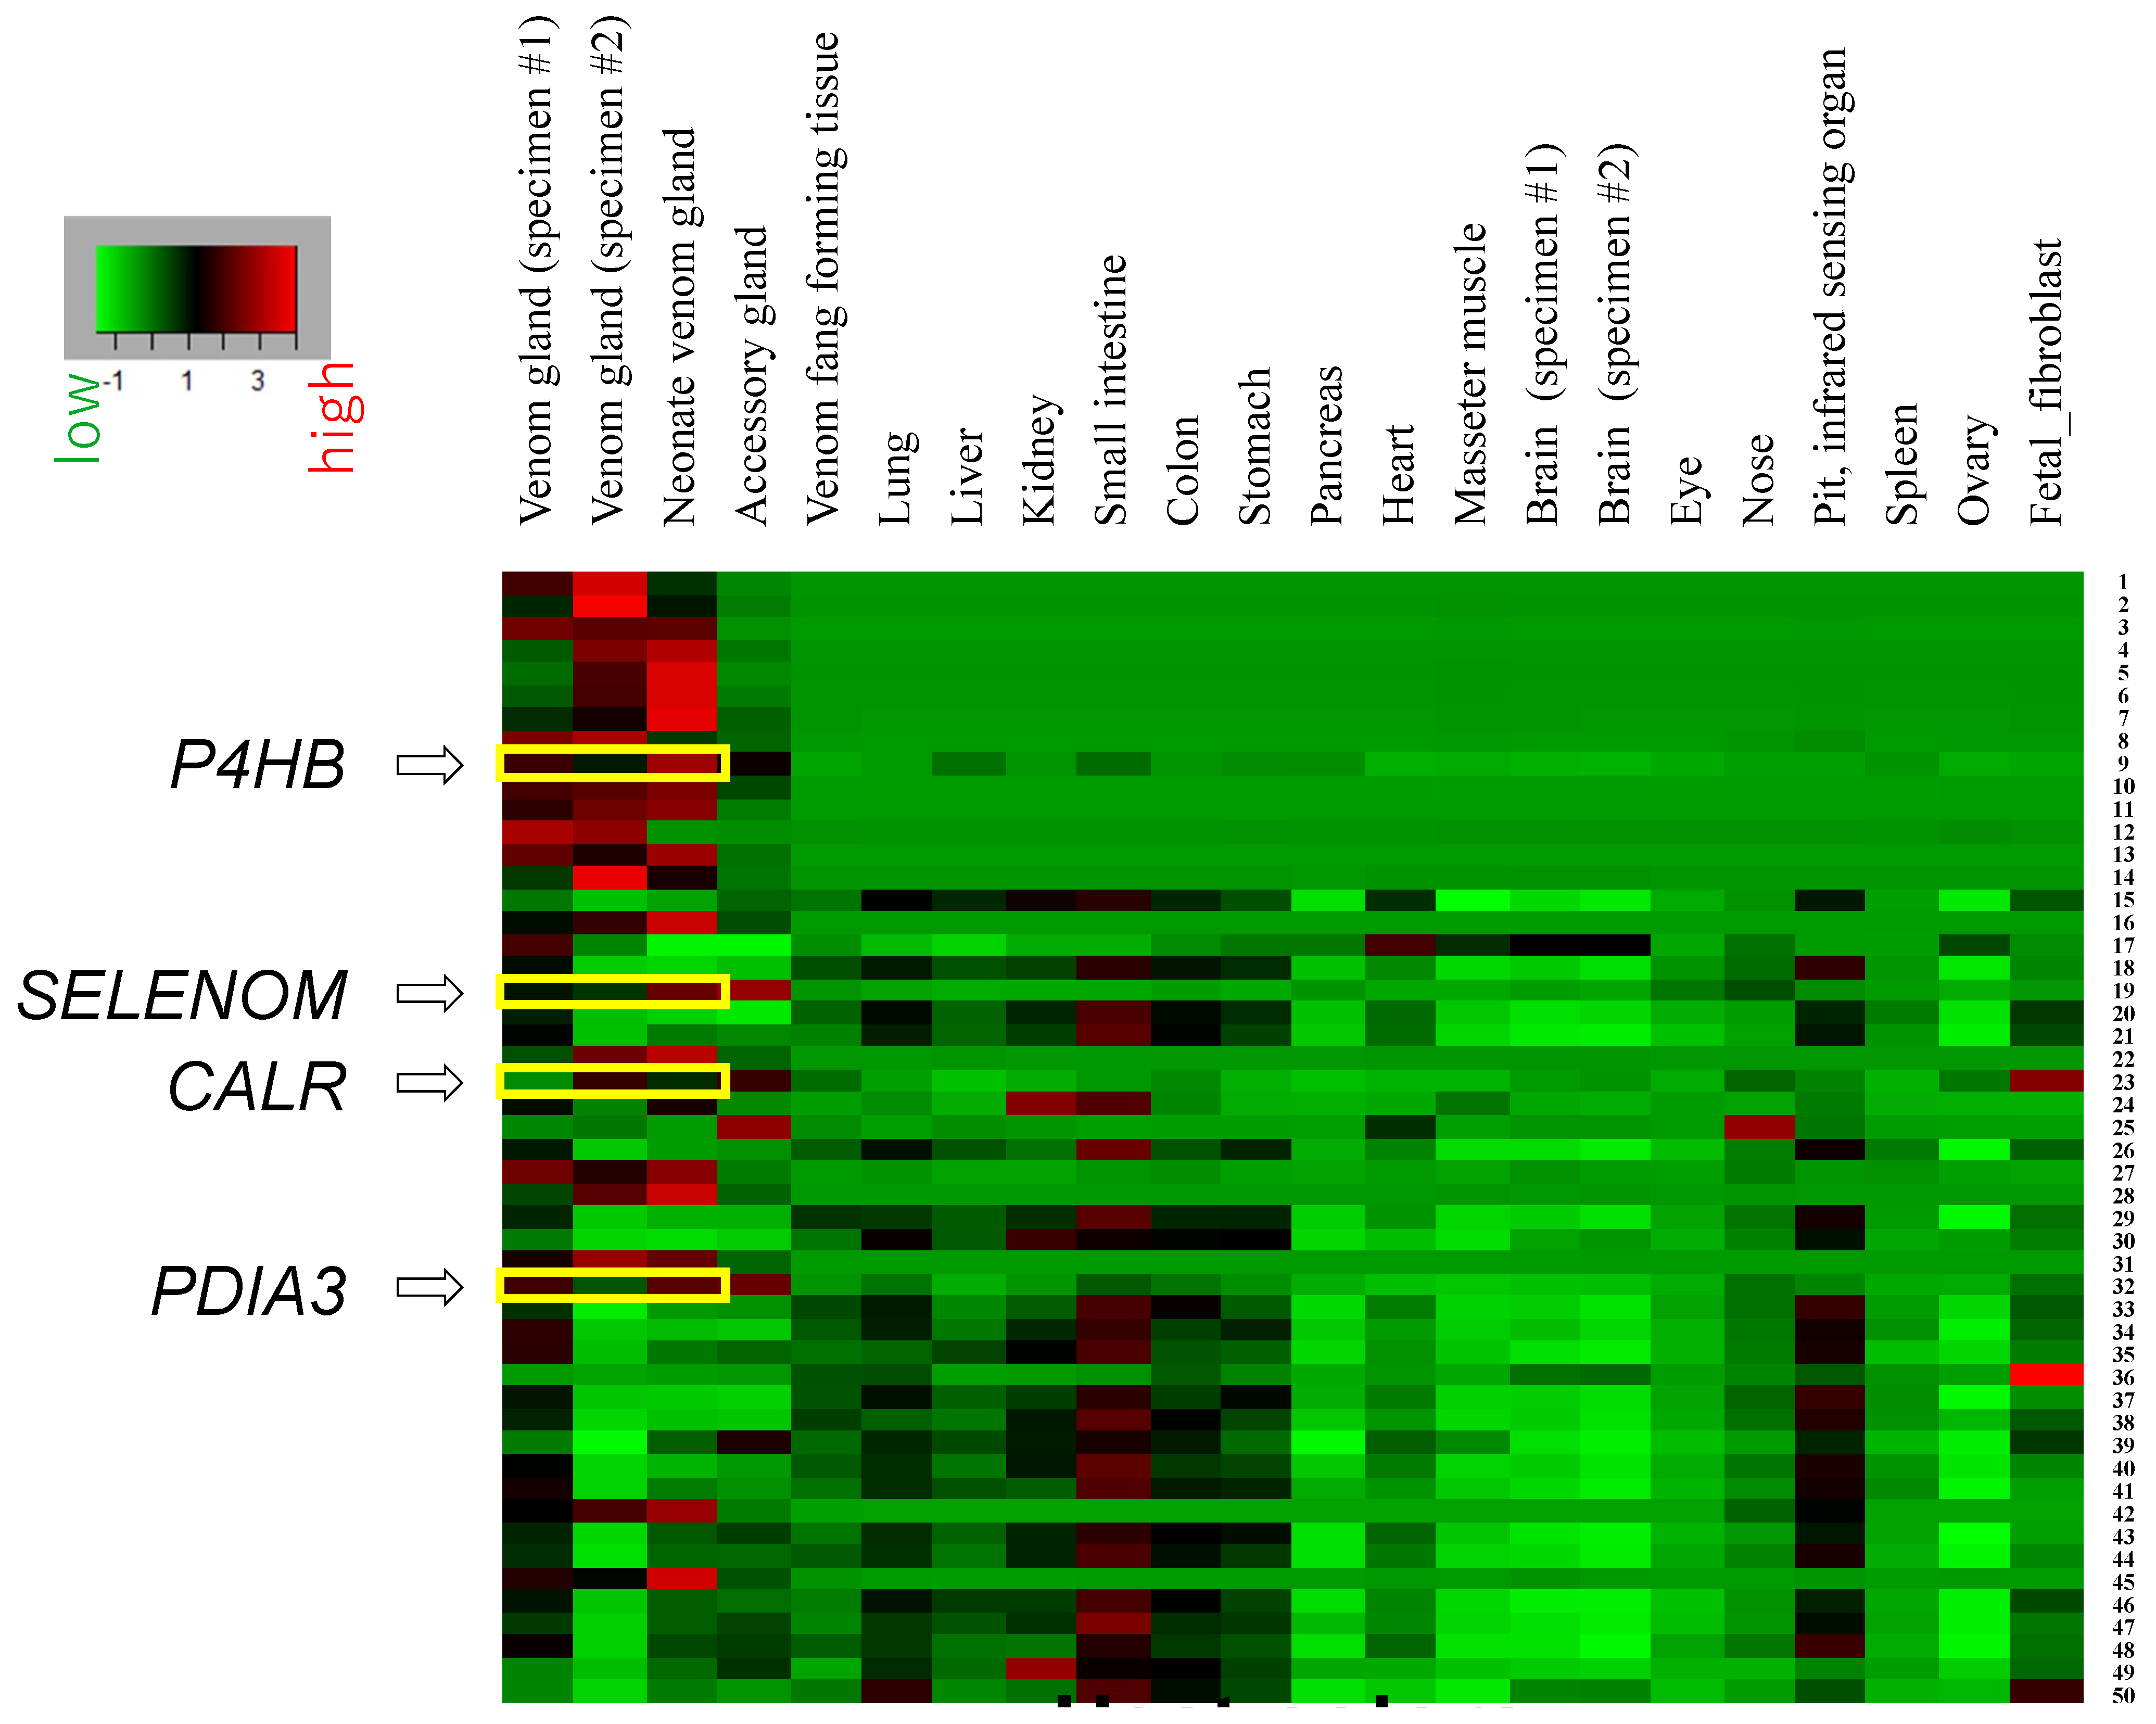
2.2. Expression Profiles of Highly Active Genes, P4HB, SELENOM, CALR, and PDIA3, Are Specific to Venom Glands

Our analysis confirmed the highly active expression of P4HB, SELENOM, CALR, and PDIA3 genes in habu venom glands. However, since P4HB, SELENOM, CALR, or PDIA3 participate in protein folding and modification as part of the ER chaperone system, the active expression of these genes in the venom gland does not necessarily imply the lower expression of these genes in other organs and tissues. To examine the expression profiles of these genes in various organs, we compared the expression levels of the top 50 venom gland genes in other tissues (Figure 1). The expression profiles of those 50 genes were shared only by adult and neonate venom glands, but not by other tissues, clearly indicating that the venom gland gene expression profile is unique and specific and is quite distinct from those of other tissues (Figure 1 and Table 2). Interestingly, the expression profile of the neonate venom gland was similar to that of two adult venom glands. This similarity is especially clear for chaperone proteins, such as PDIs, Selenoprotein M, and Calreticulin (Figure 1). In the 50 most highly expressed venom gland genes, another common expression profile was seen among the lungs, kidneys, small intestine, colon, stomach, and pit organ (Figure 1). In the case of genes encoding ribosomal proteins, high expression profiles were observed not only in venom glands, but also in the lungs and small intestine.

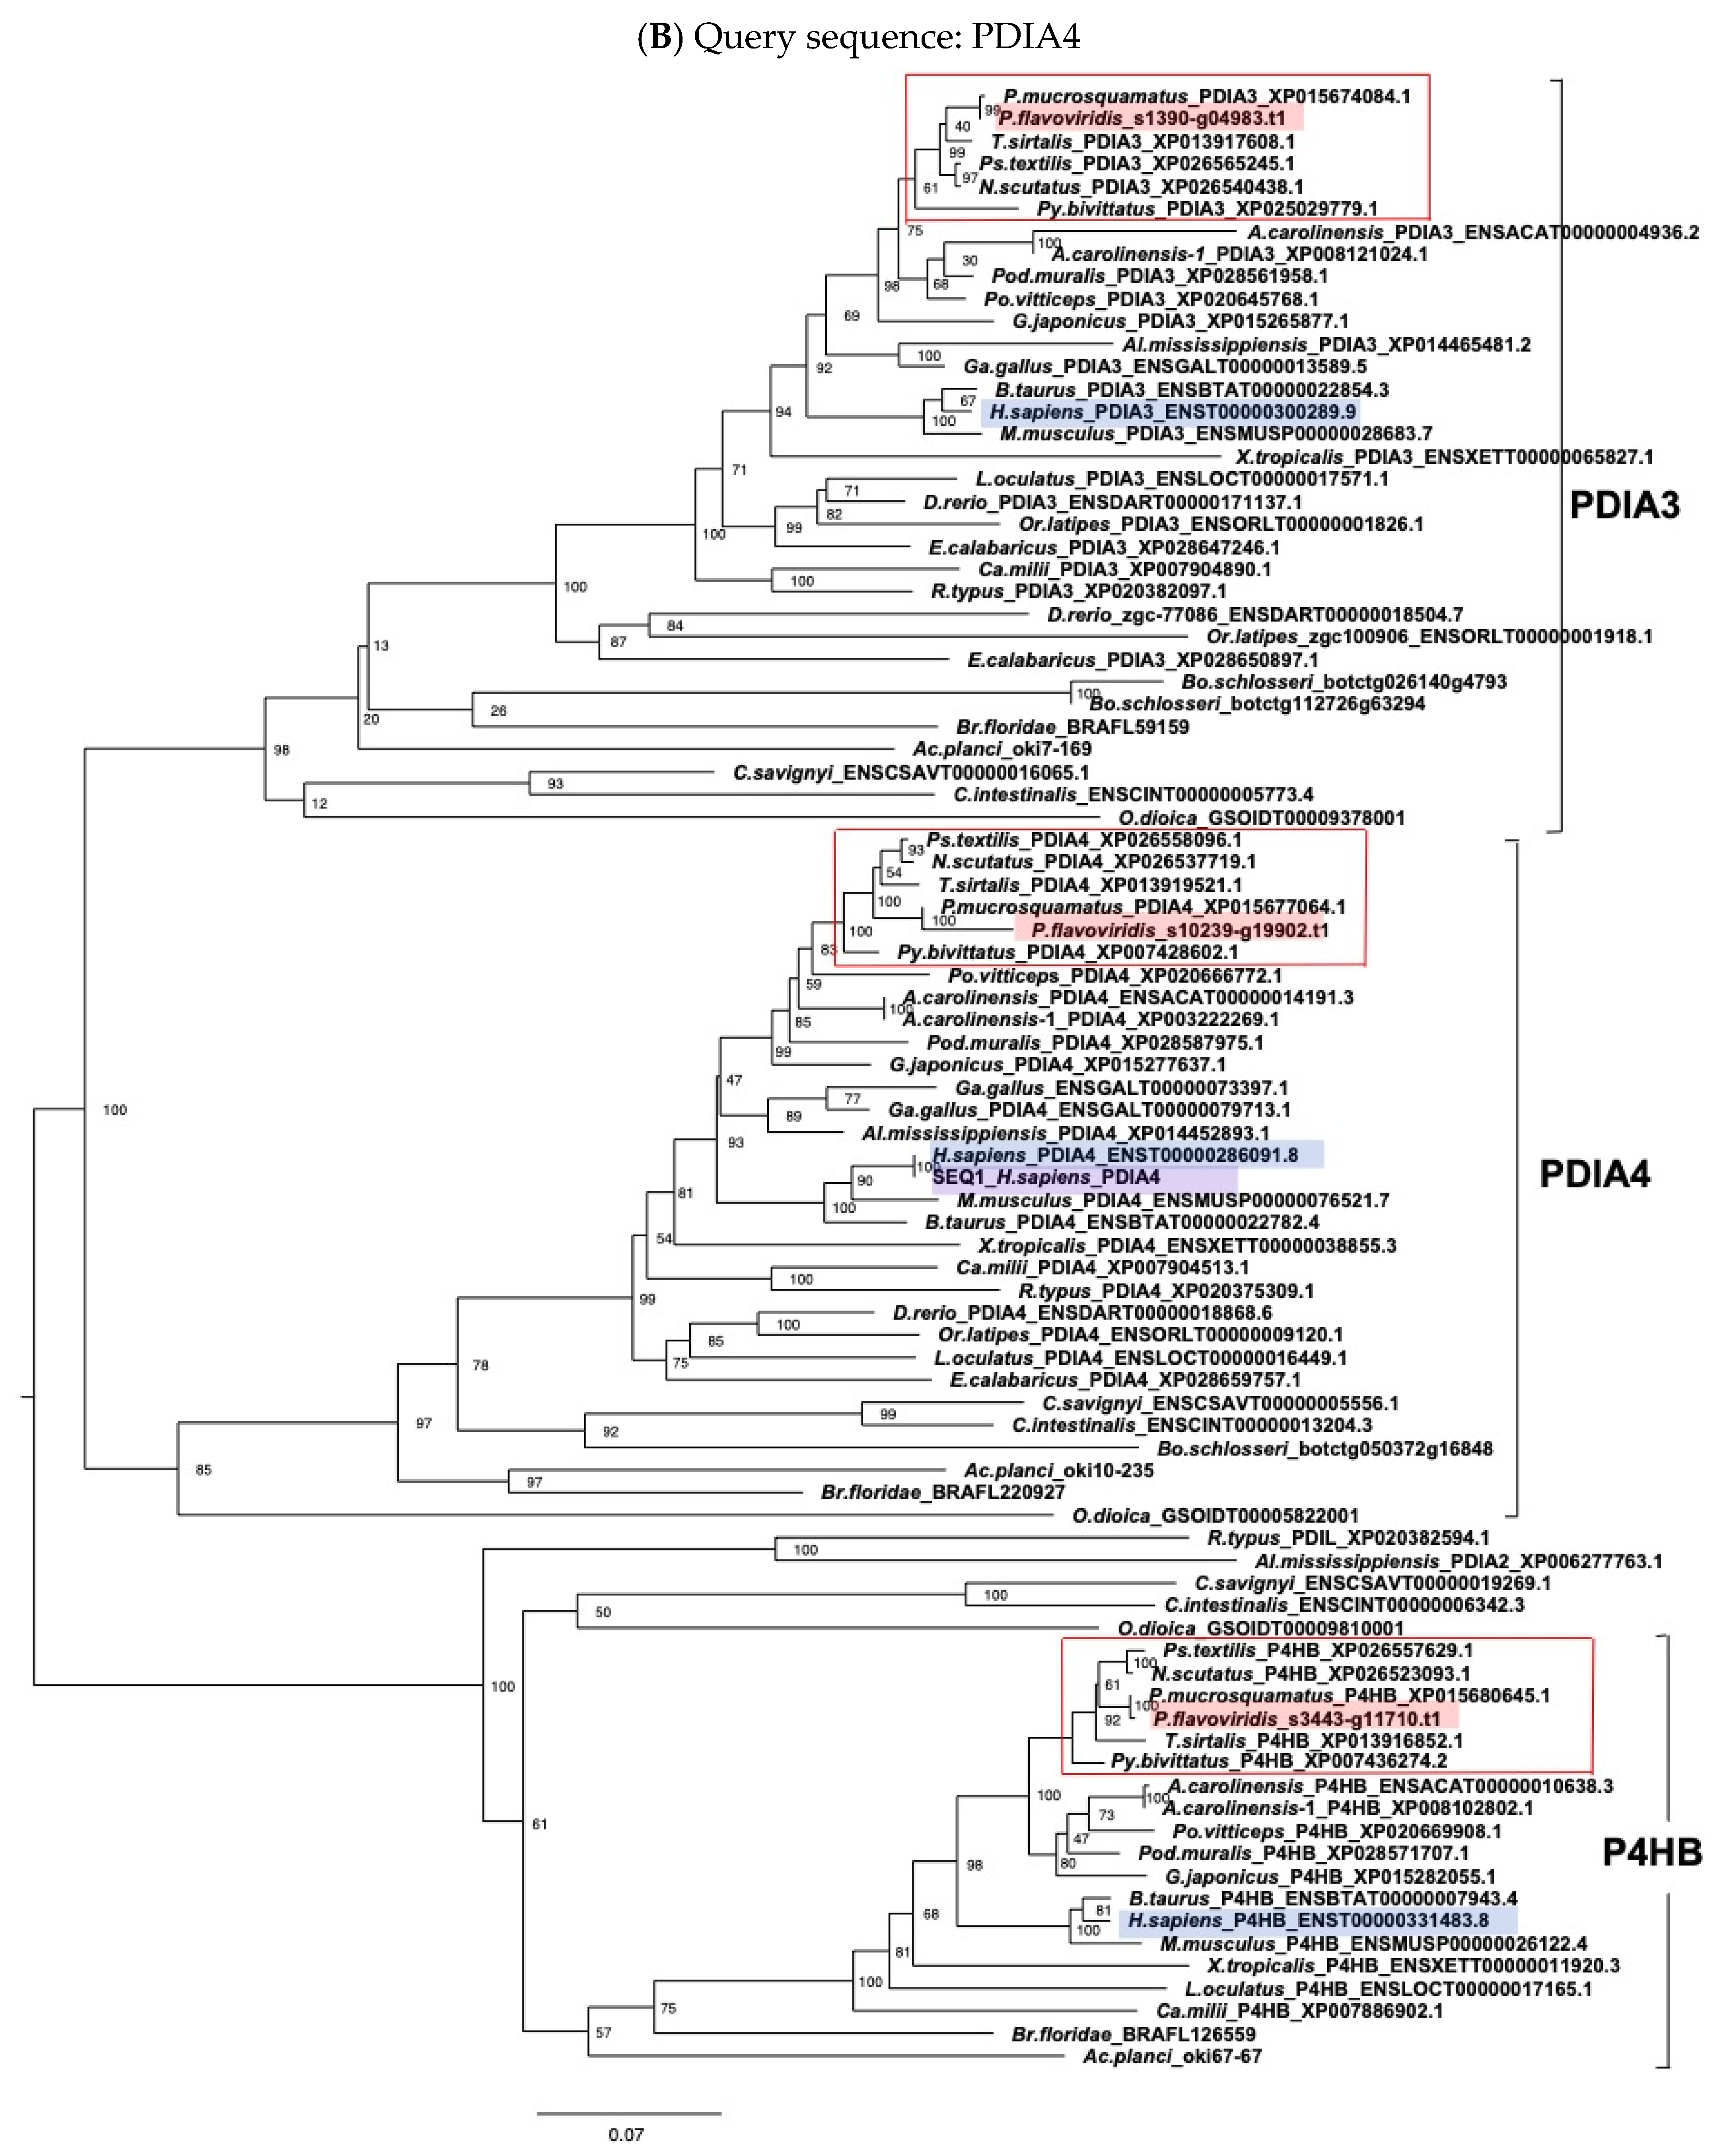
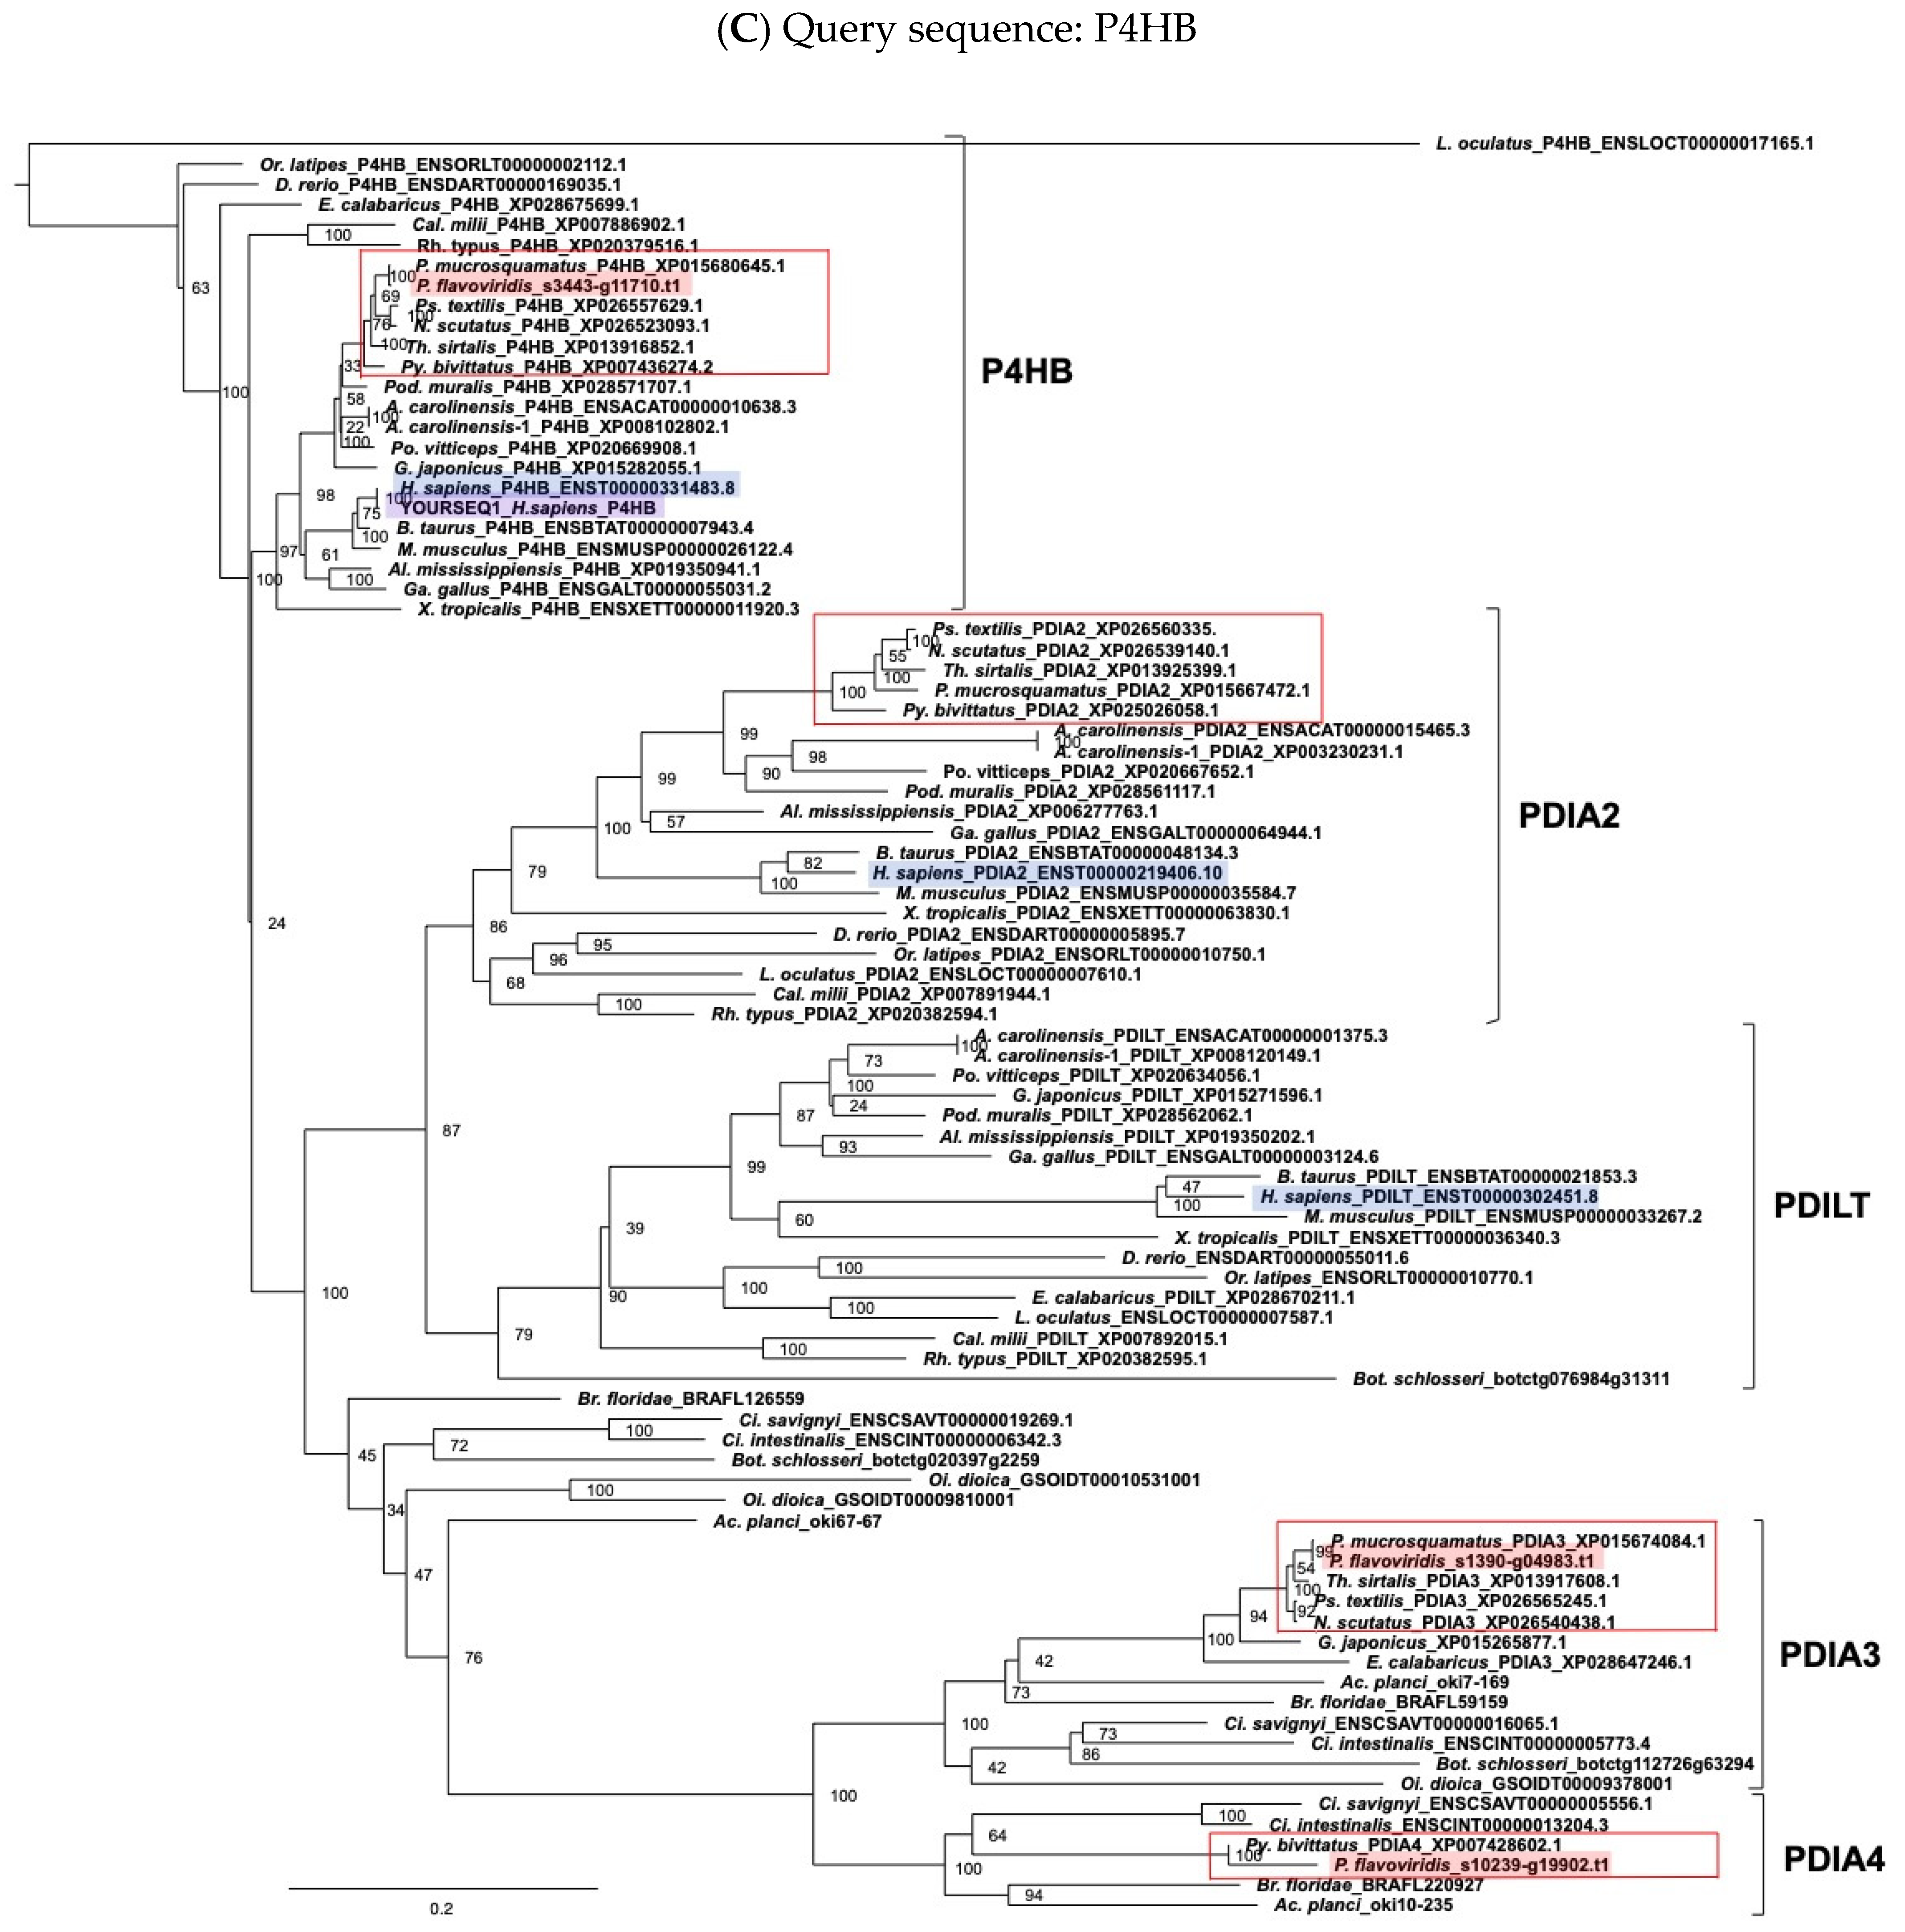
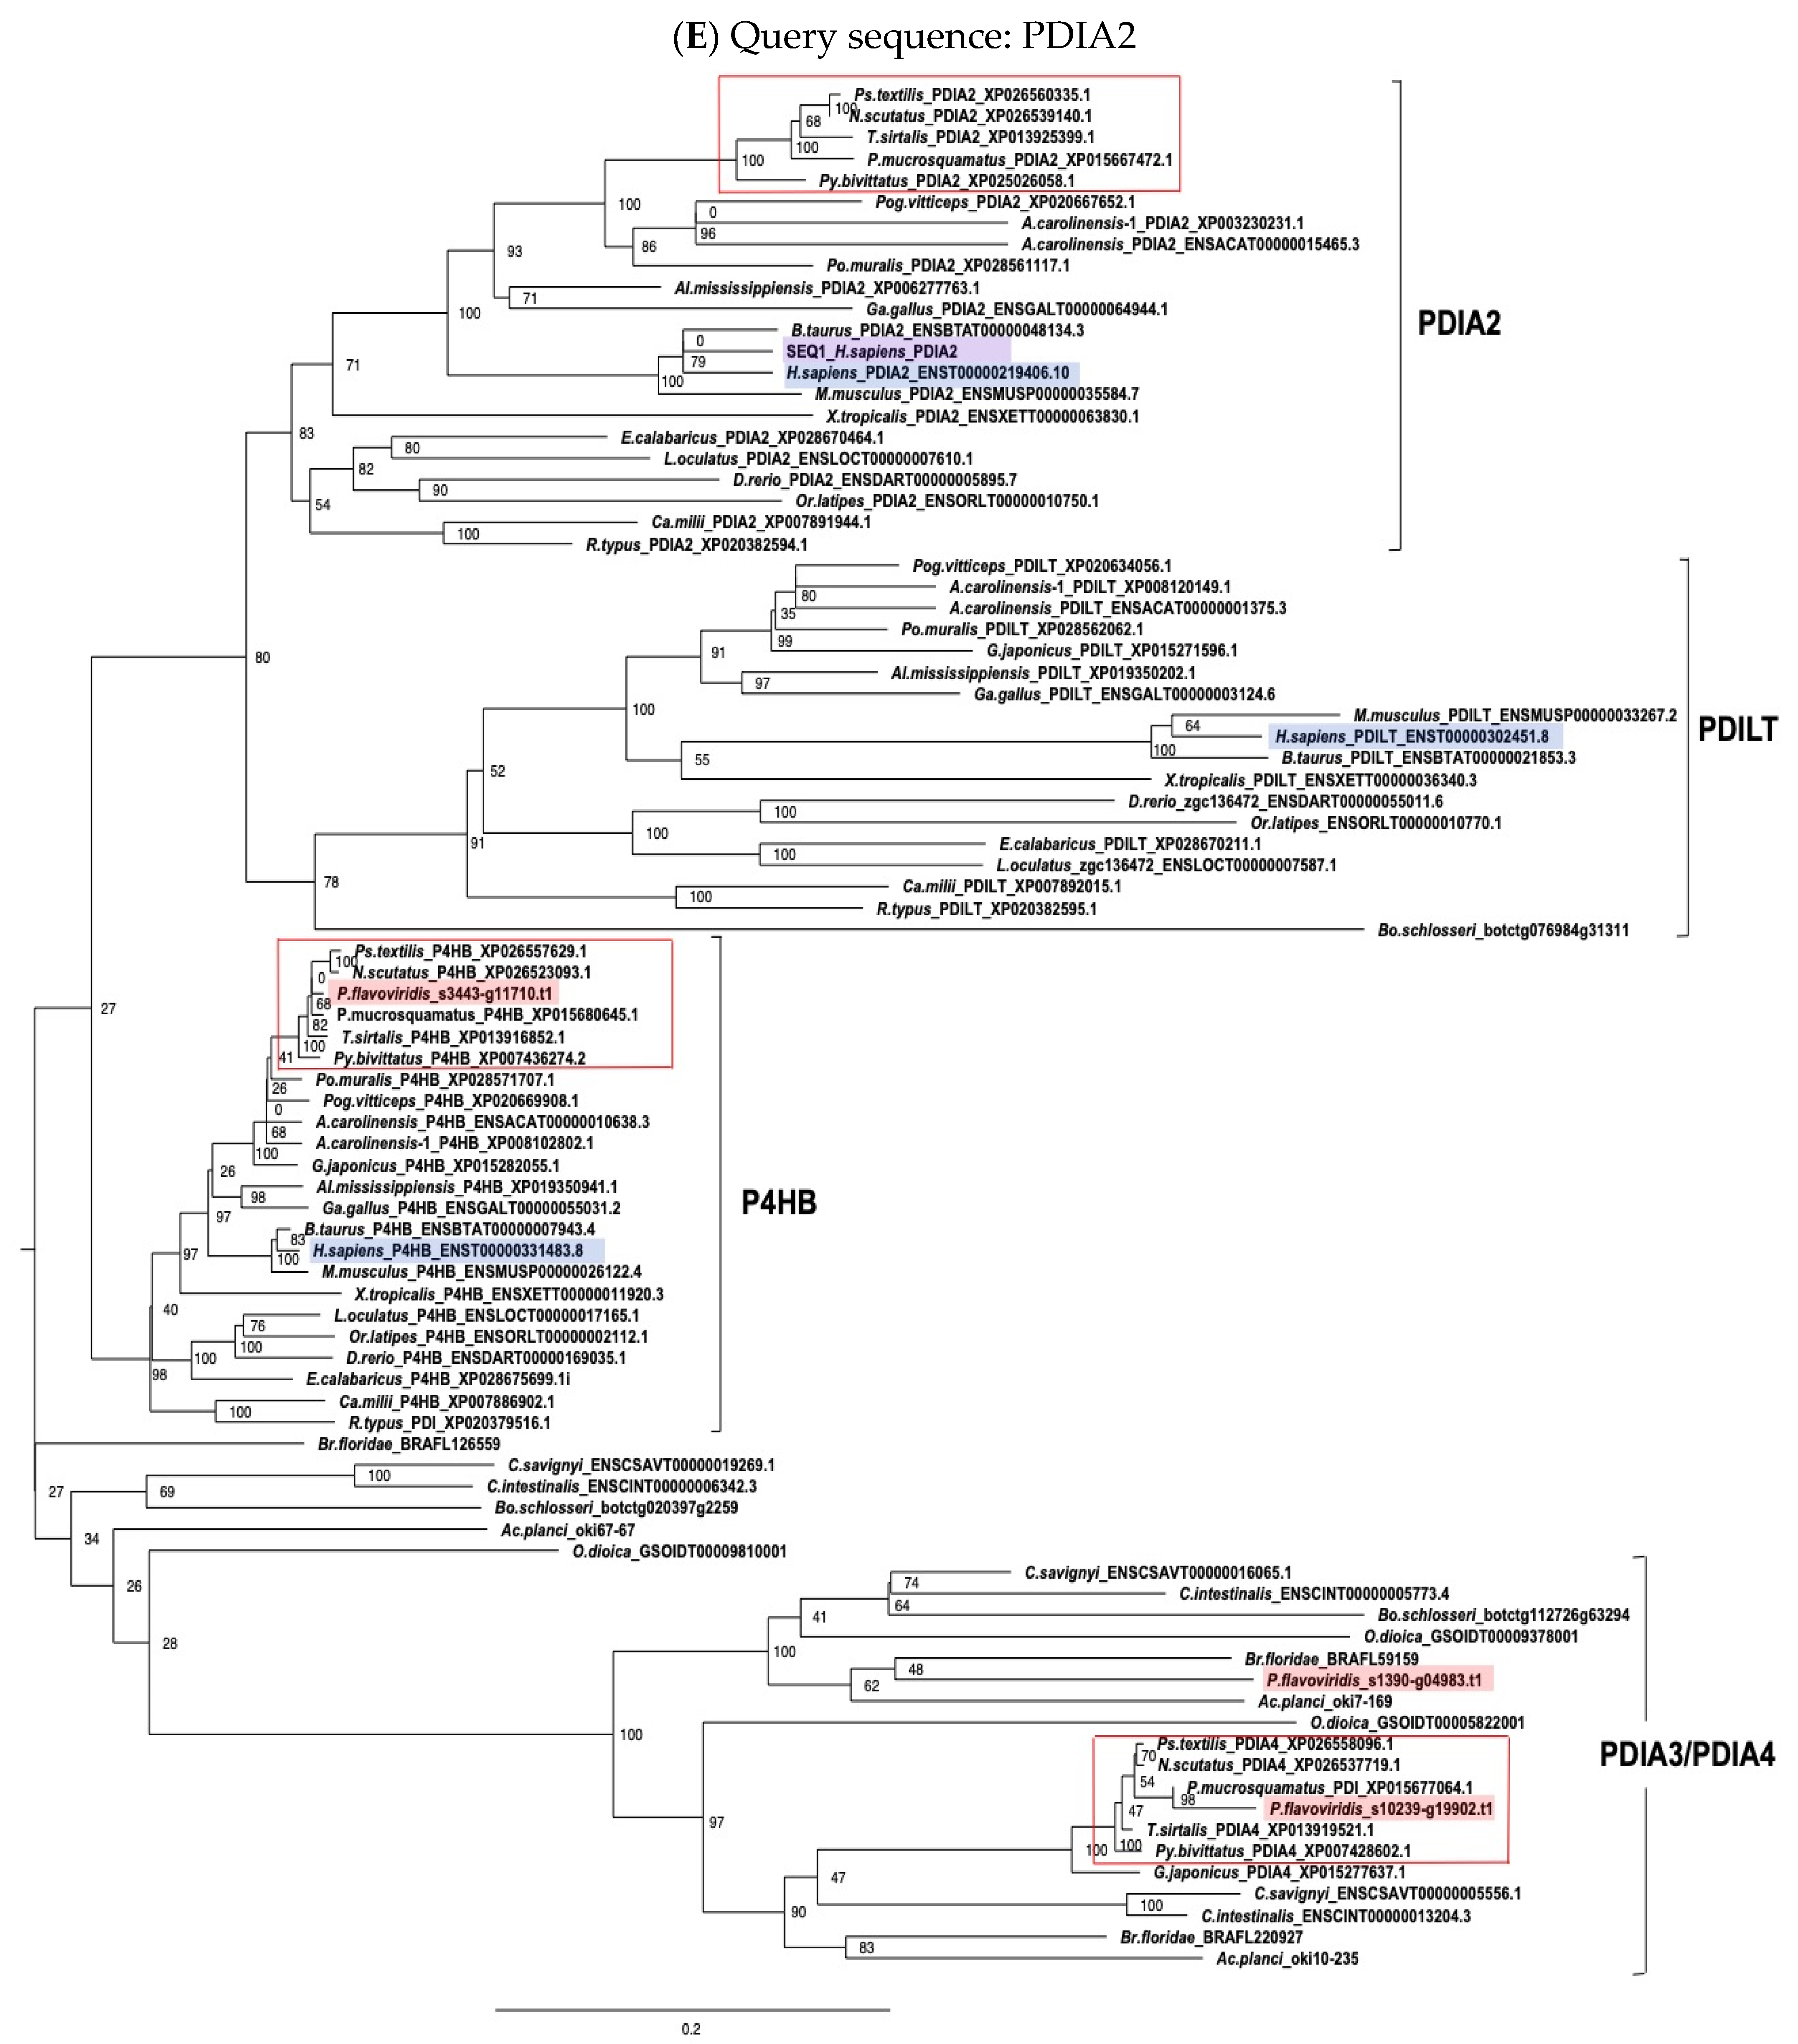
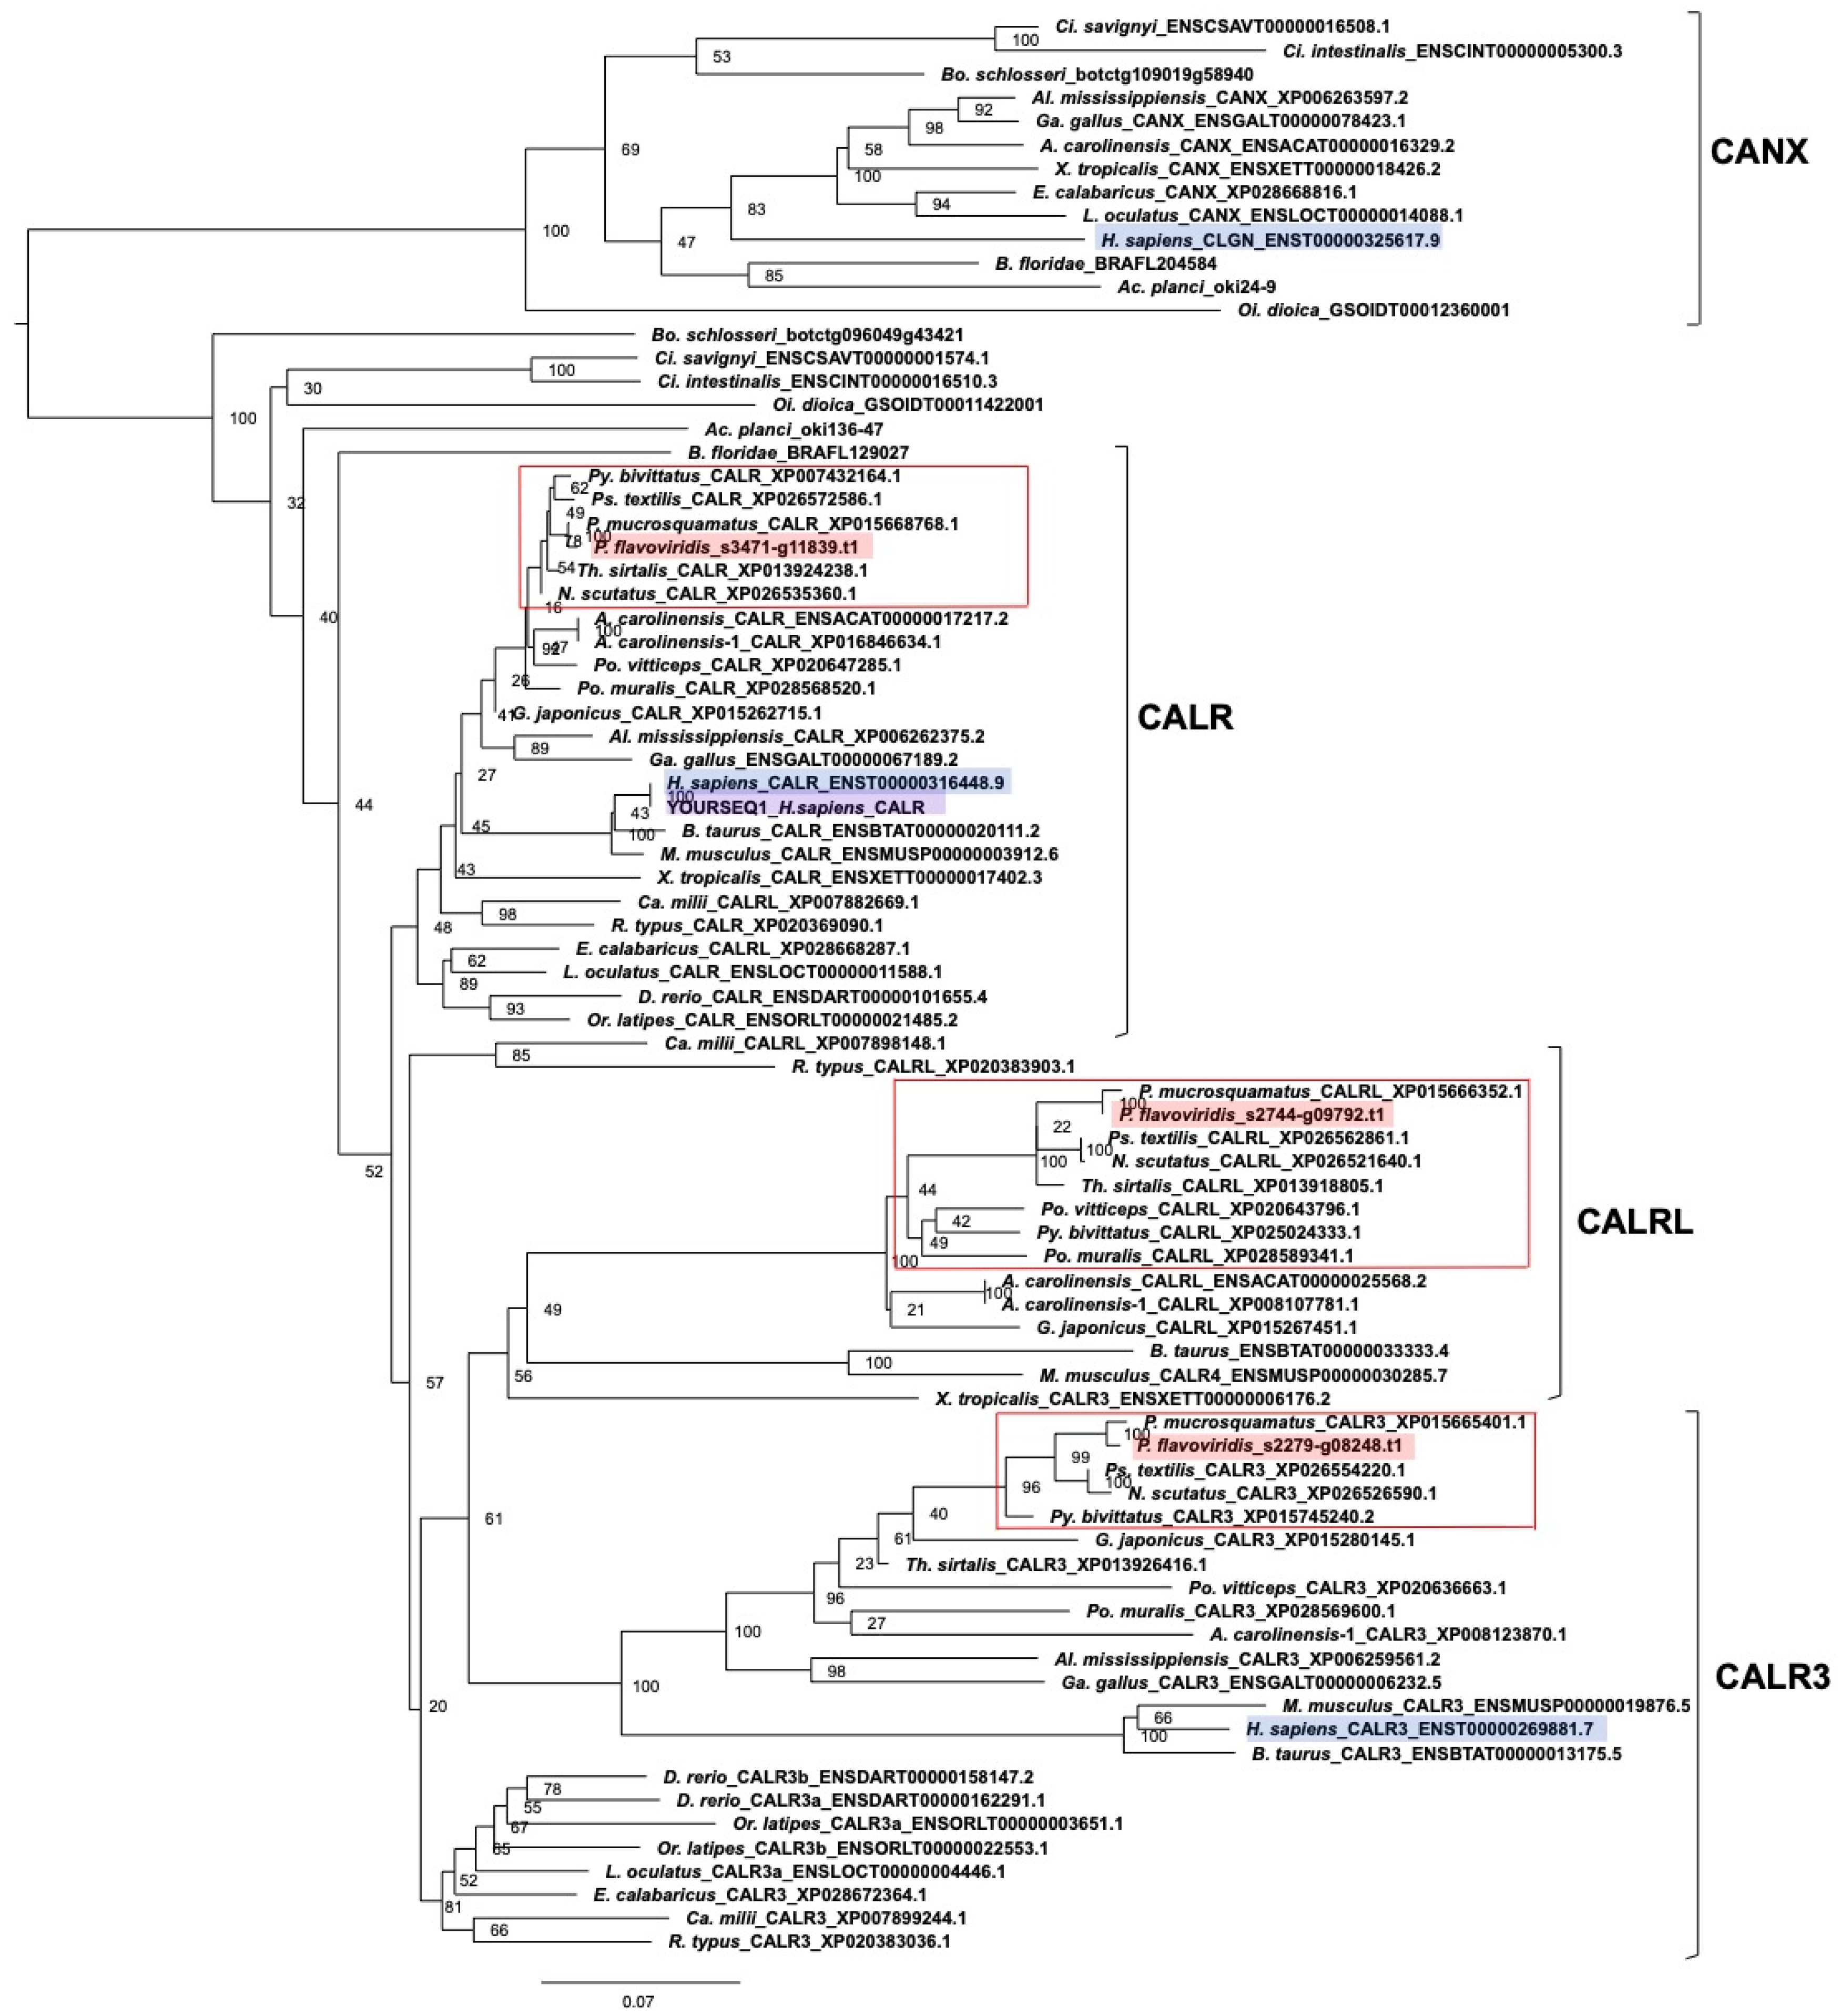
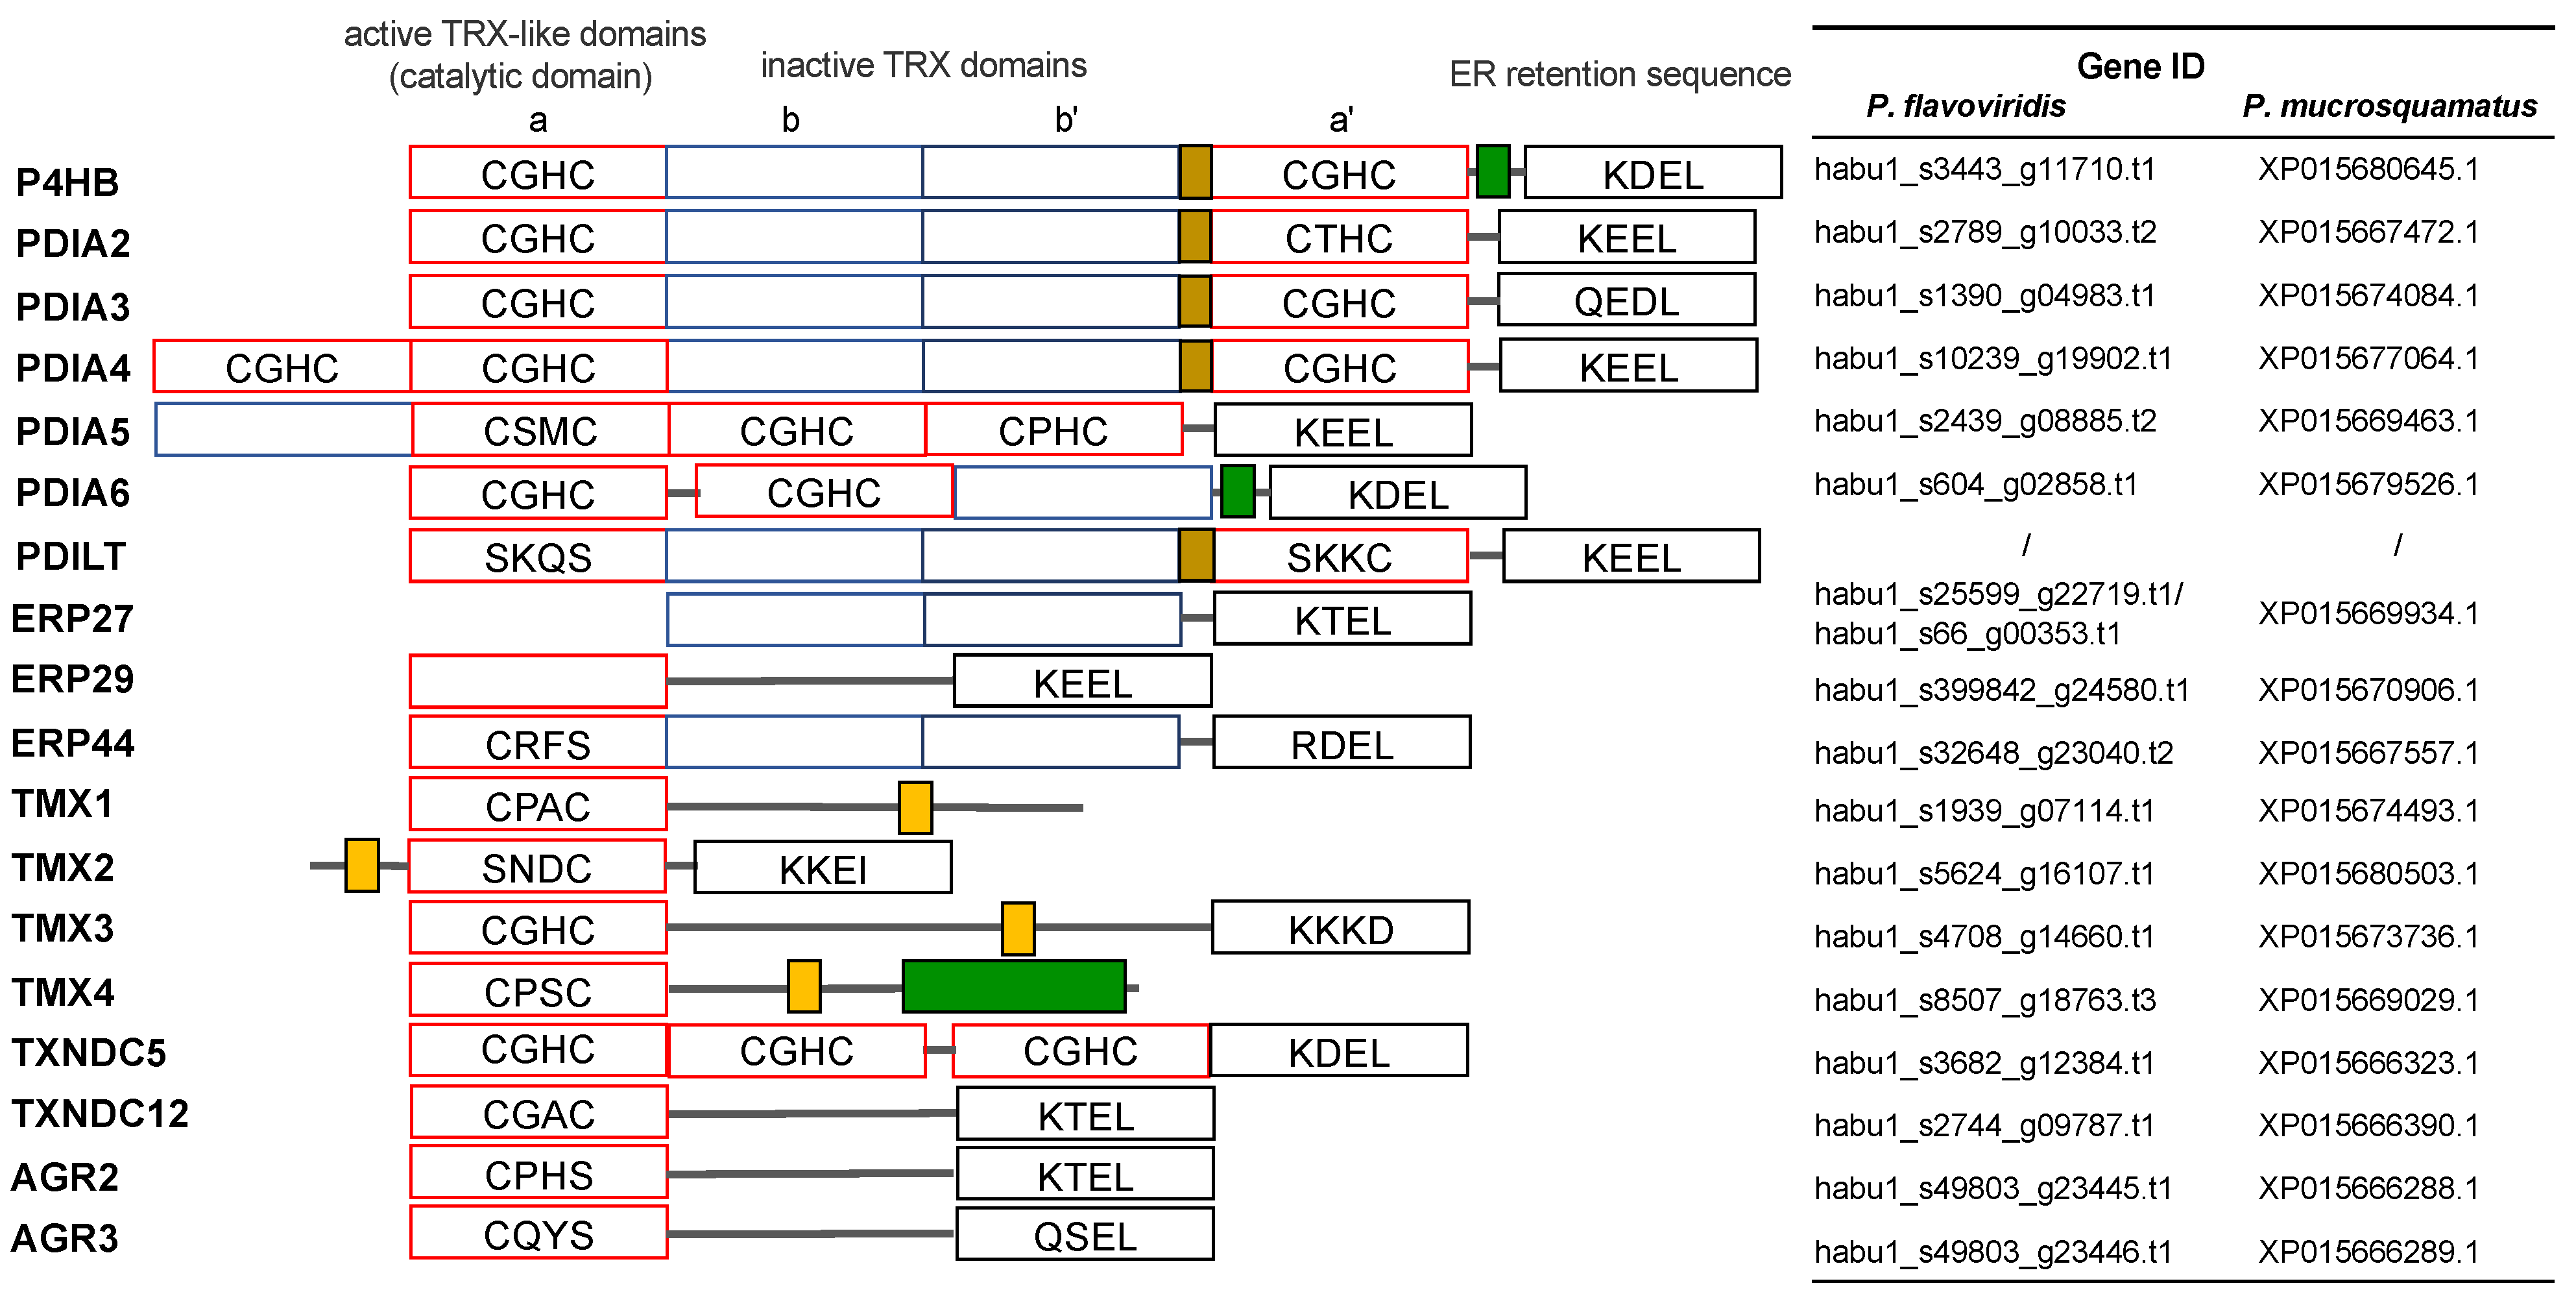
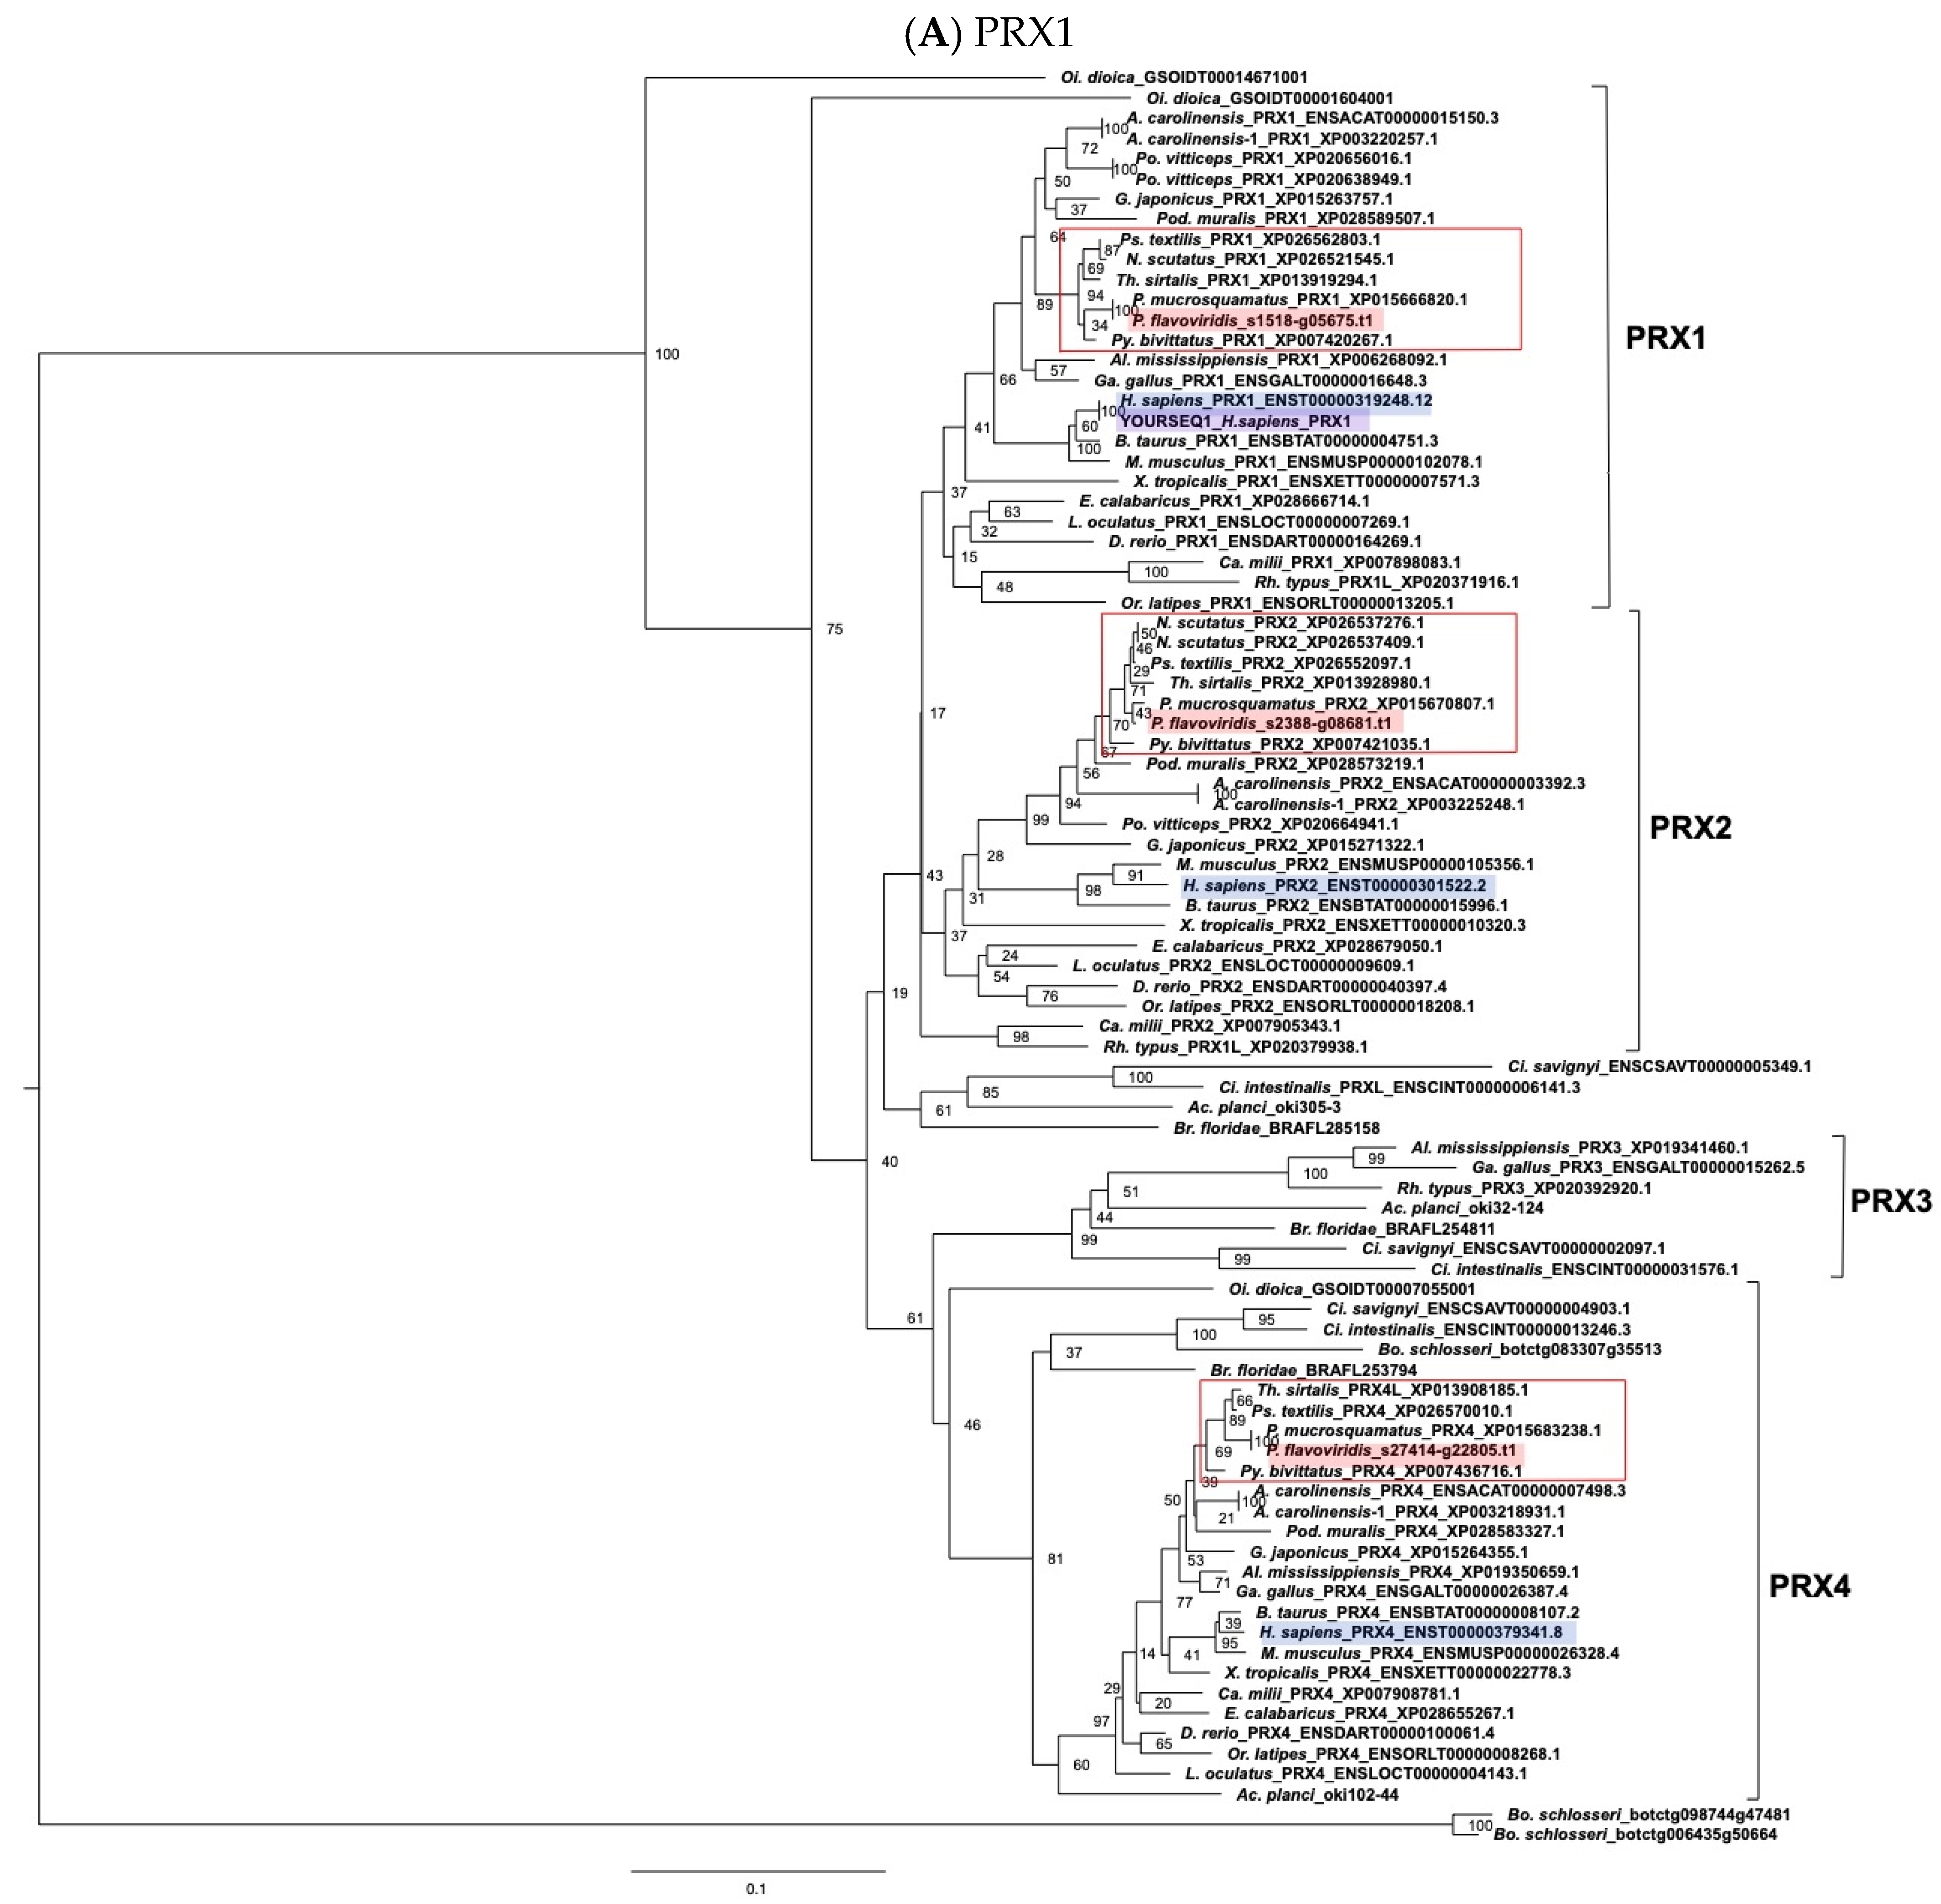
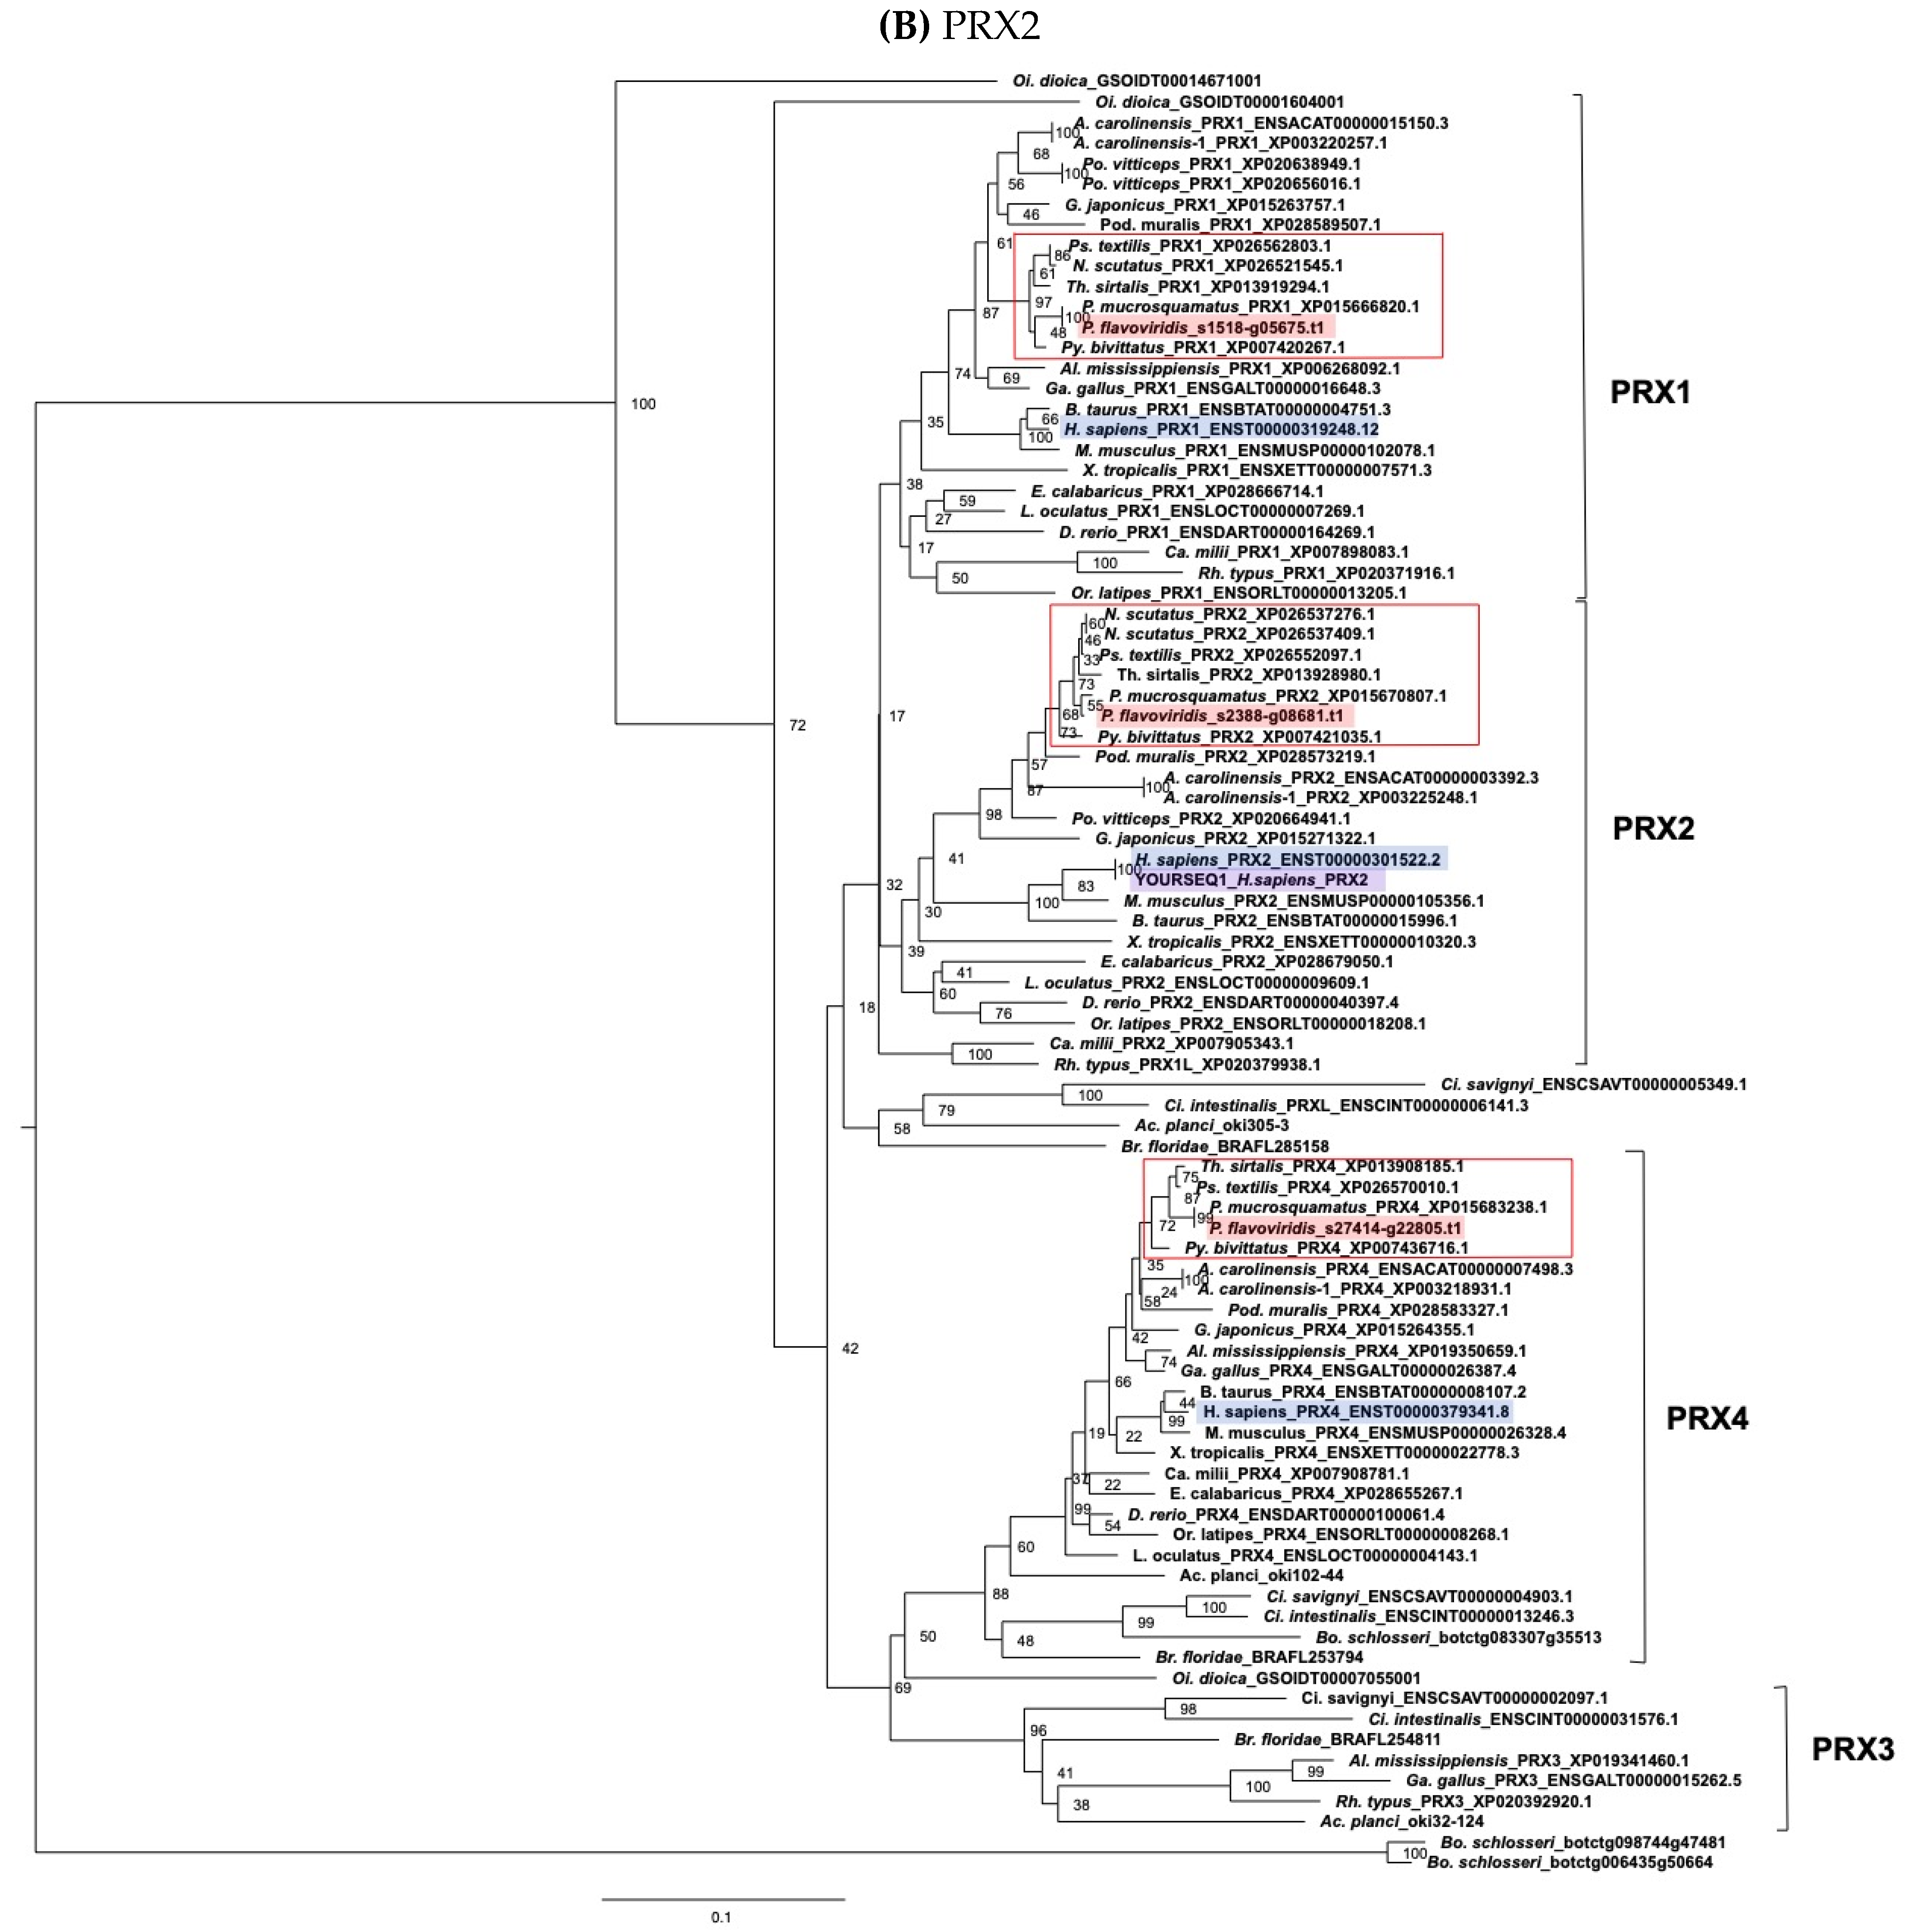
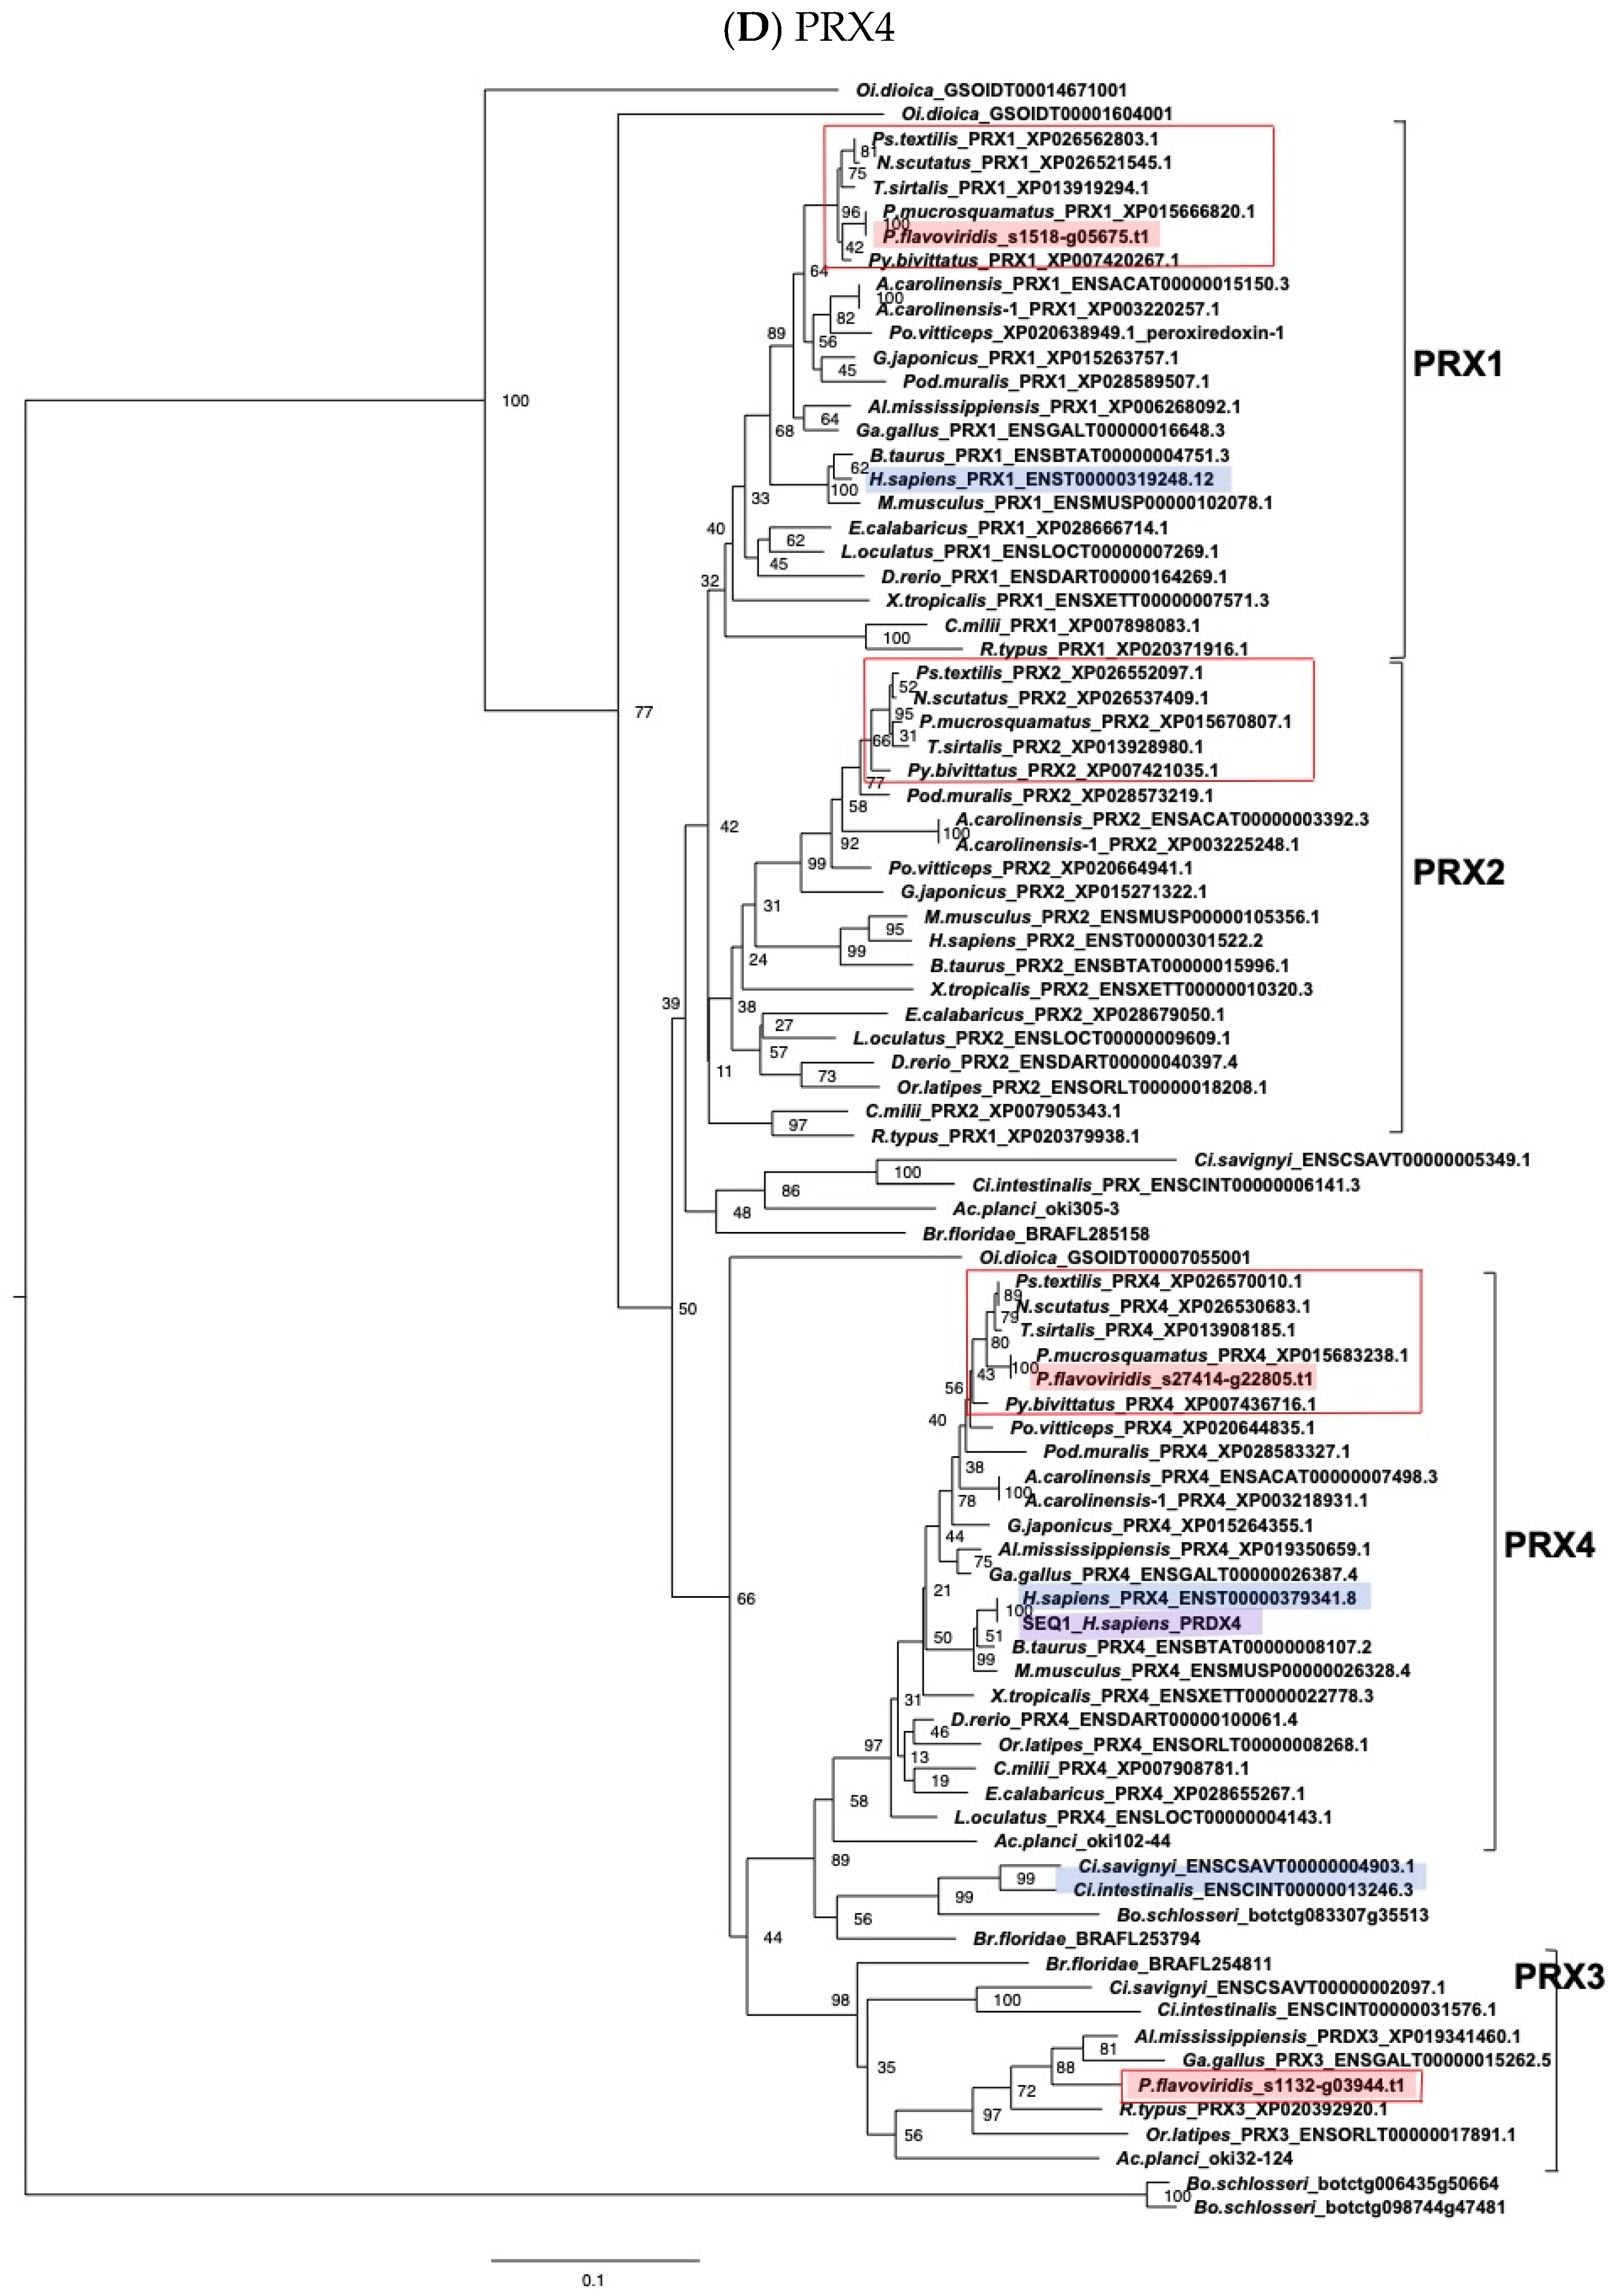
2.3. Characterization of Genes for PDI Family Proteins and PDI-Related Proteins in Habu Venom Glands

As already mentioned, major venom proteins, such as PLA2, MPs, CTLP, and 3FTXs contain many disulfide bonds. Genes for PDI are ultra-highly expressed in venom glands. Therefore, to identify and characterize genes for PDI family members (Figure 2) in the habu genome, we carried out molecular phylogenetic analysis, taking advantage of the habu whole genome. We constructed molecular phylogenetic trees using ORTHOSCOPE, a species tree-based ortholog group identification tool [16], with human PDIA3, PDIA4, P4HB, PDILT, PDIA2 (Figure 3), PDIA5 (Supplementary Figure S1), and PDIA6 (Supplementary Figure S2) as query sequences for each. In addition, genes for other PDI family-related proteins were also analyzed using ORTHOSCOPE to identify orthologs in P. flavoviridis. These PDI family-related proteins include oxidoreductases, such as ERP27 (Supplementary Figure S3), ERP29 (Supplementary Figure S4), and ERP44 (Supplementary Figure S5), anterior gradient protein 2 (AGR2) (Supplementary Figure S6), anterior gradient protein 3 (AGR3) (Supplementary Figure S7), and transmembrane oxidoreductases, such as TMX1, TMX2, TMX3, and TMX4 (Supplementary Figures S8–S11), CALR members (Figure 4), TXNDC5 (Figure S12), and TXNDC12 (Supplementary Figure S13), redox partner proteins of PDIs, and selenoproteins. Genes identified in the habu (P. flavoviridis) genome and in transcriptomes of a related snake (P. mucrosquamatus) are summarized in Figure 2 and Table 2.
(a)
PDI family
Molecular phylogenetic trees of PDI family genes were estimated with ORTHOSCOPE using human PDIA3 (Figure 3A), PDIA4 (Figure 3B), P4HB (Figure 3C), PDILT (Figure 3D), and PDIA2 (Figure 3E) as query sequences, showing that these trees constitute discrete clades of PDIA3, PDIA4, and P4HB. Each clade contained one habu ortholog: habu1_s3443_g11710.t1 for the P4HB clade, habu1_s1390_g04983.t1 for the PDIA3 clade, and habu1_s10239_g19902 for the PDIA4 clade, indicating these habu gene model ID transcripts are the same genes as in humans. However, these molecular phylogenetic trees failed to support P. flavoviridis orthologs for PDIA2 (Figure 3E) and PDILT (Figure 3D). Interestingly, genes for PDILT were not found in snakes.
These PDI gene family phylogenetic trees also contain clades other than PDIA3, PDIA4, P4HB, PDIA2, and PDILT, so we next examined molecular phylogenetic trees of the other PDI gene family members, including the human and habu genomes. Molecular phylogenetic analysis using ORTHOSCOPE showed that the habu genome contains one copy of each of the same genes as humans in the PDIA5 (Supplementary Figure S1) and PDIA6 clades (Supplementary Figure S2), since in each clade there is only one habu ortholog of the human gene, without any habu paralogs. These results indicate that in contrast to the extensive duplication of habu venom protein genes, genes for the PDI family are present as only single copies in the habu genome, although they are actively expressed in venom glands.
  • (b) Other PDI family-related members
The molecular phylogenetic tree of ERP44 analyzed by ORTHOSCOPE using other PDI family member human ERP44 (Supplementary Figure S5) as query included the four main clades (ERP44, PDIA4, PDIA3, and P4HB) that contained one habu ortholog each, habu1_s32648_g23040.t2 for the ERP44 clade, habu1_s10239_g19902.t1 for the PDIA4 clade, and habu1_s1390_g04983 for the PDIA3 clade.
Molecular phylogenies of AGR2 and AGR3 using human genes as queries are shown in Supplementary Figures S6 and S7, respectively. First, the AGR2 and AGR3 trees both consisted of three main clades (AGR3, AGR2, and TXNDC12), and each clade contained one habu ortholog, habu1_s49803_g23446.t1 for the AGR3 clade, habu1_s49803_g23445.t1 for the AGR2 clade, and habu1_s2744_g09787.t1 for the TXNDC12 clade.
Molecular phylogenies of TMX1, TMX2, TMX3, and TMX4 (Supplementary Figures S8–S11, respectively) using human genes as queries indicated that a single habu ortholog exists in each clade: habu1_s1939_g07114.t1 for the TMX1 clade, habu1_s5624_g16107.t1 for the TMX2 clade, habu1_s4708_g14660.t1 for the TMX3 clade, and habu1_s8507_g18763.t3 for the TMX4 clade.
Molecular phylogenetic trees for TXNDC5 and TXNDC12 using each human gene as a query (Supplementary Figures S12 and S13) also indicated that the tree for TXNDC5 contains three main clades (PDIA4, PDIA6, and TXNDC5), each of which includes a single habu ortholog: habu1s_10239_19902.t1 for the PDIA4 clade, habu1_s604_g02858.t1 for the PDIA6 clade, and habu1_s3682_g12384.t1 for the TXNDC5 clade. The tree for TXNDC12 contains the three main clades (AGR2, AGR3, and TXNDC12) (Supplementary Figure S13), and each clade contains a single ortholog: habu1_s49803_g23446.t1 for the AGR3 clade, habu1_s49803_g23445.t1 for the AGR2 clade, and habu1_s2744_g09787.t1 for the TXNDC12 clade.
Molecular phylogenetic trees for CASQ1 and CASQ2 each using the human gene as a query showed that only a single habu ortholog exists in each: habu1_s2370_g08604.t2 for the CASQ1 clade and habu1_s8721_g18867.t1 for the CASQ2 clade (Supplementary Figures S14 and S15).
  • (c) Calreticulin members
In a similar fashion, to examine how many genes are present for CALR members in the habu genome, a molecular phylogenetic tree of CALR was constructed using ORTHOSCOPE, with human CALR as a query sequence (Figure 4). We found that a gene annotated as habu CALR, habu1_ s3471_g11839.t1, was included in the human CALR clade (Figure 4), indicating that the gene annotation for habu CALR is correct, since the habu gene annotated as CALR is an ortholog of human CALR. In addition, we found CALR3, CANX and CLGN homologs in the habu genome, habu1_ s2279_g08248.t1 for CALR3 gene, habu1_s3471_g11839.t1 for CALR gene, habu1_ s4907_g14941.t1 for CANX gene (Supplementary Figure S17), habu1_ s2744_g09792.t1 for CALRL gene, and habu1_ s67827_g17445.t1 for CLGN gene (Figure 4). These observations were confirmed by molecular phylogenies of CALR3 (Supplementary Figure S16), CANX (Supplementary Figure S17), and CALRL (Supplementary Figure S18). As with PDI and related families, members of the CALR family exist as single copies in the habu genome.
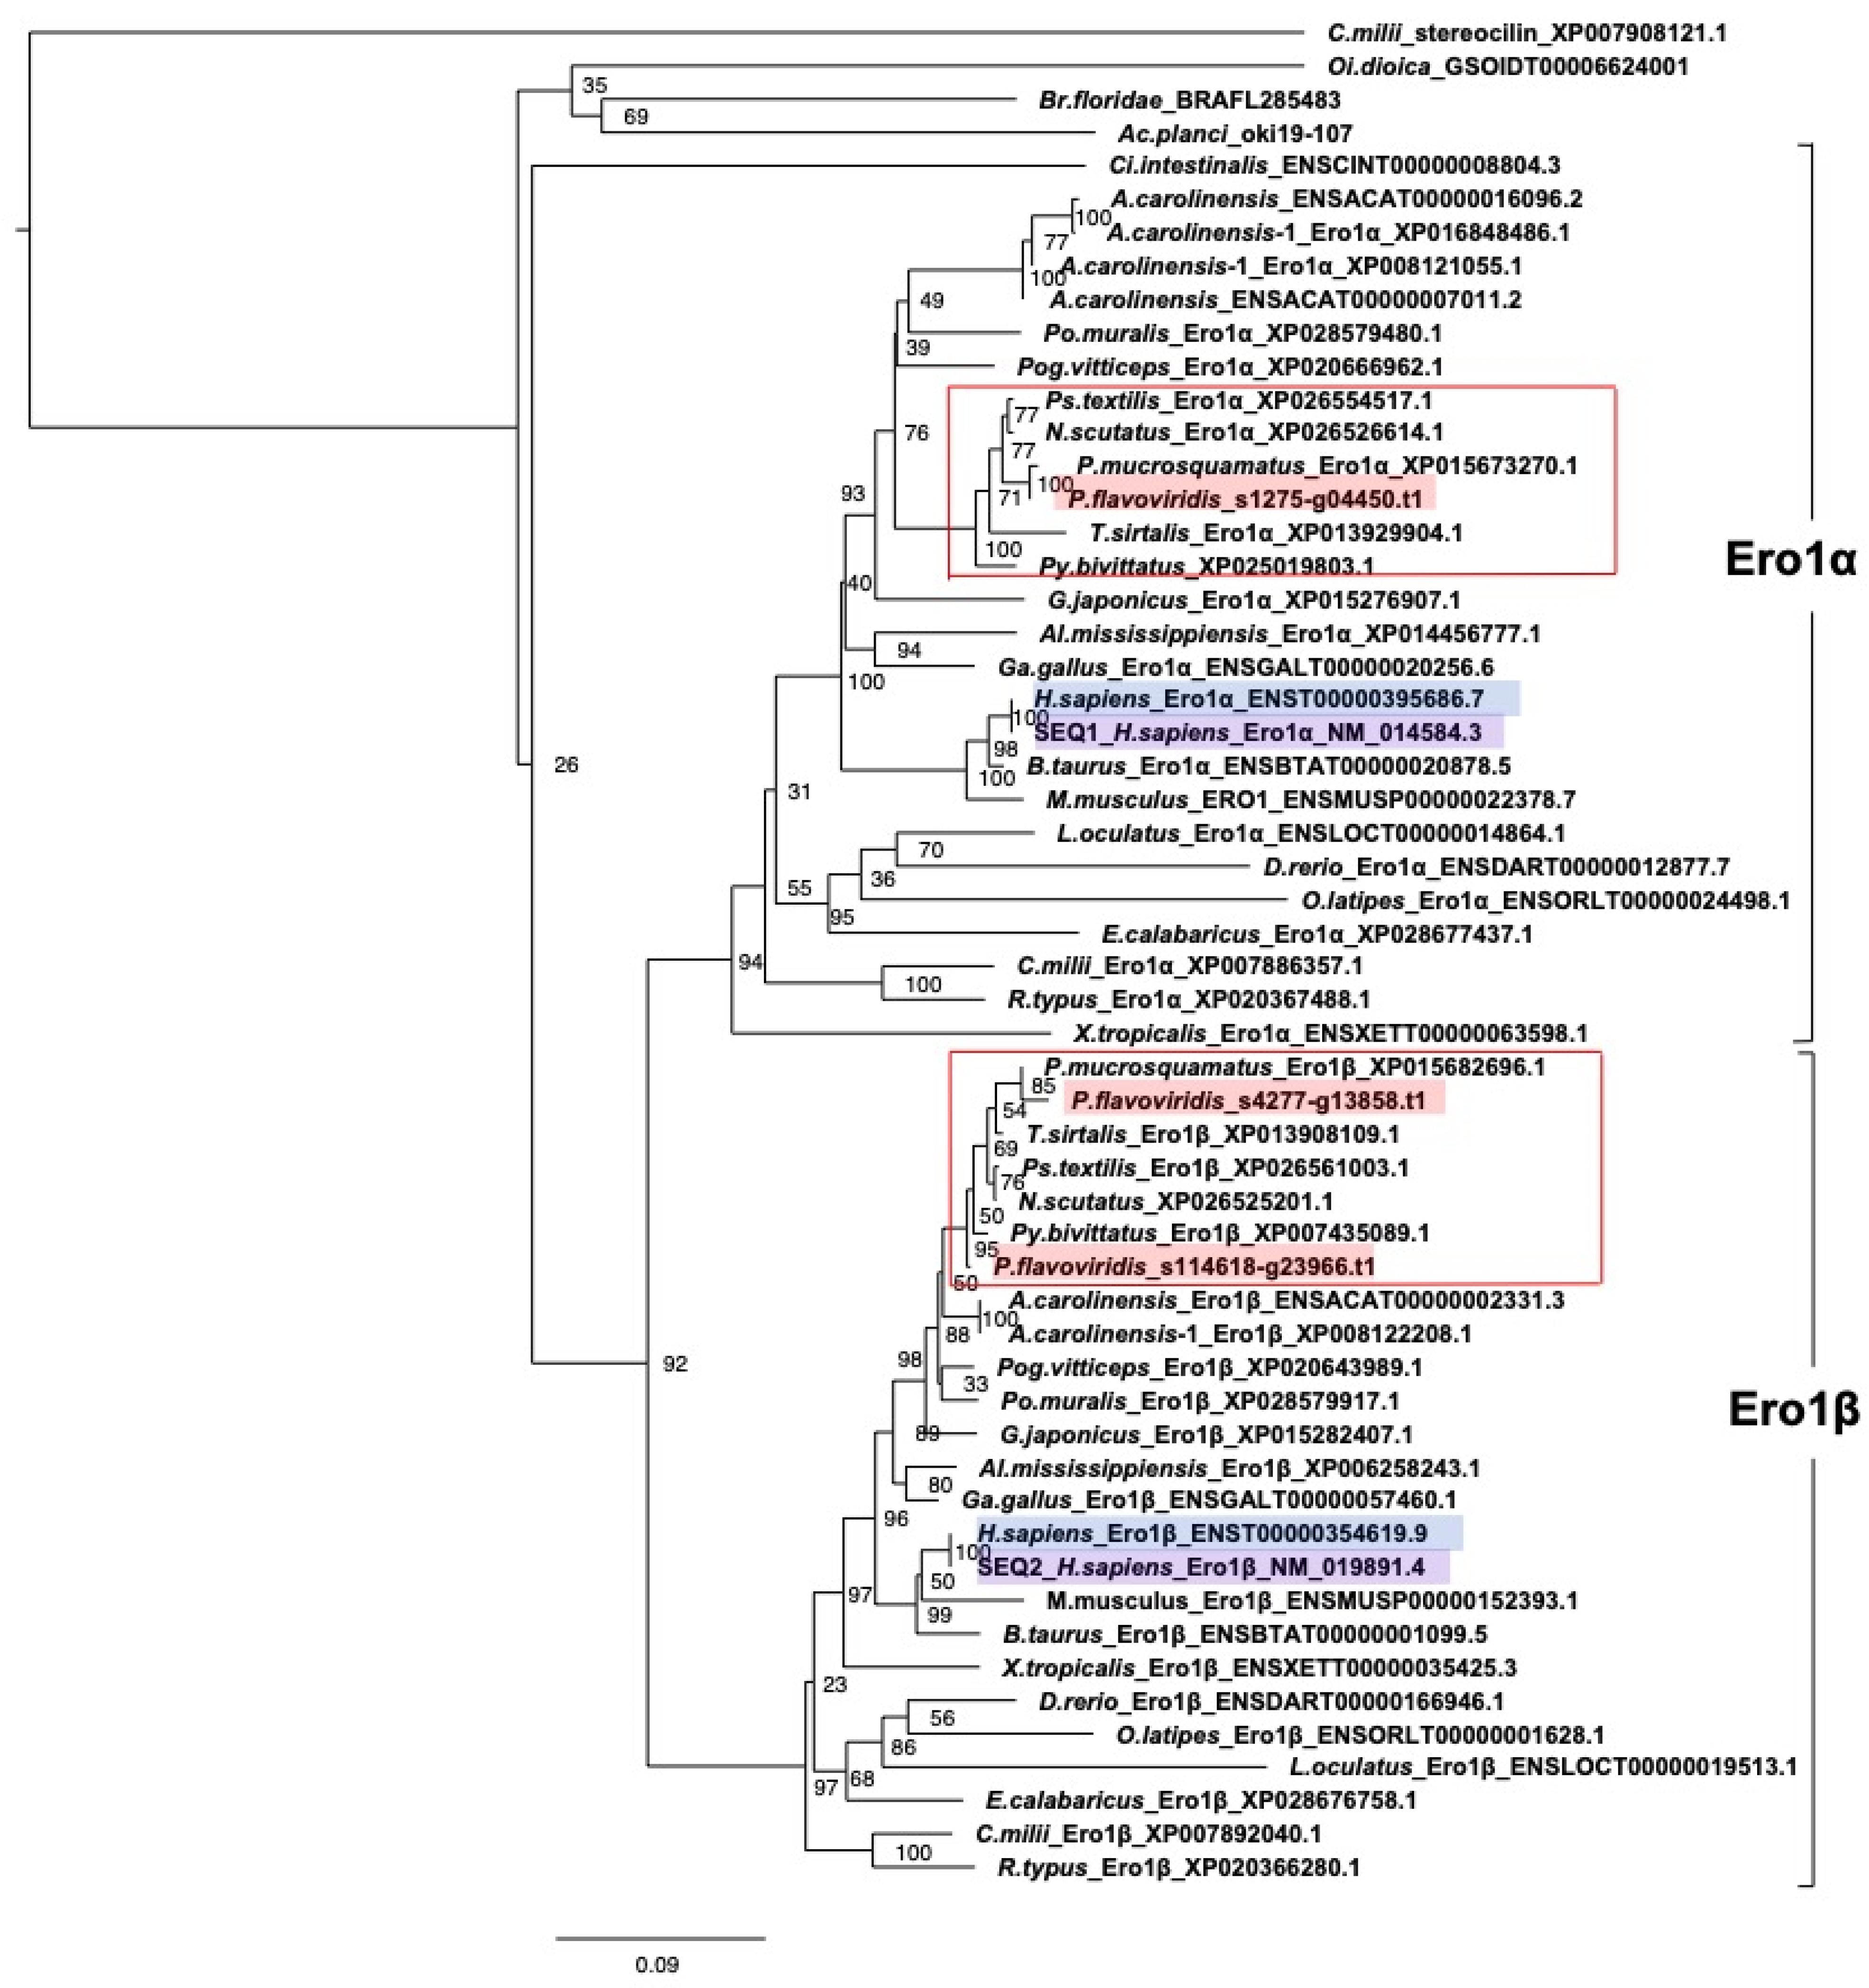
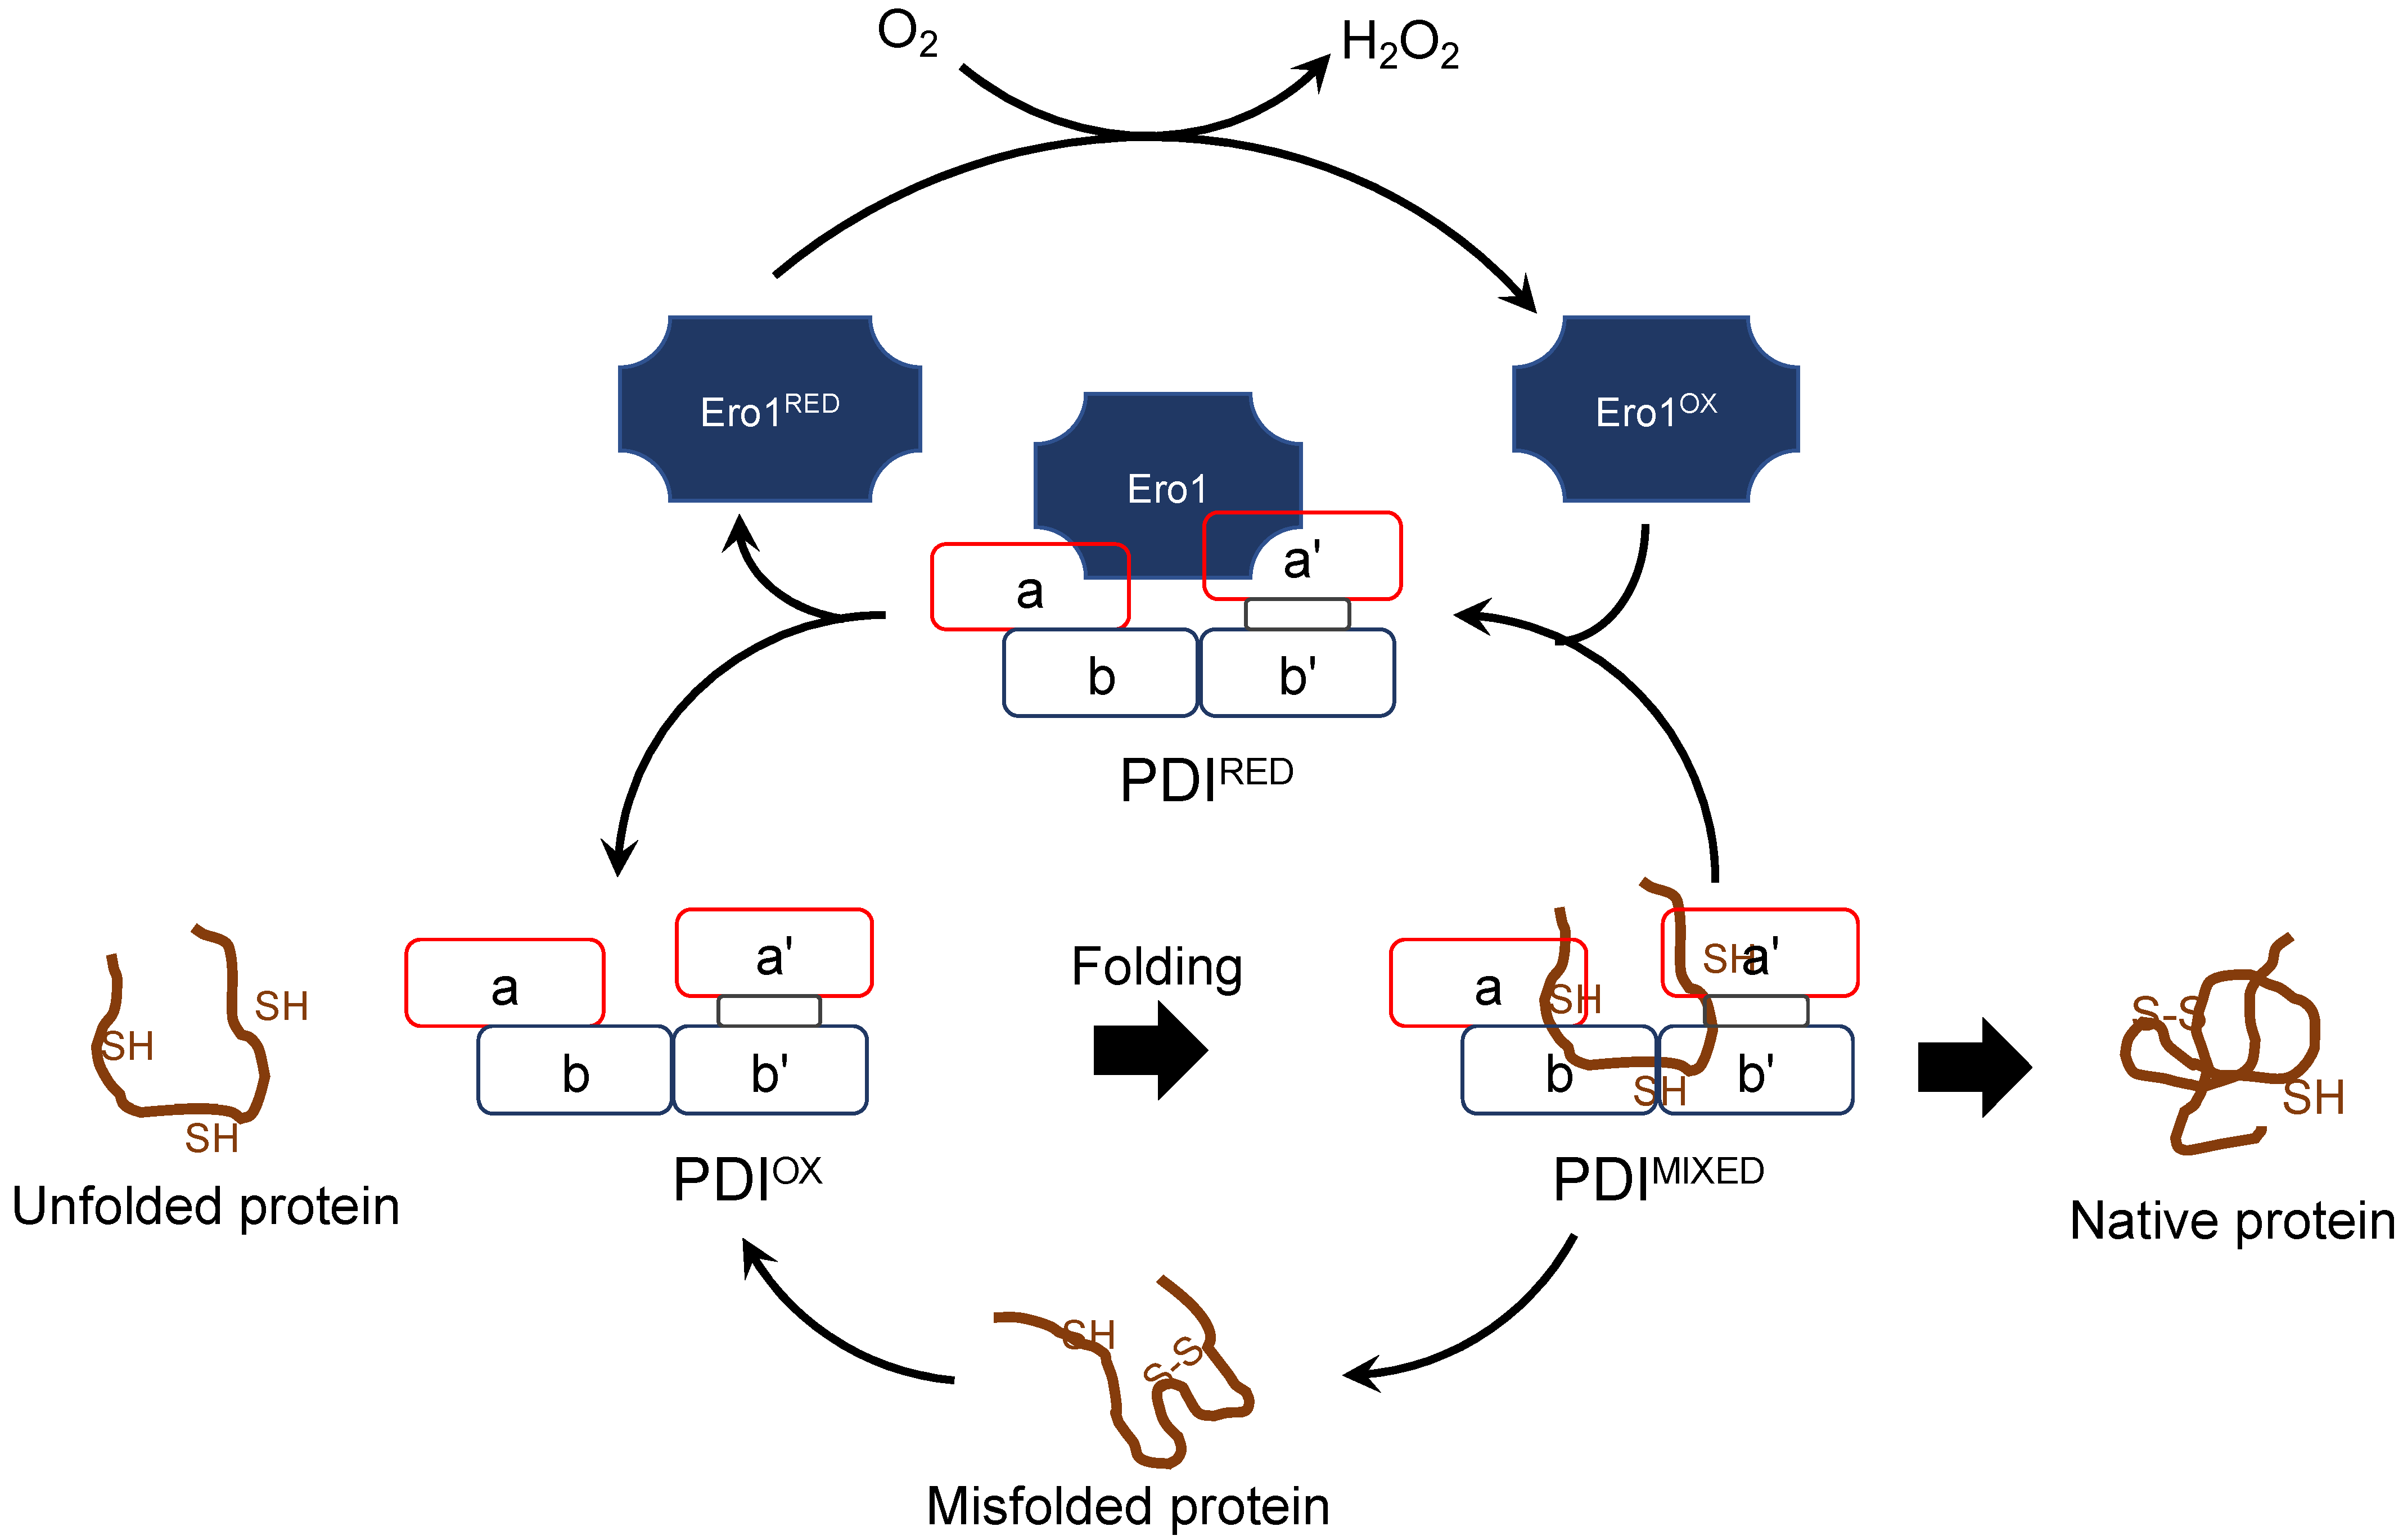
  • (d) Redox partner proteins of PDI family proteins, Ero1α and Ero1β
Ero1, which has two kinds of paralogs, Ero1α and Ero1β, is the re-oxidizing enzyme specific for P4HB in the PDI gene family (Figure 5) [18,19,20]. The Ero1 gene is conserved evolutionarily from yeast to humans. Although the functional difference between Ero1α and Ero1β has not yet been clarified, it is well known that they show different expression profiles. Ero1α is expressed ubiquitously in various organs, while Ero1β is expressed only in secreting tissues [21]. We examined the number of Ero1 copies in the habu genome and their expression profiles in different organs.
The molecular phylogeny of Ero1 (Figure 6) indicated two distinct clades of Ero1α and Ero1β, each of which contains habu orthologs, habu1_s1275_g04450.t1 (Ero1α) and habu1_s4277_g13858.t1 (Ero1β). Although the habu ortholog of Ero1β was a single copy, the gene was divided into two scaffolds tentatively annotated as habu1_s114618_g23966 (N-terminal side) and habu1_s4277_g13858 (C-terminal side).
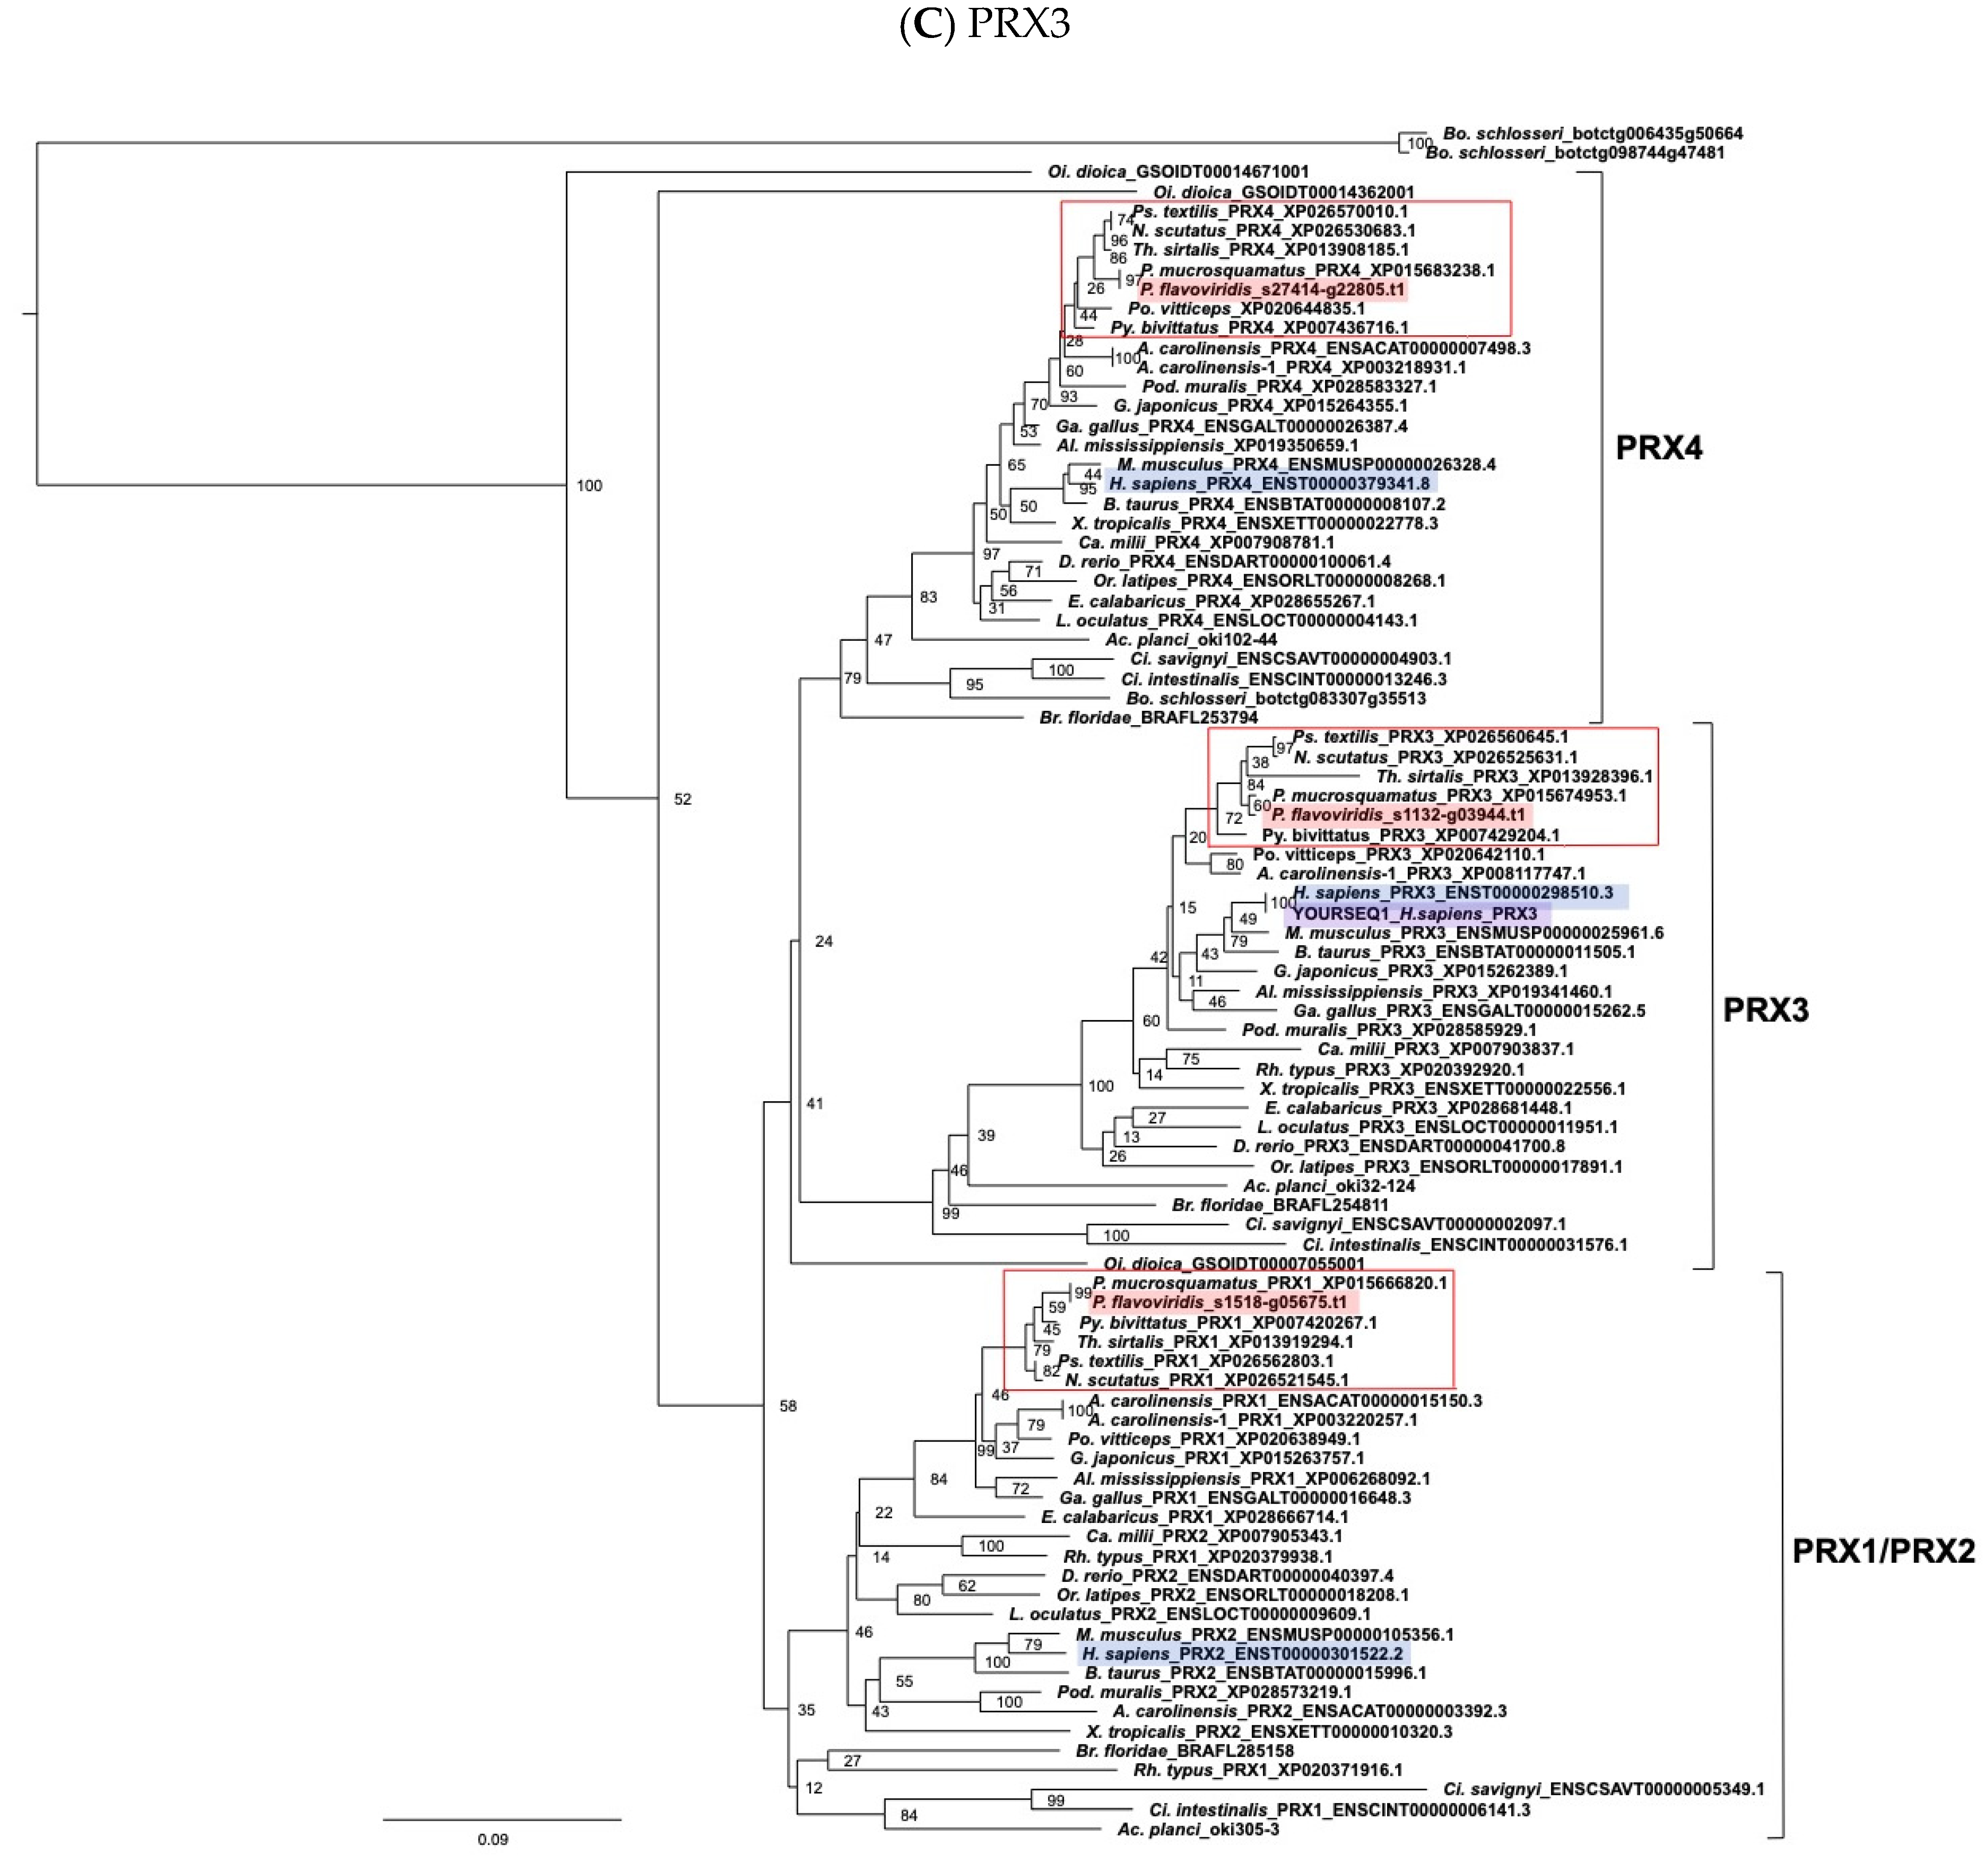
  • (e) TXN and PRX members
The molecular phylogeny of thioredoxin (TXN) members using ORTHOSCOPE, with human TXN as query sequences is shown in Figure 7. The tree consists of four main clades, namely TXN2, TXN, TXNL, and TXNL1, and clades TXN2, TXN, and TXNL1 each contained one habu ortholog: habu1_s6210_g16942.t1 for TXN2 clade, habu1_s3891_g12904.t1 for TXN clade, and habu1_s4406_g14149 for TXNL1 clade. However, we failed to find an ortholog for TXNL.
Molecular phylogenic trees of peroxiredoxin (PRX) isoforms genes were analyzed, with human PRX1 (Figure 8A), PRX2 (Figure 8B), PRX3 (Figure 8C) and PRX4 (Figure 8D) as query sequences. The tree comprises four discrete clades of PRX1, PRX2, PRX3, and PRX4. Each PRX clade contained a habu ortholog, habu1_s1518_g05675.t1 for the PRX1 clade, habu1_s2388_g08681.t1 for the PRX2 clade, habu1_s1132_g03944.t1 for the PRX3 clade, and habu1_s27414_g22805.t1 for the PRX4 clade.

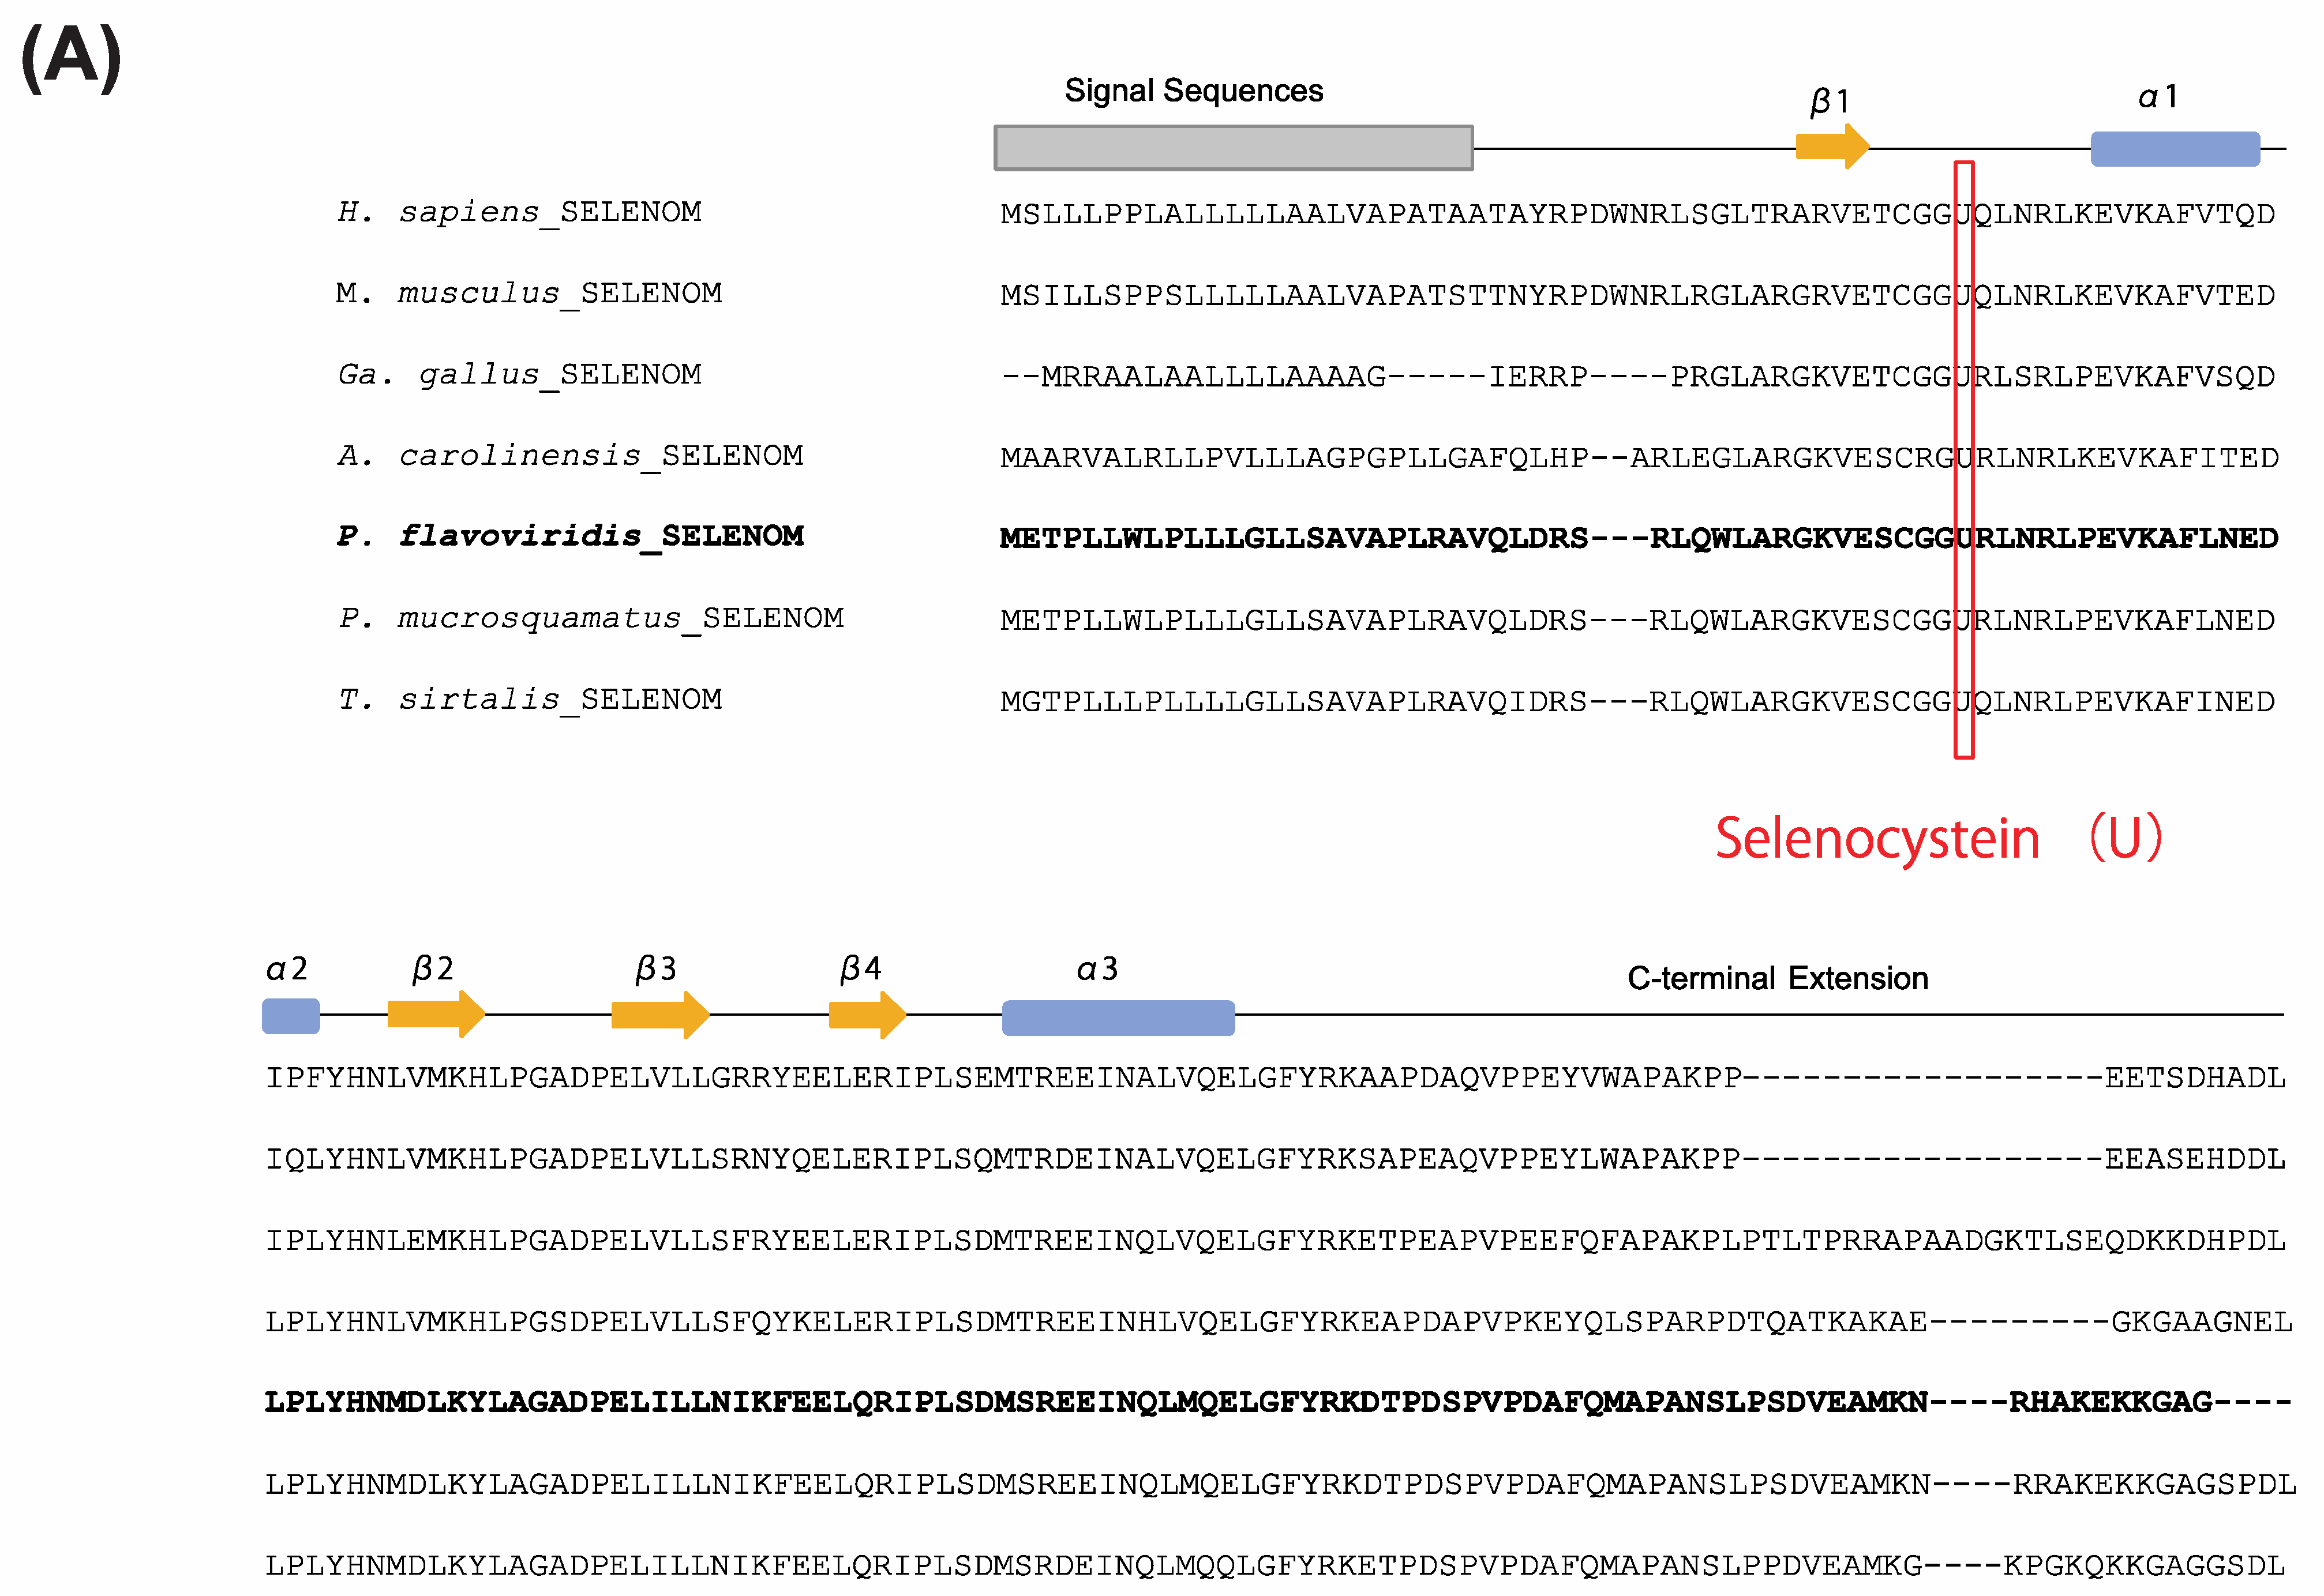
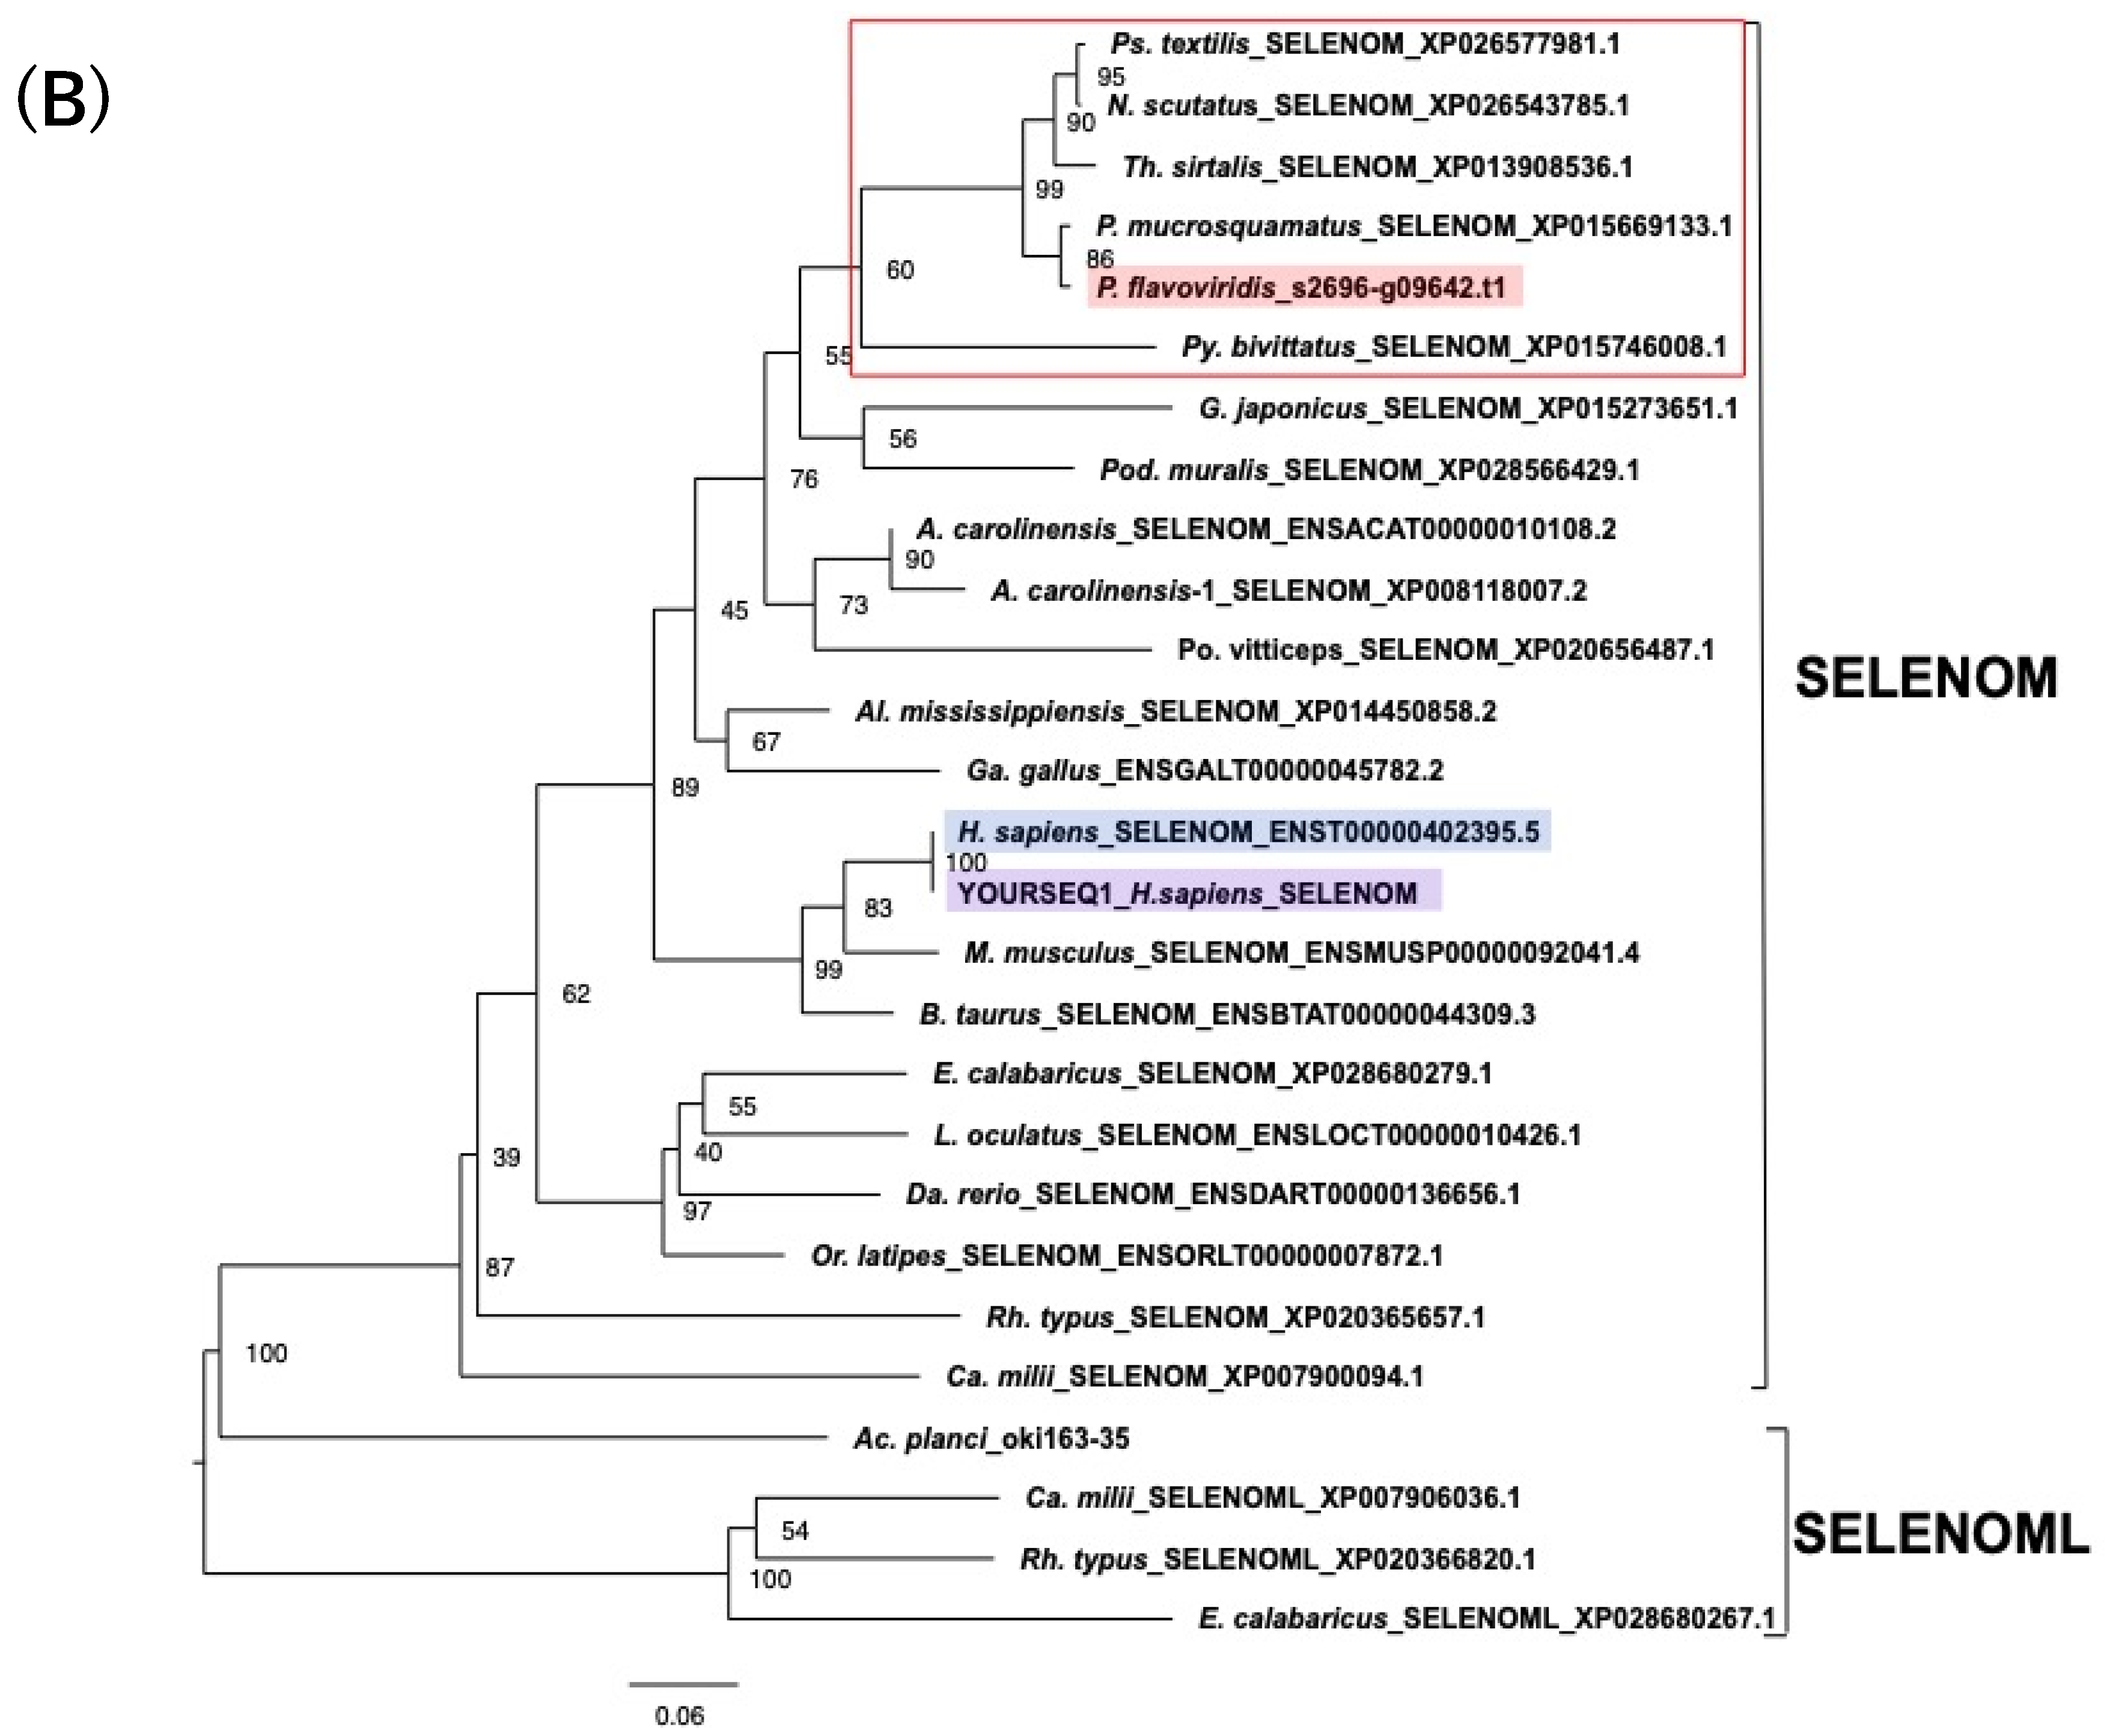
2.4. Characterization of the Habu SELENOM Gene

Although the PDI gene family has been studied in detail, SELENOM has been poorly characterized, including its exact function. Selenocysteine (U) is a unique, rare amino acid encoded by the codon, UGA. It is highly conserved in selenoproteins. We therefore performed an alignment with habu Selenoprotein M and confirmed that the position of selenocystein (U) is highly conserved in all gene sequences, including habu Selenoprotein M (Figure 9A).
In addition, to confirm whether the habu gene annotated as SELENOM, habu1_s2696_g09642.t1, is a human SELENOM ortholog, a molecular phylogenetic tree of SELENOM was constructed using ORTHOSCOPE, with human SELENOM as the query sequence (Figure 9B). The resulting phylogenetic tree includes a single habu gene annotated as SELENOM in the same clade as human SELENOM, and we found no paralogs of habu SELENOM.

2.5. Expression Profiles of Genes Encoding PDI and PDI-Related Proteins in the Habu

To determine the functions of candidate enzymes or chaperones of venom protein modification more specifically, we next investigated expression profiles of not only PDI family genes, but also their redox partner proteins in various organs and tissues of P. flavoviridis, including venom glands (Table 2). First, we focused on organ-specific genes in venom glands. Four genes for venom protein folding candidate enzymes or chaperones, P4HB, SELENOM, CALR, and PDIA3, showed higher expression levels in venom glands (TPM > 1000) than in other organs. However, except for SELENOM, they all showed high and ubiquitous expression in all organs (Table 2).
For example, P4HB showed a considerably higher expression level in venom glands (TPM (venom gland1/venom gland2) = 8572.4/13,303.9) than in other organs, in the range of (TPM =) 213–4084 (40 times higher than brain). CALR and PDIA3 also showed high expression levels in venom glands (361.1/1422 and 2266.3/1085.9, respectively) and in other organs. SELENOM showed high expression levels in venom glands (1514.7/1928.2), and in other organs, except for the liver, ovary, kidney, stomach, and small intestine. In addition to these genes of the four protein-modification enzyme candidates, PDIA4, PDIA6 (P5), TXNDC12, and CASQ1, also showed high expression levels in venom glands (95.7/172.3, 181.2/388.5, 99.8/160, and 3732.7/97.1, respectively), while the expression levels of other protein-modification enzymes genes, such as PDIA2, PDIA5, ERp46, ERp27, ERp29, TMX1, TMX2, TMX3, TMX4, AGR2, AGR3, DNAJC10, and CASQ2, in the venom gland were lower than those in other organs.
Among the redox partner proteins of PDIs, PRX4 is an ER-localized PRX isoform that reduces hydrogen peroxide produced during Ero1-mediated oxidation of P4HB [23,24,25]. PRX4 oxidizes PDIA6 and TXNDC5 most efficiently [19,24,26]. In habus, PDIA6 tends to have ubiquitously high expression, and especially in venom glands and fetal fibroblasts, specifically (TPM = 388.5 and 541.2, respectively). Additionally, in habus, all organs, including venom glands, showed high expression of PRX4 (TPM = 229.4).
On the other hand, the expression level of Ero1 in various habu organs showed that two kinds of paralogs of Ero1, Ero1α, and Ero1β, exhibit different expression profiles. Ero1α was ubiquitously expressed in all organs, but at low levels (TPM = 0.3–29.3). The expression level of Ero1α was especially low (TPM = 3.3) in venom glands, whereas Ero1β was comparatively highly expressed in venom glands (TPM = 75.1 to 247.6) as well as in the ovary, spleen, pancreas, and nose (TPM = 182.8–498.9). Thus, the expression levels of Ero1α and Ero1β differ, depending on organs and tissues, as noted in other vertebrates [27].

2.6. No Accelerated Evolution of Genes for Candidate Venom Protein Modification Enzymes or Chaperones

Our previous study of the habu genome revealed that most venom protein genes have been extensively duplicated and that major venom genes including svMPs exhibit accelerated evolution when examined by KA/KS analysis. In contrast, as shown here, genes involved in the modification of venom proteins are present as single copies in the habu genome. However, since these genes are also highly expressed in the venom gland, we examined whether accelerated evolution occurred in these genes by calculating KA/KS values using the Nei–Gojobori method.
We first examined the possible accelerated evolution of P4HB and PDIA3. However, KA/KS analysis against P4HB and PDIA3 genes showed no accelerated evolution of the P4HB and PDIA3 genes (Supplementary Figure S19). Further, KA/KS analysis indicated that habu CALR and SELENOM also showed no accelerated evolution (Supplementary Figure S20). KA/KS values for PDI family genes, P4HB and PDIA3, were almost 0, indicating that these two genes are highly conserved.

3. Discussion

In this study, in addition to genes that encode venom and ribosomal proteins, genes that encode PDI family proteins (human P4HB and PDIA3 orthologs), Selenoprotein M (SELENOM), and Calreticulin (CALR), are highly expressed in habu venom glands. Since these enzymes or chaperones are involved in protein modification and folding in the cellular secretory pathway, the present results suggest the most likely involvement of PDI, PDIA3, Selenoprotein M, and Calreticulin in protein folding and modification during snake venom production as candidate modification enzymes or chaperones. Therefore, it is likely that PDI, PDIA3, Selenoprotein M, and Calreticulin are critical to confer toxic functions upon the disulfide bond-rich venom transcriptome.
Although studies of venom transcriptomes or proteomes have been conducted for many venomous snakes [3,4,5], there have been only a few reports focused on non-toxin transcripts or proteins, especially genes for enzymes that are involved in venom protein modification. In transcriptomic analysis of venom glands of the eastern diamondback rattlesnake (Crotalus adamanteus), Rokyta et al. (2012) [14] demonstrated that genes for PDIs are highly expressed in venom glands. Furthermore, proteomic analysis of Bothrops jararaca venom glands [15] found that proteins from the endoplasmic reticulum (ER), such as PDI and GPR78, and cytoplasmic proteins, such as 40S ribosomal protein, are enriched in venom glands. Our present transcriptome analysis indicated that P4HB, PDIA3, SELENOM, and CALR, which are non-toxin genes, are among the 50 most highly expressed venom gland genes. Consistently, the 20 most highly expressed non-toxin transcripts listed by Rokyta et al. (2012) [14] included PDI, calreticulin, and PDIA3. Thus, our findings for habu venom glands support results for other pit vipers, which manifest compositional similarities.
In this context, with transcriptomic data for the Indian cobra (Naja naja), venom of which is rich in post-synaptic neurotoxins, Suryamohan et al. (2020) [28] showed the high expression of PDI (log (CPM) = 13.27~15.65 (n = 6)), as well as the moderately high expression of PDIA3 [28]. While their transcriptomic data for 109 differentially upregulated genes (DUGs) in cobra venom glands did not include P4HB and PDIA3, these genes were more highly expressed in venom glands than in other organs. This seems reasonable since PDIs are expressed ubiquitously due to their essential functions as protein modification enzymes or chaperones. DUG analysis is undoubtedly useful to find genes of venom proteins since venom proteins are exclusively expressed in venom glands. However, this type of analysis may not always be useful to find genes that are ubiquitously and highly expressed, but more so in specific organs. When focusing on essential genes encoding non-toxic proteins, we need to consider the most appropriate analytical method. Nevertheless, all data shown herein for various snake species allow us to speculate that PDIs are essential for the modification and folding of venom proteins with abundant cysteines and multiple disulfide bonds.
Given that PDI works together with Ero1 as the primary catalyst for disulfide bond formation (Figure 5), we surmised that high expression of habu PDI accompanies high expression of habu Ero1. Indeed, our transcriptomic data from habu venom glands indicate high co-expression of Ero1β and PDI, whereas Ero1α is expressed to a much lesser extent. This was an unexpected result. However, previous studies demonstrated that Ero1β is constitutively and abundantly expressed in professional secretory tissues and can be strikingly induced in the course of the unfolded protein response [27,29]. Moreover, recombinant human Ero1β is twice as active as Ero1α in enzymatic assays [30]. Thus, it is possible that PDI is oxidized by Ero1β more efficiently than by Ero1α, leading to the efficient catalysis of oxidative protein folding by the PDI-Ero1β combination [30]. The present finding of the high expression of PDI together with Ero1β supports our notion that habu PDI could be the primary venom protein modification enzyme.
In this study, ORTHOSCOPE, the leading tool for phylogenetic analysis, enabled us to estimate phylogeny for all PDI family orthologs and paralogs and their redox partner genes, SELENOM and CALR. This program is a species tree-based ortholog or paralog relationship identification tool, and all orthologs and paralogs for a specific gene are estimated automatically using this software [16]. Our previous data showed that each habu venom protein gene has many paralogs and undergoes accelerated evolution. In contrast, habu genes encoding candidate venom protein modification enzymes are orthologs for those of humans, and consistently there are no paralogs. Furthermore, our KA/KS analysis indicates that these genes never undergo accelerated evolution. In contrast to habus, proteomic analysis of cone snails, which have conotoxin, by Safavi-Hemami et al. (2011) demonstrated multiple PDI isoforms in cone snail venom glands, suggesting that cone snail PDI does undergo accelerated evolution [31]. Therefore, this contrast suggests that in habus, venom modification enzymes modify a wide variety of venom proteins, without requiring multiple isoforms derived from gene duplication or accelerated evolution. This difference between habus and cone snails may also help clarify molecular mechanisms for venom protein modification.
Variables relative to venom gland sampling conditions can also affect results. Luna et al. (2013) [15] indicated that a venom production cycle has two stages: a quiescent stage and an active stage. In Bothrops jararaca, this cycle continues for about 30–50 days [15]. Moreover, they demonstrated that the kinds and quantities of proteins detected in these two steps were totally different, suggesting that although there are differences in the length of this cycle among snake species, timing is quite important for venom gland sampling for transcriptomic or proteomic analysis. Results of venom gland proteomic analysis change dramatically depending on the timing of sampling [15]. Thus, in this study, the number of samples was insufficient for statistical analysis. However, our results are consistent with those of other studies. Time-course single-cell RNA-seq analysis might allow for a better understanding of the accurate transition of the venom glands expression profile according to the entire timing of the cycle, as well as mechanisms of venom protein modification.

4. Conclusions

In this study, we identified four non-toxin genes quite highly expressed in venom glands of P. flavoviridis, namely P4HB, PDIA3, SELENOM, and CALR, and in general all of which encode protein folding enzymes or molecular chaperones in the ER. These are single-copy genes and are highly conserved among Protobothrops species, in contrast to the multiple copies and accelerated evolution of venom protein genes. Gene for a redox partner protein of PDI, Ero1β is also highly expressed in venom glands. The highly active expression of P4HB, PDIA3, SELENOM, and CALR in habu venom glands, which is also supported by previous reports, together with the disulfide bond-rich nature of venom proteins and the high co-expression of PDIs’ redox partner genes, suggests that PDI, PDIA3, Selenoprotein M, and Calreticulin are strongly associated with venom protein modification. It is most likely that folding enzymes or molecular chaperones such as habu PDIs are critical to endow them with toxic functions.

5. Materials and Methods

5.1. Transcriptomic Data and Comparative Analyses

For transcriptomic analyses, a total of 22 samples were used as follows: 20 samples for 18 tissues and organs from two adult animals, and 2 samples for 2 tissues and organs from one neonate, including two venom glands specimens from two adult (sample name: venom gland-specimen#1, venom gland-specimen#2); two brains specimens from two adult (brain-specimen#1, brain-specimen#2); one specimen of eye, nose, infrared sensing pit organ, and venom fang-forming tissue, from one female adult; one specimen of lungs, liver, kidneys, small intestine, colon, stomach, pancreas, heart, masseter muscle, spleen, ovary, and accessory glands from the other female adult; one neonate venom gland tissue, as well as fibroblast cells, from one neonate. We extracted total RNA using a standard TRIzol protocol (Thermo Fisher Scientific, Waltham, MA, USA), and prepared cDNA libraries using an NEBNext® Ultra™ Directional RNA Library Prep Kit for Illumina (New England Biolabs, Ipswich, MA, USA). RNA quality was checked with an Agilent Technologies 2100 Bioanalyzer using an Agilent RNA 6000 Nano Kit. Sequencing was performed using an Illumina Hiseq2500. De novo assembly of whole RNA sequence reads was performed using a de Bruijn graph-based program, Trinity [32,33]. Assembled transcripts were annotated with BLASTX against UniProt. All Illumina reads are available from DRA under accession No. DRA006600.
Raw Illumina reads were quality filtered and trimmed with Trimmomatic (v0.36) [34]. After adapter trimming and quality filtering of RNA-seq reads, index files for Kallisto [35] psudoalignment were generated with transcriptome information of our habu gene model. Gene expression levels (TPM) were calculated with Kallisto.
The 50 most highly expressed genes in venom glands were identified, and high-expression profiles of genes in the venom gland are listed in order (Table 1 and Supplementary Table S1).

5.2. Molecular Phylogenetic Analysis

We performed molecular phylogenetic analysis using ORTHOSCOPE, which is a novel pipeline for molecular phylogenetic analysis [16]. This unique pipeline, which is a species tree-based ortholog identification tool, automatically estimates the phylogenetic trees, which can detect all orthologs and paralogs automatically from whole genomic databases of selected species among all registered species. The software judges the range of the ortholog clade, which is the monophyletic group (clade), including the operational taxonomic unit (OTU) of interest, based on the topology of the species trees, which are given as quide trees. All phylogenetic trees were rearranged with Fig-TREE using the Newick format results of ORTHOSCOPE analysis.
To identify orthologs or paralogs of not only P4HB, PDIA3, SELENOM, and CALR, but also the other PDI family genes and PDI related redox partner genes, phylogenetic analysis was conducted with protein-coding DNA sequences of human PDIA3, PDIA4, P4HB, PDILT, PDIA2, CALR, both of Ero1α and Ero1β, TXN, PRX1, PRX2, PRX3, PRX4, SELENOM, PDIA5, PDIA6, ERP27, ERP29, ERP44, AGR2, AGR3, TMX1, TMX2, TMX3, TMX4, TXNDC5, TXNDC12, CASQ1, CASQ2, CALR3, CANX, and Danio rerio CALRL/CALR3b as queries, respectively, using ORTHOSCOPE, a species tree-based ortholog identification tool [16] with the following settings: analysis group, all Lepidosauria species and the default setting species for vertebrata analysis; E-value threshold for reported sequences, 1 × 10⁻³; number of hits to report per genome, 3; aligned site rate threshold within unambiguously aligned sites, 0; data set, DNA (Exclude 3rd); rearrangement BS (bootstrap) value threshold, 60%. In ORTHOSCOPE analysis, to construct neighbor joining (NJ) trees of all the above genes, all of the following analysis were carried out: amino acid sequences of each query gene were aligned with MAFFT (v7.221) [36] using the –auto strategy. Unaligned regions were trimmed with TrimAl (v1.2rev59) [37] using the –gappyout option. To generate nucleotide alignments, the corresponding DNA sequences were converted into the amino acid alignment using PAL2NAL [38]. For phylogenetic analyses, the NJ method [39] implemented in APE in R [40] for DNA alignments and FastME [41] for amino acid alignments were applied. Analyses of DNA alignments employ the most parameter-rich model in the program, the TN 93 model [42], with a gamma-distributed rate for site heterogeneity [43]. Analyses of amino acid alignments employ a widely used substitution model for nuclear gene analysis, the WAG model [44], with the gamma model. To evaluate the robustness of internal branches, 100 bootstrap replications are calculated for each data set.

5.3. Alignment and Molecular Evolutionary Analysis

We conducted the alignment of amino acid sequences of Selenoprotein M in a representative vertebrate using MUSCLE (v.3.8.31) alignment algorithms [45]. For KA/KS analysis, DNA sequences were aligned by using the ClustalW multiple alignment program (http://clustalw.ddbj.nig.ac.jp (accessed on 31 August 2021)) [46]. Due to the complicated structure of the genes for this KA/KS analysis, all alignments were manually curated. For pairwise comparisons of nucleotide sequences of each the organism genes, the number of nucleotide substitutions per synonymous site (KS) and per non-synonymous site (KA) for protein-coding regions was computed according to the Nei–Gojobori method [47] using the Sqdif Plot online (http://www.gen-info.osaka-u.ac.jp/~uhmin/study/sqdifPlot/index.html (accessed on 31 August 2021)).

Supplementary Materials

The following are available online at https://www.mdpi.com/article/10.3390/toxins14050300/s1, Figure S1: Molecular phylogenetic tree estimated using ORTHOSCOPE with human PDIA5 as the query sequence (highlighted in purple). Sequences highlighted in blue indicate human orthologs. Those highlighted in pink represent habu (P. flavoviridis) orthologs, and those in red boxes represent other snake species. Values beside branches represent percentages of times that a node was supported in 100 bootstrap pseudoreplications implemented in ORTHOSCOPE. The scale bar indicates an evolutionary distance of 0.2 substitutions per position; Figure S2: Molecular phylogenetic tree estimated using ORTHOSCOPE with human PDIA6 as the query sequence (highlighted in purple). Sequences highlighted in blue indicate human orthologs. Those highlighted in pink represent habu (P. flavoviridis) orthologs, and those in red boxes represent other snake species. Values beside branches represent percentages of times that a node was supported in 100 bootstrap pseudoreplications implemented in ORTHOSCOPE. The scale bar indicates an evolutionary distance of 0.2 substitutions per position; Figure S3: Molecular phylogenetic tree estimated using ORTHOSCOPE with human ERP27 as the query sequence (highlighted in purple). Sequences highlighted in blue indicate human orthologs. Those highlighted in pink represent habu (P. flavoviridis) orthologs, and those in red boxes represent other snake species. Values beside branches represent percentages of times that a node was supported in 100 bootstrap pseudoreplications implemented in ORTHOSCOPE. The scale bar indicates an evolutionary distance of 0.2 substitutions per position; Figure S4: Molecular phylogenetic tree estimated using ORTHOSCOPE with human ERP29 as the query sequence (highlighted in purple). Sequences highlighted in blue indicate human orthologs. Those highlighted in pink represent habu (P. flavoviridis) orthologs, and those in red boxes represent other snake species. Values beside branches represent percentages of times that a node was supported in 100 bootstrap pseudoreplications implemented in ORTHOSCOPE. The scale bar indicates an evolutionary distance of 0.1 substitutions per position; Figure S5: Molecular phylogenetic tree estimated using ORTHOSCOPE with human ERP44 as the query sequence (highlighted in purple). Sequences highlighted in blue indicate human orthologs. Those highlighted in pink represent habu (P. flavoviridis) orthologs, and those in red boxes represent other snake species. Values beside branches represent percentages of times that a node was supported in 100 bootstrap pseudoreplications implemented in ORTHOSCOPE. The scale bar indicates an evolutionary distance of 0.1 substitutions per position; Figure S6: Molecular phylogenetic tree estimated using ORTHOSCOPE with human AGR2 as the query sequence (highlighted in purple). Sequences highlighted in blue indicate human orthologs. Those highlighted in pink represent habu (P. flavoviridis) orthologs, and those in red boxes represent other snake species. Values beside branches represent percentages of times that a node was supported in 100 bootstrap pseudoreplications implemented in ORTHOSCOPE. The scale bar indicates an evolutionary distance of 0.2 substitutions per position; Figure S7: Molecular phylogenetic tree estimated using ORTHOSCOPE with human AGR3 as the query sequence (highlighted in purple). Sequences highlighted in blue indicate human orthologs. Those highlighted in pink represent habu (P. flavoviridis) orthologs, and those in red boxes represent other snake species. Values beside branches represent percentages of times that a node was supported in 100 bootstrap pseudoreplications implemented in ORTHOSCOPE. The scale bar indicates an evolutionary distance of 0.09 substitutions per position; Figure S8: Molecular phylogenetic tree estimated using ORTHOSCOPE with human TMX1 as the query sequence (highlighted in purple). Sequences highlighted in blue indicate human orthologs. Those highlighted in pink represent habu (P. flavoviridis) orthologs, and those in red boxes represent other snake species. Values beside branches represent percentages of times that a node was supported in 100 bootstrap pseudoreplications implemented in ORTHOSCOPE. The scale bar indicates an evolutionary distance of 0.2 substitutions per position; Figure S9: Molecular phylogenetic tree estimated using ORTHOSCOPE with human TMX2 as the query sequence (highlighted in purple). Sequences highlighted in blue indicate human orthologs. Those highlighted in pink represent habu (P. flavoviridis) orthologs, and those in red boxes represent other snake species. Values beside branches represent percentages of times that a node was supported in 100 bootstrap pseudoreplications implemented in ORTHOSCOPE. The scale bar indicates an evolutionary distance of 0.2 substitutions per position; Figure S10: Molecular phylogenetic tree estimated using ORTHOSCOPE with human TMX3 as the query sequence (highlighted in purple). Sequences highlighted in blue indicate human orthologs. Those highlighted in pink represent habu (P. flavoviridis) orthologs, and those in red boxes represent other snake species. Values beside branches represent percentages of times that a node was supported in 100 bootstrap pseudoreplications implemented in ORTHOSCOPE. The scale bar indicates an evolutionary distance of 0.1 substitutions per position; Figure S11: Molecular phylogenetic tree estimated using ORTHOSCOPE with human TMX4 as the query sequence (highlighted in purple). Sequences highlighted in blue indicate human orthologs. Those highlighted in pink represent habu (P. flavoviridis) orthologs, and those in red boxes represent other snake species. Values beside branches represent percentages of times that a node was supported in 100 bootstrap pseudoreplications implemented in ORTHOSCOPE. The scale bar indicates an evolutionary distance of 0.2 substitutions per position; Figure S12: Molecular phylogenetic tree estimated using ORTHOSCOPE with human TXNDC5 as the query sequence (highlighted in purple). Sequences highlighted in blue indicate human orthologs. Those highlighted in pink represent habu (P. flavoviridis) orthologs, and those in red boxes represent other snake species. Values beside branches represent percentages of times that a node was supported in 100 bootstrap pseudoreplications implemented in ORTHOSCOPE. The scale bar indicates an evolutionary distance of 0.2 substitutions per position; Figure S13: Molecular phylogenetic tree estimated using ORTHOSCOPE with human TXNDC12 as the query sequence (highlighted in purple). Sequences highlighted in blue indicate human orthologs. Those highlighted in pink represent habu (P. flavoviridis) orthologs, and those in red boxes represent other snake species. Values beside branches represent percentages of times that a node was supported in 100 bootstrap pseudoreplications implemented in ORTHOSCOPE. The scale bar indicates an evolutionary distance of 0.2 substitutions per position; Figure S14: Molecular phylogenetic tree estimated using ORTHOSCOPE with human CASQ1 as the query sequence (highlighted in purple). Sequences highlighted in blue indicate human orthologs. Those highlighted in pink represent habu (P. flavoviridis) orthologs, and those in red boxes represent other snake species. Values beside branches represent percentages of times that a node was supported in 100 bootstrap pseudoreplications implemented in ORTHOSCOPE. The scale bar indicates an evolutionary distance of 0.2 substitutions per position; Figure S15: Molecular phylogenetic tree estimated using ORTHOSCOPE with human CASQ2 as the query sequence (highlighted in purple). Sequences highlighted in blue indicate human orthologs. Those highlighted in pink represent habu (P. flavoviridis) orthologs, and those in red boxes represent other snake species. Values beside branches represent percentages of times that a node was supported in 100 bootstrap pseudoreplications implemented in ORTHOSCOPE. The scale bar indicates an evolutionary distance of 0.2 substitutions per position; Figure S16: Molecular phylogenetic tree estimated using ORTHOSCOPE with human CALR3 as the query sequence (highlighted in purple). Sequences highlighted in blue indicate human orthologs. Those highlighted in pink represent habu (P. flavoviridis) orthologs, and those in red boxes represent other snake species. Values beside branches represent percentages of times that a node was supported in 100 bootstrap pseudoreplications implemented in ORTHOSCOPE. The scale bar indicates an evolutionary distance of 0.2 substitutions per position; Figure S17: Molecular phylogenetic tree estimated using ORTHOSCOPE with human CANX as the query sequence (highlighted in purple). Sequences highlighted in blue indicate human orthologs. Those highlighted in pink represent habu (P. flavoviridis) orthologs, and those in red boxes represent other snake species. Values beside branches represent percentages of times that a node was supported in 100 bootstrap pseudoreplications implemented in ORTHOSCOPE. The scale bar indicates an evolutionary distance of 0.2 substitutions per position; Figure S18: Molecular phylogenetic tree estimated using ORTHOSCOPE with Danio rerio CALRL as the query sequence (highlighted in purple). Sequences highlighted in blue indicate human orthologs. Those highlighted in pink represent habu (P. flavoviridis) orthologs, and those in red boxes represent other snake species. Values beside branches represent percentages of times that a node was supported in 100 bootstrap pseudoreplications implemented in ORTHOSCOPE. The scale bar indicates an evolutionary distance of 0.2 substitutions per position; Figure S19: KA/KS plot for major venom protein modification candidate enzyme or chaperone genes P4HB (left) and PDIA3 (right). KA and KS values were calculated by the Nei-Gojobori method for each pairwise genes: venomous snake vs venomous snake (●), venomous snake vs other animal (including human) (▲), and other animal vs other animal (◯). Venomous snakes include Protobothrops flavoviridis and P. mucrosquamatus, and other animals include human, mouse, chicken, anole and non-venomous snakes (Python bivittatus and Thamnophis sirtalis); Figure S20: KA/KS plot for major venom protein modification candidate enzyme or chaperone genes, CALR (left) and SELENOM (right). KA and KS values were calculated by the Nei-Gojobori method for each pairwise genes: venomous snake vs venomous snake (●), venomous snake vs other animals (including human) (▲), and other animals vs other animals (◯). Venomous snakes include Protobothrops flavoviridis and P. mucrosquamatus, and other animals include human, mouse, chicken, anole and non-venomous snakes (Python bivittatus and Thamnophis sirtalis); Table S1: Genes highly expressed in venom glands from the first adult habu (venom gland-specimen#1: a sub-adult specimen).

Author Contributions

Conceptualization, E.S., N.S. and K.I.; methodology, E.S., K.H., A.I. and N.S.; software, K.H. and J.I.; formal analysis, A.I., K.H. and Y.S.; data curation, K.H.; investigation, A.I., E.S. and K.H.; resources, T.O.; writing—original draft preparation, A.I. and E.S.; writing—review and editing, A.I., E.S., H.S., T.O., K.I. and N.S.; supervision, E.S., K.I. and N.S.; project administration, E.S. and N.S.; funding acquisition, T.O., H.S. and N.S. All authors have read and agreed to the published version of the manuscript.

Funding

This research was supported by OIST Internal Fund to Marine Genomics Unit (N.S.) and by Grants-in-Aid of MEXT, Japan (#25440214 and #18H02498 to H.S., #24651130 and #23107505 to T.O.).

Institutional Review Board Statement

Not applicable.

Informed Consent Statement

Not applicable.

Data Availability Statement

Not applicable.

Acknowledgments

We thank members of the Marine Genomics Unit and DNA sequencing sections of OIST. We also thank Steven D. Aird for technical editing of the manuscript. Supercomputing resources were provided by the Human Genome Center, the University of Tokyo (http://sc.hgc.jp/shirokane.html (accessed on 31 March 2019)), and the National Institute of Genetics (https://sc2.ddbj.nig.ac.jp/index.php/en/ (accessed on 31 March 2019)). This work was partly performed in the Cooperative Research Project Program of the Medical Institute of Bioregulation, Kyushu University.

Conflicts of Interest

The authors declare no conflict of interest.

References

  1. Shibata, H.; Chijiwa, T.; Hattori, S.; Terada, K.; Ohno, M.; Fukumaki, Y. The taxonomic position and the unexpected divergence of the Habu viper, Protobothrops among Japanese subtropical islands. Mol. Phylogenet. Evol. 2016, 101, 91–100. [Google Scholar] [CrossRef] [PubMed]
  2. Miyagi, Y. Dokujyakousyoh. Clin. All-Round 2004, 53, 1245–1249. [Google Scholar]
  3. Aird, S.D.; Watanabe, Y.; Villar-Briones, A.; Roy, M.C.; Terada, K.; Mikheyev, A.S. Quantitative high-throughput profiling of snake venom gland transcriptomes and proteomes (Ovophis okinavensis and Protobothrops flavoviridis). BMC Genom. 2013, 14, 790. [Google Scholar] [CrossRef] [PubMed] [Green Version]
  4. Aird, S.D.; Aggarwal, S.; Villar-Briones, A.; Tin, M.M.; Terada, K.; Mikheyev, A.S. Snake venoms are integrated systems, but abundant venom proteins evolve more rapidly. BMC Genom. 2015, 16, 647. [Google Scholar] [CrossRef] [PubMed] [Green Version]
  5. Castoe, T.A.; Hall, K.T.; Guibotsy Mboulas, M.L.; Gu, W.; de Koning, A.P.; Fox, S.E.; Poole, A.W.; Vemulapalli, V.; Daza, J.M.; Mockler, T.; et al. Discovery of highly divergent repeat landscapes in snake genomes using high-throughput sequencing. Genome Biol. Evol. 2011, 3, 641–653. [Google Scholar] [CrossRef] [PubMed] [Green Version]
  6. Ohno, M.; Ménez, R.; Ogawa, T.; Danse, J.M.; Shimohigashi, Y.; Fromen, C.; Ducancel, F.; Zinn-Justin, S.; Le Du, M.H.; Boulain, J.C.; et al. Molecular evolution of snake toxins: Is the functional diversity of snake toxins associated with a mechanism of accelerated evolution? Prog. Nucleic Acid Res. Mol. Biol. 1998, 59, 307–364. [Google Scholar]
  7. Ohno, M.; Ogawa, T.; Oda-Ueda, N.; Chijiwa, T.; Hattori, S. Accelerated and Regional Evolution of Snake Venom Gland Isozymes; Ménez, A., Ed.; Perspectives in Molecular Toxinology; John Wiley & Sons: New York, NY, USA, 2002; pp. 387–400. [Google Scholar]
  8. Ohno, M.; Chijiwa, T.; Oda-Ueda, N.; Ogawa, T.; Hattori, S. Molecular evolution of myotoxic phospholipases A2 from snake venom. Toxicon 2003, 42, 841–854. [Google Scholar] [CrossRef] [PubMed]
  9. Shibata, H.; Chijiwa, T.; Oda-Ueda, N.; Nakamura, H.; Yamaguchi, K.; Hattori, S.; Matsubara, K.; Matsuda, Y.; Yamashita, A.; Isomoto, A.; et al. The habu genome reveals accelerated evolution of venom protein genes. Sci. Rep. 2018, 8, 11300. [Google Scholar] [CrossRef]
  10. Ogawa, T.; Oda-Ueda, N.; Hisata, K.; Nakamura, H.; Chijiwa, T.; Hattori, S.; Isomoto, A.; Yugeta, H.; Yamasaki, S.; Fukumaki, Y.; et al. Alternative mRNA Splicing in Three Venom Families Underlying a Possible Production of Divergent Venom Proteins of the Habu Snake. Toxins 2019, 11, 581. [Google Scholar] [CrossRef] [PubMed] [Green Version]
  11. Reeks, T.A.; Fry, B.G.; Alewood, P.F. Privileged frameworks from snake venom. Cell Mol. Life Sci. 2015, 72, 1939–1958. [Google Scholar] [CrossRef] [PubMed]
  12. Mobli, M.; King, G.F. NMR methods for determining disulfide-bond connectivities. Toxicon 2010, 56, 849–854. [Google Scholar] [CrossRef] [PubMed]
  13. Takeda, S.; Takeya, H.; Iwanaga, S. Snake venom metalloproteinases: Structure, function and relevance to the mammalian ADAM/ADAMTS family proteins. Biochim. Biophys. Acta 2012, 1824, 164–176. [Google Scholar] [CrossRef]
  14. Rokyta, D.R.; Lemmon, A.R.; Margres, M.J.; Aronow, K. The venom-gland transcriptome of the eastern diamondback rattlesnake (Crotalus adamanteus). BMC Genom. 2012, 13, 312. [Google Scholar] [CrossRef] [PubMed] [Green Version]
  15. Luna, M.S.; Valente RHe Perales, J.; Vieira, M.L.; Yamanouyea, N. Activation of Bothrops jararaca snake venom gland and venom production: A proteomic approach. J. Proteom. 2013, 94, 460–472. [Google Scholar] [CrossRef]
  16. Inoue, J.; Satoh, N. ORTHOSCOPE: An Automatic Web Tool for Phylogenetically Inferring Bilaterian Orthogroups with User-Selected Taxa. Mol. Biol. Evol. 2019, 36, 621–631. [Google Scholar] [CrossRef] [PubMed]
  17. Galligan, J.J.; Petersen, D.R. The human protein disulfide isomerase gene family. Hum. Genom. 2012, 6, 6. [Google Scholar] [CrossRef] [PubMed] [Green Version]
  18. Inaba, K.; Masui, S.; Iida, H.; Vavassori, S.; Sitia, R.; Suzuki, M. Crystal structures of human Ero1α reveal the mechanisms of regulated and targeted oxidation of PDI. EMBO J. 2010, 29, 3330–3343. [Google Scholar] [CrossRef] [Green Version]
  19. Sato, Y.; Kojima, R.; Okumura, M.; Hagiwara, M.; Masui, S.; Maegawa, K.; Saiki, M.; Horibe, T.; Suzuki, M.; Inaba, K. Synergistic cooperation of PDI family members in peroxiredoxin 4-driven oxidative protein folding. Sci. Rep. 2013, 3, 2456. [Google Scholar] [CrossRef] [PubMed]
  20. Okumura, M.; Kadokura, H.; Inaba, K. Structures and functions of protein disulfide isomerase family members involved in proteostasis in the endoplasmic reticulum. Free Radic. Biol. Med. 2015, 83, 314–322. [Google Scholar] [CrossRef]
  21. Araki, K.; Inaba, K. Structure, mechanism, and evolution of Ero1 family enzymes. Antioxid. Redox Signal. 2012, 16, 790–799. [Google Scholar] [CrossRef]
  22. Andreu, C.I.; Woehlbier, U.; Torres, M.; Hetz, C. Protein disulfide isomerases in neurodegeneration: From disease mechanisms to biomedical applications. FEBS Lett. 2012, 586, 2826–2834. [Google Scholar] [CrossRef] [Green Version]
  23. Zito, E.; Melo, E.P.; Yang, Y.; Wahlander, Å.; Neubert, T.A.; Ron, D. Oxidative protein folding by an endoplasmic reticulum-localized peroxiredoxin. Mol. Cell 2010, 40, 787–797. [Google Scholar] [CrossRef] [PubMed] [Green Version]
  24. Tavender, T.J.; Springate, J.J.; Bulleid, N.J. Recycling of peroxiredoxin IV provides a novel pathway for disulphide formation in the endoplasmic reticulum. EMBO J. 2010, 29, 4185–4197. [Google Scholar] [CrossRef] [PubMed] [Green Version]
  25. Sato, Y.; Inaba, K. Disulfide bond formation network in the three biological kingdoms, bacteria, fungi and mammals. FEBS J. 2012, 279, 2262–2271. [Google Scholar] [CrossRef] [PubMed]
  26. Kojima, R.; Okumura, M.; Masui, S.; Kanemura, S.; Inoue, M.; Saiki, M.; Yamaguchi, H.; Hikima, T.; Suzuki, M.; Akiyama, S.; et al. Radically different thioredoxin domain arrangement of ERp46, an efficient disulfide bond introducer of the mammalian PDI family. Structure 2014, 22, 431–443. [Google Scholar] [CrossRef] [PubMed] [Green Version]
  27. Dias-Gunasekara, S.; Gubbens, J.; van Lith, M.; Dunne, C.; Williams, J.A.G.; Kataky, R.; Scoones, D.; Lapthorn, A.; Bulleid, N.J.; Benham, A.M. Tissue-specific expression and dimerization of the endoplasmic reticulum oxidoreductase Ero1 beta. J. Biol. Chem. 2005, 280, 33066–33075. [Google Scholar] [CrossRef] [Green Version]
  28. Suryamohan, K.; Krishnankutty, S.P.; Guillory, J.; Jevit, M.; Schröder, M.S.; Wu, M.; Kuriakose, B.; Mathew, O.K.; Perumal, R.C.; Koludarov, I.; et al. The Indian cobra reference genome and transcriptome enables comprehensive identification of venom toxins. Nat. Genet. 2020, 52, 106–117. [Google Scholar] [CrossRef] [Green Version]
  29. Pagani, M.; Fabbri, M.; Benedetti, C.; Fassio, A.; Pilati, S.; Bulleid, N.J.; Cabibbo, A.; Sitia, R. Endoplasmic reticulum oxidoreductin 1-lbeta (ERO1-Lbeta), a human gene induced in the course of the unfolded protein response. J. Biol. Chem. 2000, 275, 23685–23692. [Google Scholar] [CrossRef] [Green Version]
  30. Wang, L.; Zhu, L.; Wang, C.C. The endoplasmic reticulum sulfhydryl oxidase Ero1β drives efficient oxidative protein folding with loose regulation. Biochem. J. 2011, 434, 113–121. [Google Scholar] [CrossRef] [Green Version]
  31. Safavi-Hemami, H.; Siero, W.A.; Gorasia, D.G.; Young, N.D.; Macmillan, D.; Williamson, N.A.; Purcell, A.W. Specialisation of the venom gland proteome in predatory cone snails reveals functional diversification of the conotoxin biosynthetic pathway. J. Proteome Res. 2011, 10, 3904–3919. [Google Scholar] [CrossRef]
  32. Grabherr, M.G.; Haas, B.J.; Yassour, M.; Levin, J.Z.; Thompson, D.A.; Amit, I.; Adiconis, X.; Fan, L.; Raychowdhury, R.; Zeng, Q.; et al. Full-length transcriptome assembly from RNA-Seq data without a reference genome. Nat. Biotechnol. 2011, 29, 644–652. [Google Scholar] [CrossRef] [PubMed] [Green Version]
  33. Haas, B.J.; Papanicolaou, A.; Yassour, M.; Grabherr, M.; Blood, P.D.; Bowden, J.; Couger, M.B.; Eccles, D.; Li, B.; Lieber, M.; et al. De novo transcript sequence reconstruction from RNA-seq using the Trinity platform for reference generation and analysis. Nat. Protoc. 2013, 8, 1494–1512. [Google Scholar] [CrossRef] [PubMed]
  34. Bolger, A.M.; Lohse, M.; Usadel, B. Trimmomatic: A flexible trimmer for Illumina sequence data. Bioinformatics 2014, 30, 2114–2120. [Google Scholar] [CrossRef] [PubMed] [Green Version]
  35. Bray, N.L.; Pimentel, H.; Melsted, P.; Pachter, L. Near-optimal probabilistic RNA-seq quantification. Nat. Biotechnol. 2016, 34, 525–527. [Google Scholar] [CrossRef] [PubMed]
  36. Katoh, K.; Misawa, K.; Kuma, K.; Miyata, T. MAFFT: A novel method for rapid multiple sequence alignment based on fast Fourier transform. Nucleic Acids Res. 2002, 30, 3059–3066. [Google Scholar] [CrossRef] [Green Version]
  37. Capella-Gutiérrez, S.; Silla-Martínez, J.M.; Gabaldón, T. trimAl: A tool for automated alignment trimming in large-scale phylogenetic analyses. Bioinformatics 2009, 25, 1972–1973. [Google Scholar] [CrossRef]
  38. Suyama, M.; Torrents, D.; Bork, P. PAL2NAL: Robust conversion of protein sequence alignments into the corresponding codon alignments. Nucleic Acids Res. 2006, 34, W609–W612. [Google Scholar] [CrossRef] [Green Version]
  39. Saitou, N.; Nei, M. The neighbor-joining method: A new method for reconstructing phylogenetic trees. Mol. Biol. Evol. 1987, 4, 406–425. [Google Scholar] [CrossRef]
  40. Popescu, A.A.; Huber, K.T.; Paradis, E. ape 3.0: New tools for distance-based phylogenetics and evolutionary analysis in R. Bioinformatics 2012, 28, 1536–1537. [Google Scholar] [CrossRef]
  41. Lefort, V.; Desper, R.; Gascuel, O. FastME 2.0: A Comprehensive, Accurate and Fast Distance-Based Phylogeny Inference Program. Mol. Biol. Evol. 2015, 32, 2798–2800. [Google Scholar] [CrossRef] [Green Version]
  42. Tamura, K.; Nei, M. Estimation of the number of nucleotide substitutions in the control region of mitochondrial DNA in humans and chimpanzees. Mol. Biol. Evol. 1993, 10, 512–526. [Google Scholar] [CrossRef]
  43. Yang, Z. Maximum likelihood phylogenetic estimation from DNA sequences with variable rates over sites: Approximate methods. J. Mol. Evol. 1994, 39, 306–314. [Google Scholar] [CrossRef] [PubMed] [Green Version]
  44. Whelan, S.; Goldman, N. A general empirical model of protein evolution derived from multiple protein families using a maximum-likelihood approach. Mol. Biol. Evol. 2001, 18, 691–699. [Google Scholar] [CrossRef] [PubMed] [Green Version]
  45. Edgar, R.C. MUSCLE: Multiple sequence alignment with high accuracy and high throughput. Nucleic Acids Res. 2004, 32, 1792–1797. [Google Scholar] [CrossRef] [Green Version]
  46. Larkin, M.A.; Blackshields, G.; Brown, N.P.; Chenna, R.; McGettigan, P.A.; McWilliam, H.; Valentin, F.; Wallace, I.M.; Wilm, A.; Lopez, R.; et al. Clustal W and Clustal X version 2.0. Bioinformatics 2007, 23, 2947–2948. [Google Scholar] [CrossRef] [Green Version]
  47. Nei, M.; Gojobori, T. Simple methods for estimating the numbers of synonymous and nonsynonymous nucleotide substitutions. Mol. Biol. Evol. 1986, 3, 418–426. [Google Scholar] [PubMed]
Figure 1. Heat map representing genes predominantly expressed in habu venom glands and other organs. Numbers for each gene correspond to genes in Table 1. Genes for candidate modification enzymes or chaperones related to protein folding are indicated with yellow boxes.
Toxins 14 00300 g001
Figure 2. Schematic representation of PDI gene family members in humans and their domain composition. Catalytically active domains (a) and (a’) are shown in red; inactive domains in light blue (b) and dark blue (b’); Asp/Glu rich Ca2+-binding domains are designated in green; orange represents transmembrane domains; x-linker regions (brown); COOH terminal ER retention sequences (white). Habu PDI family Gene IDs for P. flavoviridis and P. mucrosquamatus that are orthologs of human PDI family genes, are shown on the right side. This figure on the left side was adapted and modified with permission from [17] (under the terms of the Creative Commons Attribution License).
Toxins 14 00300 g002
Figure 3. Molecular phylogenetic trees of protein disulfide isomerases (PDIs). These trees were estimated using ORTHOSCOPE with human PDIA3 (A), PDIA4 (B), P4HB (C), PDILT (D), and PDIA2 (E) as query sequences (highlighted in purple-colored), respectively. Sequences highlighted in blue indicate human orthologs. Those highlighted in pink represent habu (P. flavoviridis) orthologs, and those in red boxes represent other snake species. Values beside branches represent the percentages of times that nodes were supported in 100 bootstrap pseudoreplications implemented in ORTHOSCOPE. The scale bar indicates an evolutionary distance of 0.2 substitutions per position.
Toxins 14 00300 g003aToxins 14 00300 g003bToxins 14 00300 g003cToxins 14 00300 g003dToxins 14 00300 g003e
Figure 4. Molecular phylogenetic tree of CALR. This tree was estimated using ORTHOSCOPE with human CALR as the query sequence (highlighted in purple-colored). The tree includes CALR, CALR-like, CALR3 and CANX clades. Sequences highlighted in blue indicate human orthologs. Those highlighted in pink represent habu (P. flavoviridis) orthologs, and those in red boxes represent other snake species. Values beside branches represent the percentages of times that nodes were supported in 100 bootstrap pseudoreplications implemented in ORTHOSCOPE. The scale bar indicates an evolutionary distance of 0.07 substitutions per position.
Toxins 14 00300 g004
Figure 5. The relationship between PDI and Ero1 during protein folding by PDI. Redox regulation of PDI by Ero1 produces H2O2. PDIOX: oxidized PDI; PDIRED: reduced PDI; PDIMIXED: PDI with the bound substrate; Ero1OX: oxidized Ero1; Ero1RED: reduced Ero1. PDI domains are colored as shown in Figure 2. This figure was adapted and modified with permission from Ref. [22]. (2012, Claudio Hetz et al., John Wiley and Sons).
Toxins 14 00300 g005
Figure 6. Molecular phylogenetic tree for Ero1α and Ero1β. This tree was estimated using ORTHOSCOPE with human Ero1α and Ero1β as query sequences (highlighted in purple). Sequences highlighted in blue indicate human orthologs. Those highlighted in pink represent habu (P. flavoviridis) orthologs, and those in red boxes represent other snake species. Values beside branches represent the percentages of times that nodes were supported in 100 bootstrap pseudoreplications implemented in ORTHOSCOPE. The scale bar indicates an evolutionary distance of 0.09 substitutions per position.
Toxins 14 00300 g006
Figure 7. Molecular phylogenetic tree for TXN. This tree was estimated using ORTHOSCOPE with human TXN as the query sequence (highlighted in purple). The tree includes the clades TXN2, TXN, TXNL, and TXNL1. Sequences highlighted in blue indicate human orthologs. Those highlighted in pink represent habu (P. flavoviridis) orthologs, and those in red boxes represent other snake species. Values beside branches represent the percentages of times that nodes were supported in 100 bootstrap pseudoreplications implemented in ORTHOSCOPE. The scale bar indicates an evolutionary distance of 0.1 substitutions per position.
Toxins 14 00300 g007
Figure 8. Molecular phylogenetic tree for PRX1, PRX2, PRX3, and PRX4. These trees were estimated using ORTHOSCOPE with human PRX1 (A), PRX2 (B), PRX3 (C), and PRX4 (D) as query sequences (highlighted in gray-colored), respectively. Sequences highlighted in blue indicate human orthologs. Those highlighted in pink represent habu (P. flavoviridis) orthologs, and those in red boxes represent other snake species. Values beside branches represent the percentages of times that nodes were supported in 100 bootstrap pseudoreplications implemented in ORTHOSCOPE. The scale bar indicates an evolutionary distance of 0.1 substitutions per position.
Toxins 14 00300 g008aToxins 14 00300 g008bToxins 14 00300 g008cToxins 14 00300 g008d
Figure 9. Aligned amino acid sequences (A) and a molecular phylogenetic tree (B) for SELENOM. The conserved selenocysteine (U) residue, which is characteristic of selenoproteins, is shown in red. Secondary structures, α-helix and β-strand, are shown with blue boxes and orange arrows, respectively. The signal sequence is also shown in gray. This tree was estimated using ORTHOSCOPE with human SELENOM as the query sequence (highlighted in purple). Sequences highlighted in blue indicate human orthologs. Those highlighted in pink represent habu (P. flavoviridis) orthologs, and those in red boxes represent other snake species. Values beside branches represent the percentages of times that nodes were supported in 100 bootstrap pseudoreplications implemented in ORTHOSCOPE. The scale bar indicates an evolutionary distance of 0.06 substitutions per position.
Toxins 14 00300 g009aToxins 14 00300 g009b
Table 1. Highly expressed genes in venom glands from an adult habu (venom gland-specimen#2: a main adult specimen).
Gene Model IDGene NameAnnotation by Blast2GOTPM
habu1_s258676_g24318.t1CNP01Bradykinin-potentiating and C-type natriuretic peptides438,781.0 Venom protein
habu1_s47459_g23397.t1svPLA2-02, svPLA2-03phospholipase a288,799.1 Venom protein
habu1_s14911_g21429.t1svMP06p-ii partial76,130.9 Venom protein
habu1_s9571_g19434.t1svPLA2-01phospholipase a244,208.4 Venom protein
habu1_s9570_g19432.t1svPLA2-07phospholipase a234,366.9 Venom protein
habu1_s9571_g19433.t1svPLA2-08phospholipase a231,067.9 Venom protein
habu1_s14911_g21430.t1svMP07, svMP08snake venom metalloproteinase 30,773.7 Venom protein
habu1_s10061_g19809.t1svCTLP06flavocetin-A beta15,201.6 Venom protein
habu1_s3443_g11710.t1P4HBprotein disulfide-isomerase8572.4 Modification enzyme for proteins analyzed in this study
habu1_s10061_g19810.t1svCTLP03, svCTLP04, svCTLP07snaclec stejaggregin-a subunit alpha6786.0 Venom protein
habu1_s3258_g11210.t1svMP04metalloprotease piia4821.0 Venom protein
habu1_s3168_g10977.t1svCTLP08venom c-type lectin mannose binding isoform 13305.5 Venom protein
habu1_s3258_g11211.t1svMP05snake venom metalloproteinase 2659.2 Venom protein
habu1_s6789_g17480.t1svSP04snake venom serine protease 2a homolog2416.4 Venom protein
habu1_s2955_g10552.t1 elongation factor 1-alpha 12283.4
habu1_s402940_g24950.t1LAAO01l-amino acid oxidase2124.7 Venom protein
habu1_s158_g00895.t1 forkhead box protein j12102.3
habu1_s5309_g15576.t1 40S ribosomal protein S251678.5 Ribosomal protein
habu1_s2696_g09642.t1SELENOMSelenoprotein M1514.7 Modification enzyme for proteins analyzed in this study
habu1_s68614_g23647.t1 60s ribosomal protein l71508.8 Ribosomal protein
habu1_s1917_g07050.t1 60s ribosomal protein l7a1458.7 Ribosomal protein
habu1_s4106_g13431.t1 serine partial1457.8 Venom protein
habu1_s3471_g11839.t1CALRCalreticulin1422.0 Modification enzyme for proteins analyzed in this study
habu1_s4158_g13542.t1 55 kda erythrocyte membrane protein1406.7
habu1_s4037_g13262.t1 low quality protein: glutathione peroxidase 31337.9
habu1_s3765_g12603.t1 40s ribosomal protein s3a1259.4 Ribosomal protein
habu1_s22025_g22470.t1CRISP01, CRISP02cysteine-rich venom partial1201.7 Venom protein
habu1_s22023_g22469.t1svSP11snake venom serine protease 21194.1 Venom protein
habu1_s6274_g17028.t1 ubiquitin-40s ribosomal protein s27a1159.9 Ribosomal protein
habu1_s1466_g05403.t1 peptidyl-prolyl cis-trans isomerase a-like1149.4
habu1_s399953_g24864.t1svMP09, svMP10metalloproteinase precursor1138.2 Venom protein
habu1_s1390_g04983.t1PDIA3protein disulfide-isomerase a31085.9 Modification enzyme for proteins analyzed in this study
habu1_s2087_g07635.t1 ribosomal protein1075.8 Ribosomal protein
habu1_s7284_g17906.t1 40s ribosomal protein s131019.6 Ribosomal protein
habu1_s9530_g19385.t1 Elongation factor 1-beta999.5
habu1_s4833_g14854.t1 tmsb4x partial971.8
habu1_s2449_g08987.t1 60s ribosomal protein l31965.9 Ribosomal protein
habu1_s7991_g18513.t1 40s ribosomal protein partial934.3 Ribosomal protein
habu1_s37466_g23178.t1 growth-related translationally controlled tumor protein928.1
habu1_s16120_g21649.t1 60s ribosomal protein l18a906.8 Ribosomal protein
habu1_s7978_g18472.t1 60s acidic ribosomal protein p2902.7 Ribosomal protein
habu1_s2862_g10314.t1svMP01, svMP02, svMP03, svMP11, nvMP57disintegrin and metalloproteinase domain-containing protein 28902.6 Venom protein
habu1_s1408_g05043.t1 60s ribosomal protein l5892.3 Ribosomal protein
habu1_s74_g00428.t1 60s ribosomal protein l11872.1 Ribosomal protein
habu1_s6028_g16570.t1sv5Naseecto-5 -nucleotidase852.8 Venom protein
habu1_s399842_g24584.t1 60s ribosomal protein l6852.5 Ribosomal protein
habu1_s188_g01057.t1 60s ribosomal protein partial852.1 Ribosomal protein
habu1_s1608_g06024.t1 40s ribosomal protein s4837.9 Ribosomal protein
habu1_s1167_g04045.t1 polyadenylate-binding protein 1 isoform x1834.0
habu1_s2592_g09366.t1 cytoplasmic 2819.2
Transcripts are expressed as “Transcripts per million” (TPM). red: Venom protein genes, blue: Protein modification genes analyzed in this study.
Table 2. Gene expression level of P4HB, PDIA3, SELENOM, CALR, PDI family genes and PDI family related genes by RNA-seq analysis of tissues and organs of Protobothrops flavoviridis.
Gene Model IDGene NameVenom Gland (Specimen #1)Venom Gland (Specimen #2)Venom Fang Forming TissueLungLiverKidneySmall IntestineColonStomachPancreasHeartMasseter MuscleBrain (Specimen #1)Brain (Specimen #2)EyeNosePit, Infrared Sensing OrganSpleenOvaryFetal Fibroblast
habu1_s2696_g09642SELENOM1928.2 1514.7 273.2 104.5 3.9 12.1 38.7 179.5 31.5 311.1 53.2 15.0 178.8 72.2 675.8 1184.5 407.1 213.1 4.1 261.9
habu1_s3471_g11839CALR361.1 1422.0 531.0 258.3 71.7 172.5 295.9 375.4 167.4 78.4 139.7 141.8 281.4 319.0 184.1 569.8 413.7 159.2 464.0 1859.1
habu1_s3443_g11710P4HB13,303.9 8572.4 955.2 1564.9 3765.2 1874.4 4083.9 1789.5 2381.0 2265.3 349.7 601.7 249.8 213.4 771.6 1268.3 1256.5 1916.5 645.9 917.0
habu1_s2789_g10033PDIA20.1 0.2 0.4 0.7 0.1 0.0 0.4 0.3 59.1 0.1 0.2 0.6 0.6 0.5 0.3 1.1 0.5 0.1 0.5 0.2
habu1_s1390_g04983PDIA32266.3 1085.9 601.2 856.4 420.2 614.1 1074.1 857.4 675.8 425.2 272.4 214.7 270.0 276.4 434.1 892.6 728.6 455.6 427.0 872.6
habu1_s10239_g19902PDIA495.7 172.3 159.4 164.9 68.8 83.5 61.6 121.6 164.6 129.3 63.4 29.2 47.0 50.3 82.5 141.3 182.9 122.6 134.7 252.0
habu1_s2439_g08885PDIA515.8 27.7 35.9 14.1 9.9 7.1 26.8 44.1 24.9 3.0 5.6 1.5 17.4 13.8 14.4 38.1 34.2 6.5 72.8 79.6
habu1_s604_g02858PDIA6181.2 388.5 146.1 71.4 18.6 33.8 35.9 146.4 40.3 29.6 34.4 30.5 68.4 66.3 62.9 195.6 149.5 83.5 135.3 541.2
habu1_s25599_g22719ERp270.1 0.7 1.5 2.9 0.0 1.2 0.2 2.4 0.7 402.7 0.5 1.6 1.1 0.8 1.6 0.6 4.9 240.8 0.3 2.0
habu1_s66_g00353ERp2715.7 5.9 119.4 203.5 20.6 32.1 41.4 170.0 50.9 885.9 49.8 12.0 275.5 312.6 39.9 86.8 134.5 791.5 6.4 262.6
habu1_s399842_g24580ERp2953.1 38.4 112.9 84.2 19.5 22.6 100.1 109.9 43.6 10.1 36.5 15.4 44.9 48.3 40.5 180.2 102.4 32.8 52.0 239.2
habu1_s32648_g23040ERp4415.2 15.5 45.5 17.9 5.8 13.1 19.6 22.8 15.6 4.3 12.3 4.5 24.3 22.9 14.8 32.1 27.2 10.4 42.5 25.7
habu1_s1939_g07114TMX16.9 5.0 23.1 25.4 17.1 22.9 20.3 23.8 11.2 4.7 21.4 11.9 30.5 38.9 12.9 21.1 21.6 17.8 46.5 26.3
habu1_s5624_g16107TMX218.9 9.5 36.8 43.6 25.9 45.5 30.2 35.9 42.8 9.1 93.2 29.3 122.0 142.7 35.3 43.4 42.5 14.8 101.2 26.9
habu1_s4708_g14660TMX38.0 3.8 43.3 23.1 5.4 19.7 13.0 19.3 13.6 2.2 20.5 4.5 42.7 43.6 15.3 54.6 33.7 12.5 25.6 56.0
habu1_s8507_g18763TMX41.7 1.4 9.9 8.6 25.7 14.9 6.0 6.6 3.1 0.5 3.4 1.0 19.5 16.5 6.5 5.5 9.5 4.5 51.4 10.8
habu1_s3682_g12384TXNDC553.1 38.4 112.9 84.2 19.5 22.6 100.1 109.9 43.6 10.1 36.5 15.4 44.9 48.3 40.5 180.2 102.4 32.8 52.0 239.2
habu1_s2744_g09787TXNDC1299.8 160.0 134.1 101.1 28.8 51.5 72.6 75.0 58.3 21.8 54.4 24.5 99.7 70.7 60.8 127.3 127.1 50.3 49.0 224.3
habu1_s49803_g23445AGR222.4 3.0 406.3 183.2 0.3 77.9 199.0 777.2 649.1 1.8 0.5 12.3 6.8 1.4 33.8 884.0 356.9 0.7 0.7 0.2
habu1_s49803_g23446AGR30.0 0.0 0.3 0.0 0.6 0.1 0.0 0.0 0.1 0.5 0.2 0.1 0.0 0.1 0.4 11.4 0.6 0.1 0.3 0.0
habu1_s2168_g07811DNAJC102.2 5.7 10.8 3.3 0.6 4.8 4.5 6.8 9.6 0.4 11.0 5.2 18.1 16.3 3.8 10.0 10.7 2.9 102.0 58.3
habu1_s2370_g08604CASQ13732.7 97.1 485.9 6.5 4.7 12.9 118.6 5.1 16.0 1.2 19.3 42,708.5 61.8 59.8 142.0 114.3 1277.6 4.3 39.8 9.4
habu1_s8721_g18867CASQ21.3 0.1 0.5 2.6 0.0 0.5 0.2 1.9 0.8 0.1 662.8 11.7 22.2 20.0 22.2 0.9 26.3 1.3 1.7 0.6
habu1_s1275_g04450Ero1α1.8 3.3 21.0 9.2 1.2 3.2 7.4 13.3 16.7 0.3 2.0 0.4 25.2 18.9 4.6 12.0 5.9 3.3 7.7 29.3
habu1_s114618_g23966 habu1_s4277_g13858Ero1β75.1 247.6 91.8 44.0 50.4 24.2 20.7 37.1 45.1 182.8 21.5 8.5 49.6 59.8 60.1 498.9 125.2 200.8 255.9 117.9
habu1_s27414_g22805PRX4211.6 229.4 118.4 280.8 342.2 98.1 245.3 154.7 157.9 229.6 71.1 28.8 52.8 53.5 68.6 121.5 144.5 187.7 104.7 215.9
Publisher’s Note: MDPI stays neutral with regard to jurisdictional claims in published maps and institutional affiliations.

