Cereulide and Deoxynivalenol Increase LC3 Protein Levels in HepG2 Liver Cells

 ,
,  , and
, and 
Abstract
:
1. Introduction
2. Results
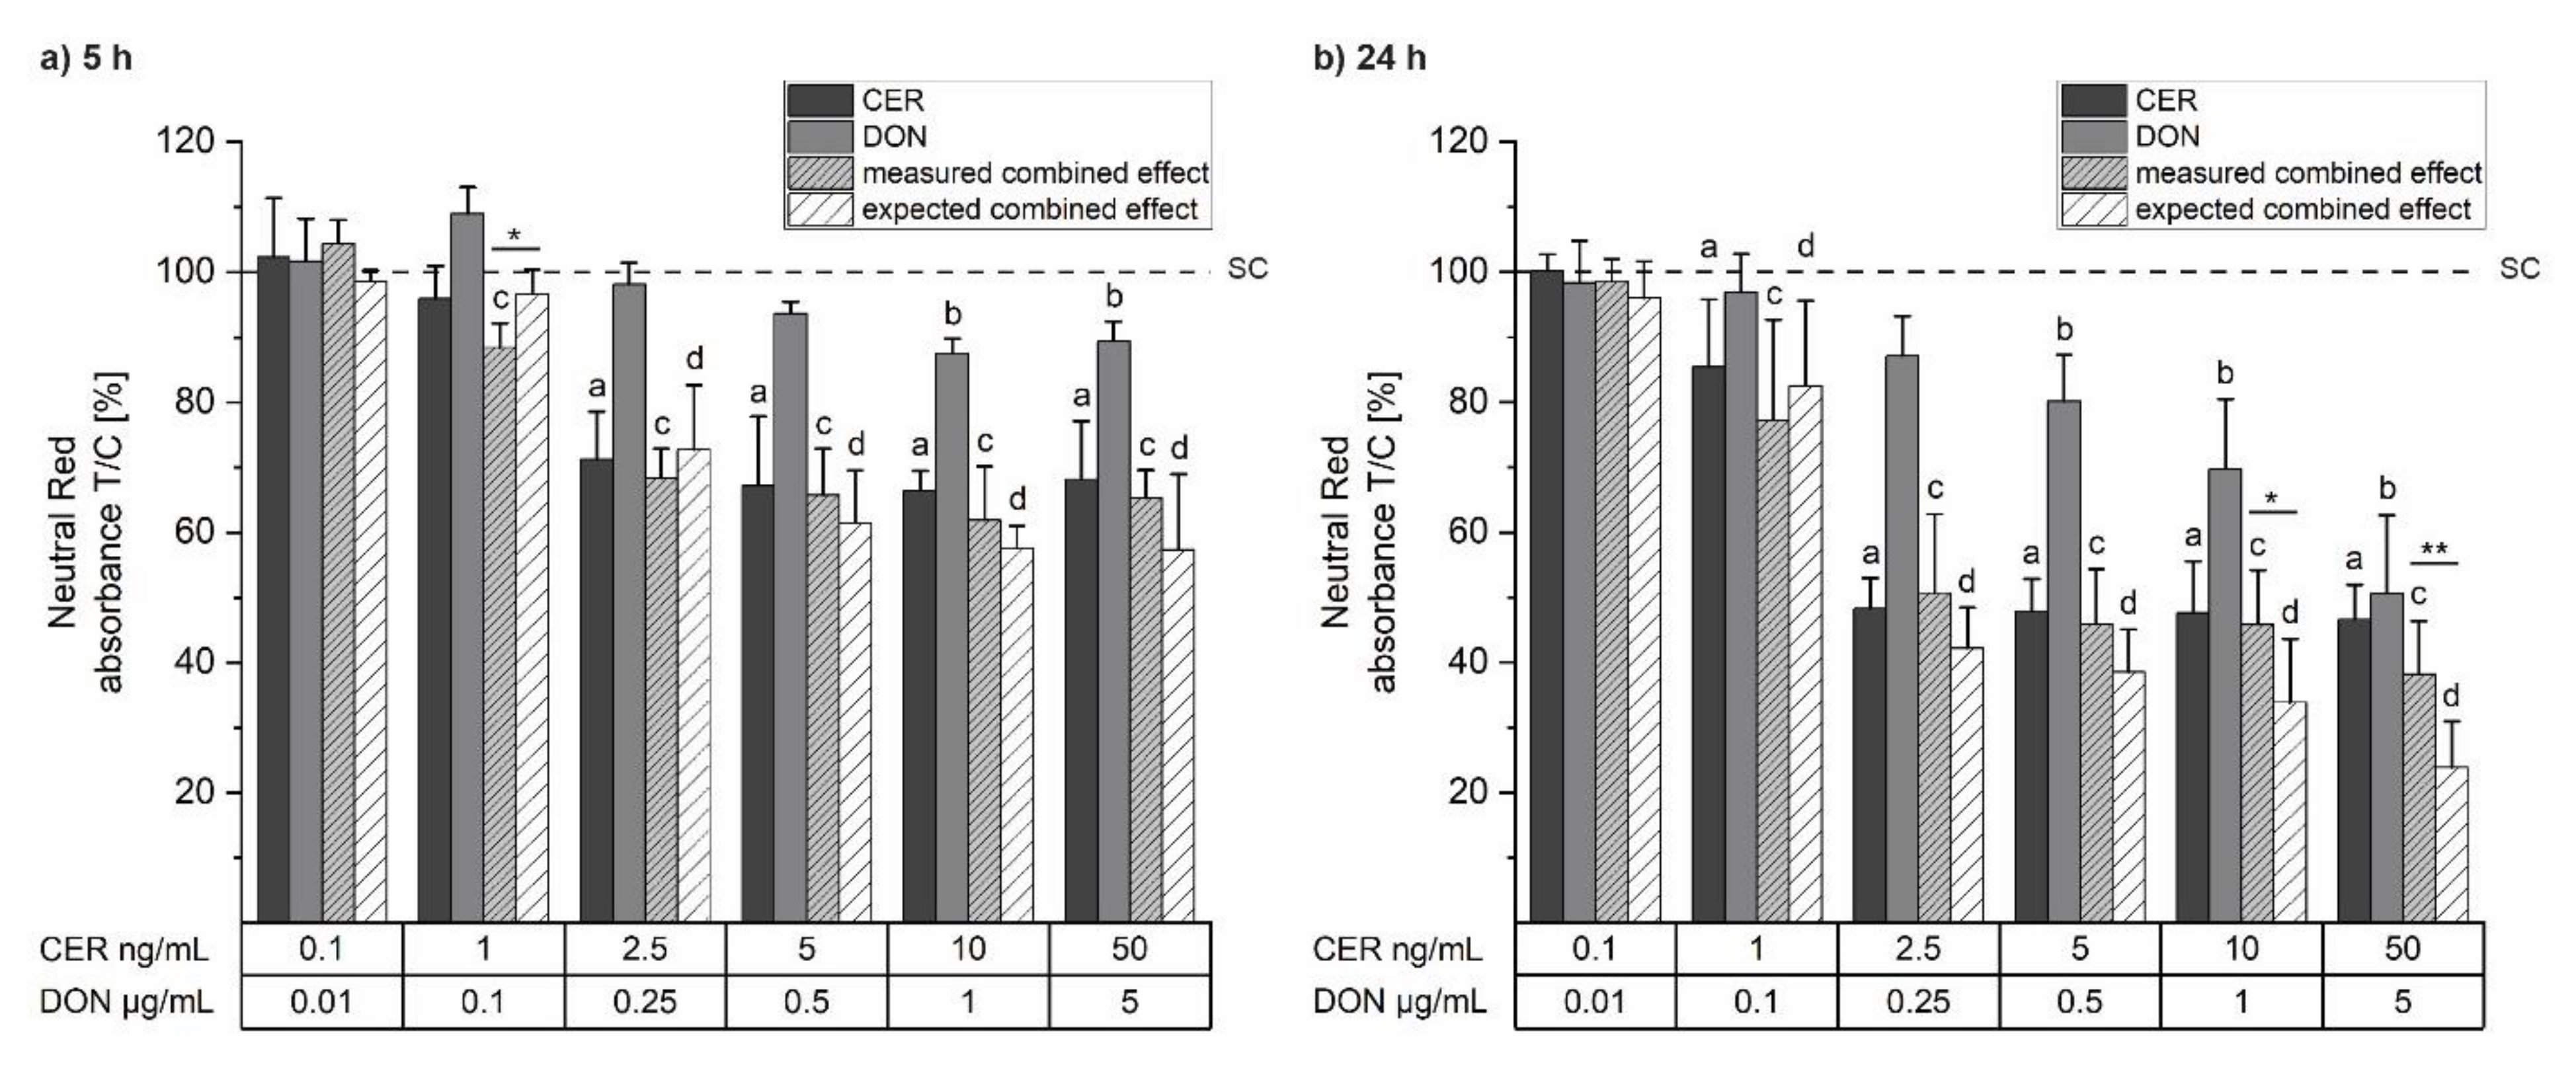
2.1. Cell Viability
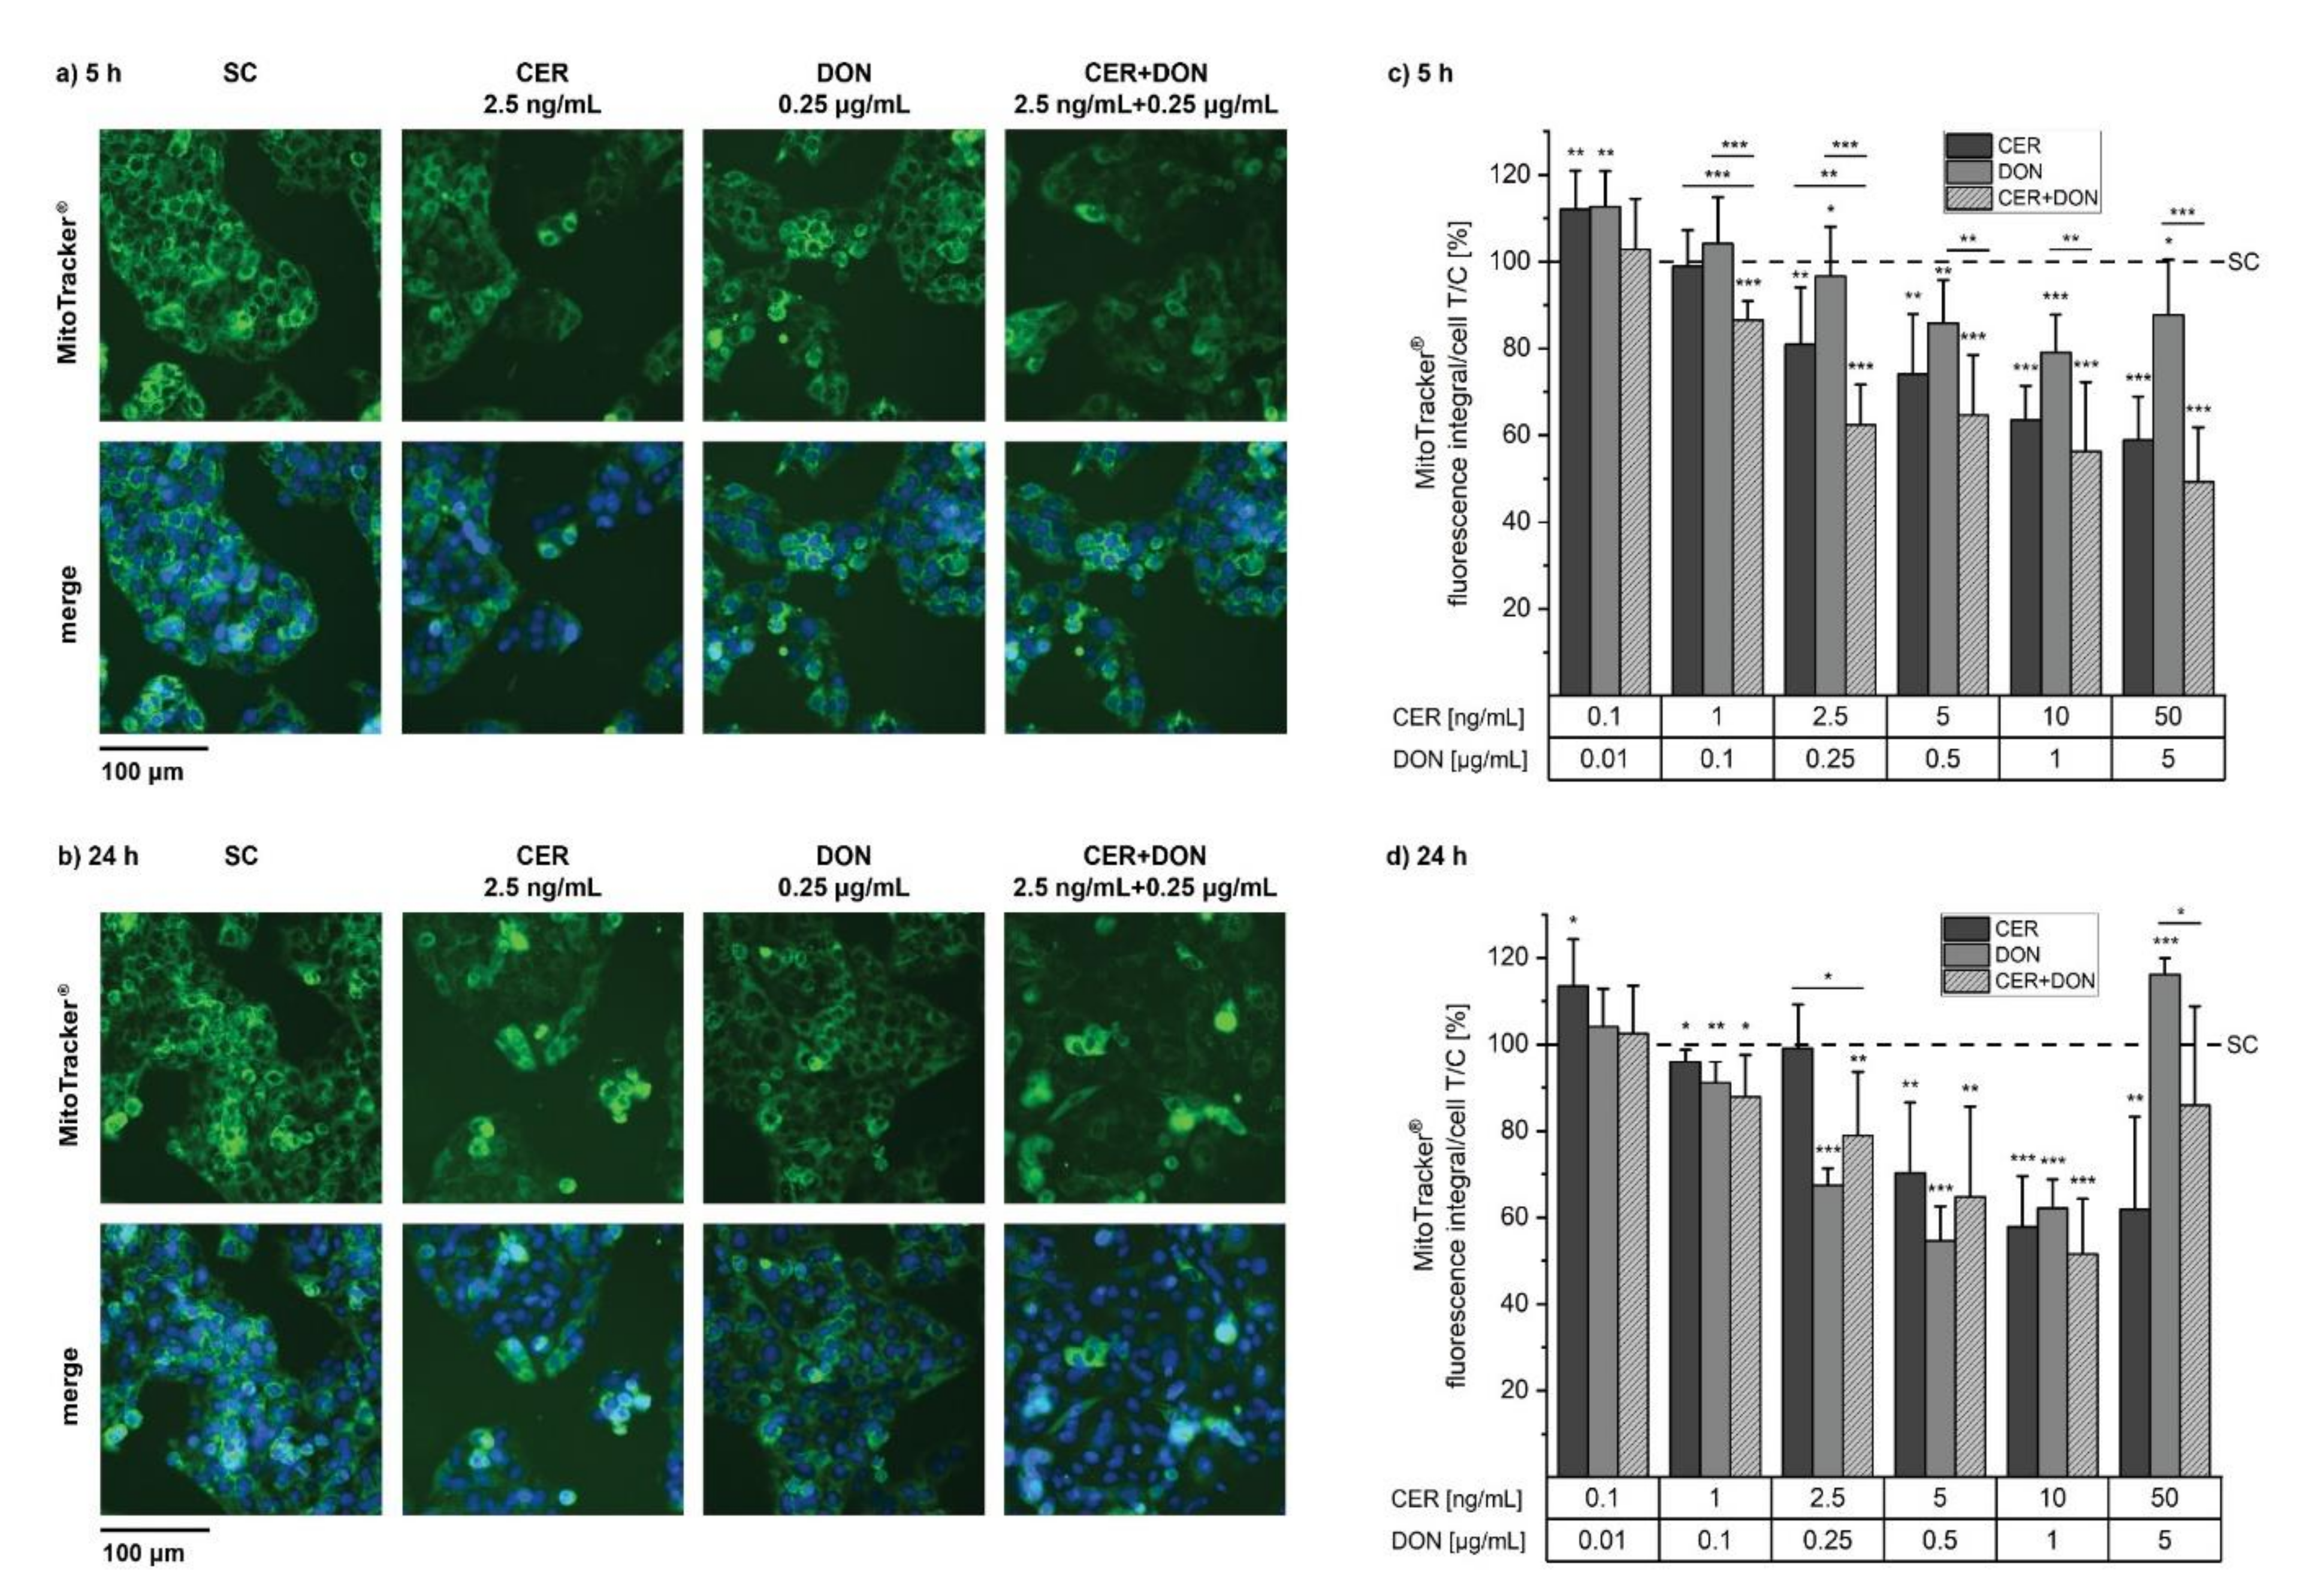
2.2. MitoTracker®
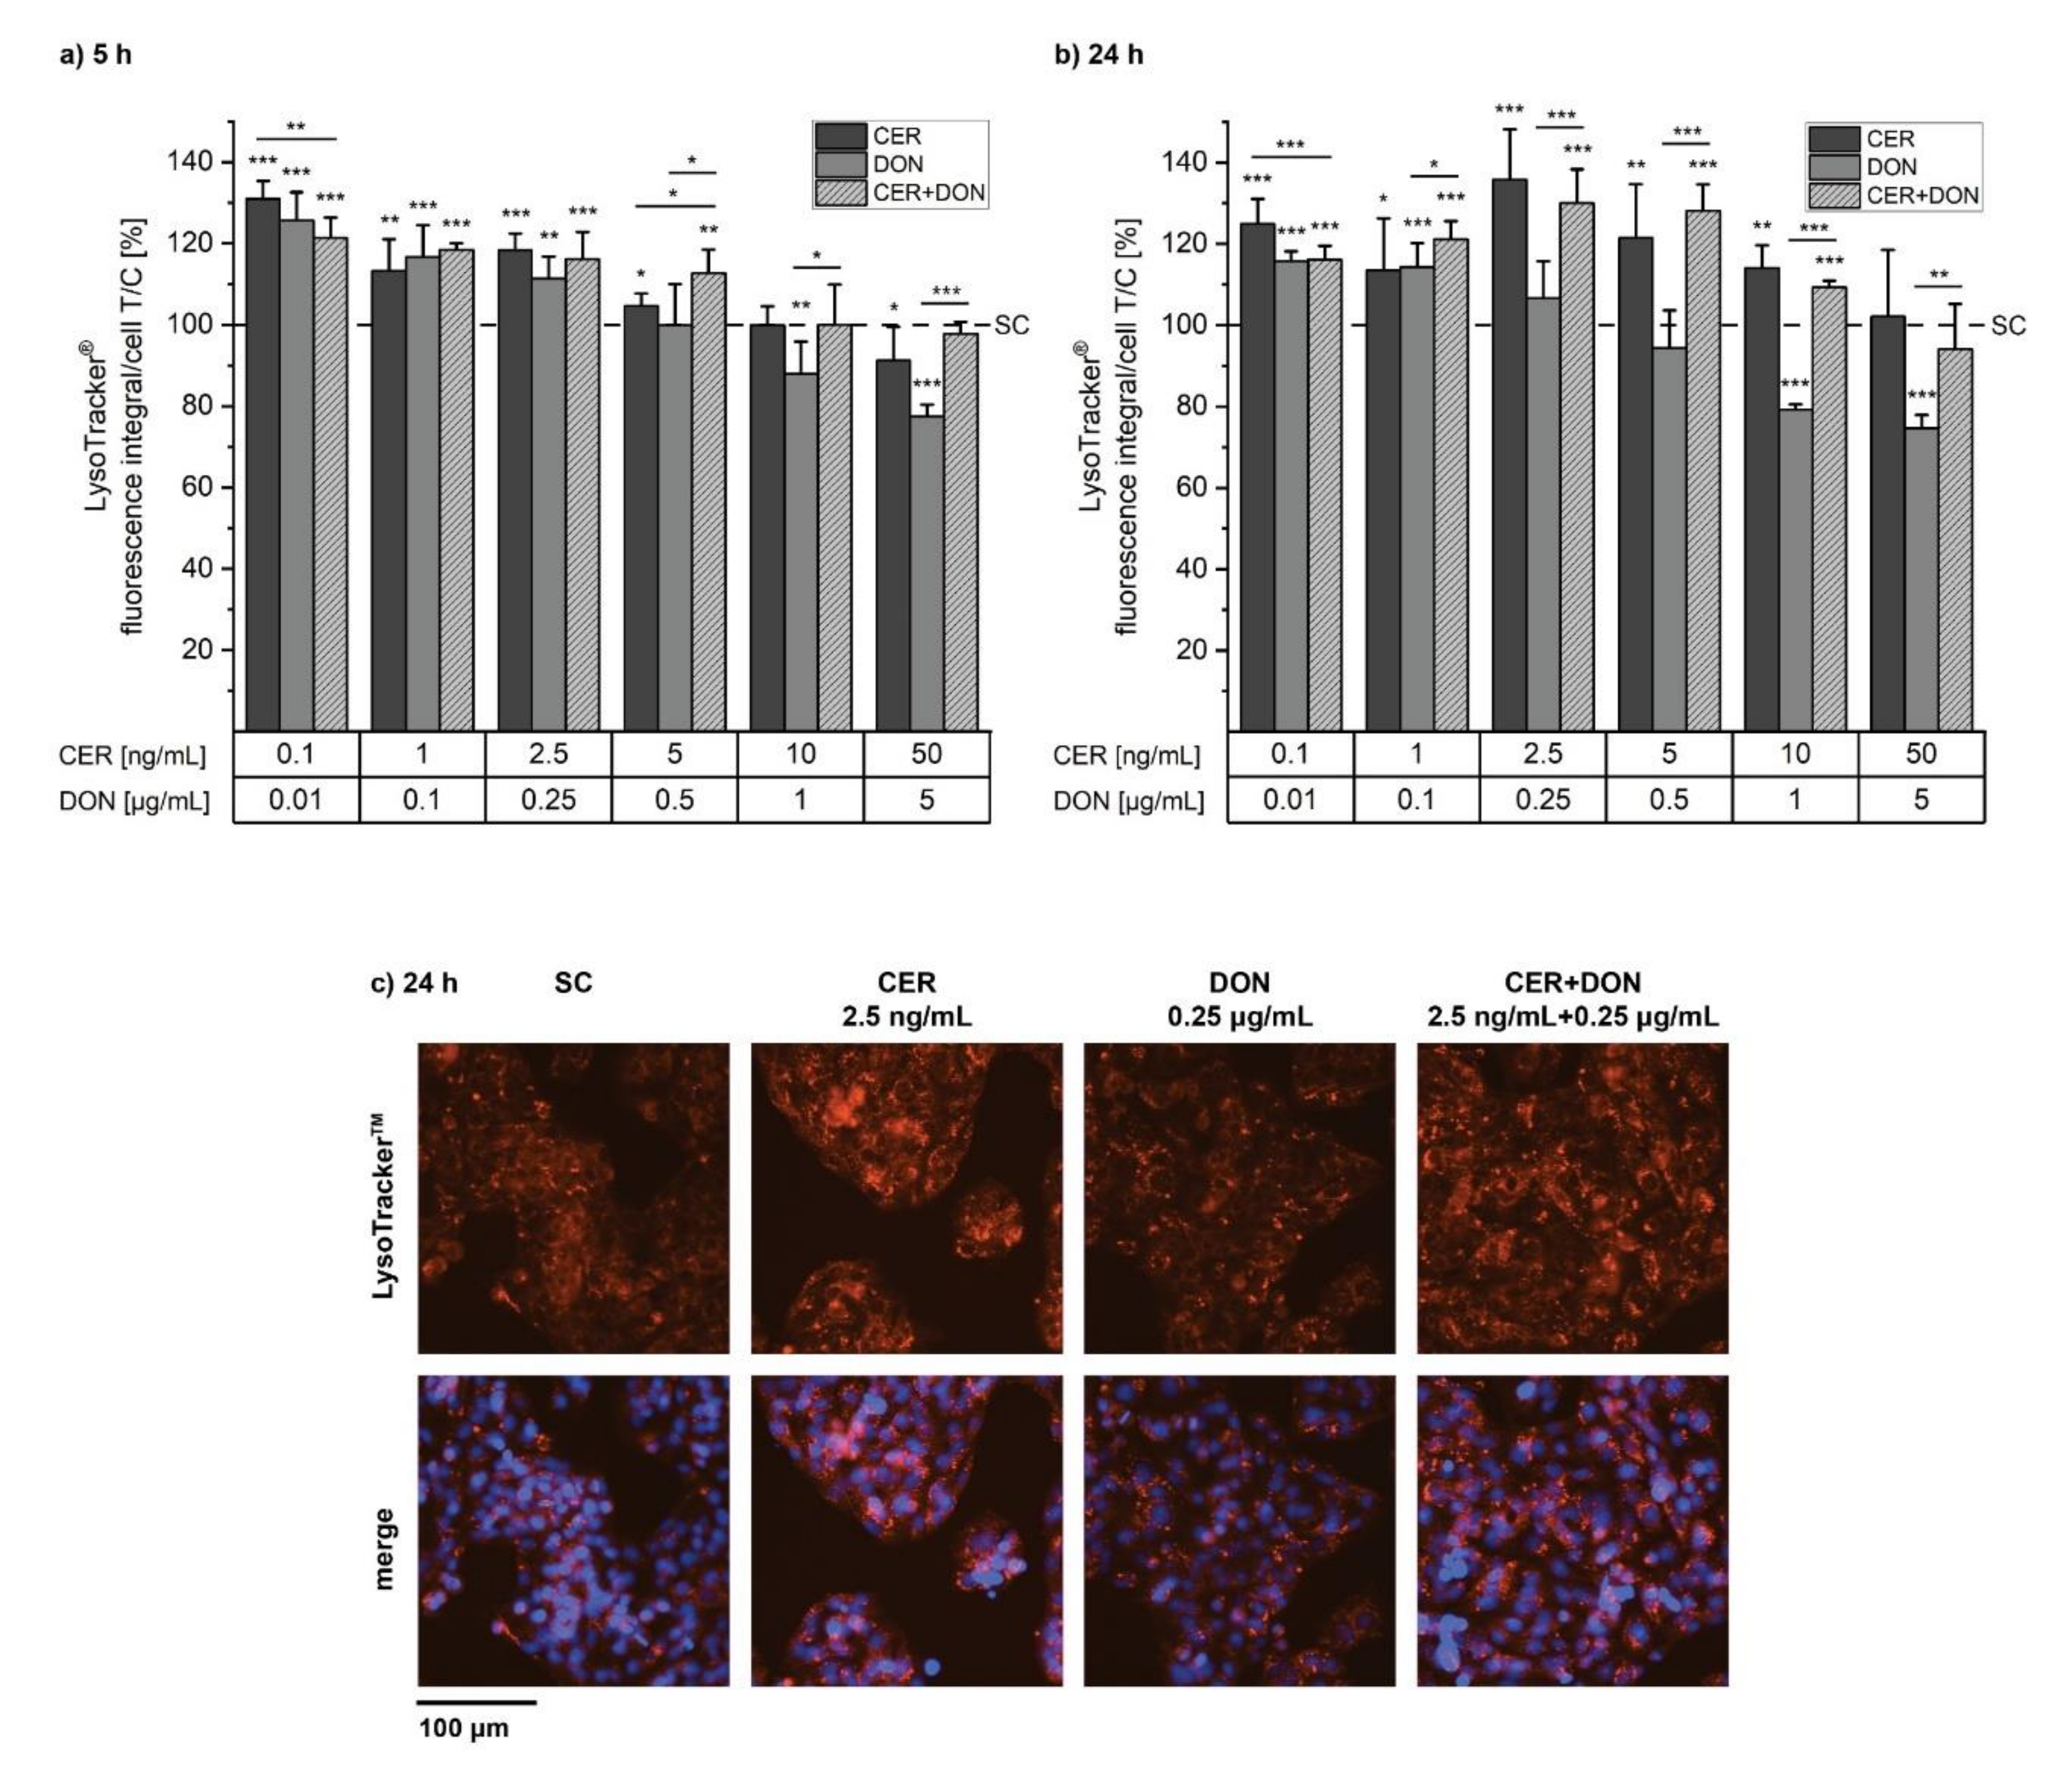
2.3. LysoTracker®
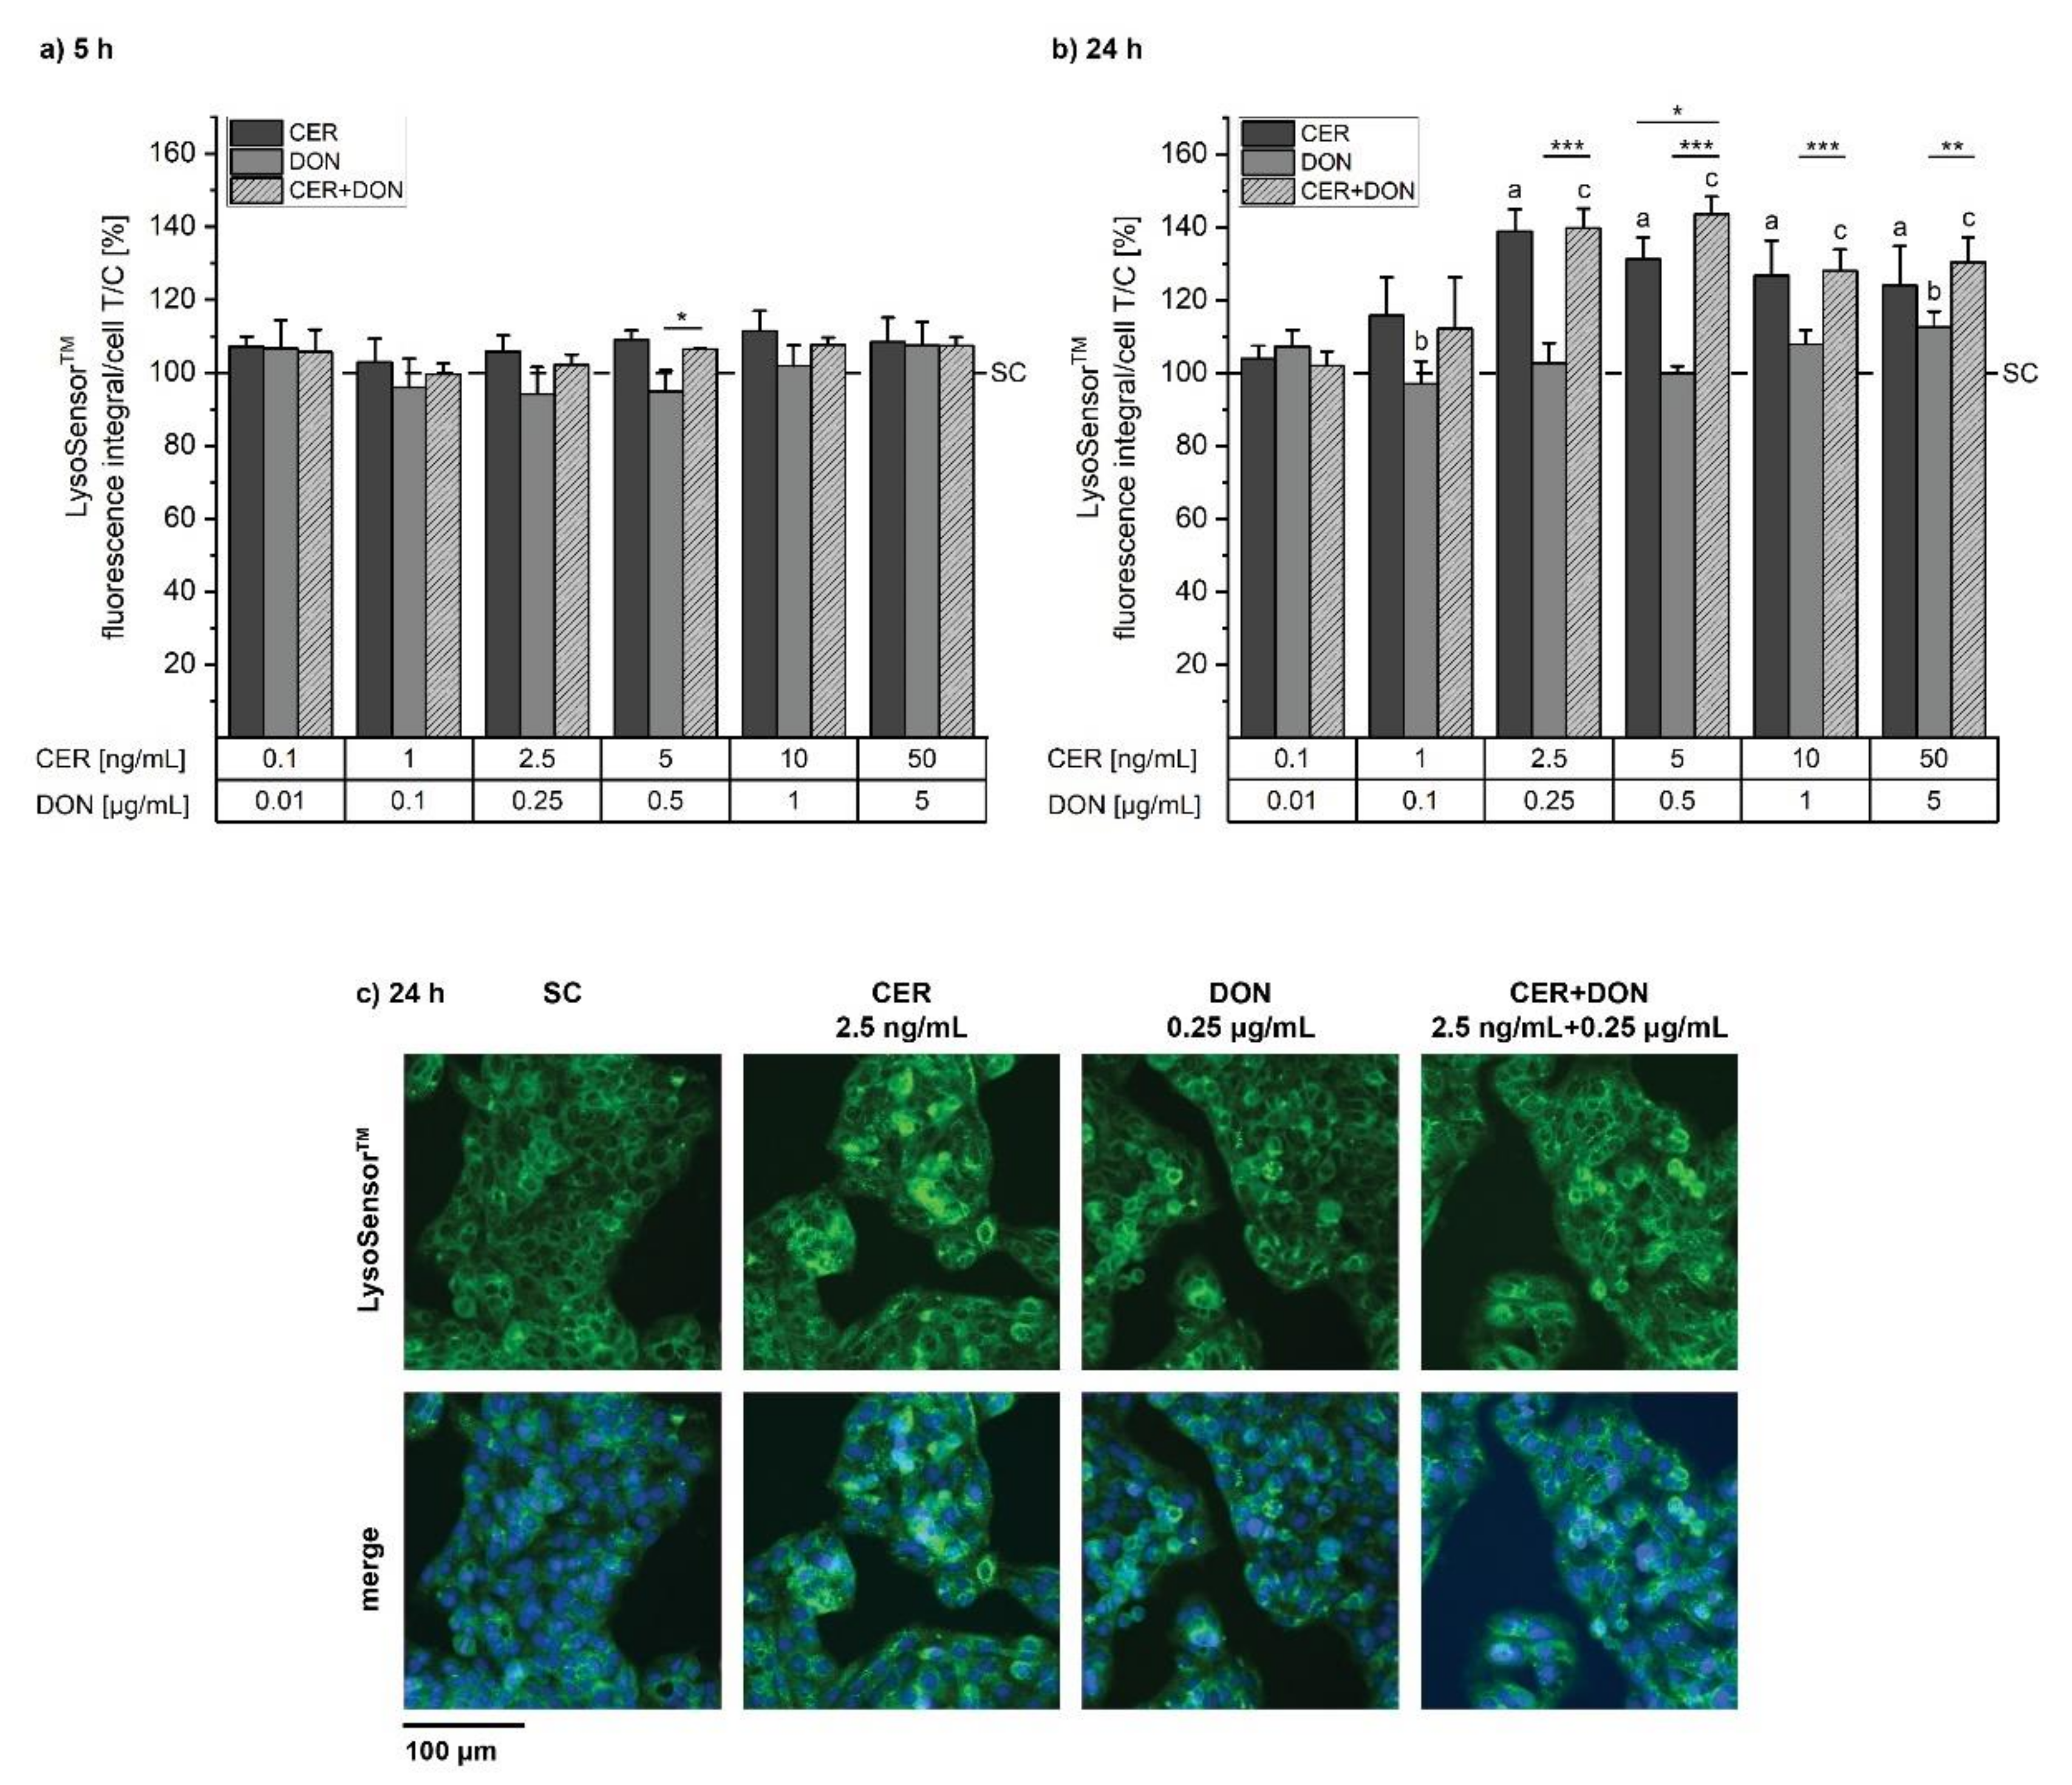
2.4. LysoSensorTM
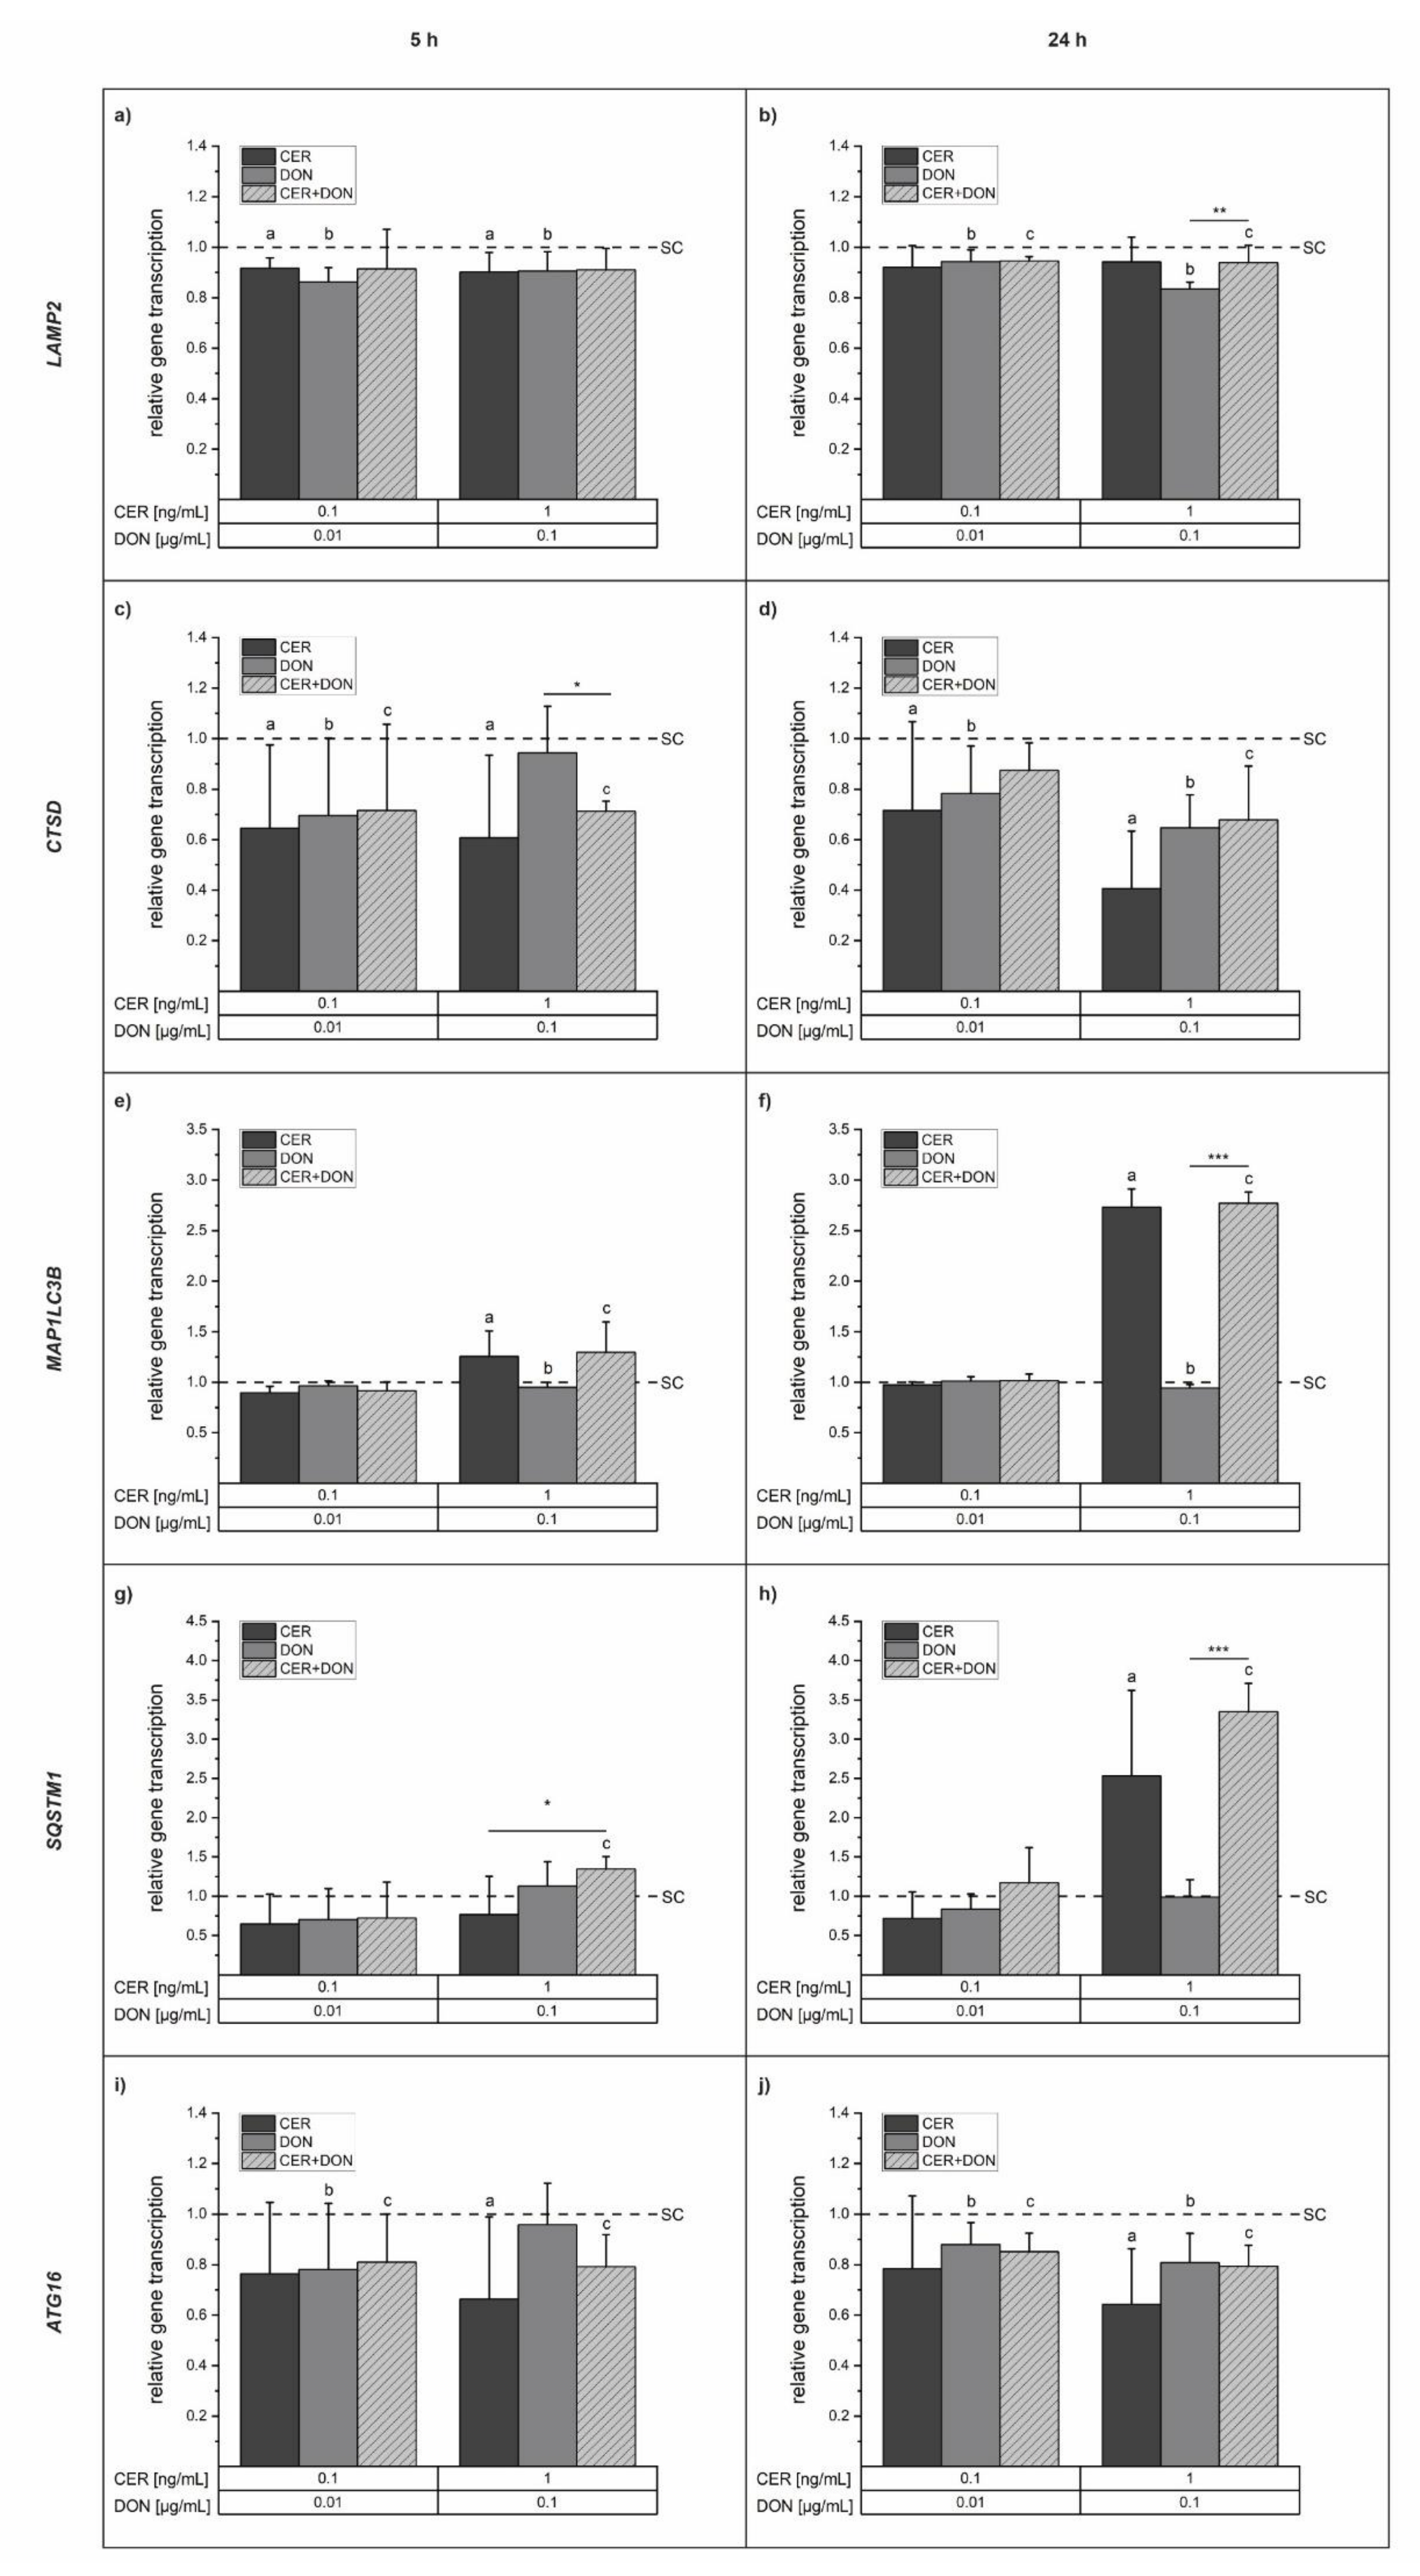
2.5. Gene Transcription Analysis: Quantitative Real-Time PCR (qPCR)
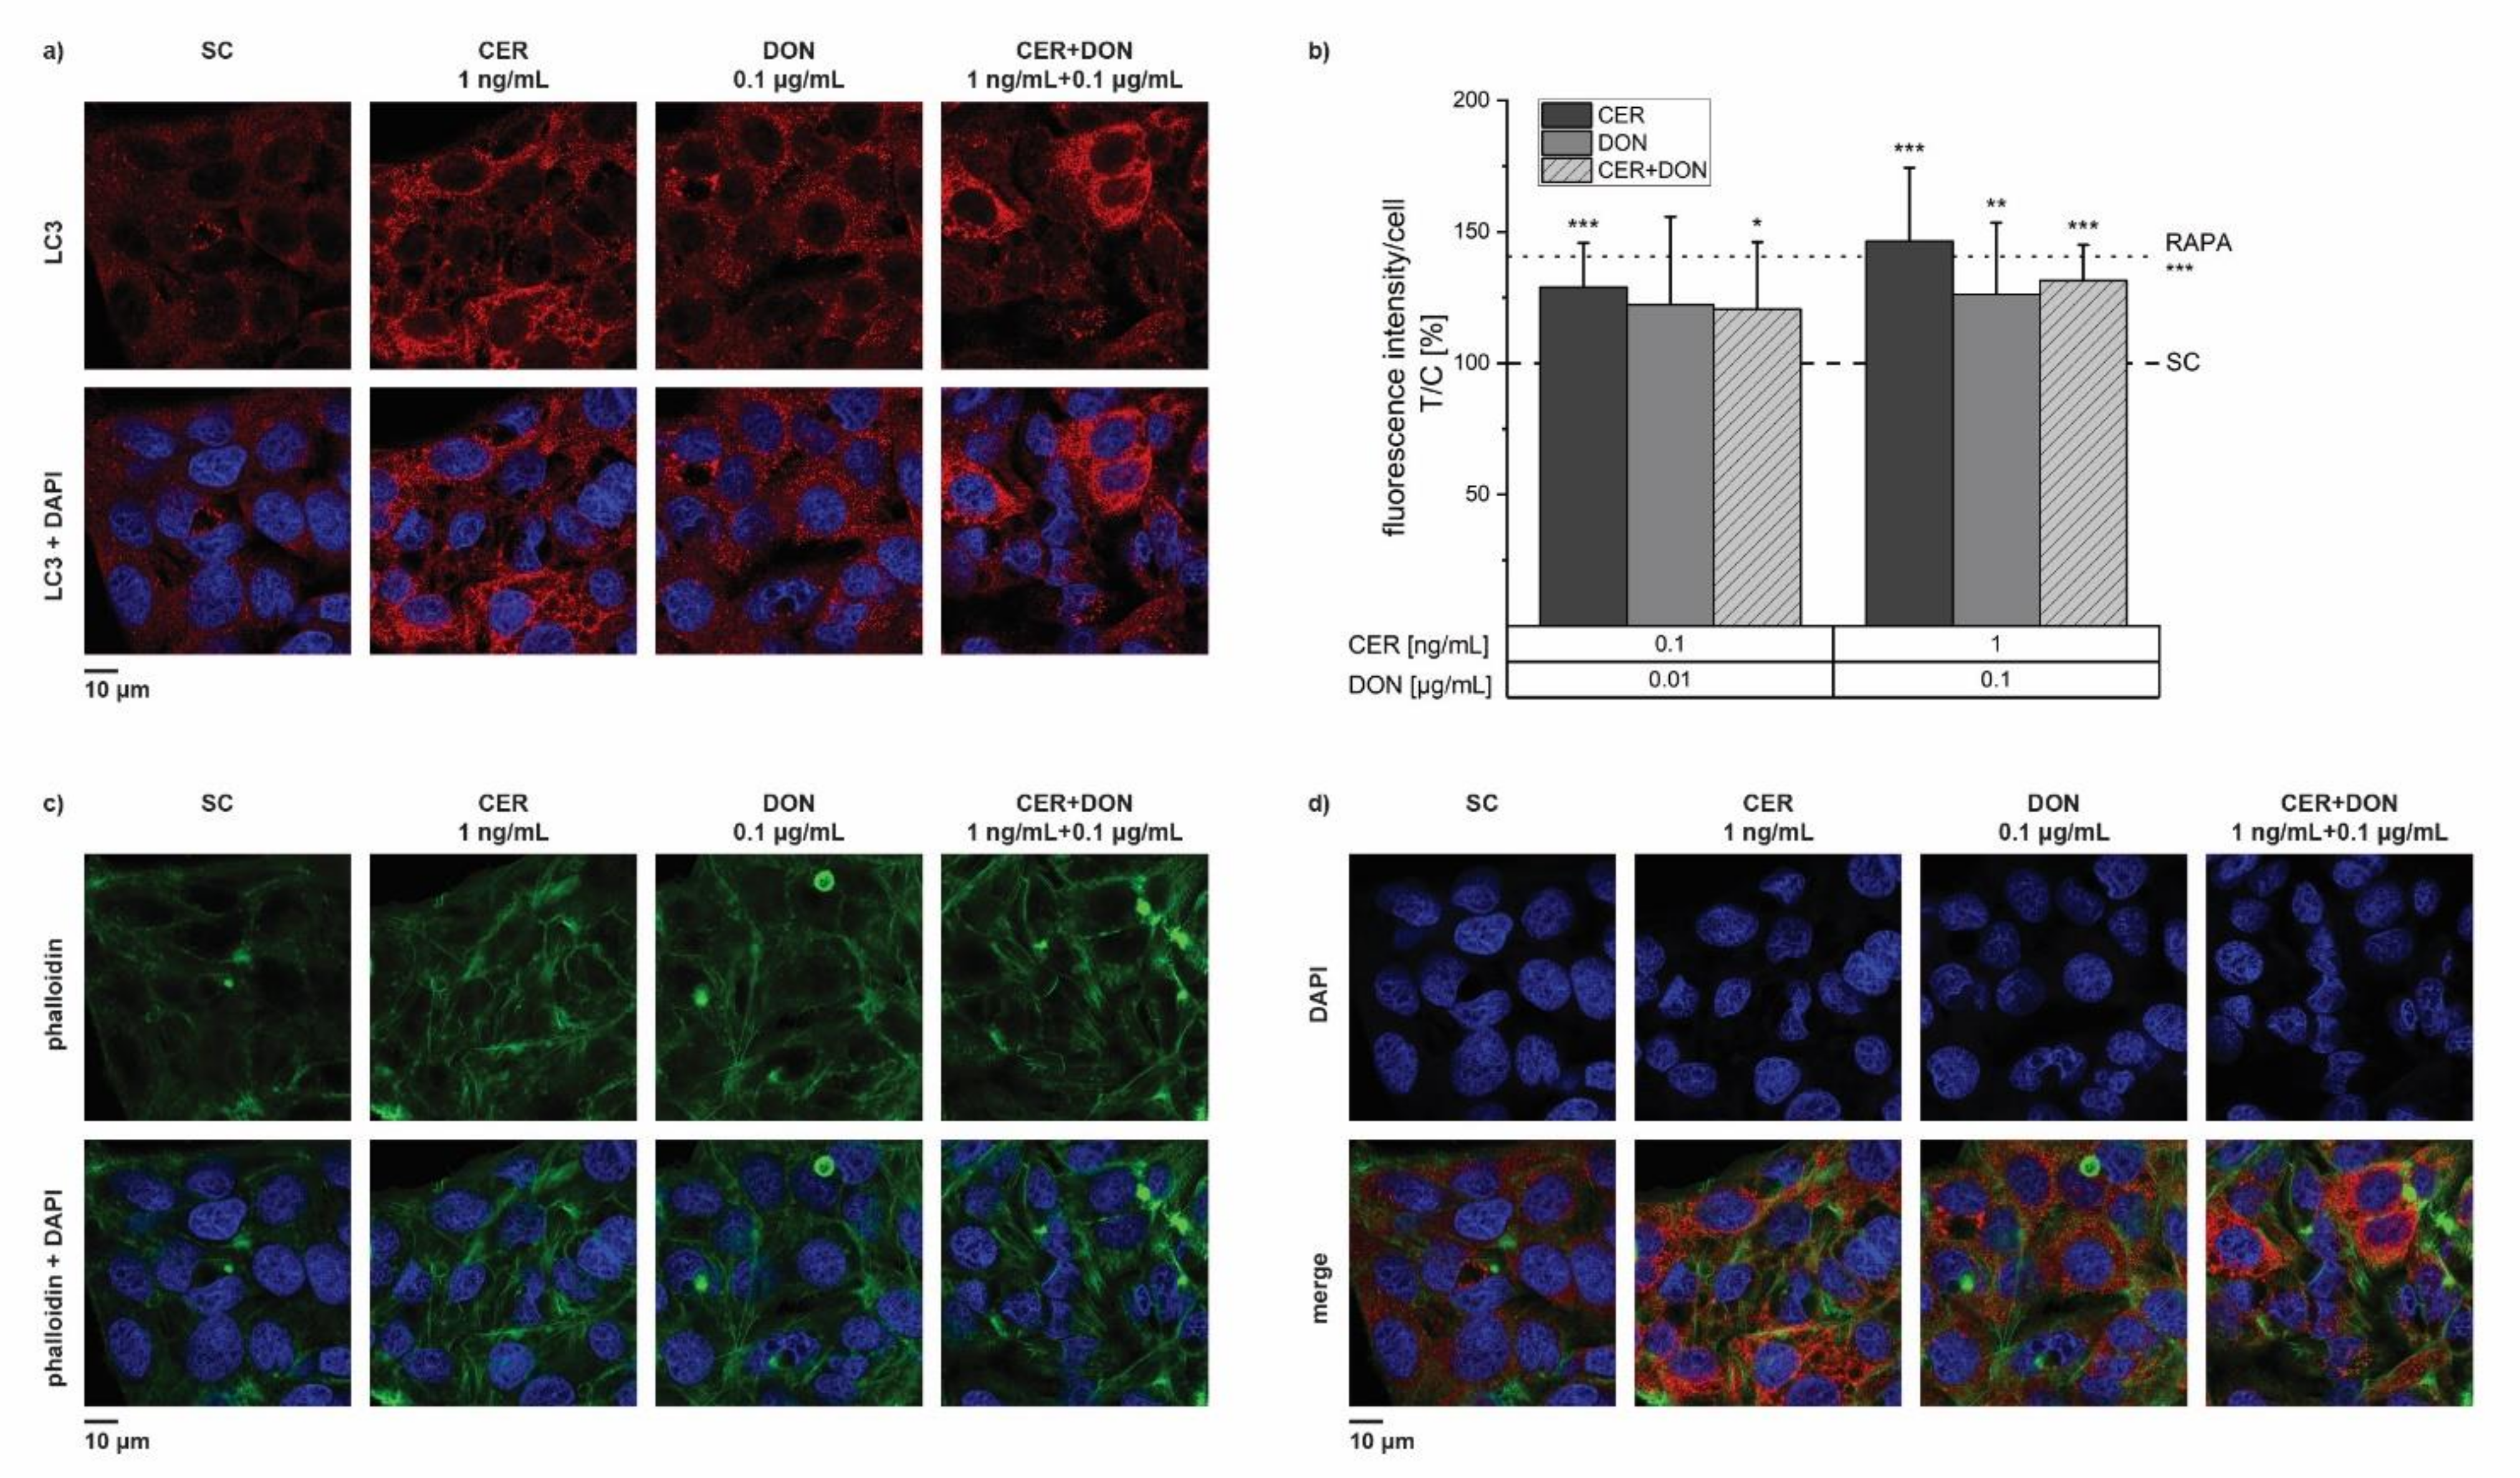
2.6. Immunofluorescence Analysis of LC3
3. Discussion
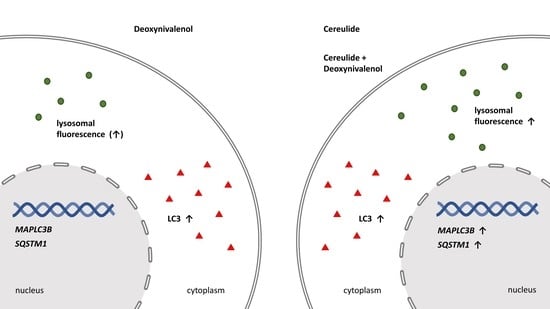
4. Conclusions
5. Materials and Methods
5.1. Chemicals and Materials
5.2. Cell Culture: HepG2 Cell Line
5.3. Incubation Conditions and Dose Selection
5.4. Cell Viability: Neutral Red Assay
5.5. MitoTracker® and LysoTracker®
5.6. LysoSensorTM
5.7. Gene Transcription Analysis: Quantitative Real-Time PCR
5.8. Immunofluorescence Analysis of LC3
5.9. Statistical Analysis and Mathematical Modelling
Supplementary Materials
Author Contributions
Funding
Institutional Review Board Statement
Informed Consent Statement
Data Availability Statement
Acknowledgments
Conflicts of Interest
References
- Messelhausser, U.; Frenzel, E.; Blochinger, C.; Zucker, R.; Kampf, P.; Ehling-Schulz, M. Emetic Bacillus cereus are more volatile than thought: Recent foodborne outbreaks and prevalence studies in Bavaria (2007–2013). BioMed. Res. Int. 2014, 2014, 465603. [Google Scholar] [CrossRef] [PubMed]
- Delbrassinne, L.; Andjelkovic, M.; Dierick, K.; Denayer, S.; Mahillon, J.; Van Loco, J. Prevalence and levels of Bacillus cereus emetic toxin in rice dishes randomly collected from restaurants and comparison with the levels measured in a recent foodborne outbreak. Foodborne Pathog. Dis. 2012, 9, 809–814. [Google Scholar] [CrossRef] [PubMed]
- Mishra, S.; Srivastava, S.; Dewangan, J.; Divakar, A.; Kumar Rath, S. Global occurrence of deoxynivalenol in food commodities and exposure risk assessment in humans in the last decade: A survey. Crit. Rev. Food Sci. Nutr. 2019, 60, 1346–1374. [Google Scholar] [CrossRef] [PubMed]
- Palumbo, R.; Crisci, A.; Venâncio, A.; Cortiñas Abrahantes, J.; Dorne, J.-L.; Battilani, P.; Toscano, P. Occurrence and Co-Occurrence of Mycotoxins in Cereal-Based Feed and Food. Microorganisms 2020, 8, 74. [Google Scholar] [CrossRef] [PubMed]
- Agata, N.; Mori, M.; Ohta, M.; Suwan, S.; Ohtani, I.; Isobe, M. A novel dodecadepsipeptide, cereulide, isolated from Bacillus cereus causes vacuole formation in HEp-2 cells. FEMS Microbiol. Lett. 1994, 121, 31–34. [Google Scholar]
- Makarasen, A.; Yoza, K.; Isobe, M. Higher structure of cereulide, an emetic toxin from Bacillus cereus, and special comparison with valinomycin, an antibiotic from Streptomyces fulvissimus. Chem. Asian J. 2009, 4, 688–698. [Google Scholar] [CrossRef]
- Ehling-Schulz, M.; Svensson, B.; Guinebretiere, M.H.; Lindback, T.; Andersson, M.; Schulz, A.; Fricker, M.; Christiansson, A.; Granum, P.E.; Martlbauer, E.; et al. Emetic toxin formation of Bacillus cereus is restricted to a single evolutionary lineage of closely related strains. Microbiology 2005, 151, 183–197. [Google Scholar] [CrossRef]
- Tschiedel, E.; Rath, P.M.; Steinmann, J.; Becker, H.; Dietrich, R.; Paul, A.; Felderhoff-Müser, U.; Dohna-Schwake, C. Lifesaving liver transplantation for multi-organ failure caused by Bacillus cereus food poisoning. Pediatric Transplant. 2015, 19, E11–E14. [Google Scholar] [CrossRef]
- Posfay-Barbe, K.M.; Schrenzel, J.; Frey, J.; Studer, R.; Korff, C.; Belli, D.C.; Parvex, P.; Rimensberger, P.C.; Schappi, M.G. Food poisoning as a cause of acute liver failure. Pediatric Infect. Dis. J. 2008, 27, 846–847. [Google Scholar] [CrossRef]
- Mahler, H.; Pasi, A.; Kramer, J.M.; Schulte, P.; Scoging, A.C.; Bar, W.; Krahenbuhl, S. Fulminant liver failure in association with the emetic toxin of Bacillus cereus. N. Engl. J. Med. 1997, 336, 1142–1148. [Google Scholar] [CrossRef]
- Naranjo, M.; Denayer, S.; Botteldoorn, N.; Delbrassinne, L.; Veys, J.; Waegenaere, J.; Sirtaine, N.; Driesen, R.B.; Sipido, K.R.; Mahillon, J.; et al. Sudden death of a young adult associated with Bacillus cereus food poisoning. J. Clin. Microbiol. 2011, 49, 4379–4381. [Google Scholar] [CrossRef] [PubMed]
- Woelflingseder, L.; Del Favero, G.; Blazevic, T.; Heiss, E.H.; Haider, M.; Warth, B.; Adam, G.; Marko, D. Impact of glutathione modulation on the toxicity of the Fusarium mycotoxins deoxynivalenol (DON), NX-3 and butenolide in human liver cells. Toxicol. Lett. 2018, 299, 104–117. [Google Scholar] [CrossRef] [PubMed]
- Königs, M.; Schwerdt, G.; Gekle, M.; Humpf, H.U. Effects of the mycotoxin deoxynivalenol on human primary hepatocytes. Mol. Nutr. Food Res. 2008, 52, 830–839. [Google Scholar] [CrossRef] [PubMed]
- Peng, Z.; Chen, L.; Nüssler, A.K.; Liu, L.; Yang, W. Current sights for mechanisms of deoxynivalenol-induced hepatotoxicity and prospective views for future scientific research: A mini review. J. Appl. Toxicol. 2017, 37, 518–529. [Google Scholar] [CrossRef]
- Mikkola, R.; Saris, N.E.; Grigoriev, P.A.; Andersson, M.A.; Salkinoja-Salonen, M.S. Ionophoretic properties and mitochondrial effects of cereulide: The emetic toxin of B. cereus. Eur. J. Biochem. 1999, 263, 112–117. [Google Scholar] [CrossRef]
- Decleer, M.; Jovanovic, J.; Vakula, A.; Udovicki, B.; Agoua, R.E.K.; Madder, A.; De Saeger, S.; Rajkovic, A. Oxygen Consumption Rate Analysis of Mitochondrial Dysfunction Caused by Bacillus cereus Cereulide in Caco-2 and HepG2 Cells. Toxins 2018, 10, 266. [Google Scholar] [CrossRef] [PubMed]
- Svingen, T.; Lund Hansen, N.; Taxvig, C.; Vinggaard, A.M.; Jensen, U.; Have Rasmussen, P. Enniatin B and beauvericin are common in Danish cereals and show high hepatotoxicity on a high-content imaging platform. Environ. Toxicol. 2017, 32, 1658–1664. [Google Scholar] [CrossRef]
- Bensassi, F.; Gallerne, C.; Sharaf El Dein, O.; Lemaire, C.; Hajlaoui, M.R.; Bacha, H. Involvement of mitochondria-mediated apoptosis in deoxynivalenol cytotoxicity. Food Chem. Toxicol. Int. J. Publ. Br. Ind. Biol. Res. Assoc. 2012, 50, 1680–1689. [Google Scholar] [CrossRef]
- Del Favero, G.; Janker, L.; Neuditschko, B.; Hohenbichler, J.; Kiss, E.; Woelflingseder, L.; Gerner, C.; Marko, D. Exploring the dermotoxicity of the mycotoxin deoxynivalenol: Combined morphologic and proteomic profiling of human epidermal cells reveals alteration of lipid biosynthesis machinery and membrane structural integrity relevant for skin barrier function. Arch. Toxicol. 2021, 95, 2201–2221. [Google Scholar] [CrossRef] [PubMed]
- Pestka, J.J. Deoxynivalenol: Mechanisms of action, human exposure, and toxicological relevance. Arch. Toxicol. 2010, 84, 663–679. [Google Scholar] [CrossRef]
- Parzych, K.R.; Klionsky, D.J. An overview of autophagy: Morphology, mechanism, and regulation. Antioxid. Redox Signal. 2014, 20, 460–473. [Google Scholar] [CrossRef] [PubMed]
- Lippai, M.; Lőw, P. The role of the selective adaptor p62 and ubiquitin-like proteins in autophagy. BioMed. Res. Int. 2014, 2014, 832704. [Google Scholar] [CrossRef]
- Sardiello, M.; Palmieri, M.; di Ronza, A.; Medina, D.L.; Valenza, M.; Gennarino, V.A.; Di Malta, C.; Donaudy, F.; Embrione, V.; Polishchuk, R.S.; et al. A gene network regulating lysosomal biogenesis and function. Science 2009, 325, 473–477. [Google Scholar] [CrossRef] [PubMed]
- Palmieri, M.; Impey, S.; Kang, H.; di Ronza, A.; Pelz, C.; Sardiello, M.; Ballabio, A. Characterization of the CLEAR network reveals an integrated control of cellular clearance pathways. Hum. Mol. Genet. 2011, 20, 3852–3866. [Google Scholar] [CrossRef] [PubMed]
- Di Malta, C.; Cinque, L.; Settembre, C.; Cho, D.H.; Rubinsztein, , D.C. Transcriptional Regulation of Autophagy: Mechanisms and Diseases. Front. Cell Dev. Biol. 2019, 7, 114. [Google Scholar] [CrossRef] [PubMed]
- Füllgrabe, J.; Ghislat, G.; Cho, D.H.; Rubinsztein, D.C. Transcriptional regulation of mammalian autophagy at a glance. J. Cell Sci. 2016, 129, 3059–3066. [Google Scholar] [CrossRef]
- Del Favero, G.; Woelflingseder, L.; Braun, D.; Puntscher, H.; Kütt, M.-L.; Dellafiora, L.; Warth, B.; Pahlke, G.; Dall’Asta, C.; Adam, G.; et al. Response of intestinal HT-29 cells to the trichothecene mycotoxin deoxynivalenol and its sulfated conjugates. Toxicol. Lett. 2018, 295, 424–437. [Google Scholar] [CrossRef] [PubMed]
- Del Favero, G.; Woelflingseder, L.; Janker, L.; Neuditschko, B.; Seriani, S.; Gallina, P.; Sbaizero, O.; Gerner, C.; Marko, D. Deoxynivalenol induces structural alterations in epidermoid carcinoma cells A431 and impairs the response to biomechanical stimulation. Sci. Rep. 2018, 8, 11351. [Google Scholar] [CrossRef]
- Beisl, J.; Varga, E.; Braun, D.; Warth, B.; Ehling-Schulz, M.; Del Favero, G.; Marko, D. Assessing Mixture Effects of Cereulide and Deoxynivalenol on Intestinal Barrier Integrity and Uptake in Differentiated Human Caco-2 Cells. Toxins 2021, 13, 189. [Google Scholar] [CrossRef]
- Bauer, T.; Sipos, W.; Stark, T.D.; Käser, T.; Knecht, C.; Brunthaler, R.; Saalmüller, A.; Hofmann, T.; Ehling-Schulz, M. First Insights Into Within Host Translocation of the Bacillus cereus Toxin Cereulide Using a Porcine Model. Front. Microbiol. 2018, 9, 2652. [Google Scholar] [CrossRef] [PubMed]
- Livak, K.J.; Schmittgen, T.D. Analysis of relative gene expression data using real-time quantitative PCR and the 2(-Delta Delta C(T)) Method. Methods 2001, 25, 402–408. [Google Scholar] [CrossRef] [PubMed]
- Vangoitsenhoven, R.; Rondas, D.; Crevecoeur, I.; D’Hertog, W.; Baatsen, P.; Masini, M.; Andjelkovic, M.; Van Loco, J.; Matthys, C.; Mathieu, C.; et al. Foodborne cereulide causes beta-cell dysfunction and apoptosis. PLoS ONE 2014, 9, e104866. [Google Scholar] [CrossRef]
- Ivanova, L.; Egge-Jacobsen, W.M.; Solhaug, A.; Thoen, E.; Fæste, C.K. Lysosomes as a possible target of enniatin B-induced toxicity in Caco-2 cells. Chem. Res. Toxicol. 2012, 25, 1662–1674. [Google Scholar] [CrossRef] [PubMed]
- Eskelinen, E.L.; Illert, A.L.; Tanaka, Y.; Schwarzmann, G.; Blanz, J.; Von Figura, K.; Saftig, P. Role of LAMP-2 in lysosome biogenesis and autophagy. Mol. Biol. Cell 2002, 13, 3355–3368. [Google Scholar] [CrossRef]
- Lu, S.; Sung, T.; Lin, N.; Abraham, R.T.; Jessen, B.A. Lysosomal adaptation: How cells respond to lysosomotropic compounds. PLoS ONE 2017, 12, e0173771. [Google Scholar] [CrossRef] [PubMed]
- Geisler, S.; Holmström, K.M.; Skujat, D.; Fiesel, F.C.; Rothfuss, O.C.; Kahle, P.J.; Springer, W. PINK1/Parkin-mediated mitophagy is dependent on VDAC1 and p62/SQSTM1. Nat. Cell Biol. 2010, 12, 119–131. [Google Scholar] [CrossRef]
- Ivankovic, D.; Chau, K.-Y.; Schapira, A.H.V.; Gegg, M.E. Mitochondrial and lysosomal biogenesis are activated following PINK1/parkin-mediated mitophagy. J. Neurochem. 2016, 136, 388–402. [Google Scholar] [CrossRef] [PubMed]
- Rakovic, A.; Ziegler, J.; Mårtensson, C.U.; Prasuhn, J.; Shurkewitsch, K.; König, P.; Paulson, H.L.; Klein, C. PINK1-dependent mitophagy is driven by the UPS and can occur independently of LC3 conversion. Cell Death Differ. 2019, 26, 1428–1441. [Google Scholar] [CrossRef]
- Cho, H.I.; Choi, J.W.; Lee, S.M. Impairment of autophagosome-lysosome fusion contributes to chronic ethanol-induced liver injury. Alcohol 2014, 48, 717–725. [Google Scholar] [CrossRef] [PubMed]
- Klionsky, D.J.; Abeliovich, H.; Agostinis, P.; Agrawal, D.K.; Aliev, G.; Askew, D.S.; Baba, M.; Baehrecke, E.H.; Bahr, B.A.; Ballabio, A.; et al. Guidelines for the use and interpretation of assays for monitoring autophagy in higher eukaryotes. Autophagy 2008, 4, 151–175. [Google Scholar] [CrossRef] [PubMed]
- Bauer, T.; Stark, T.; Hofmann, T.; Ehling-Schulz, M. Development of a stable isotope dilution analysis for the quantification of the Bacillus cereus toxin cereulide in foods. J. Agric. Food Chem. 2010, 58, 1420–1428. [Google Scholar] [CrossRef] [PubMed]
- Abia, W.A.; Warth, B.; Ezekiel, C.N.; Sarkanj, B.; Turner, P.C.; Marko, D.; Krska, R.; Sulyok, M. Uncommon toxic microbial metabolite patterns in traditionally home-processed maize dish (fufu) consumed in rural Cameroon. Food Chem. Toxicol. Int. J. Publ. Br. Ind. Biol. Res. Assoc. 2017, 107, 10–19. [Google Scholar] [CrossRef] [PubMed]
- Schothorst, R.C.; van Egmond, H.P. Report from SCOOP task 3.2.10 "collection of occurrence data of Fusarium toxins in food and assessment of dietary intake by the population of EU member states". Subtask: Trichothecenes. Toxicol. Lett. 2004, 153, 133–143. [Google Scholar] [CrossRef]
- Ling, K.H.; Wan, M.L.; El-Nezami, H.; Wang, M. Protective Capacity of Resveratrol, a Natural Polyphenolic Compound, against Deoxynivalenol-Induced Intestinal Barrier Dysfunction and Bacterial Translocation. Chem. Res. Toxicol. 2016, 29, 823–833. [Google Scholar] [CrossRef]
- Sergent, T.; Parys, M.; Garsou, S.; Pussemier, L.; Schneider, Y.J.; Larondelle, Y. Deoxynivalenol transport across human intestinal Caco-2 cells and its effects on cellular metabolism at realistic intestinal concentrations. Toxicol. Lett. 2006, 164, 167–176. [Google Scholar] [CrossRef]
- Beisl, J.; Pahlke, G.; Abeln, H.; Ehling-Schulz, M.; Del Favero, G.; Varga, E.; Warth, B.; Sulyok, M.; Abia, W.; Ezekiel, C.N.; et al. Combinatory effects of cereulide and deoxynivalenol on in vitro cell viability and inflammation of human Caco-2 cells. Arch. Toxicol. 2020, 94, 833–844. [Google Scholar] [CrossRef]
- Repetto, G.; del Peso, A.; Zurita, J.L. Neutral red uptake assay for the estimation of cell viability/cytotoxicity. Nat. Protoc. 2008, 3, 1125–1131. [Google Scholar] [CrossRef]
- Held, P. Nuclear Translocation of RelA in Stimulated Macrophages. Using Image Analysis to Quantitate Protein Movement from the Cytoplasm to the Nucleus. Appl. Note 2019. [Google Scholar]
- Thermo Fisher Scientific. NanoDrop 2000/2000c Spectrophotometer, V1.0 User Manual; Thermo Fisher Scientific: Lexington, KY, USA, 2009. [Google Scholar]
- Schmittgen, T.D.; Livak, K.J. Analyzing real-time PCR data by the comparative C(T) method. Nat. Protoc. 2008, 3, 1101–1108. [Google Scholar] [CrossRef] [PubMed]
- Chou, T.-C. Theoretical Basis, Experimental Design, and Computerized Simulation of Synergism and Antagonism in Drug Combination Studies. Pharmacol. Rev. 2006, 58, 621–681. [Google Scholar] [CrossRef]
- Bliss, C.I. The Toxicity of Poisons Applied Jointly. Ann. Appl. Biol. 1939, 26, 585–615. [Google Scholar] [CrossRef]
- Webb, J. Effect of More than One Inhibitor; Academic Press: New York, NY, USA, 1963; Volume 1, pp. 66–79. [Google Scholar]
- Kifer, D.; Jakšić, D.; Klarić, M. Assessing the Effect of Mycotoxin Combinations: Which Mathematical Model Is (the Most) Appropriate? Toxins 2020, 12, 153. [Google Scholar] [CrossRef] [PubMed]
- Vejdovszky, K.; Sack, M.; Jarolim, K.; Aichinger, G.; Somoza, M.M.; Marko, D. In vitro combinatory effects of the Alternaria mycotoxins alternariol and altertoxin II and potentially involved miRNAs. Toxicol. Lett. 2017, 267, 45–52. [Google Scholar] [CrossRef] [PubMed]
- Smith, M.C.; Hymery, N.; Troadec, S.; Pawtowski, A.; Coton, E.; Madec, S. Hepatotoxicity of fusariotoxins, alone and in combination, towards the HepaRG human hepatocyte cell line. Food Chem. Toxicol. 2017, 109, 439–451. [Google Scholar] [CrossRef] [PubMed]


| Protein Name | Gene Name | Gene Globe ID |
|---|---|---|
| Hypoxanthine phosphoribosyltransferase 1 | HPRT1 | QT00059066 |
| Aminolevulinate synthase 1 | ALAS1 | QT00073122 |
| Lysosome-associated membrane glycoprotein 2 | LAMP2 | QT00077063 |
| Cathepsin D | CTSD | QT00020391 |
| Microtubule-associated proteins 1A/1B light chain 3B | MAP1LC3B | QT00055069 |
| Sequestosome-1 | SQSTM1 | QT00095676 |
| Autophagy-related protein 16-1 | ATG16L1 | QT00085442 |
Publisher’s Note: MDPI stays neutral with regard to jurisdictional claims in published maps and institutional affiliations. |
© 2022 by the authors. Licensee MDPI, Basel, Switzerland. This article is an open access article distributed under the terms and conditions of the Creative Commons Attribution (CC BY) license (https://creativecommons.org/licenses/by/4.0/).
Share and Cite
Beisl, J.; Pahlke, G.; Ehling-Schulz, M.; Del Favero, G.; Marko, D. Cereulide and Deoxynivalenol Increase LC3 Protein Levels in HepG2 Liver Cells. Toxins 2022, 14, 151. https://doi.org/10.3390/toxins14020151
Beisl J, Pahlke G, Ehling-Schulz M, Del Favero G, Marko D. Cereulide and Deoxynivalenol Increase LC3 Protein Levels in HepG2 Liver Cells. Toxins. 2022; 14(2):151. https://doi.org/10.3390/toxins14020151
Chicago/Turabian StyleBeisl, Julia, Gudrun Pahlke, Monika Ehling-Schulz, Giorgia Del Favero, and Doris Marko. 2022. "Cereulide and Deoxynivalenol Increase LC3 Protein Levels in HepG2 Liver Cells" Toxins 14, no. 2: 151. https://doi.org/10.3390/toxins14020151
APA StyleBeisl, J., Pahlke, G., Ehling-Schulz, M., Del Favero, G., & Marko, D. (2022). Cereulide and Deoxynivalenol Increase LC3 Protein Levels in HepG2 Liver Cells. Toxins, 14(2), 151. https://doi.org/10.3390/toxins14020151