Fumonisin B Series Mycotoxins’ Dose Dependent Effects on the Porcine Hepatic and Pulmonary Phospholipidome

 ,
,  , ,
, , 
Abstract
1. Introduction
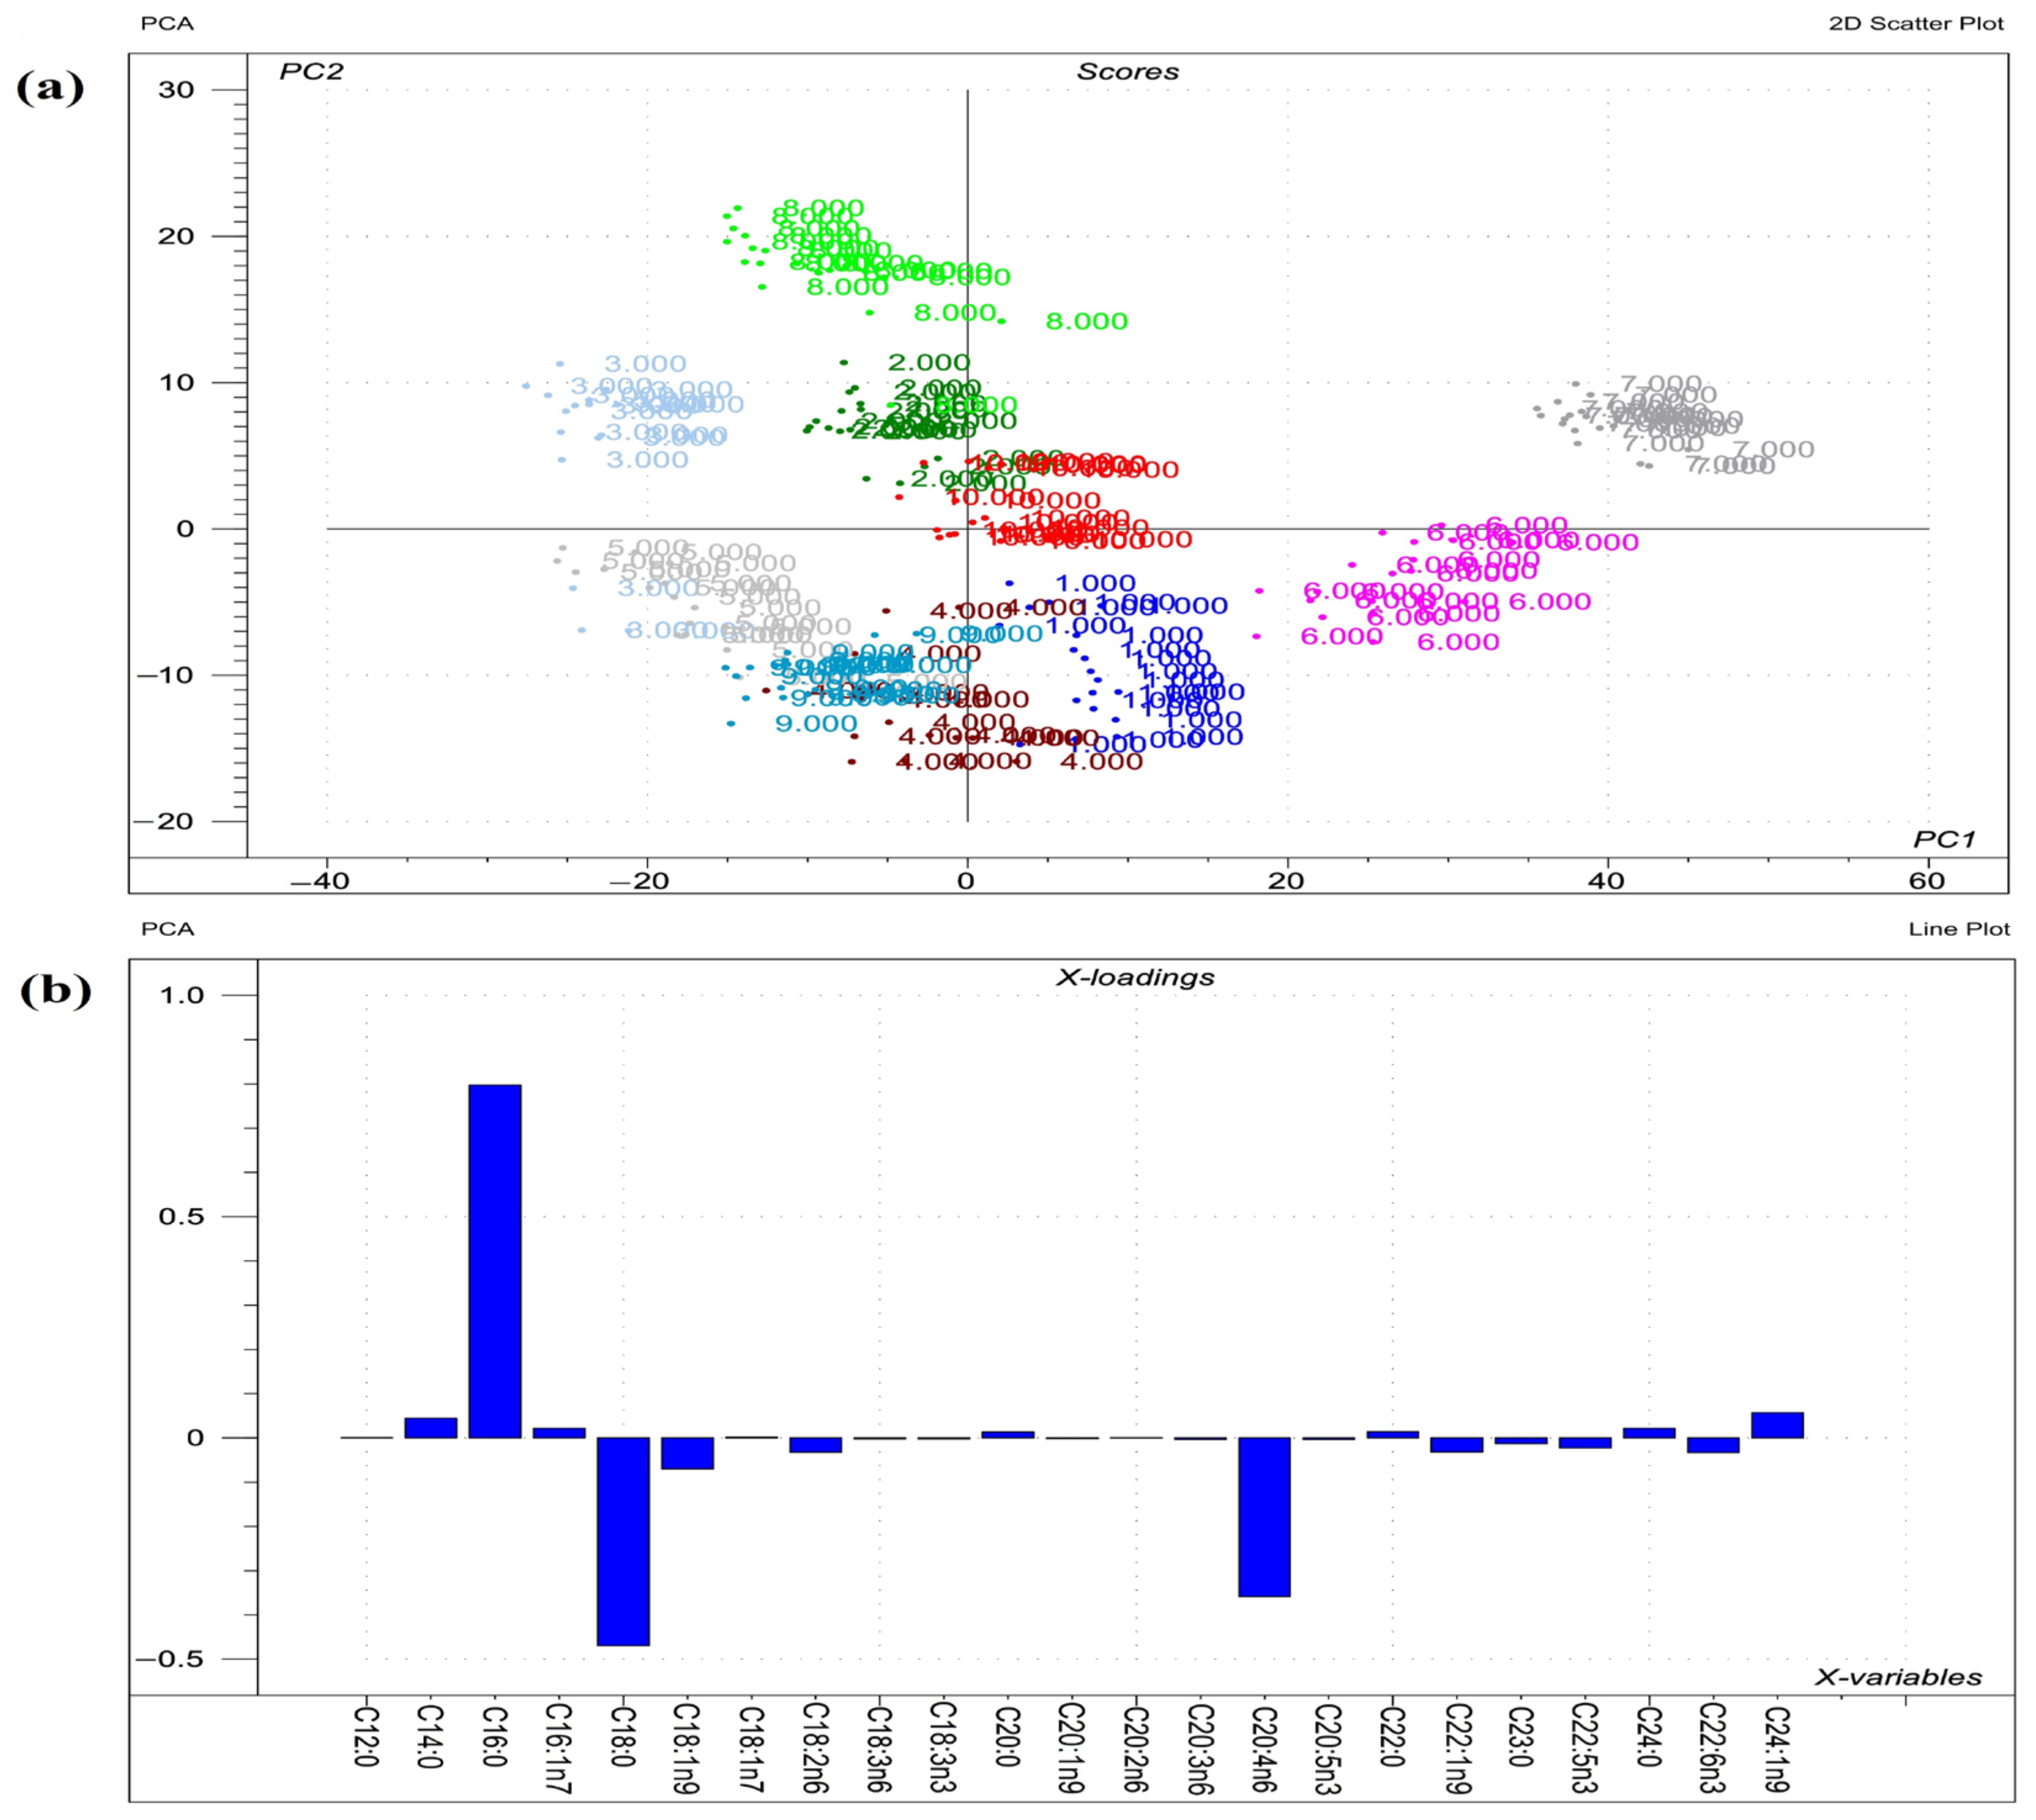
2. Results
2.1. Animal Growth Performance
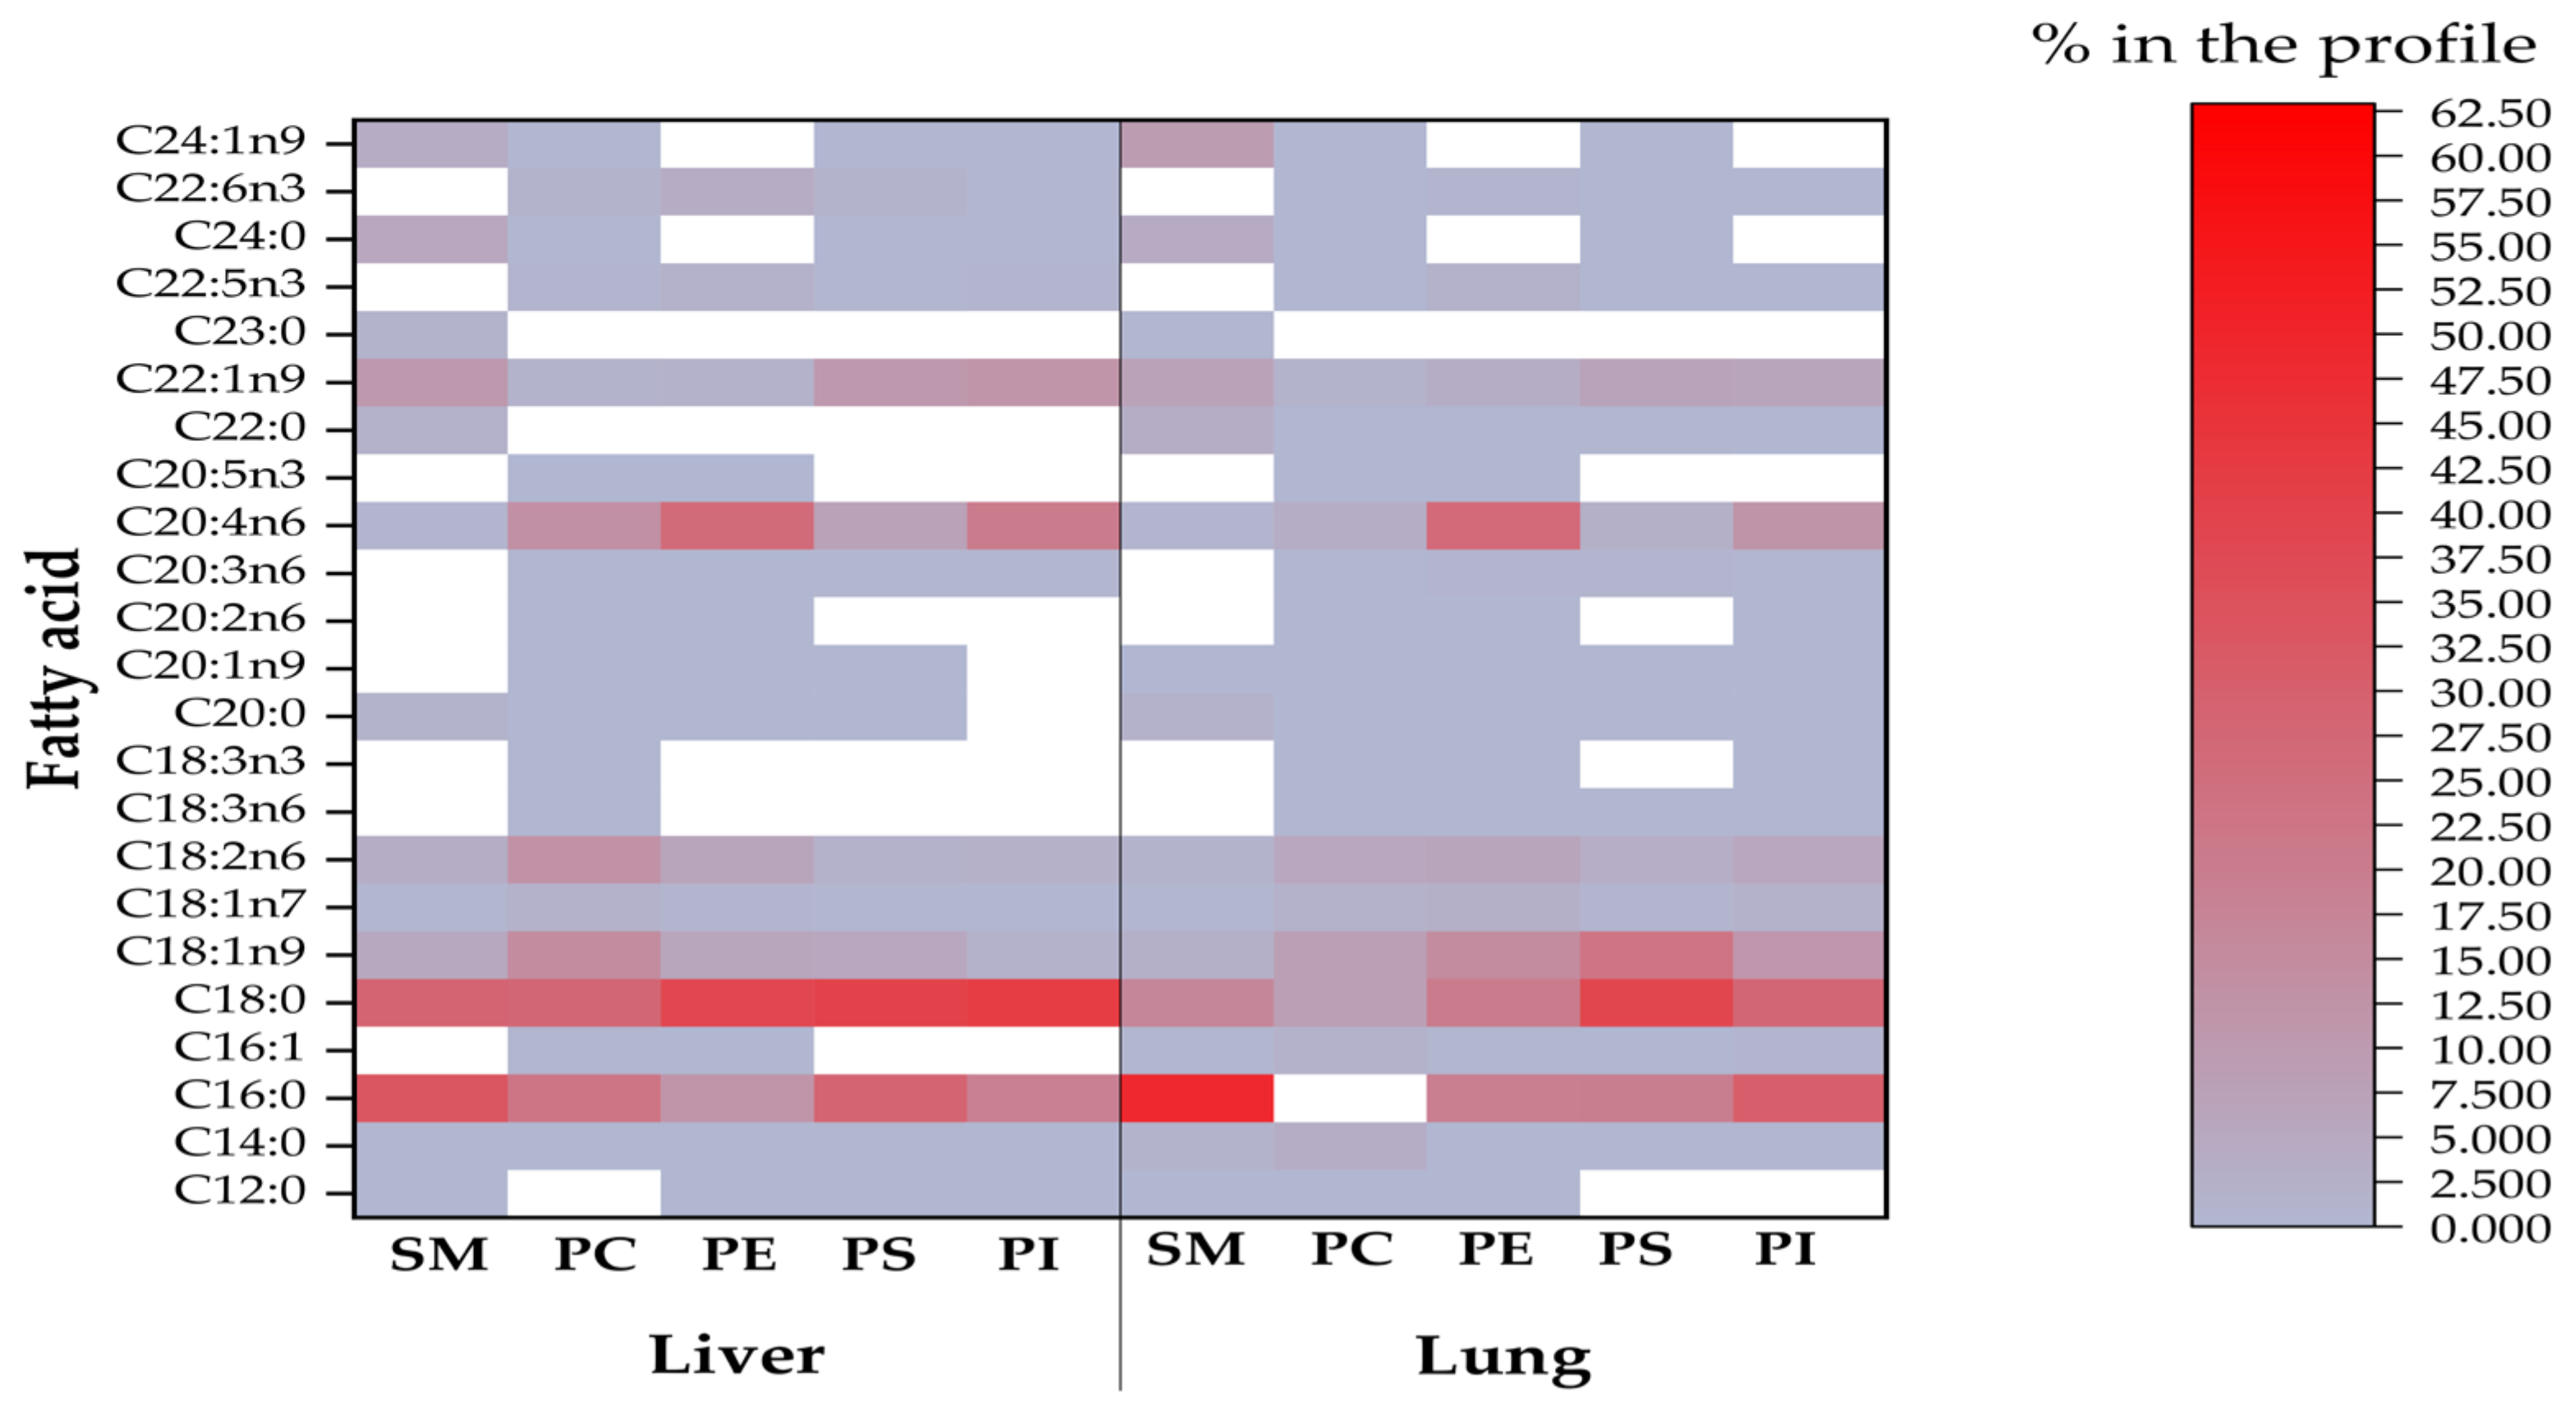
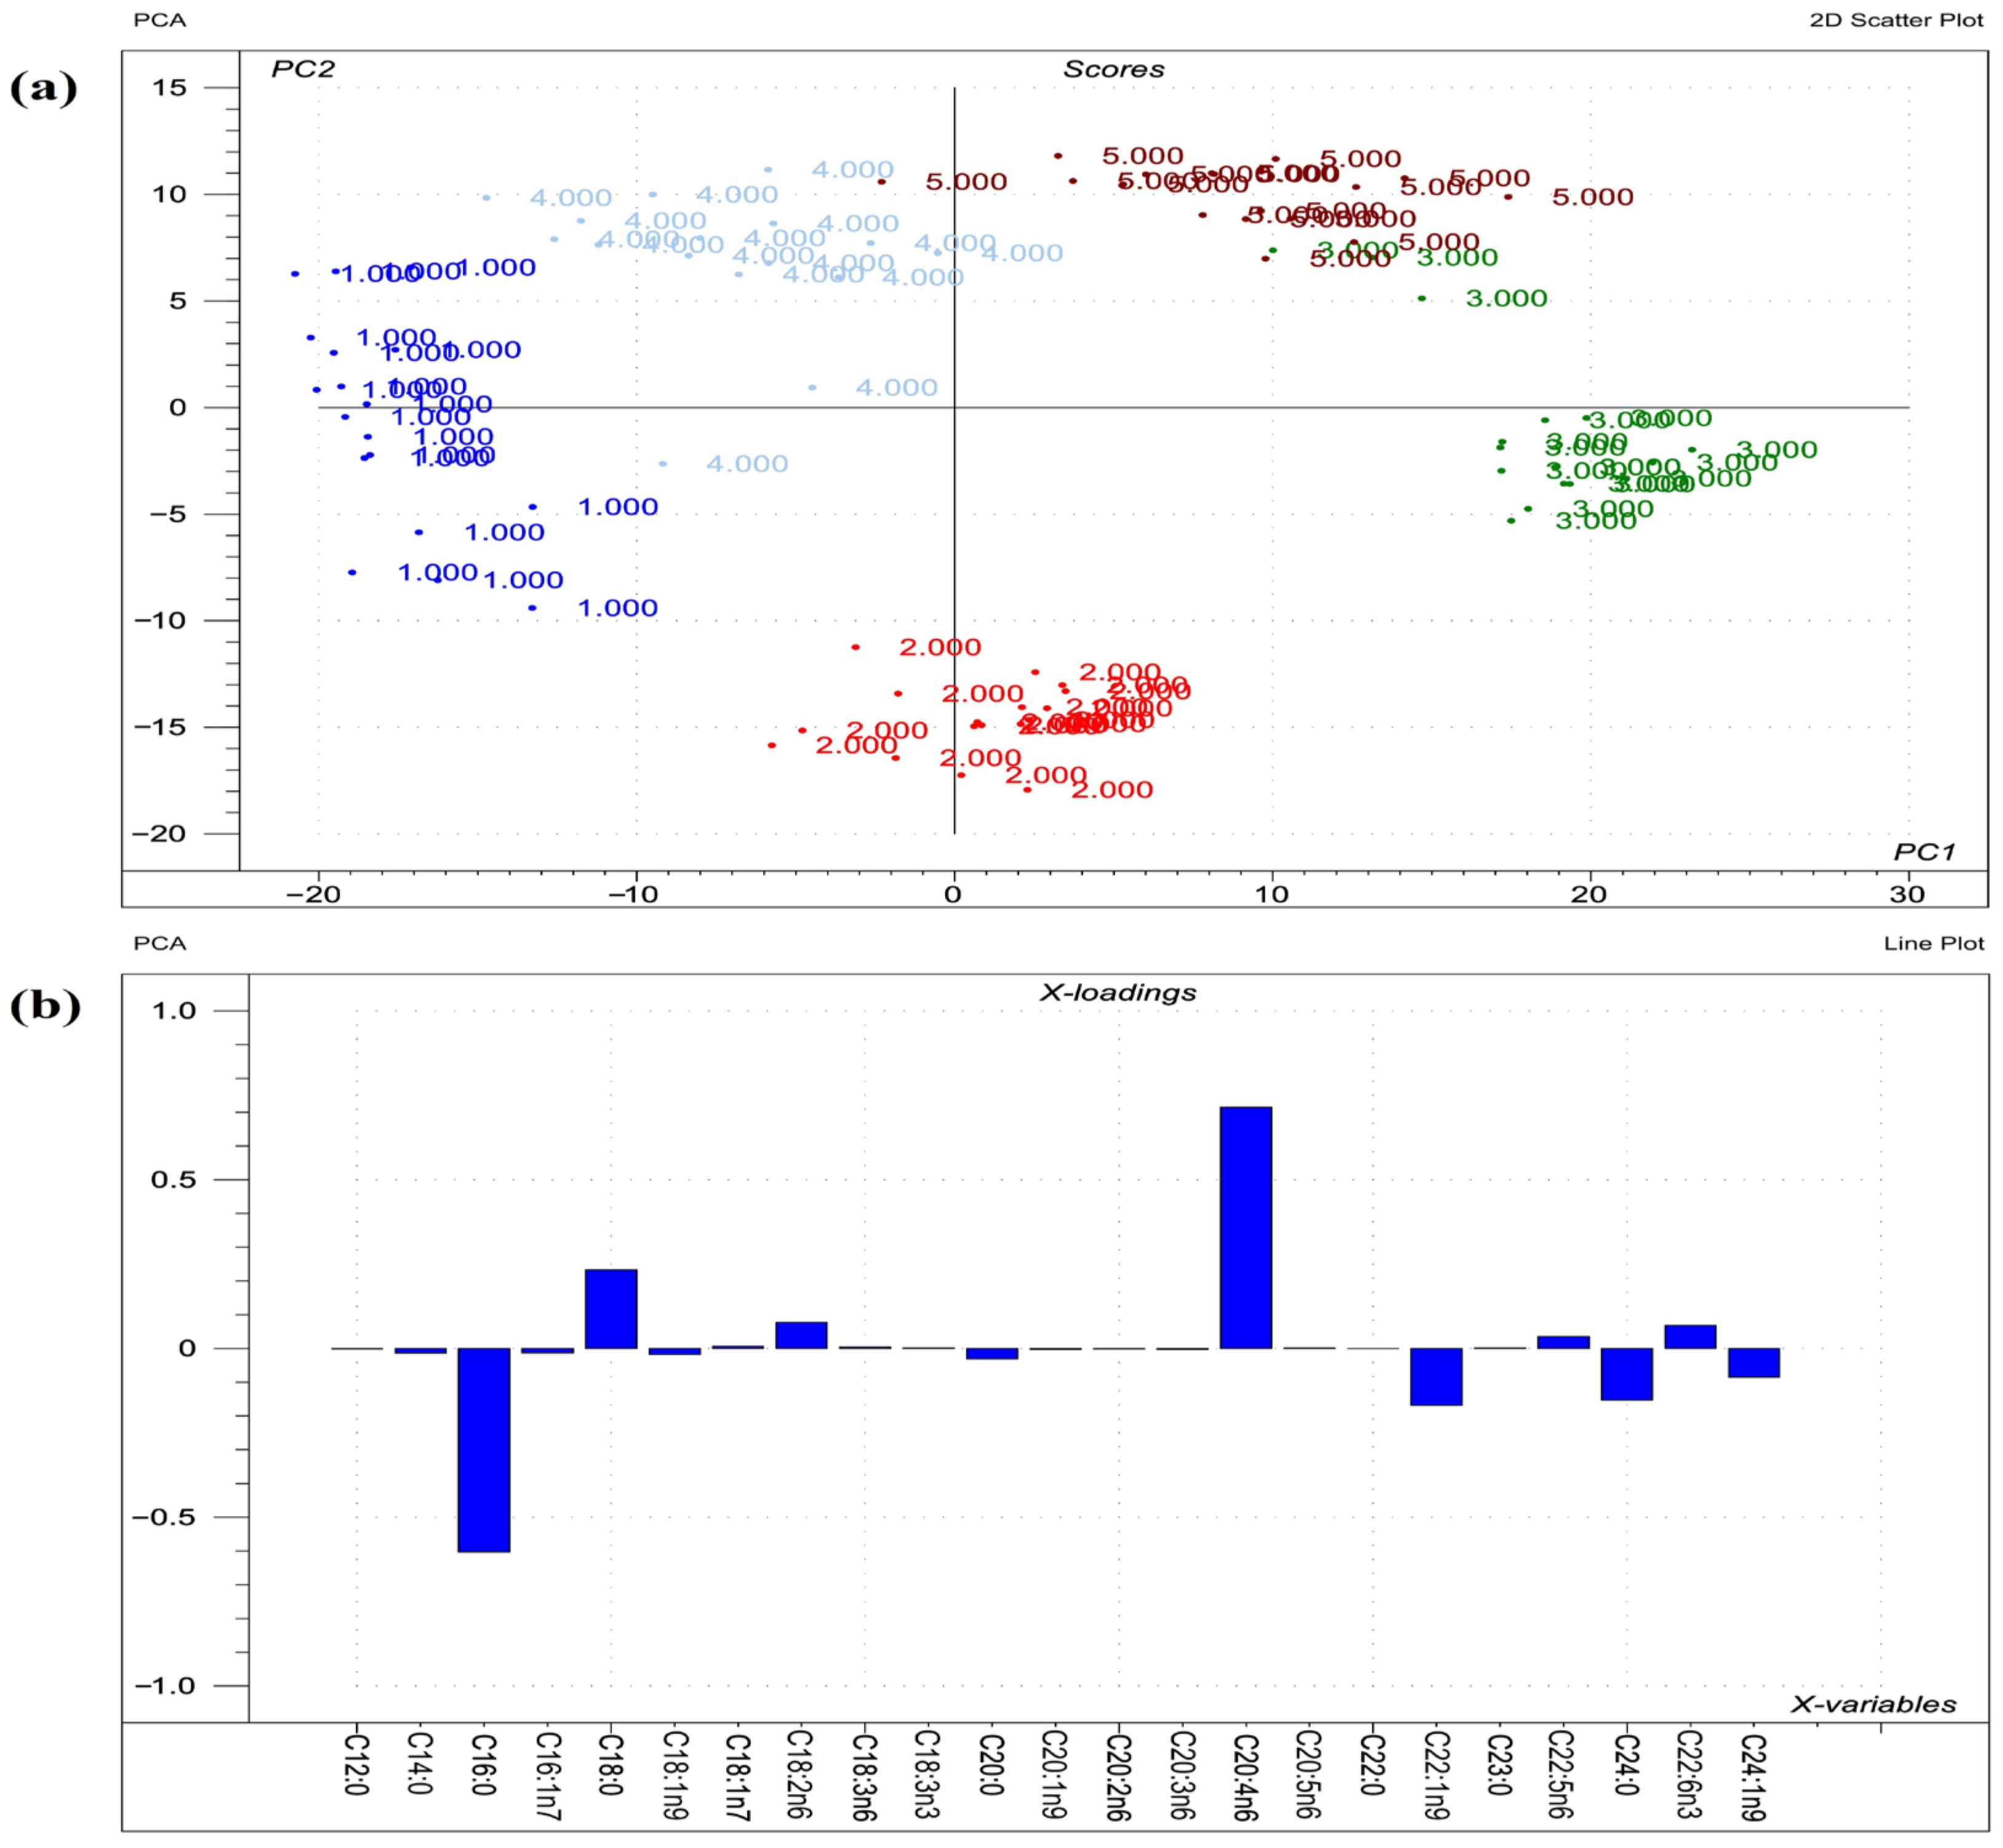
2.2. Sphingomyelin Fatty Acid Profile
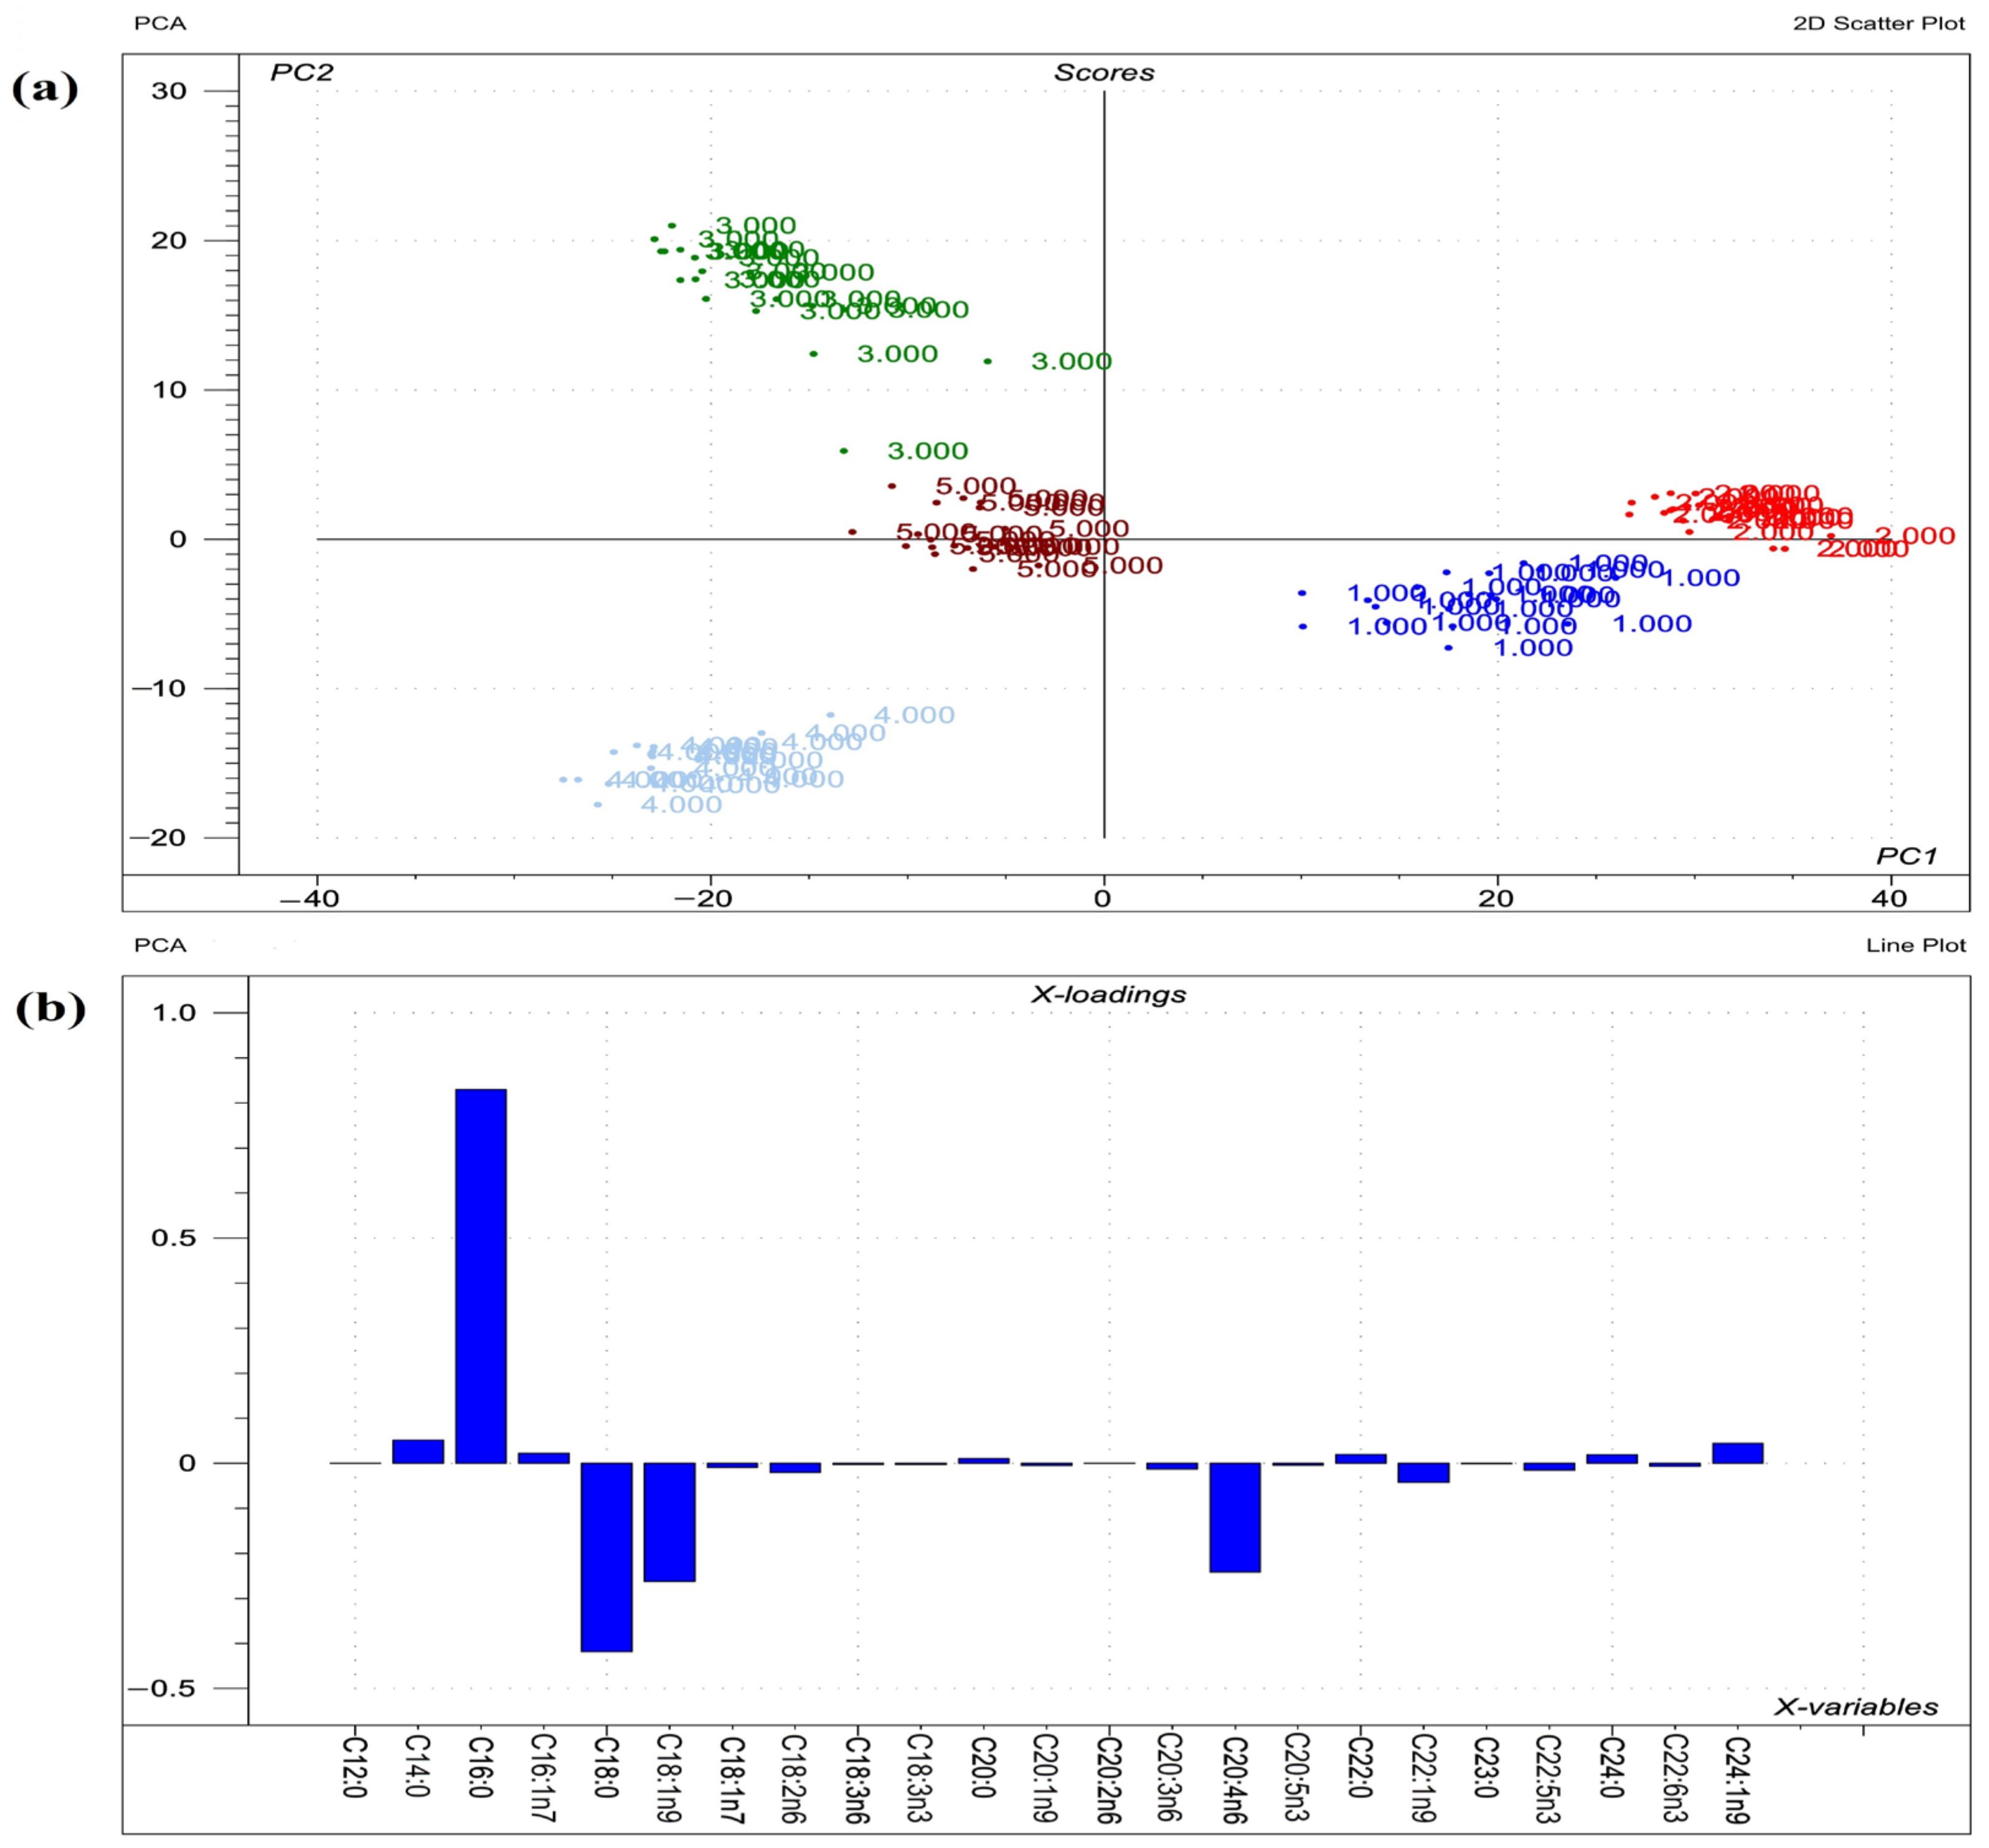
2.3. Phosphatidylcholine Fatty Acid Profile

2.4. Phosphatidylethanolamine Fatty Acid Profile

2.5. Phosphatidylserine Fatty Acid Profile

2.6. Phosphatidylinositol Fatty Acid Profile
2.7. Antioxidants and Lipid Peroxidation
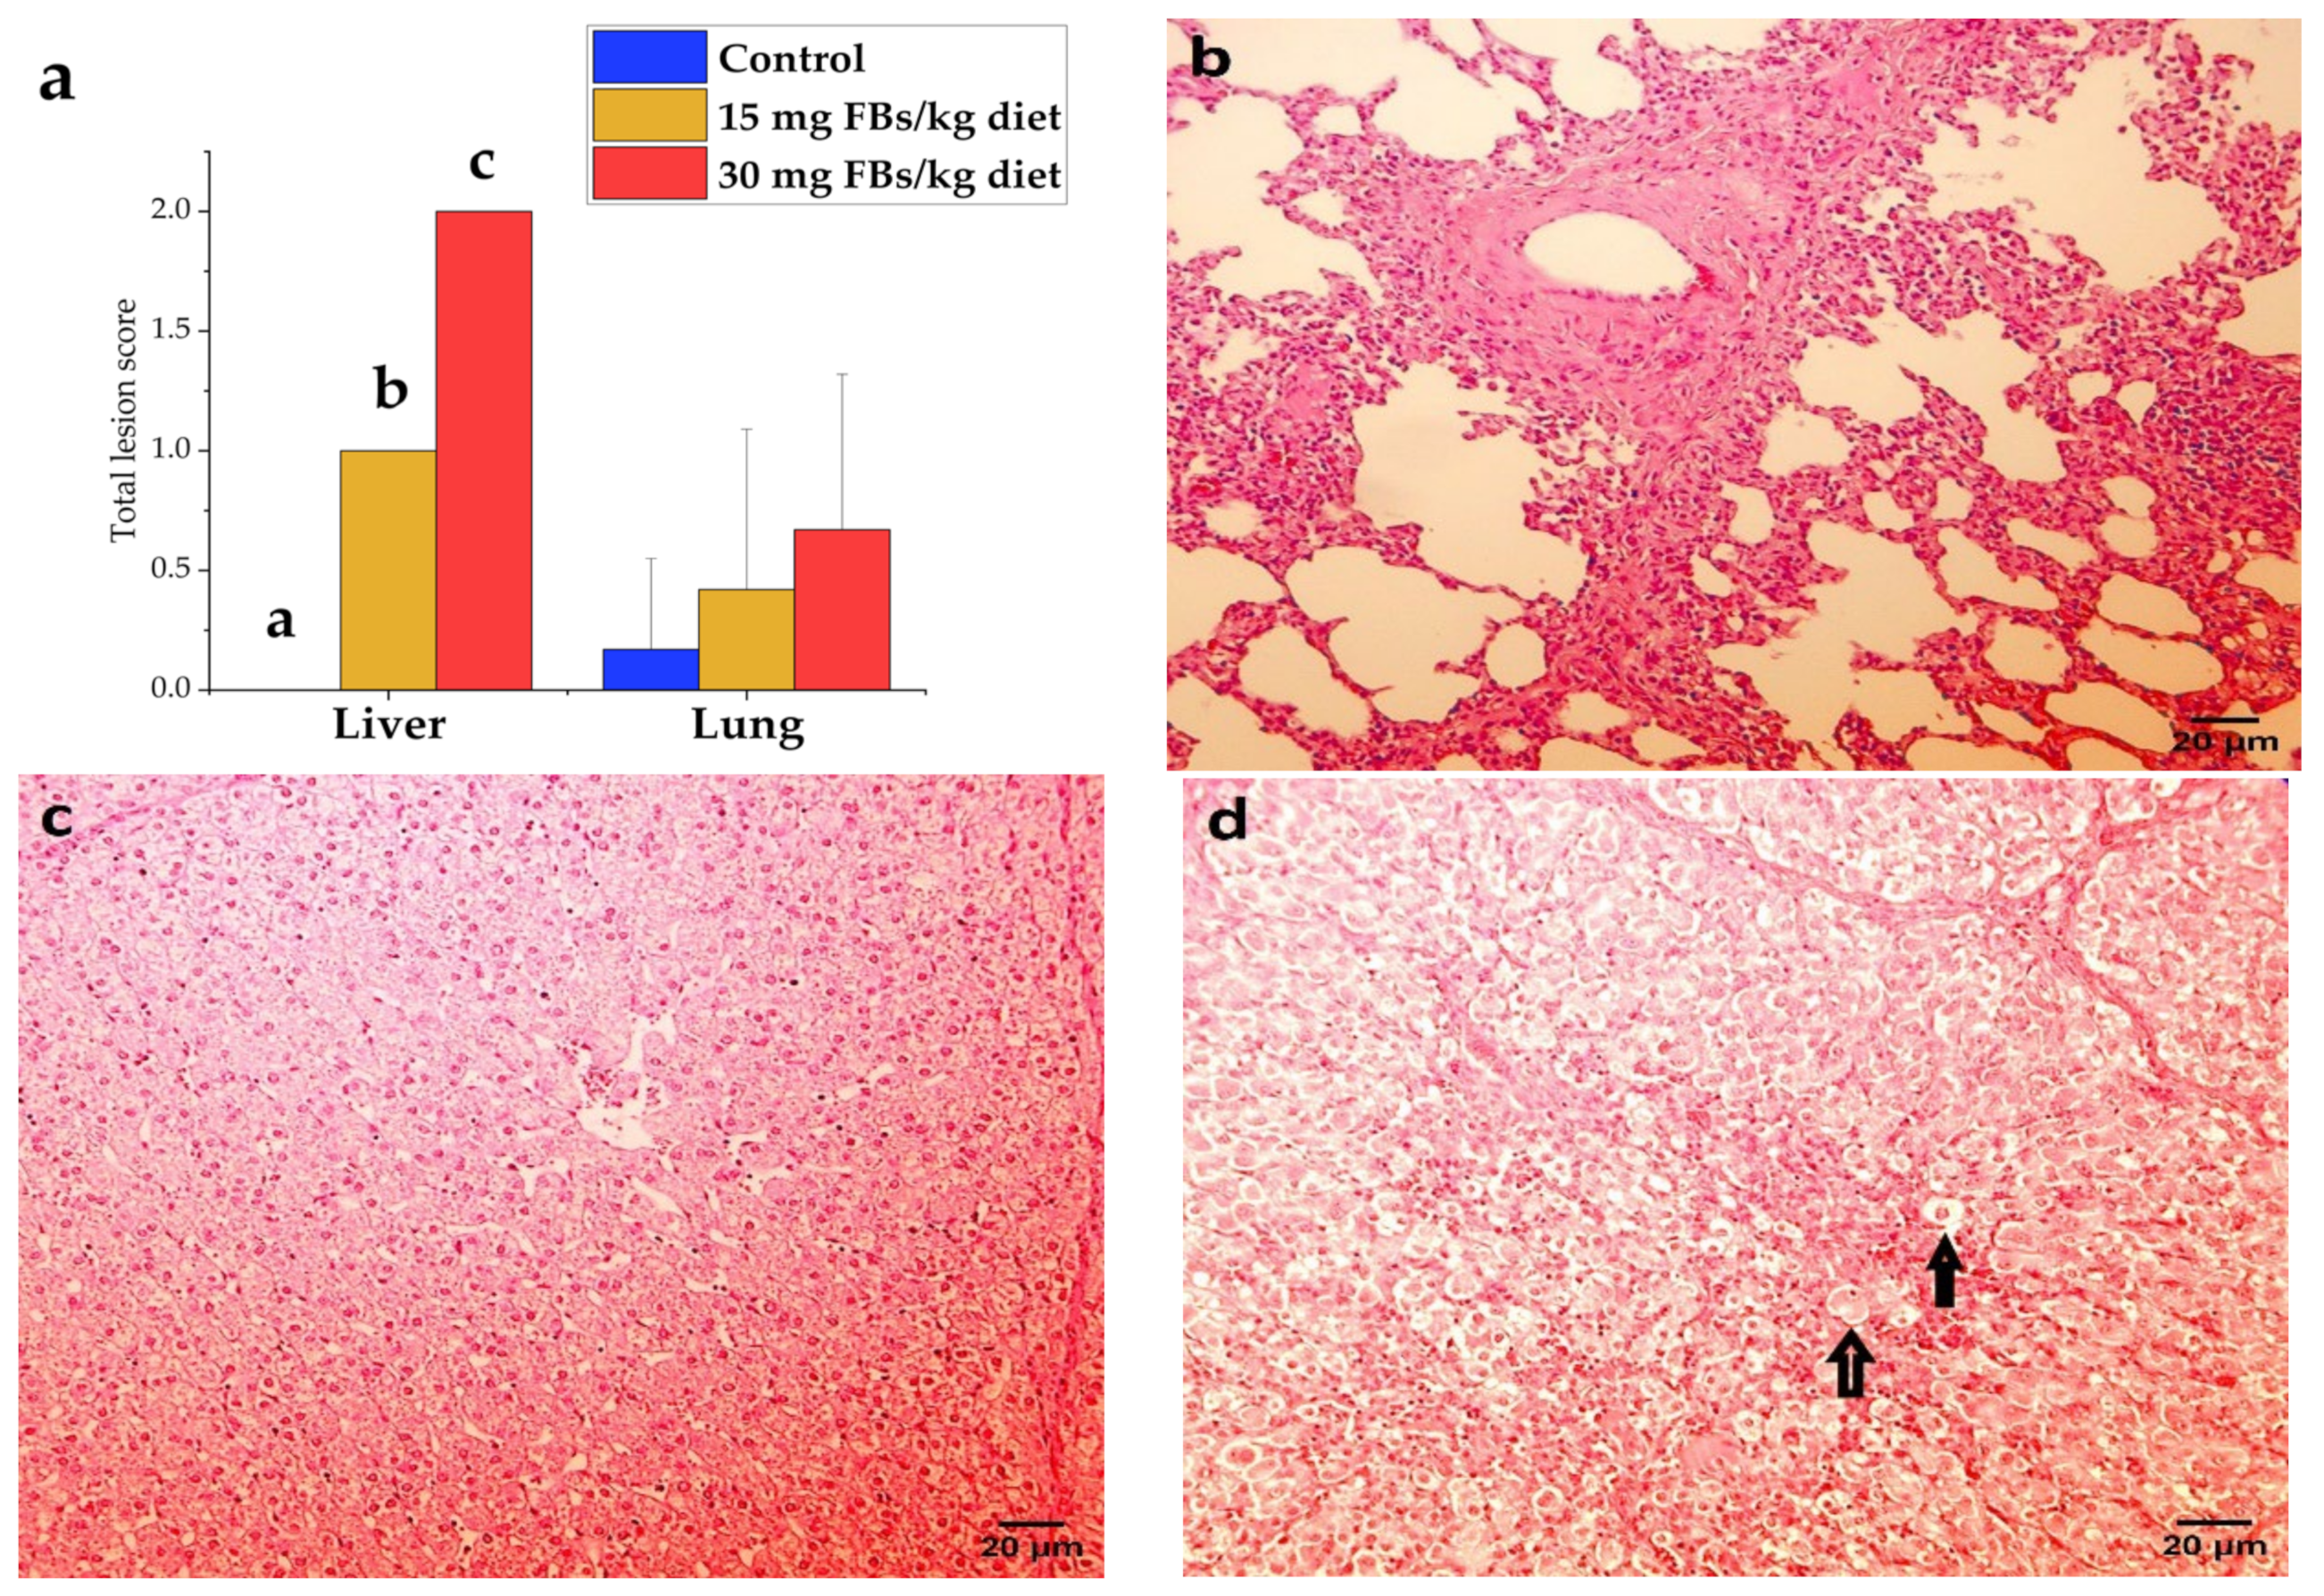
2.8. Pathological Assessment
3. Discussion
3.1. Animal Performance
3.2. Sphingomyelins
3.3. Phosphatidylcholines
3.4. Phosphatidylethanolamines
3.5. Phosphatidylserines
3.6. Phosphatidylinositols
3.7. Antioxidant Enzymes and Lipid Peroxidation
3.8. Histopathology
4. Conclusions
5. Materials and Methods
5.1. Experimental Design, Animals and Feeding
5.2. Feed Mycotoxin Contamination
5.3. Fatty Acid Composition of Phospholipid Classes
5.4. Antioxidant Status and Lipid Peroxidation
5.5. Histological Preperation and Assessment
5.6. Statistical Analysis
Author Contributions
Funding
Institutional Review Board Statement
Informed Consent Statement
Data Availability Statement
Acknowledgments
Conflicts of Interest
References
- DSM. H1 2022 DSM World Mycotoxin Survey Report. 2022. Available online: https://www.dsm.com/anh/news/downloads/whitepapers-and-reports/h1-2022-dsm-world-mycotoxin-survey-report.html (accessed on 23 October 2022).
- Khodaei, D.; Javanmardi, F.; Khaneghah, A.M. The global overview of the occurrence of mycotoxins in cereals: A three-year survey. Curr. Opin. Food Sci. 2021, 39, 36–42. [Google Scholar] [CrossRef]
- Bezuidenhout, S.C.; Gelderblom, W.C.A.; Gorst-Allman, C.P.; Horak, R.M.; Marasas, W.F.O.; Spiteller, G.; Vleggaar, R. Structure elucidation of the fumonisins, mycotoxins from Fusarium moniliforme. J. Chem. Soc. Chem. Commun. 1988, 11, 743–745. [Google Scholar] [CrossRef]
- Rheeder, J.P.; Marasas, W.F.O.; Vismer, H.F. Production of Fumonisin Analogs by Fusarium Species. Appl. Environ. Microbiol. 2002, 68, 2101–2105. [Google Scholar] [CrossRef] [PubMed]
- Gruber-Dorninger, C.; Jenkins, T.; Schatzmayr, G. Global Mycotoxin Occurrence in Feed: A Ten-Year Survey. Toxins 2019, 11, 375. [Google Scholar] [CrossRef] [PubMed]
- Bucci, T.J.; Howard, P.C. Effect of Fumonisin Mycotoxins in Animals. J. Toxicol. Toxin Rev. 1996, 15, 293–302. [Google Scholar] [CrossRef]
- Fodor, J.; Balogh, K.; Weber, M.; Mézes, M.; Kametler, L.; Pósa, R.; Mamet, R.; Bauer, J.; Horn, P.; Kovács, F.; et al. Absorption, distribution and elimination of fumonisin B(1) metabolites in weaned piglets. Food Addit. Contam. Part A 2008, 25, 88–96. [Google Scholar] [CrossRef] [PubMed]
- Terciolo, C.; Bracarense, A.P.; Souto, P.C.; Cossalter, A.M.; Dopavogui, L.; Loiseau, N.; Oliveira, C.A.; Pinton, P.; Oswald, I.P. Fumonisins at Doses below EU Regulatory Limits Induce Histological Alterations in Piglets. Toxins 2019, 11, 548. [Google Scholar] [CrossRef]
- Haschek, W.M.; Gumprecht, L.A.; Smith, G.; Tumbleson, M.E.; Constable, P.D. Fumonisin toxicosis in swine: An overview of porcine pulmonary edema and current perspectives. Environ. Health Perspect. 2001, 109, 251–257. [Google Scholar]
- Chen, Z.; Chen, H.; Li, X.; Yuan, Q.; Su, J.; Yang, L.; Ning, L.; Lei, H. Fumonisin B1 damages the barrier functions of porcine intestinal epithelial cells in vitro. J. Biochem. Mol. Toxicol. 2019, 33, e22397. [Google Scholar] [CrossRef]
- Szabó, A.; Ali, O.; Lóki, K.; Balogh, K.; Mézes, M.; Bartók, T.; Horváth, L.; Kovács, M. Orally Administered Fumonisins Affect Porcine Red Cell Membrane Sodium Pump Activity and Lipid Profile without Apparent Oxidative Damage. Toxins 2020, 12, 318. [Google Scholar] [CrossRef]
- Riley, R.T.; Merrill, A.H. Ceramide synthase inhibition by fumonisins: A perfect storm of perturbed sphingolipid metabolism, signaling, and disease. J. Lipid Res. 2019, 60, 1183–1189. [Google Scholar] [CrossRef]
- Liu, X.; Fan, L.; Yin, S.; Chen, H.; Hu, H. Molecular mechanisms of fumonisin B1-induced toxicities and its applications in the mechanism-based interventions. Toxicon 2019, 167, 1–5. [Google Scholar] [CrossRef]
- He, Q.; Bhandari, N.; Sharma, R.P. Fumonisin B1 alters sphingolipid metabolism and tumor necrosis factor α expression in heart and lung of mice. Life Sci. 2002, 71, 2015–2023. [Google Scholar] [CrossRef]
- Loiseau, N.; Polizzi, A.; Dupuy, A.; Therville, N.; Rakotonirainy, M.; Loy, J.; Viadere, J.-L.; Cossalter, A.-M.; Bailly, J.-D.; Puel, O.; et al. New insights into the organ-specific adverse effects of fumonisin B1: Comparison between lung and liver. Arch. Toxicol. 2015, 89, 1619–1629. [Google Scholar] [CrossRef]
- Ali, O.; Mézes, M.; Balogh, K.; Kovács, M.; Szabó, A. The Effects of Mixed Fusarium Mycotoxins at EU-Permitted Feed Levels on Weaned Piglets’ Tissue Lipids. Toxins 2021, 13, 444. [Google Scholar] [CrossRef]
- Ali, O.; Szabó-Fodor, J.; Fébel, H.; Mézes, M.; Balogh, K.; Glávits, R.; Kovács, M.; Zantomasi, A.; Szabó, A. Porcine Hepatic Response to Fumonisin B1 in a Short Exposure Period: Fatty Acid Profile and Clinical Investigations. Toxins 2019, 11, 655. [Google Scholar] [CrossRef]
- Szabó, A.; Fébel, H.; Ali, O.; Kovács, M. Fumonisin B1 induced compositional modifications of the renal and hepatic membrane lipids in rats—Dose and exposure time dependence. Food Addit. Contam. Part A 2019, 36, 1722–1739. [Google Scholar] [CrossRef]
- Burger, H.-M.; Abel, S.; Gelderblom, W.C.A. Modulation of key lipid raft constituents in primary rat hepatocytes by fumonisin B1—Implications for cancer promotion in the liver. Food Chem. Toxicol. 2018, 115, 34–41. [Google Scholar] [CrossRef]
- Riedel, S.; Abel, S.; Burger, H.-M.; van der Westhuizen, L.; Swanevelder, S.; Gelderblom, W.C.A. Differential modulation of the lipid metabolism as a model for cellular resistance to fumonisin B1–induced cytotoxic effects in vitro. Prostaglandins, Leukot. Essent. Fat. Acids 2016, 109, 39–51. [Google Scholar] [CrossRef]
- Riedel, S.; Abel, S.; Swanevelder, S.; Gelderblom, W.C.A. Induction of an altered lipid phenotype by two cancer promoting treatments in rat liver. Food Chem. Toxicol. 2015, 78, 96–104. [Google Scholar] [CrossRef]
- Burger, H.-M.; Abel, S.; Snijman, P.W.; Swanevelder, S.; Gelderblom, W.C.A. Altered Lipid Parameters in Hepatic Subcellular Membrane Fractions Induced by Fumonisin B1. Lipids 2007, 42, 249–261. [Google Scholar] [CrossRef] [PubMed]
- Gelderblom, W.C.A.; Moritz, W.; Swanevelder, S.; Smuts, C.M.; Abel, S. Lipids and Δ6-desaturase activity alterations in rat liver microsomal membranes induced by fumonisin B1. Lipids 2002, 37, 869–877. [Google Scholar] [CrossRef] [PubMed]
- Gelderblom, W.C.A.; Smuts, C.M.; Abel, S.; Snyman, S.D.; Van Der Westhuizen, L.; Huber, W.W.; Swanevelder, S. Effect of fumonisin B1 on the levels and fatty acid composition of selected lipids in rat liver in vivo. Food Chem. Toxicol. 1997, 35, 647–656. [Google Scholar] [CrossRef]
- Yin, J.-J.; Smith, M.J.; Eppley, R.M.; Page, S.W.; Sphon, J.A. Effects of fumonisin B1 on lipid peroxidation in membranes. Biochim. Biophys. Acta-Biomembr. 1998, 1371, 134–142. [Google Scholar] [CrossRef]
- EC. Commission Recommendation 2006/576/EC on the presence of deoxynivalenol, zearalenone, ochratoxin A, T-2 and HT-2 and fumonisins in products intended for animal feeding. Off. J. Eur. Union L 229/7. 2006. Available online: http://data.europa.eu/eli/reco/2006/576/oj (accessed on 23 October 2022).
- Yang, C.; Song, G.; Lim, W. Effects of mycotoxin-contaminated feed on farm animals. J. Hazard. Mater. 2020, 389, 122087. [Google Scholar] [CrossRef]
- Moreno Ram, C.; Moreno Mar, E.; Ciprian Ca, A.; Lara Puente, J.H.; Quezada, F.; Tortora Pe, J.; Oswald, I.P.; Mendoza El, S. Experimental Trial of the Effect of Fumonisin B1 and the PRRS Virus in Swine. J. Anim. Vet. Adv. 2010, 9, 1301–1310. [Google Scholar] [CrossRef]
- Gbore, F.A. Reproductive organ weights and semen quality of pubertal boars fed dietary fumonisin B1. Animal 2009, 3, 1133–1137. [Google Scholar] [CrossRef]
- Fodor, J.; Bauer, J.; Horn, P.; Kovács, F.; Kovács, M. Effect of different dietary fumonisin B 1 exposure on the toxin content of porcine tissues. Ital. J. Anim. Sci. 2005, 4, 73–78. [Google Scholar] [CrossRef]
- Rao, Z.-X.; Tokach, M.D.; Woodworth, J.C.; DeRouchey, J.M.; Goodband, R.D.; Calderón, H.I.; Dritz, S.S. Effects of Fumonisin-Contaminated Corn on Growth Performance of 9 to 28 kg Nursery Pigs. Toxins 2020, 12, 604. [Google Scholar] [CrossRef]
- Pósa, R.; Magyar, T.; Stoev, S.D.; Glávits, R.; Donkó, T.; Repa, I.; Kovács, M. Use of Computed Tomography and Histopathologic Review for Lung Lesions Produced by the Interaction Between Mycoplasma hyopneumoniae and Fumonisin Mycotoxins in Pigs. Vet. Pathol. 2013, 50, 971–979. [Google Scholar] [CrossRef]
- Zomborszkyné-Kovács, M.; Vetés, I.F.; Kovács, F.; Bata, Á.; Repa, I.; Horn, P. A fusarium moniliforme fumonizin-B1 toxinjának tolerálható határértékére és perinatalis toxikózist eloîdézo hatására vonatkozó vizsgálatok sertésben (Investigations on the tolerable limit values and the perinatal toxic effect of mycotoxins produced by Fus. Magy. Allatorvosok Lapja 2000, 122, 168–175. [Google Scholar]
- Dobrzyń, A.; Górski, J. Ceramides and sphingomyelins in skeletal muscles of the rat: Content and composition. Effect of prolonged exercise. Am. J. Physiol. Metab. 2002, 282, E277–E285. [Google Scholar] [CrossRef]
- Levy, M.; Futerman, A.H. Mammalian ceramide synthases. IUBMB Life 2010, 62, 347–356. [Google Scholar] [CrossRef]
- Hartmann, D.; Lucks, J.; Fuchs, S.; Schiffmann, S.; Schreiber, Y.; Ferreirós, N.; Merkens, J.; Marschalek, R.; Geisslinger, G.; Grösch, S. Long chain ceramides and very long chain ceramides have opposite effects on human breast and colon cancer cell growth. Int. J. Biochem. Cell Biol. 2012, 44, 620–628. [Google Scholar] [CrossRef]
- Vudhgiri, S.; Koude, D.; Veeragoni, D.K.; Misra, S.; Prasad, R.B.N.; Jala, R.C.R. Synthesis and biological evaluation of 5-fatty-acylamido-1, 3, 4-thiadiazole-2-thioglycosides. Bioorg. Med. Chem. Lett. 2017, 27, 3370–3373. [Google Scholar] [CrossRef]
- Lopez, S.; Bermudez, B.; Montserrat-de la Paz, S.; Jaramillo, S.; Varela, L.M.; Ortega-Gomez, A.; Abia, R.; Muriana, F.J.G. Membrane composition and dynamics: A target of bioactive virgin olive oil constituents. Biochim. Biophys. Acta-Biomembr. 2014, 1838, 1638–1656. [Google Scholar] [CrossRef]
- Huang, C.; McIntosh, T.J. Probing the ethanol-induced chain interdigitations in gel-state bilayers of mixed-chain phosphatidylcholines. Biophys. J. 1997, 72, 2702–2709. [Google Scholar] [CrossRef]
- Boggs, J.M.; Koshy, K.M. Do the long fatty acid chains of sphingolipids interdigitate across the center of a bilayer of shorter chain symmetric phospholipids? Biochim. Biophys. Acta-Biomembr. 1994, 1189, 233–241. [Google Scholar] [CrossRef]
- Carrer, D.C.; Schreier, S.; Patrito, M.; Maggio, B. Effects of a Short-Chain Ceramide on Bilayer Domain Formation, Thickness, and Chain Mobililty: DMPC and Asymmetric Ceramide Mixtures. Biophys. J. 2006, 90, 2394–2403. [Google Scholar] [CrossRef]
- Chajès, V.; Joulin, V.; Clavel-Chapelon, F. The fatty acid desaturation index of blood lipids, as a biomarker of hepatic stearoyl-CoA desaturase expression, is a predictive factor of breast cancer risk. Curr. Opin. Lipidol. 2011, 22, 6–10. [Google Scholar] [CrossRef]
- Bass, V.; Schladweiler, M.; Kodavanti, U.; Ghio, A.; Madden, M. Oleic acid induces acute pulmonary injury and inflammation in vivo. In Proceedings of the Society of Toxicology (SOT) Annual Meeting, San Antonio, TX, USA, 11–15 March 2018. [Google Scholar]
- Guo, X.; Li, H.; Xu, H.; Halim, V.; Zhang, W.; Wang, H.; Ong, K.T.; Woo, S.-L.; Walzem, R.L.; Mashek, D.G.; et al. Palmitoleate Induces Hepatic Steatosis but Suppresses Liver Inflammatory Response in Mice. PLoS ONE 2012, 7, e39286. [Google Scholar] [CrossRef] [PubMed]
- Sosnowski, T.R.; Kubski, P.; Wojciechowski, K. New experimental model of pulmonary surfactant for biophysical studies. Colloids Surfaces A Physicochem. Eng. Asp. 2017, 519, 27–33. [Google Scholar] [CrossRef]
- Cao, H.; Gerhold, K.; Mayers, J.R.; Wiest, M.M.; Watkins, S.M.; Hotamisligil, G.S. Identification of a Lipokine, a Lipid Hormone Linking Adipose Tissue to Systemic Metabolism. Cell 2008, 134, 933–944. [Google Scholar] [CrossRef]
- Ghosh, M.; Tucker, D.; Burchett, S.; Leslie, C. Properties of the Group IV phospholipase A2 family. Prog. Lipid Res. 2006, 45, 487–510. [Google Scholar] [CrossRef] [PubMed]
- Strokin, M.; Sergeeva, M.; Reiser, G. Docosahexaenoic acid and arachidonic acid release in rat brain astrocytes is mediated by two separate isoforms of phospholipase A2 and is differently regulated by cyclic AMP and Ca2+. Br. J. Pharmacol. 2003, 139, 1014–1022. [Google Scholar] [CrossRef]
- Surette, M.E. The science behind dietary omega-3 fatty acids. Can. Med. Assoc. J. 2008, 178, 177–180. [Google Scholar] [CrossRef]
- Calder, P.C. n−3 Polyunsaturated fatty acids, inflammation, and inflammatory diseases. Am. J. Clin. Nutr. 2006, 83, 1505S–1519S. [Google Scholar] [CrossRef]
- Healy, D.A.; Wallace, F.A.; Miles, E.A.; Calder, P.C.; Newsholme, P. Effect of low-to-moderate amounts of dietary fish oil on neutrophil lipid composition and function. Lipids 2000, 35, 763–768. [Google Scholar] [CrossRef]
- Li, Q.; Chen, J.; Yu, X.; Gao, J.-M. A mini review of nervonic acid: Source, production, and biological functions. Food Chem. 2019, 301, 125286. [Google Scholar] [CrossRef]
- Liang, X.; Huang, Y.; Pan, X.; Hao, Y.; Chen, X.; Jiang, H.; Li, J.; Zhou, B.; Yang, Z. Erucic acid from Isatis indigotica Fort. suppresses influenza A virus replication and inflammation in vitro and in vivo through modulation of NF-κB and p38 MAPK pathway. J. Pharm. Anal. 2020, 10, 130–146. [Google Scholar] [CrossRef]
- Hamilton, J.; Greiner, R.; Salem, N.; Kim, H.-Y. n−3 Fatty acid deficiency decreases phosphatidylserine accumulation selectively in neuronal tissues. Lipids 2000, 35, 863–869. [Google Scholar] [CrossRef]
- Holub, B.J. The Nutritional Significance, Metabolism, and Function of myo-Inositol and Phosphatidylinositol in Health and Disease. In Advances in Nutritional Research; Springer: Boston, MA, USA, 1982; pp. 107–141. [Google Scholar]
- Voelker, D.R.; Numata, M. Phospholipid regulation of innate immunity and respiratory viral infection. J. Biol. Chem. 2019, 294, 4282–4289. [Google Scholar] [CrossRef]
- Zhou, Y.; Pu, J.; Wu, Y. The Role of Lipid Metabolism in Influenza A Virus Infection. Pathogens 2021, 10, 303. [Google Scholar] [CrossRef]
- Sun, X.; Song, L.; Feng, S.; Li, L.; Yu, H.; Wang, Q.; Wang, X.; Hou, Z.; Li, X.; Li, Y.; et al. Fatty Acid Metabolism is Associated With Disease Severity After H7N9 Infection. EBioMedicine 2018, 33, 218–229. [Google Scholar] [CrossRef]
- Repetto, M.G.; Ferrarotti, N.F.; Boveris, A. The involvement of transition metal ions on iron-dependent lipid peroxidation. Arch. Toxicol. 2010, 84, 255–262. [Google Scholar] [CrossRef]
- Dianzani, M.; Barrera, G. Pathology and physiology of lipid peroxidation and its carbonyl products. In Free Radical Pathophysiology; Álvarez, S., Evelson, P., Eds.; Transworld Research Network: Trivandrum, India, 2008; pp. 19–38. [Google Scholar]
- Wang, X.; Wu, Q.; Wan, D.; Liu, Q.; Chen, D.; Liu, Z.; Martínez-Larrañaga, M.R.; Martínez, M.A.; Anadón, A.; Yuan, Z. Fumonisins: Oxidative stress-mediated toxicity and metabolism in vivo and in vitro. Arch. Toxicol. 2016, 90, 81–101. [Google Scholar] [CrossRef]
- Domijan, A.-M.; Abramov, A.Y. Fumonisin B1 inhibits mitochondrial respiration and deregulates calcium homeostasis—Implication to mechanism of cell toxicity. Int. J. Biochem. Cell Biol. 2011, 43, 897–904. [Google Scholar] [CrossRef]
- Szabó, A.; Szabó-Fodor, J.; Kachlek, M.; Mézes, M.; Balogh, K.; Glávits, R.; Ali, O.; Zeebone, Y.; Kosvács, M. Dose and Exposure Time-Dependent Renal and Hepatic Effects of Intraperitoneally Administered Fumonisin B1 in Rats. Toxins 2018, 10, 465. [Google Scholar] [CrossRef]
- Petrache, I.; Natarajan, V.; Zhen, L.; Medler, T.R.; Richter, A.T.; Cho, C.; Hubbard, W.C.; Berdyshev, E.V.; Tuder, R.M. Ceramide upregulation causes pulmonary cell apoptosis and emphysema-like disease in mice. Nat. Med. 2005, 11, 491–498. [Google Scholar] [CrossRef]
- Guo, J.; Zhang, T.; Gu, J.; Cai, K.; Deng, X.; Chen, K.; Huang, K.; Wang, G.; Li, H.; Wang, J. Oleic Acid Protects against Hepatic Ischemia and Reperfusion Injury in Mice by Inhibiting AKT/mTOR Pathways. Oxid. Med. Cell. Longev. 2019, 2019, 4842592. [Google Scholar] [CrossRef]
- Fodor, J.; Meyer, K.; Riedlberger, M.; Bauer, J.; Horn, P.; Kovacs, F.; Kovacs, M. Distribution and elimination of fumonisin analogues in weaned piglets after oral administration of Fusarium verticillioides fungal culture. Food Addit. Contam. 2006, 23, 492–501. [Google Scholar] [CrossRef] [PubMed]
- Riley, R.T.; An, N.H.; Showker, J.L.; Yoo, H.S.; Norred, W.P.; Chamberlain, W.J.; Wang, E.; Merrill, A.H.; Motelin, G.; Beasley, V.R.; et al. Alteration of Tissue and Serum Sphinganine to Sphingosine Ratio: An Early Biomarker of Exposure to Fumonisin-Containing Feeds in Pigs. Toxicol. Appl. Pharmacol. 1993, 118, 105–112. [Google Scholar] [CrossRef] [PubMed]
- Motelin, G.K.; Haschek, W.M.; Ness, D.K.; Hall, W.F.; Harlin, K.S.; Schaeffer, D.J.; Beasley, V.R. Temporal and dose-response features in swine fed corn screenings contaminated with fumonisin mycotoxins. Mycopathologia 1994, 126, 27–40. [Google Scholar] [CrossRef] [PubMed]
- Stoev, S.D.; Gundasheva, D.; Zarkov, I.; Mircheva, T.; Zapryanova, D.; Denev, S.; Mitev, Y.; Daskalov, H.; Dutton, M.; Mwanza, M.; et al. Experimental mycotoxic nephropathy in pigs provoked by a mouldy diet containing ochratoxin A and fumonisin B1. Exp. Toxicol. Pathol. 2012, 64, 733–741. [Google Scholar] [CrossRef] [PubMed]
- Kovács, M.; Pósa, R.; Tuboly, T.; Donkó, T.; Repa, I.; Tossenberger, J.; Szabó-Fodor, J.; Stoev, S.; Magyar, T. Feed exposure to FB1 can aggravate pneumonic damages in pigs provoked by P. multocid a. Res. Vet. Sci. 2016, 108, 38–46. [Google Scholar] [CrossRef] [PubMed]
- AOAC. Official Methods of Analysis, 19th ed.; AOAC International: Gaithersburg, MD, USA, 2012. [Google Scholar]
- Fodor, J.; Kametler, L.; Kovács, M. Practical aspects of fumonisin production under laboratory conditions. Mycotoxin Res. 2006, 22, 211–216. [Google Scholar] [CrossRef]
- Fliszár-Nyúl, E.; Faisal, Z.; Skaper, R.; Lemli, B.; Bayartsetseg, B.; Hetényi, C.; Gömbös, P.; Szabó, A.; Poór, M. Interaction of the Emerging Mycotoxins Beauvericin, Cyclopiazonic Acid, and Sterigmatocystin with Human Serum Albumin. Biomolecules 2022, 12, 1106. [Google Scholar] [CrossRef]
- Folch, J.; Lees, M.; Stanley, G.H.S. A simple method for the isolation and purification of total lipides from animal tissues. J. Biol. Chem. 1957, 226, 497–509. [Google Scholar] [CrossRef]
- Christie, W.W. A simple procedure for rapid transmethylation of glycerolipids and cholesteryl esters. J. Lipid Res. 1982, 23, 1072–1075. [Google Scholar] [CrossRef]
- Heape, A.M.; Juguelin, H.; Boiron, F.; Cassagne, C. Improved one-dimensional thin-layer chromatographic technique for polar lipids. J. Chromatogr. A 1985, 322, 391–395. [Google Scholar] [CrossRef]
- Christie, W.W. Lipid Analysis: Isolation, Separation, Identification, and Structural Analysis of Lipids; Oily Press: Dundee, UK, 2003. [Google Scholar]
- Placer, Z.A.; Cushman, L.L.; Johnson, B.C. Estimation of product of lipid peroxidation (malonyl dialdehyde) in biochemical systems. Anal. Biochem. 1966, 16, 359–364. [Google Scholar] [CrossRef]
- Rahman, I.; Kode, A.; Biswas, S.K. Assay for quantitative determination of glutathione and glutathione disulfide levels using enzymatic recycling method. Nat. Protoc. 2006, 1, 3159–3165. [Google Scholar] [CrossRef]
- Matkovics, B.; Szabó, L.; Varga, S. Determination of lipid peroxidation and reduced glutathione metabolism enzymes activities in biological samples. Laboratóriumi Diagnosztika 1988, 15, 248–250. [Google Scholar]
- Lowry, O.; Rosebrough, N.; Farr, A.L.; Randall, R. Protein measurement with the Folin phenol reagent. J. Biol. Chem. 1951, 193, 265–275. [Google Scholar] [CrossRef]
- OECD Environmental Health and Safety Publications. OECD Principles of Good Laboratory Practice (as Revised in 1997). 1997. Available online: https//ntp.niehs.nih.gov/iccvam/suppdocs/feddocs/oecd/oecd_glpcm.pdf (accessed on 12 October 2022).
- IBM SPSS SPSS for Windows ver. 20, SPSS: Chicago, IL, USA, 2012.
- Multivariate Analysis Software. CAMO Software AS. Nedre Vollgate 8, N-0158; The Unscrambler: Oslo, Norway, 2006. [Google Scholar]


| Parameter | Control | 15 mg FBs | 30 mg FBs |
|---|---|---|---|
| Initial body weight | 12,980 ± 1720 | 13,800 ± 1200 | 13,800 ± 1080 |
| Final body weight | 21,467 ± 1735 | 23,067 ± 1454 | 23,367 ± 629 |
| Body weight gain | 8483 ± 2406 | 9267 ± 2240 | 9567 ± 1181 |
| Cumulative feed intake | 19,759 ± 2102 | 20,450 ± 1352 | 20,382 ± 1353 |
| Feed conversion efficiency | 2069 ± 299 | 2230 ± 246 | 2455 ± 389 |
| Absolute liver weight | 527.4 ± 42.1 | 587.2 ± 56.9 | 563.0 ± 69.2 |
| Absolute lung weight | 227.2 ± 45.0 | 237.1 ± 43.0 | 253.0 ± 70.0 |
| Relative liver weight (%) | 2.48 ± 0.38 | 2.55 ± 0.23 | 2.42 ± 0.45 |
| Relative lung weight (%) | 1.06 ± 0.20 | 1.03 ± 0.15 | 1.09 ± 0.30 |
| Fatty Acid | Control | 15 mg FBs | 30 mg FBs | Control | 15 mg FBs | 30 mg FBs |
|---|---|---|---|---|---|---|
| Liver | Lung | |||||
| C12:0 | 0.06 ± 0.04 a | 0.09 ± 0.03 ab | 0.10 ± 0.03 b | 0.12 ± 0.09 ab | 0.05 ± 0.05 a | 0.20 ± 0.03 b |
| C14:0 | 0.69 ± 0.08 | 0.61 ± 0.16 | 0.61 ± 0.15 | 1.27 ± 0.34 a | 1.36 ± 0.56 ab | 1.96 ± 0.69 b |
| C16:0 | 34.7 ± 4.01 | 34.0 ± 3.87 | 30.7 ± 5.21 | 51.3 ± 2.77 | 47.3 ± 3.87 | 47.9 ± 6.09 |
| C16:1n7 | - ± - | - ± - | - ± - | 0.34 ± 0.26 | 0.59 ± 0.32 | 0.60 ± 0.33 |
| C18:0 | 29.1 ± 5.53 | 30.9 ± 2.05 | 26.3 ± 4.81 | 18.4 ± 1.73 | 16.1 ± 2.84 | 15.5 ± 2.84 |
| C18:1n9c | 5.27 ± 1.91 | 4.43 ± 1.71 | 5.5 ± 2.46 | 2.00 ± 1.29 | 2.59 ± 1.16 | 3.26 ± 1.45 |
| C18:1n7 | 0.74 ± 0.35 | 0.57 ± 0.21 | 0.84 ± 0.34 | 0.41 ± 0.28 | 0.52 ± 0.28 | 0.63 ± 0.33 |
| C18:2n6 | 3.26 ± 1.58 | 2.92 ± 1.22 | 3.95 ± 2.27 | 0.99 ± 0.71 | 1.26 ± 0.70 | 1.55 ± 0.87 |
| C20:0 | 1.53 ± 0.25 b | 1.46 ± 0.27 b | 1.09 ± 0.36 a | 1.91 ± 0.24 | 2.20 ± 0.54 | 1.90 ± 0.37 |
| C20:1n9 | - ± - | - ± - | - ± - | 0.23 ± 0.05 | 0.20 ± 0.02 | 0.20 ± 0.05 |
| C20:4n6 | 0.91 ± 0.60 | 1.36 ± 0.66 | 1.31 ± 0.54 | 0.76 ± 0.65 | 0.86 ± 0.44 | 1.12 ± 0.64 |
| C22:0 | 1.60 ± 0.23 a | 1.85 ± 0.27 ab | 2.20 ± 0.58 b | 2.95 ± 0.55 | 3.74 ± 1.08 | 3.38 ± 0.61 |
| C22:1n9 | 9.49 ± 3.13 | 10.8 ± 3.76 | 11.4 ± 4.37 | 5.62 ± 1.55 a | 6.72 ± 1.1 ab | 8.97 ± 2.71 b |
| C23:0 | 1.42 ± 0.85 | 1.44 ± 0.36 | 1.73 ± 1.11 | 0.57 ± 0.07 | 0.73 ± 0.06 | 0.67 ± 0.24 |
| C24:0 | 5.10 ± 3.58 | 4.95 ± 1.14 | 6.26 ± 2.77 | 4.57 ± 0.86 b | 5.07 ± 1.07 b | 3.28 ± 0.58 a |
| C24:1n9 | 3.77 ± 2.85 | 2.81 ± 0.95 | 4.71 ± 1.81 | 8.80 ± 2.01 | 10.8 ± 2.35 | 8.83 ± 2.00 |
| saturation | 72.8 ± 10.98 | 75.3 ± 4.90 | 68.6 ± 7.65 | 81.1 ± 2.75 b | 76.6 ± 1.24 a | 74.8 ± 3.39 a |
| unsaturation | 23.4 ± 3.65 | 22.0 ± 3.74 | 25.7 ± 6.54 | 18.9 ± 2.75 a | 23.4 ± 1.24 b | 25.2 ± 3.39 b |
| monounsaturation | 19.3 ± 3.81 | 17.7 ± 4.42 | 20.5 ± 7.81 | 17.3 ± 2.36 a | 21.3 ± 1.51 b | 22.5 ± 2.89 b |
| polyunsaturation | 4.17 ± 1.77 | 4.28 ± 1.65 | 5.27 ± 2.79 | 1.62 ± 1.32 | 2.12 ± 1.13 | 2.67 ± 1.42 |
| n-6 | 4.17 ± 1.77 | 4.28 ± 1.65 | 5.27 ± 2.79 | 1.62 ± 1.32 | 2.12 ± 1.13 | 2.67 ± 1.42 |
| odd chain FA | 1.42 ± 0.85 | 1.44 ± 0.36 | 1.73 ± 1.11 | 0.57 ± 0.07 | 0.73 ± 0.06 | 0.67 ± 0.24 |
| unsaturation index | 29.4 ± 4.5 | 29.0 ± 3.84 | 33.6 ± 6.65 | 21.8 ± 4.80 a | 27.3 ± 2.50 ab | 30.1 ± 5.54 b |
| average chain length | 17.6 ± 1.59 | 17.9 ± 1.18 | 17.6 ± 1.52 | 18.1 ± 0.29 | 18.5 ± 0.34 | 18.3 ± 0.41 |
| Fatty Acid | Control | 15 mg FBs | 30 mg FBs | Control | 15 mg FBs | 30 mg FBs |
|---|---|---|---|---|---|---|
| Liver | Lung | |||||
| C12:0 | 0.01 ± - | - ± - | - ± - | 0.02 ± 0.01 ab | 0.01 ± 0.00 a | 0.03 ± 0.01 b |
| C14:0 | 0.21 ± 0.02 a | 0.30 ± 0.10 b | 0.37 ± 0.05 b | 2.99 ± 0.68 a | 3.13 ± 0.41 a | 4.08 ± 0.65 b |
| C16:0 | 22.0 ± 0.83 | 21.8 ± 1.99 | 23.9 ± 2.68 | 61.9 ± 1.28 a | 66.1 ± 2.93 b | 61.1 ± 1.58 a |
| C16:1n7 | 0.55 ± 0.06 a | 0.64 ± 0.06 b | 0.79 ± 0.08 c | 1.98 ± 0.42 | 1.67 ± 0.59 | 2.27 ± 0.64 |
| C18:0 | 28.1 ± 1.84 b | 28.6 ± 1.51 b | 26.2 ± 1.67 a | 9.42 ± 0.88 b | 9.42 ± 1.34 b | 7.35 ± 1.12 a |
| C18:1n9 | 12.4 ± 1.89 a | 14.1 ± 1.42 a | 17.1 ± 1.12 b | 8.68 ± 0.76 a | 7.54 ± 1.26 a | 9.99 ± 0.68 b |
| C18:1n7 | 1.96 ± 0.21 | 1.90 ± 0.30 | 1.95 ± 0.13 | 2.31 ± 0.21 b | 1.75 ± 0.37 a | 1.93 ± 0.27 a |
| C18:2n6 | 13.8 ± 0.96 b | 14.0 ± 1.36 b | 12.0 ± 1.04 a | 5.60 ± 0.31 ab | 4.73 ± 1.01 a | 6.21 ± 1.21 b |
| C18:3n6 | 0.17 ± 0.04 | 0.19 ± 0.03 | 0.17 ± 0.02 | 0.13 ± 0.04 b | 0.07 ± 0.02 a | 0.09 ± 0.03 ab |
| C18:3n3 | 0.14 ± 0.03 a | 0.17 ± 0.02 b | 0.14 ± 0.02 a | 0.05 ± 0.01 | 0.04 ± 0.01 | 0.05 ± 0.02 |
| C20:0 | 0.07 ± 0.01 | 0.07 ± 0.02 | 0.06 ± 0.01 | 0.09 ± 0.03 | 0.10 ± 0.04 | 0.09 ± 0.01 |
| C20:1n9 | 0.11 ± 0.02 | 0.12 ± 0.03 | 0.11 ± 0.03 | 0.15 ± 0.10 | 0.12 ± 0.03 | 0.13 ± 0.05 |
| C20:2n6 | 0.18 ± 0.06 | 0.17 ± 0.05 | 0.13 ± 0.02 | 0.19 ± 0.05 a | 0.12 ± 0.05 b | 0.13 ± 0.02 b |
| C20:3n6 | 0.46 ± 0.12 | 0.49 ± 0.04 | 0.47 ± 0.05 | 0.44 ± 0.04 b | 0.34 ± 0.08 a | 0.44 ± 0.08 b |
| C20:4n6 | 15.2 ± 2.20 b | 13.7 ± 1.35 ab | 12.7 ± 2.69 a | 3.95 ± 0.36 b | 2.97 ± 0.63 a | 3.49 ± 0.58 ab |
| C20:5n3 | 0.26 ± 0.09 | 0.29 ± 0.11 | 0.22 ± 0.04 | 0.05 ± 0.01 | 0.05 ± 0.01 | 0.05 ± 0.01 |
| C22:0 | - ± - | - ± - | - ± - | 0.07 ± 0.02 | 0.10 ± 0.04 | 0.08 ± 0.02 |
| C22:1n9 | 1.19 ± 0.47 | 1.25 ± 0.67 | 1.15 ± 0.41 | 1.49 ± 0.17 a | 1.23 ± 0.37 a | 2.07 ± 0.41 b |
| C22:5n3 | 1.22 ± 0.23 b | 0.91 ± 0.13 a | 0.96 ± 0.24 ab | 0.13 ± 0.02 b | 0.10 ± 0.03 a | 0.10 ± 0.02 a |
| C24:0 | 0.07 ± 0.03 | 0.05 ± 0.04 | 0.14 ± 0.06 | 0.08 ± 0.02 ab | 0.14 ± 0.08 b | 0.06 ± 0.02 a |
| C22:6n3 | 1.82 ± 0.60 | 1.20 ± 0.24 | 1.42 ± 0.69 | 0.16 ± 0.03 b | 0.07 ± 0.04 a | 0.04 ± 0.02 a |
| C24:1n9 | - ± - | 0.06 ± - | 0.17 ± 0.10 | 0.11 ± 0.04 | 0.22 ± 0.12 | 0.22 ± 0.10 |
| saturation | 50.5 ± 2.11 | 50.9 ± 2.76 | 50.6 ± 4.25 | 74.6 ± 1.76 a | 79.0 ± 3.77 b | 72.8 ± 1.58 a |
| unsaturation | 49.5 ± 2.11 | 49.0 ± 2.73 | 49.4 ± 4.25 | 25.4 ± 1.76 b | 21.0 ± 3.77 a | 27.2 ± 1.53 b |
| monounsaturation | 16.2 ± 1.99 a | 18.0 ± 1.83 a | 21.1 ± 1.03 b | 14.7 ± 1.15 b | 12.5 ± 2.18 a | 16.6 ± 0.57 c |
| polyunsaturation | 33.3 ± 3.55 b | 31.1 ± 2.73 ab | 28.2 ± 4.23 a | 10.7 ± 0.69 b | 8.47 ± 1.75 a | 10.6 ± 1.30 b |
| n-3 | 3.44 ± 0.75 b | 2.52 ± 0.34 a | 2.75 ± 0.96 ab | 0.38 ± 0.04 b | 0.25 ± 0.03 a | 0.23 ± 0.03 a |
| n-6 | 29.9 ± 2.81 b | 28.6 ± 2.58 ab | 25.5 ± 3.39 a | 10.3 ± 0.69 b | 8.22 ± 1.74 a | 10.4 ± 1.29 b |
| n-6:n-3 | 8.98 ± 1.75 ab | 11.5 ± 1.49 b | 9.8 ± 1.92 a | 27.2 ± 3.91 a | 33.29 ± 7.33 a | 44.5 ± 7.01 b |
| unsaturation index | 124 ± 12.5 | 115 ± 7.94 | 112 ± 16.9 | 45.6 ± 3.08 b | 36.3 ± 6.71 a | 45.7 ± 3.53 b |
| average chain length | 18.0 ± 0.09 | 18.0 ± 0.06 | 17.9 ± 0.17 | 16.8 ± 0.05 | 16.7 ± 0.08 | 16.8 ± 0.08 |
| Liver | Lung | ||||||
|---|---|---|---|---|---|---|---|
| Parameter | Slope | Constant | R2 | Parameter | Slope | Constant | R2 |
| Phosphatidylcholine | Phosphatidylcholine | ||||||
| C16:1 | −44.129 | 89.188 | 0.69 | C22:6n3 | 31.164 | −178.028 | 0.705 |
| C18:1n9 | −44.357 | 4.073 | 0.633 | n-3 | 53.773 | −133.946 | 0.667 |
| monousaturation | −53.704 | 3.710 | 0.609 | n-6:n-3 | −20.943 | 1.027 | 0.594 |
| Phosphatidylserine | |||||||
| C22:0 | 40.488 | −52.0917 | 0.782 | ||||
| C24:0 | 40.566 | −134.894 | 0.645 | ||||
| Fatty Acid | Control | 15 mg FBs | 30 mg FBs | Control | 15 mg FBs | 30 mg FBs |
|---|---|---|---|---|---|---|
| Liver | Lung | |||||
| C12:0 | 0.02 ± 0.00 | 0.03 ± 0.01 | 0.02 ± 0.00 | 0.07 ± 0.03 ab | 0.03 ± 0.01 a | 0.09 ± 0.03 b |
| C14:0 | 0.14 ± 0.03 | 0.14 ± 0.04 | 0.12 ± 0.02 | 0.30 ± 0.17 | 0.36 ± 0.24 | 0.40 ± 0.11 |
| C16:0 | 11.9 ± 1.33 | 11.3 ± 1.52 | 11.5 ± 1.51 | 18.9 ± 2.85 | 19.3 ± 6.07 | 20.2 ± 3.23 |
| C16:1n7 | 0.16 ± 0.03 a | 0.20 ± 0.03 b | 0.20 ± 0.04 b | 0.41 ± 0.12 a | 0.56 ± 0.10 ab | 0.73 ± 0.24 b |
| C18:0 | 36.5 ± 1.24 | 37.2 ± 1.94 | 39.4 ± 5.11 | 21.7 ± 1.49 | 19.9 ± 0.79 | 20.7 ± 2.71 |
| C18:1n9 | 5.49 ± 0.56 a | 6.27 ± 1.33 ab | 7.11 ± 1.08 b | 14.3 ± 0.66 | 15.2 ± 1.01 | 15.3 ± 0.73 |
| C18:1n7 | 1.06 ± 0.11 | 1.00 ± 0.23 | 1.01 ± 0.18 | 2.57 ± 0.46 | 2.72 ± 0.29 | 2.70 ± 0.20 |
| C18:2n6 | 6.72 ± 0.80 | 7.19 ± 0.62 | 6.33 ± 0.83 | 5.47 ± 0.41 a | 6.31 ± 0.49 a | 7.36 ± 1.07 b |
| C18:3n6 | - ± - | - ± - | - ± - | 0.21 ± 0.17 | 0.19 ± 0.11 | 0.07 ± - |
| C18:3n3 | - ± - | - ± - | - ± - | 0.12 ± - | 0.13 ± 0.06 | 0.12 ± 0.03 |
| C20:0 | 0.09 ± 0.01 | 0.07 ± 0.01 | 0.06 ± 0.04 | 0.16 ± 0.03 | 0.13 ± 0.01 | 0.16 ± 0.04 |
| C20:1n9 | 0.15 ± 0.03 | 0.14 ± 0.03 | 0.12 ± 0.03 | 0.40 ± 0.04 | 0.39 ± 0.14 | 0.42 ± 0.08 |
| C20:2n6 | 0.15 ± 0.04 | 0.11 ± 0.06 | 0.09 ± 0.04 | 0.17 ± 0.08 | 0.19 ± 0.13 | 0.16 ± 0.10 |
| C20:3n6 | 0.33 ± 0.03 | 0.36 ± 0.07 | 0.33 ± 0.05 | 1.05 ± 0.08 | 1.21 ± 0.25 | 1.19 ± 0.19 |
| C20:4n6 | 28.3 ± 1.84 | 27.9 ± 1.75 | 26.0 ± 3.04 | 28.3 ± 2.08 | 27.5 ± 3.94 | 24.0 ± 4.69 |
| C20:5n3 | 0.26 ± 0.08 ab | 0.36 ± 0.15 b | 0.17 ± 0.06 a | 0.23 ± 0.03 | 0.33 ± 0.11 | 0.28 ± 0.08 |
| C22:0 | - ± - | - ± - | - ± - | 0.07 ± 0.01 b | 0.04 ± 0.01 a | 0.04 ± 0.01 a |
| C22:1n9 | 2.01 ± 0.36 | 2.04 ± 0.42 | 1.71 ± 0.47 | 3.06 ± 0.62 a | 2.84 ± 0.42 a | 4.14 ± 1.03 b |
| C22:5n3 | 2.29 ± 0.29 | 1.94 ± 0.15 | 1.90 ± 0.43 | 1.76 ± 0.18 ab | 1.85 ± 0.41 b | 1.48 ± 0.24 a |
| C22:6n3 | 4.46 ± 0.90 | 3.70 ± 0.88 | 3.65 ± 0.90 | 1.01 ± 0.33 | 1.01 ± 0.36 | 0.73 ± 0.34 |
| saturation | 48.6 ± 1.65 | 48.8 ± 2.44 | 51.0 ± 6.40 | 41.2 ± 1.98 | 39.7 ± 5.75 | 41.6 ± 5.00 |
| unsaturation | 51.4 ± 1.65 | 51.2 ± 2.45 | 48.5 ± 6.02 | 58.8 ± 1.98 | 60.3 ± 5.75 | 58.4 ± 5.00 |
| monounsaturation | 8.87 ± 0.75 | 9.65 ± 1.86 | 9.91 ± 1.23 | 20.69 ± 0.51 a | 21.7 ± 1.20 ab | 23.24 ± 1.76 b |
| polyunsaturation | 42.5 ± 2.07 | 41.6 ± 2.44 | 38.5 ± 4.89 | 38.1 ± 1.94 | 38.5 ± 4.78 | 35.2 ± 4.07 |
| n-3 | 7.01 ± 0.57 b | 6.00 ± 0.83 ab | 5.73 ± 1.03 a | 3.02 ± 0.25 | 3.23 ± 0.51 | 2.53 ± 0.33 |
| n-6 | 35.5 ± 1.63 | 35.6 ± 1.76 | 32.8 ± 4.02 | 35.1 ± 1.89 | 35.3 ± 4.41 | 32.7 ± 3.85 |
| n-6:n-3 | 5.08 ± 0.30 a | 6.01 ± 0.67 b | 5.69 ± 0.56 ab | 11.7 ± 1.09 ab | 11.0 ± 1.25 a | 13.0 ± 1.36 b |
| unsaturation index | 176 ± 9.69 | 171 ± 10.1 | 160 ± 21.1 | 156 ± 8.56 | 156 ± 17.9 | 144 ± 18.1 |
| average chain length | 18.8 ± 0.17 b | 18.7 ± 0.18 ab | 18.4 ± 0.32 a | 18.4 ± 0.11 | 18.4 ± 0.23 | 18.3 ± 0.19 |
| Fatty Acid | Control | 15 mg FBs | 30 mg FBs | Control | 15 mg FBs | 30 mg FBs |
|---|---|---|---|---|---|---|
| Liver | Lung | |||||
| C12:0 | 0.02 ± 0.01 a | 0.08 ± 0.02 b | 0.09 ± 0.02 b | - ± - | - ± - | - ± - |
| C14:0 | 0.56 ± 0.13 | 0.66 ± 0.11 | 0.66 ± 0.09 | 0.39 ± 0.11 | 0.45 ± 0.18 | 0.58 ± 0.13 |
| C16:0 | 26.8 ± 3.02 | 28.3 ± 4.08 | 29.2 ± 3.29 | 19.4 ± 2.49 | 18.8 ± 2.65 | 20.7 ± 3.29 |
| C16:1n7 | - ± - | - ± - | - ± - | 0.18 ± 0.07 | 0.25 ± 0.12 | 0.32 ± 0.20 |
| C18:0 | 41.8 ± 3.98 | 40.0 ± 2.54 | 38.1 ± 2.56 | 41.7 ± 1.98 b | 38.5 ± 2.05 a | 37.2 ± 1.83 a |
| C18:1n9 | 5.81 ± 1.39 | 4.41 ± 1.34 | 6.58 ± 2.25 | 23.2 ± 2.11 ab | 24.6 ± 1.69 b | 21.9 ± 1.62 a |
| C18:1n7 | 0.43 ± 0.11 | 0.46 ± 0.08 | 0.59 ± 0.16 | 1.15 ± 0.09 | 1.29 ± 0.11 | 1.18 ± 0.13 |
| C18:2n6 | 1.73 ± 0.34 | 1.74 ± 0.28 | 2.08 ± 0.34 | 2.65 ± 0.25 a | 3.57 ± 0.29 b | 3.49 ± 0.78 b |
| C18:3n6 | - ± - | - ± - | - ± - | 0.16 ± 0.05 a | 0.27 ± 0.10 b | 0.10 ± 0.02 a |
| C20:0 | 0.32 ± 0.02 | 0.38 ± 0.09 | 0.41 ± 0.08 | 0.53 ± 0.06 b | 0.44 ± 0.04 a | 0.41 ± 0.06 a |
| C20:1n9 | 0.36 ± 0.05 b | 0.23 ± 0.01 a | 0.27 ± 0.05 a | 0.37 ± 0.10 | 0.41 ± 0.03 | 0.40 ± 0.06 |
| C20:3n6 | 0.43 ± 0.12 | 0.48 ± 0.10 | 0.57 ± 0.14 | 0.89 ± 0.10 a | 1.21 ± 0.24 b | 1.18 ± 0.17 b |
| C20:4n6 | 8.39 ± 1.82 | 6.96 ± 2.12 | 7.50 ± 1.23 | 2.24 ± 0.34 a | 2.74 ± 0.40 b | 2.69 ± 0.20 b |
| C22:0 | - ± - | - ± - | - ± - | 0.70 ± 0.17 b | 0.52 ± 0.06 a | 0.25 ± 0.04 a |
| C22:1n9 | 9.30 ± 1.54 | 11.7 ± 1.41 | 10.7 ± 3.00 | 5.46 ± 0.78 a | 6.05 ± 1.12 a | 8.79 ± 1.68 b |
| C22:5n3 | 0.84 ± 0.11 b | 0.75 ± 0.16 ab | 0.66 ± 0.11 a | 0.35 ± 0.05 | 0.40 ± 0.04 | 0.35 ± 0.06 |
| C24:0 | 0.13 ± 0.04 | 0.18 ± 0.07 | - ± - | 0.27 ± 0.04 b | 0.16 ± 0.05 a | 0.13 ± 0.04 a |
| C22:6n3 | 2.04 ± 0.71 | 1.58 ± 0.83 | 1.22 ± 0.75 | 0.17 ± 0.04 b | 0.12 ± 0.01 a | 0.12 ± 0.03 a |
| C24:1n9 | 0.08 ± 0.08 a | 0.38 ± 0.12 b | 0.28 ± 0.10 b | 0.22 ± 0.05 | 0.27 ± 0.12 | 0.24 ± 0.04 |
| saturation | 69.7 ± 5.21 | 69.4 ± 5.64 | 68.5 ± 4.10 | 63.0 ± 2.59 b | 58.8 ± 0.75 a | 59.1 ± 2.32 a |
| unsaturation | 27.5 ± 4.05 | 24.6 ± 6.17 | 28.2 ± 3.96 | 37.0 ± 2.59 a | 41.2 ± 0.74 b | 40.7 ± 2.56 b |
| monounsaturation | 15.8 ± 2.30 | 14.8 ± 6.54 | 18.3 ± 2.61 | 30.6 ± 2.62 | 32.8 ± 0.90 | 32.8 ± 2.75 |
| polyunsaturation | 13.1 ± 2.29 | 11.5 ± 2.97 | 11.6 ± 2.34 | 6.45 ± 0.51 a | 8.32 ± 0.88 b | 7.86 ± 1.13 b |
| n-3 | 2.87 ± 0.72 | 2.33 ± 0.97 | 1.88 ± 0.84 | 0.53 ± 0.06 | 0.53 ± 0.04 | 0.46 ± 0.05 |
| n-6 | 10.2 ± 1.65 | 9.18 ± 2.08 | 9.74 ± 1.59 | 5.92 ± 0.54 a | 7.80 ± 0.86 b | 7.39 ± 1.10 b |
| n-6:n-3 | 3.63 ± 0.52 a | 4.16 ± 0.78 ab | 5.98 ± 2.46 b | 11.5 ± 2.02 a | 14.9 ± 1.42 b | 16.0 ± 1.96 b |
| unsaturation index | 69.8 ± 11.7 | 60.8 ± 13.3 | 63.9 ± 11.6 | 50.7 ± 3.04 | 58.1 ± 2.36 | 47.4 ± 23.4 |
| average chain length | 17.9 ± 0.57 | 17.3 ± 1.86 | 17.8 ± 0.74 | 18.0 ± 0.07 | 18.0 ± 0.07 | 24.3 ± 15.3 |
| Fatty Acid | Control | 15 mg FBs | 30 mg FBs | Control | 15 mg FBs | 30 mg FBs |
|---|---|---|---|---|---|---|
| Liver | Lung | |||||
| C12:0 | 0.08 ± 0.01 a | 0.12 ± 0.02 b | 0.09 ± 0.01 ab | - ± - | - ± - | - ± - |
| C14:0 | 0.38 ± 0.13 | 0.47 ± 0.11 | 0.36 ± 0.09 | 0.47 ± 0.06 b | 0.38 ± 0.05 a | 0.51 ± 0.05 b |
| C16:0 | 17.8 ± 1.96 | 21.4 ± 4.82 | 16.7 ± 4.36 | 31.0 ± 1.57 | 30.5 ± 1.94 | 29.7 ± 3.49 |
| C16:1n7 | - ± - | - ± - | - ± - | 0.94 ± 0.44 | 1.23 ± 0.55 | 0.87 ± 0.15 |
| C18:0 | 39.9 ± 2.54 a | 44.7 ± 1.48 b | 42.8 ± 3.34 ab | 29.2 ± 2.15 b | 27.2 ± 2.32 ab | 26.6 ± 1.24 a |
| C18:1n9 | 1.74 ± 0.72 | 1.56 ± 0.35 | 1.88 ± 0.41 | 10.3 ± 1.68 | 12.2 ± 2.27 | 12.0 ± 0.91 |
| C18:1n7 | 0.23 ± 0.08 | 0.27 ± 0.08 | 0.26 ± 0.03 | 1.81 ± 0.25 | 2.01 ± 0.27 | 1.88 ± 0.15 |
| C18:2n6 | 2.24 ± 0.41 | 2.25 ± 0.34 | 1.91 ± 0.34 | 5.10 ± 0.97 | 5.75 ± 1.08 | 6.62 ± 2.46 |
| C20:3n6 | 0.48 ± 0.05 | 0.51 ± 0.17 | 0.58 ± 0.07 | 0.42 ± 0.53 | 0.49 ± 0.29 | 0.04 ± - |
| C18:3n3 | - ± - | - ± - | - ± - | 0.28 ± 0.21 | 0.21 ± 0.11 | 0.14 ± 0.05 |
| C20:0 | - ± - | - ± - | - ± - | 0.18 ± 0.09 | 0.15 ± 0.06 | 0.19 ± 0.02 |
| C20:1n9 | - ± - | - ± - | - ± - | 0.23 ± 0.07 | 0.21 ± 0.05 | 0.22 ± 0.03 |
| C20:2n6 | - ± - | - ± - | - ± - | 0.07 ± 0.01 | 0.05 ± 0.02 | 0.06 ± 0.04 |
| C20:3n6 | - ± - | - ± - | - ± - | 0.64 ± 0.07 | 0.67 ± 0.13 | 0.66 ± 0.12 |
| C20:4n6 | 19.7 ± 1.68 | 19.5 ± 4.83 | 22.4 ± 2.35 | 12.8 ± 1.12 | 13.1 ± 1.50 | 11.3 ± 1.73 |
| C22:0 | - ± - | - ± - | - ± - | 0.06 ± 0.02 | 0.03 ± 0.01 | 0.06 ± 0.05 |
| C22:1n9 | 14.5 ± 5.42 b | 8.01 ± 1.76 a | 11.9 ± 5.67 ab | 6.01 ± 1.84 a | 5.39 ± 1.38 a | 8.55 ± 1.22 b |
| C22:5n3 | 1.20 ± 0.30 b | 0.64 ± 0.14 a | 0.78 ± 0.34 a | 0.41 ± 0.05 | 0.42 ± 0.07 | 0.40 ± 0.06 |
| C24:0 | 0.19 ± 0.05 | 0.12 ± 0.02 | 0.11 ± 0.03 | - ± - | - ± - | - ± - |
| C22:6n3 | 0.58 ± 0.14 b | 0.36 ± 0.12 a | 0.31 ± 0.16 a | 0.19 ± 0.02 b | 0.15 ± 0.04 ab | 0.13 ± 0.08 a |
| C24:1n9 | 0.50 ± 0.25 b | 0.17 ± 0.04 a | 0.13 ± 0.04 a | - ± - | - ± - | - ± - |
| saturation | 58.2 ± 3.91 a | 66.8 ± 4.4 b | 60.0 ± 7.75 ab | 60.9 ± 2.25 b | 58.3 ± 2.67 ab | 56.9 ± 2.91 a |
| unsaturation | 40.5 ± 4.40 b | 33.1 ± 4.47 a | 39.8 ± 7.59 ab | 39.0 ± 2.27 a | 41.7 ± 2.67 ab | 42.9 ± 3.33 b |
| monounsaturation | 16.9 ± 5.07 b | 9.87 ± 1.92 a | 13.9 ± 5.4 ab | 19.3 ± 2.59 a | 21.0 ± 2.09 ab | 23.5 ± 1.43 b |
| polyunsaturation | 23.6 ± 1.45 | 23.3 ± 5.48 | 25.9 ± 2.87 | 19.7 ± 0.85 | 20.7 ± 1.93 | 19.3 ± 3.41 |
| n-3 | 1.67 ± 0.28 b | 1.00 ± 0.22 a | 0.96 ± 0.35 a | 0.79 ± 0.18 | 0.78 ± 0.14 | 0.64 ± 0.09 |
| n-6 | 21.9 ± 1.69 | 22.3 ± 5.27 | 24.9 ± 2.60 | 18.9 ± 0.75 | 19.9 ± 1.93 | 18.7 ± 3.35 |
| n-6:n-3 | 13.5 ± 2.97 a | 22.2 ± 1.41 b | 28.6 ± 10.14 b | 25.1 ± 5.61 | 26.1 ± 5.03 | 29.3 ± 4.28 |
| unsaturation index | 109 ± 3.85 | 99.1 ± 20.4 | 114 ± 15.3 | 75.6 ± 4.33 | 78.7 ± 6.48 | 73.7 ± 7.18 |
| average chain length | 18.5 ± 0.51 | 18.3 ± 0.18 | 18.6 ± 0.33 | 17.9 ± 0.11 | 17.9 ± 0.12 | 17.9 ± 0.15 |
| Parameter | Control | 15 mg FBs | 30 mg FBs | Control | 15 mg FBs | 30 mg FBs |
|---|---|---|---|---|---|---|
| Liver | Lung | |||||
| GSH (micromol/g prot.) | 7.71 ± 0.64 | 7.49 ± 1.14 | 7.67 ± 1.19 | 4.94 ± 0.93 | 4.76 ± 0.51 | 4.92 ± 0.93 |
| GPx (U/g prot.) | 4.15 ± 0.36 | 3.88 ± 0.60 | 4.00 ± 0.54 | 5.37 ± 0.51 | 5.53 ± 0.45 | 5.84 ± 0.53 |
| MDA (nmol/g) | 71.0 ± 7.82 | 65.9 ± 12.0 | 59.6 ± 9.45 | 41.6 ± 7.65 | 43.0 ± 7.09 | 36.6 ± 2.74 |
| Component | Concentration |
|---|---|
| Crude protein (%) | 17.50 |
| Crude fat (%) | 3.30 |
| Crude fiber (%) | 3.70 |
| Crude ash (%) | 5.00 |
| Starch (%) | 41.8 |
| Lysine (g/kg) | 1.11 |
| Methionine (g/kg) | 0.37 |
| Ca (g/kg) | 0.65 |
| P (g/kg) | 0.50 |
| Na (g/kg) | 0.18 |
| DE (MJ/kg) | 14.7 |
| ME (MJ/kg) | 14.1 |
| Fatty acid (methyl ester) | % |
| C12:0 | 0.01 |
| C14:0 | 0.19 |
| C14:1 | 0.01 |
| C15:0 | 0.02 |
| C16:0 | 15.3 |
| C16:1n7 | 0.33 |
| C17:0 | 0.08 |
| C18:0 | 5.61 |
| C18:1n9 | 26.5 |
| C18:1n7 | 1.13 |
| C18:2n6 | 47.1 |
| C18:3n3 | 2.60 |
| C20:0 | 0.36 |
| C20:1n9 | 0.39 |
| C20:2n6 | 0.07 |
| C20:4n6 | 0.08 |
| C22:0 | 0.06 |
| C24:0 | 0.06 |
| C22:6n3 | 0.13 |
Publisher’s Note: MDPI stays neutral with regard to jurisdictional claims in published maps and institutional affiliations. |
© 2022 by the authors. Licensee MDPI, Basel, Switzerland. This article is an open access article distributed under the terms and conditions of the Creative Commons Attribution (CC BY) license (https://creativecommons.org/licenses/by/4.0/).
Share and Cite
Ali, O.; Mézes, M.; Balogh, K.; Kovács, M.; Turbók, J.; Szabó, A. Fumonisin B Series Mycotoxins’ Dose Dependent Effects on the Porcine Hepatic and Pulmonary Phospholipidome. Toxins 2022, 14, 803. https://doi.org/10.3390/toxins14110803
Ali O, Mézes M, Balogh K, Kovács M, Turbók J, Szabó A. Fumonisin B Series Mycotoxins’ Dose Dependent Effects on the Porcine Hepatic and Pulmonary Phospholipidome. Toxins. 2022; 14(11):803. https://doi.org/10.3390/toxins14110803
Chicago/Turabian StyleAli, Omeralfaroug, Miklós Mézes, Krisztián Balogh, Melinda Kovács, Janka Turbók, and András Szabó. 2022. "Fumonisin B Series Mycotoxins’ Dose Dependent Effects on the Porcine Hepatic and Pulmonary Phospholipidome" Toxins 14, no. 11: 803. https://doi.org/10.3390/toxins14110803
APA StyleAli, O., Mézes, M., Balogh, K., Kovács, M., Turbók, J., & Szabó, A. (2022). Fumonisin B Series Mycotoxins’ Dose Dependent Effects on the Porcine Hepatic and Pulmonary Phospholipidome. Toxins, 14(11), 803. https://doi.org/10.3390/toxins14110803