Modelling the Spatial and Temporal Dynamics of Paralytic Shellfish Toxins (PST) at Different Scales: Implications for Research and Management

 ,
,  , ,
, ,  , , , and
Abstract
1. Introduction
2. Results
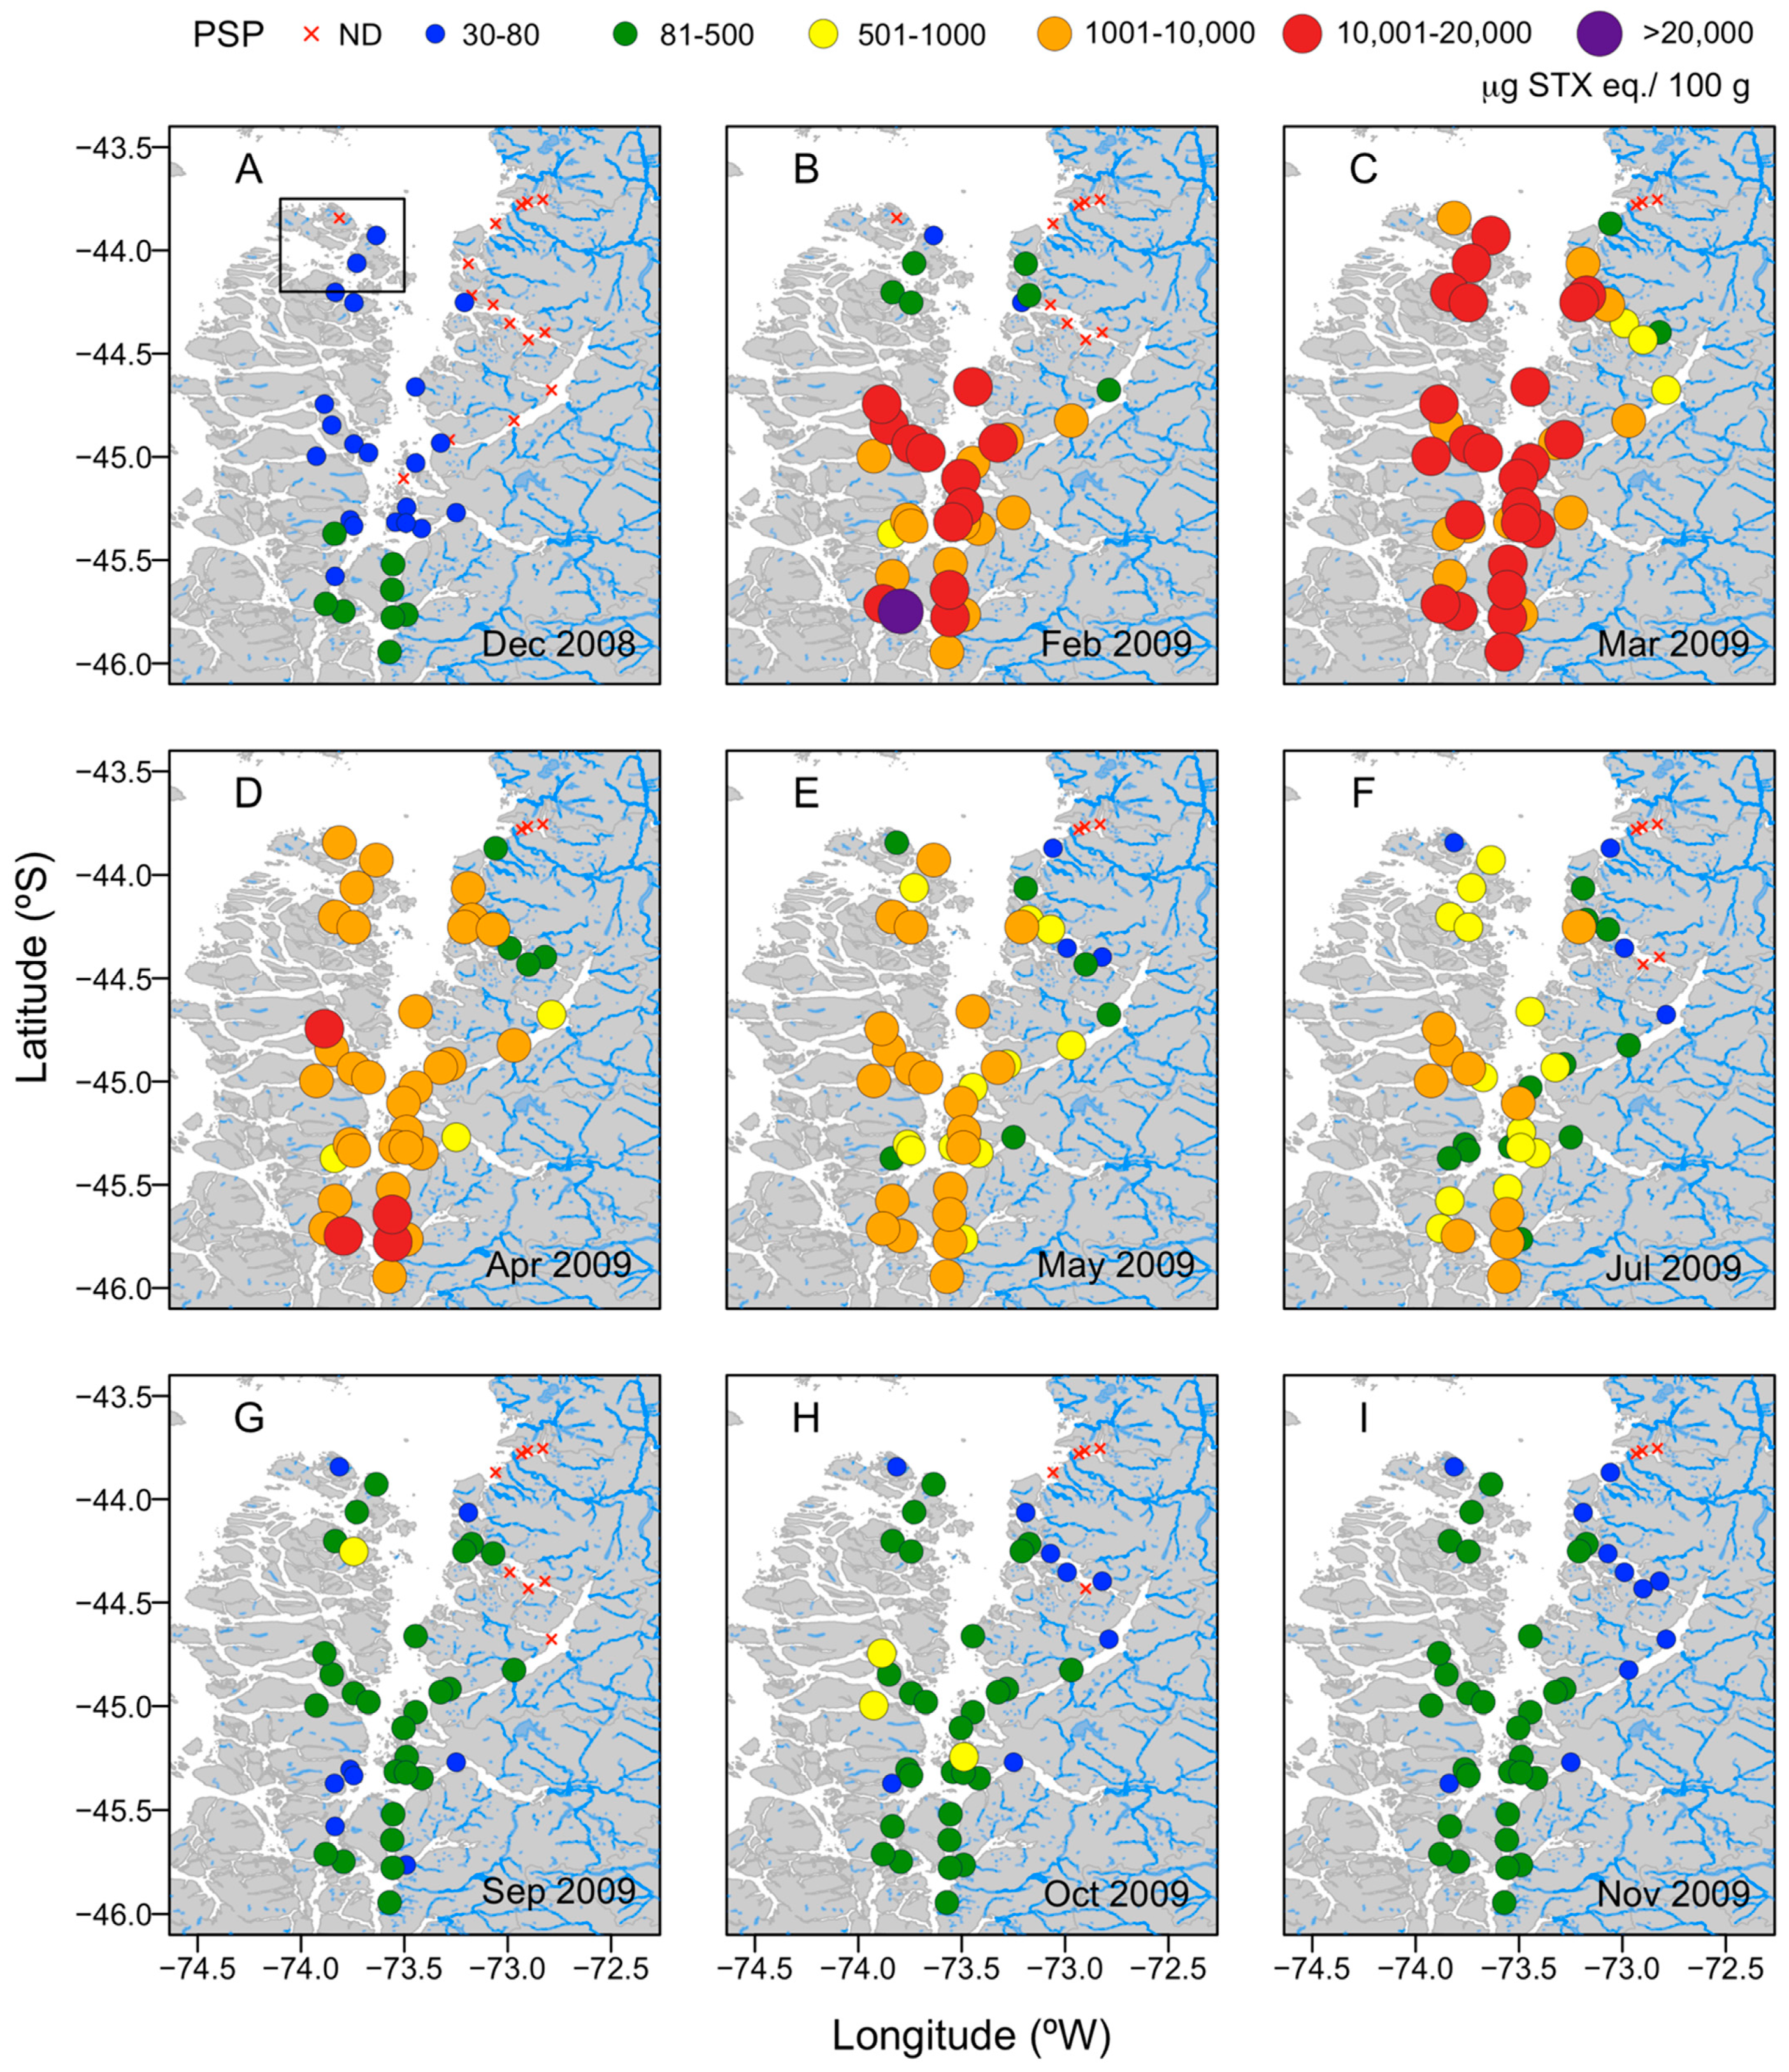
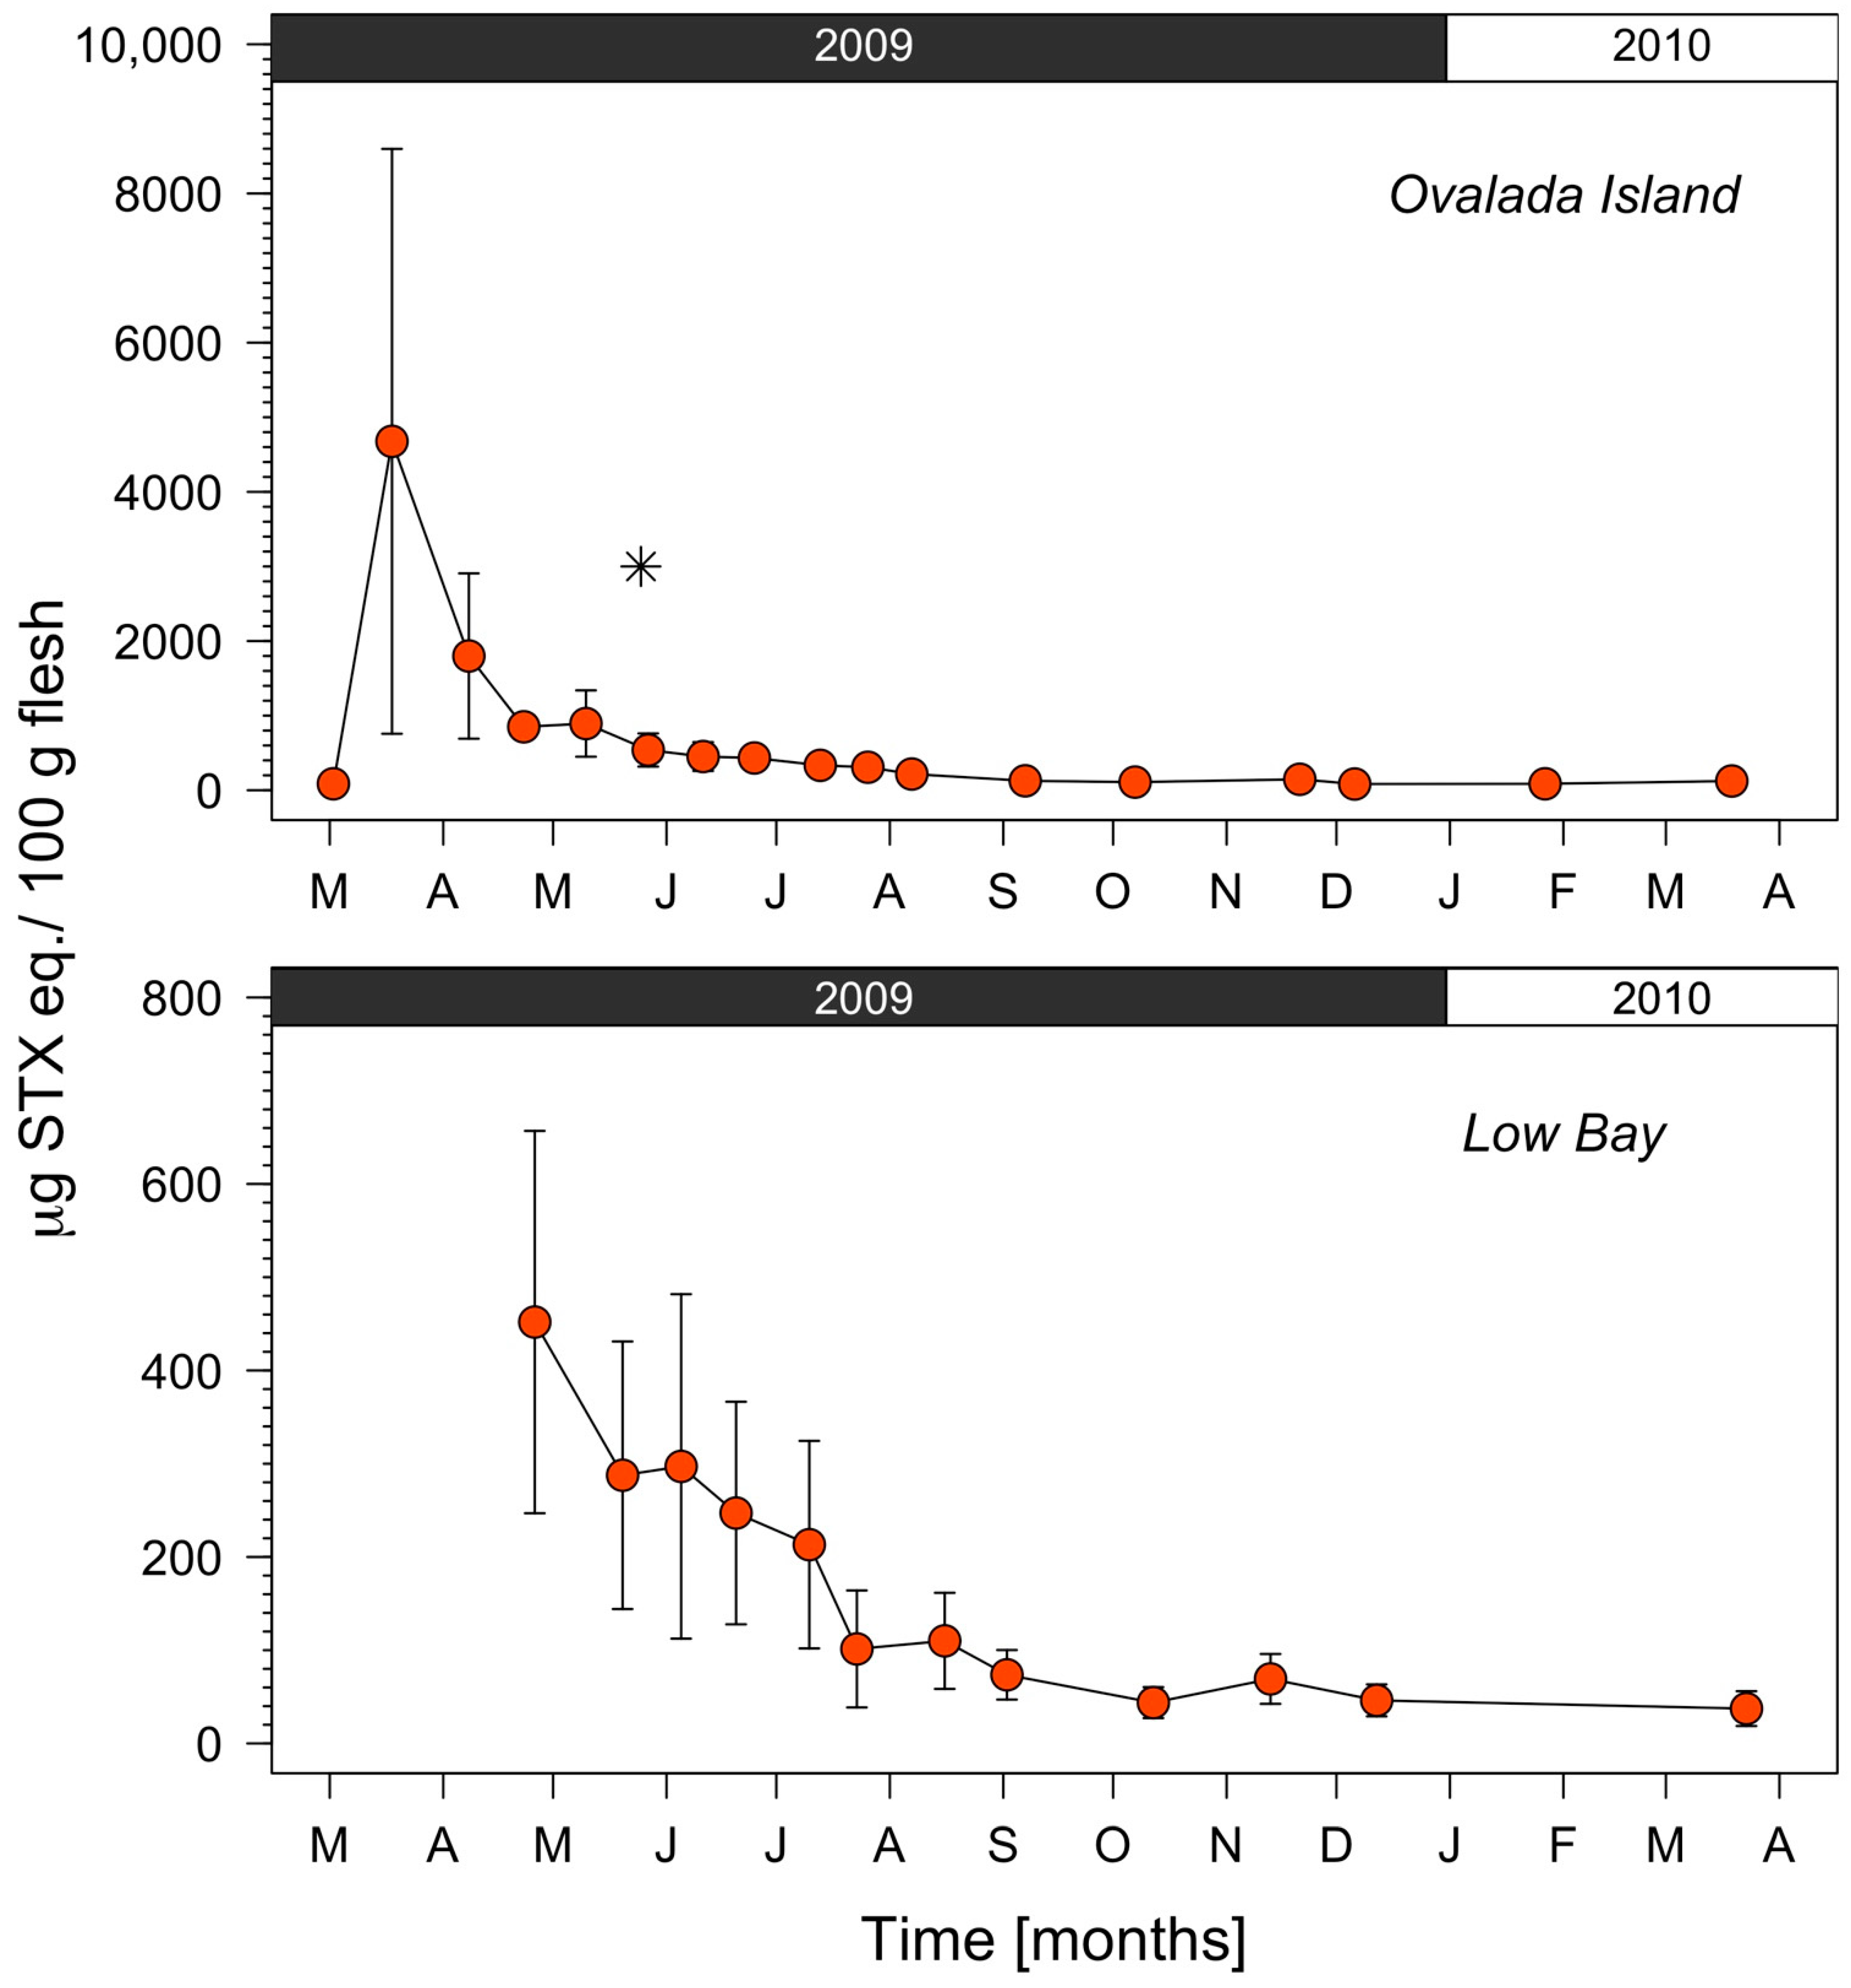
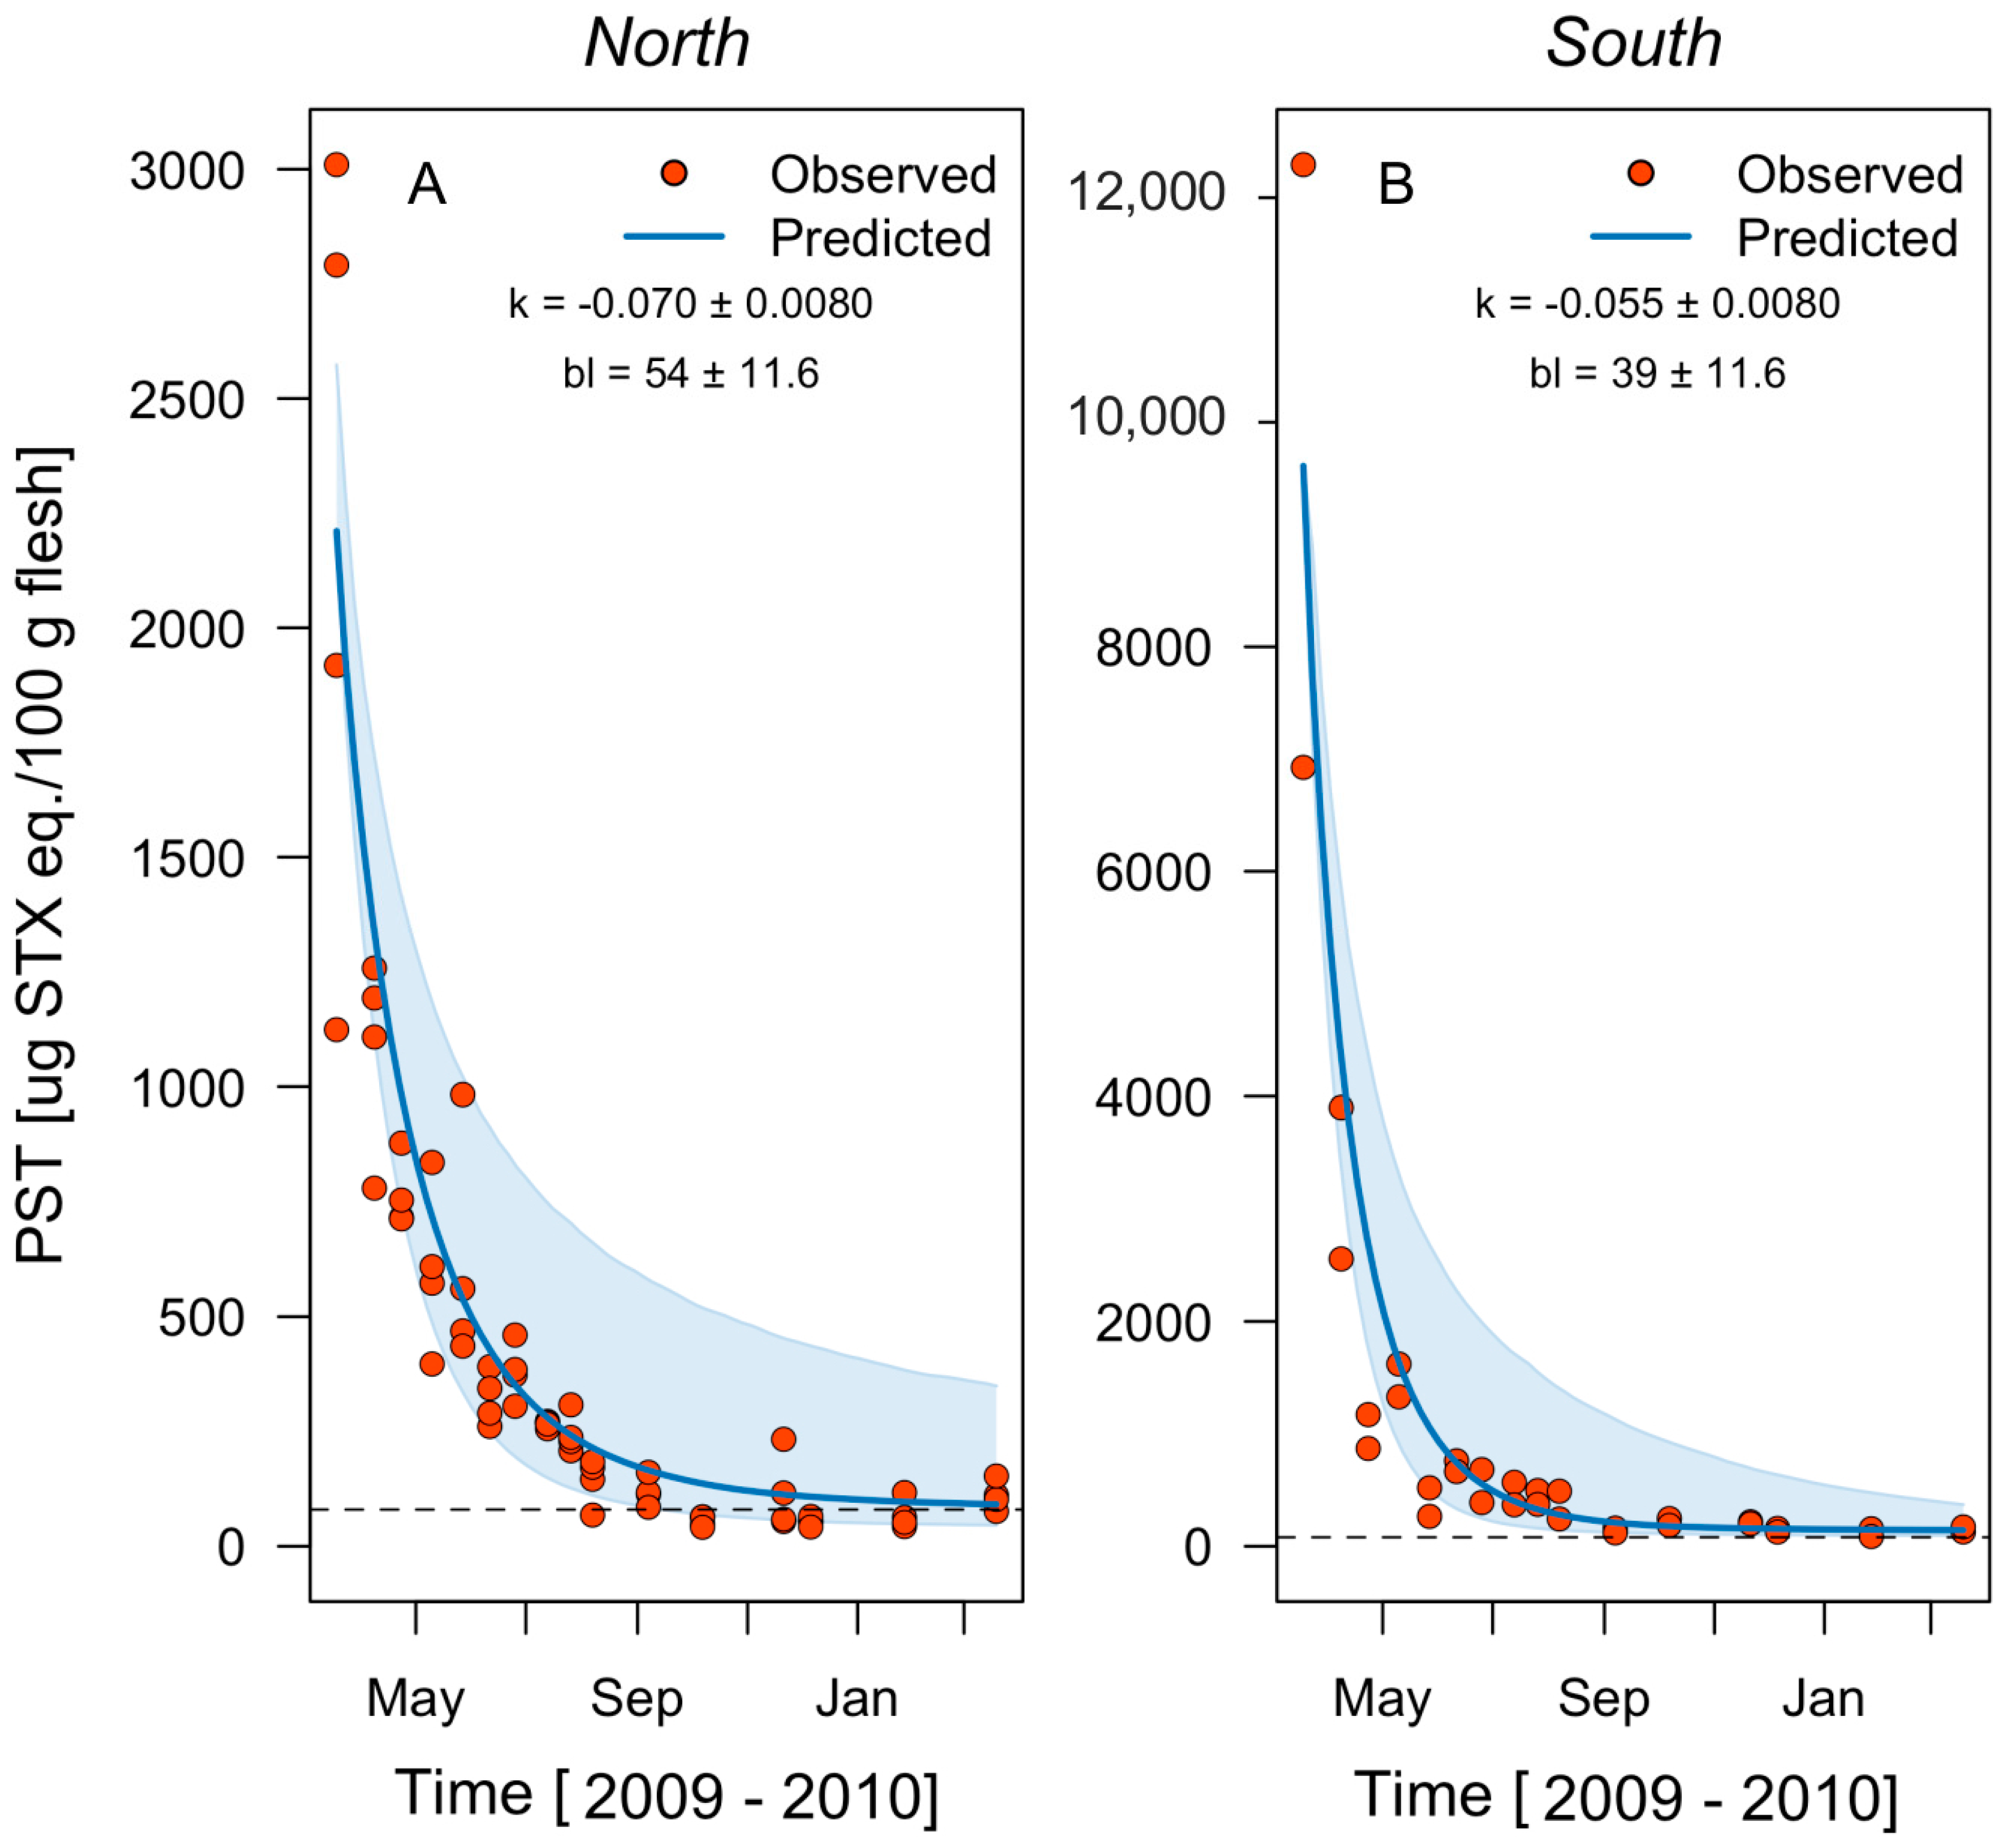
2.1. Regional Scale
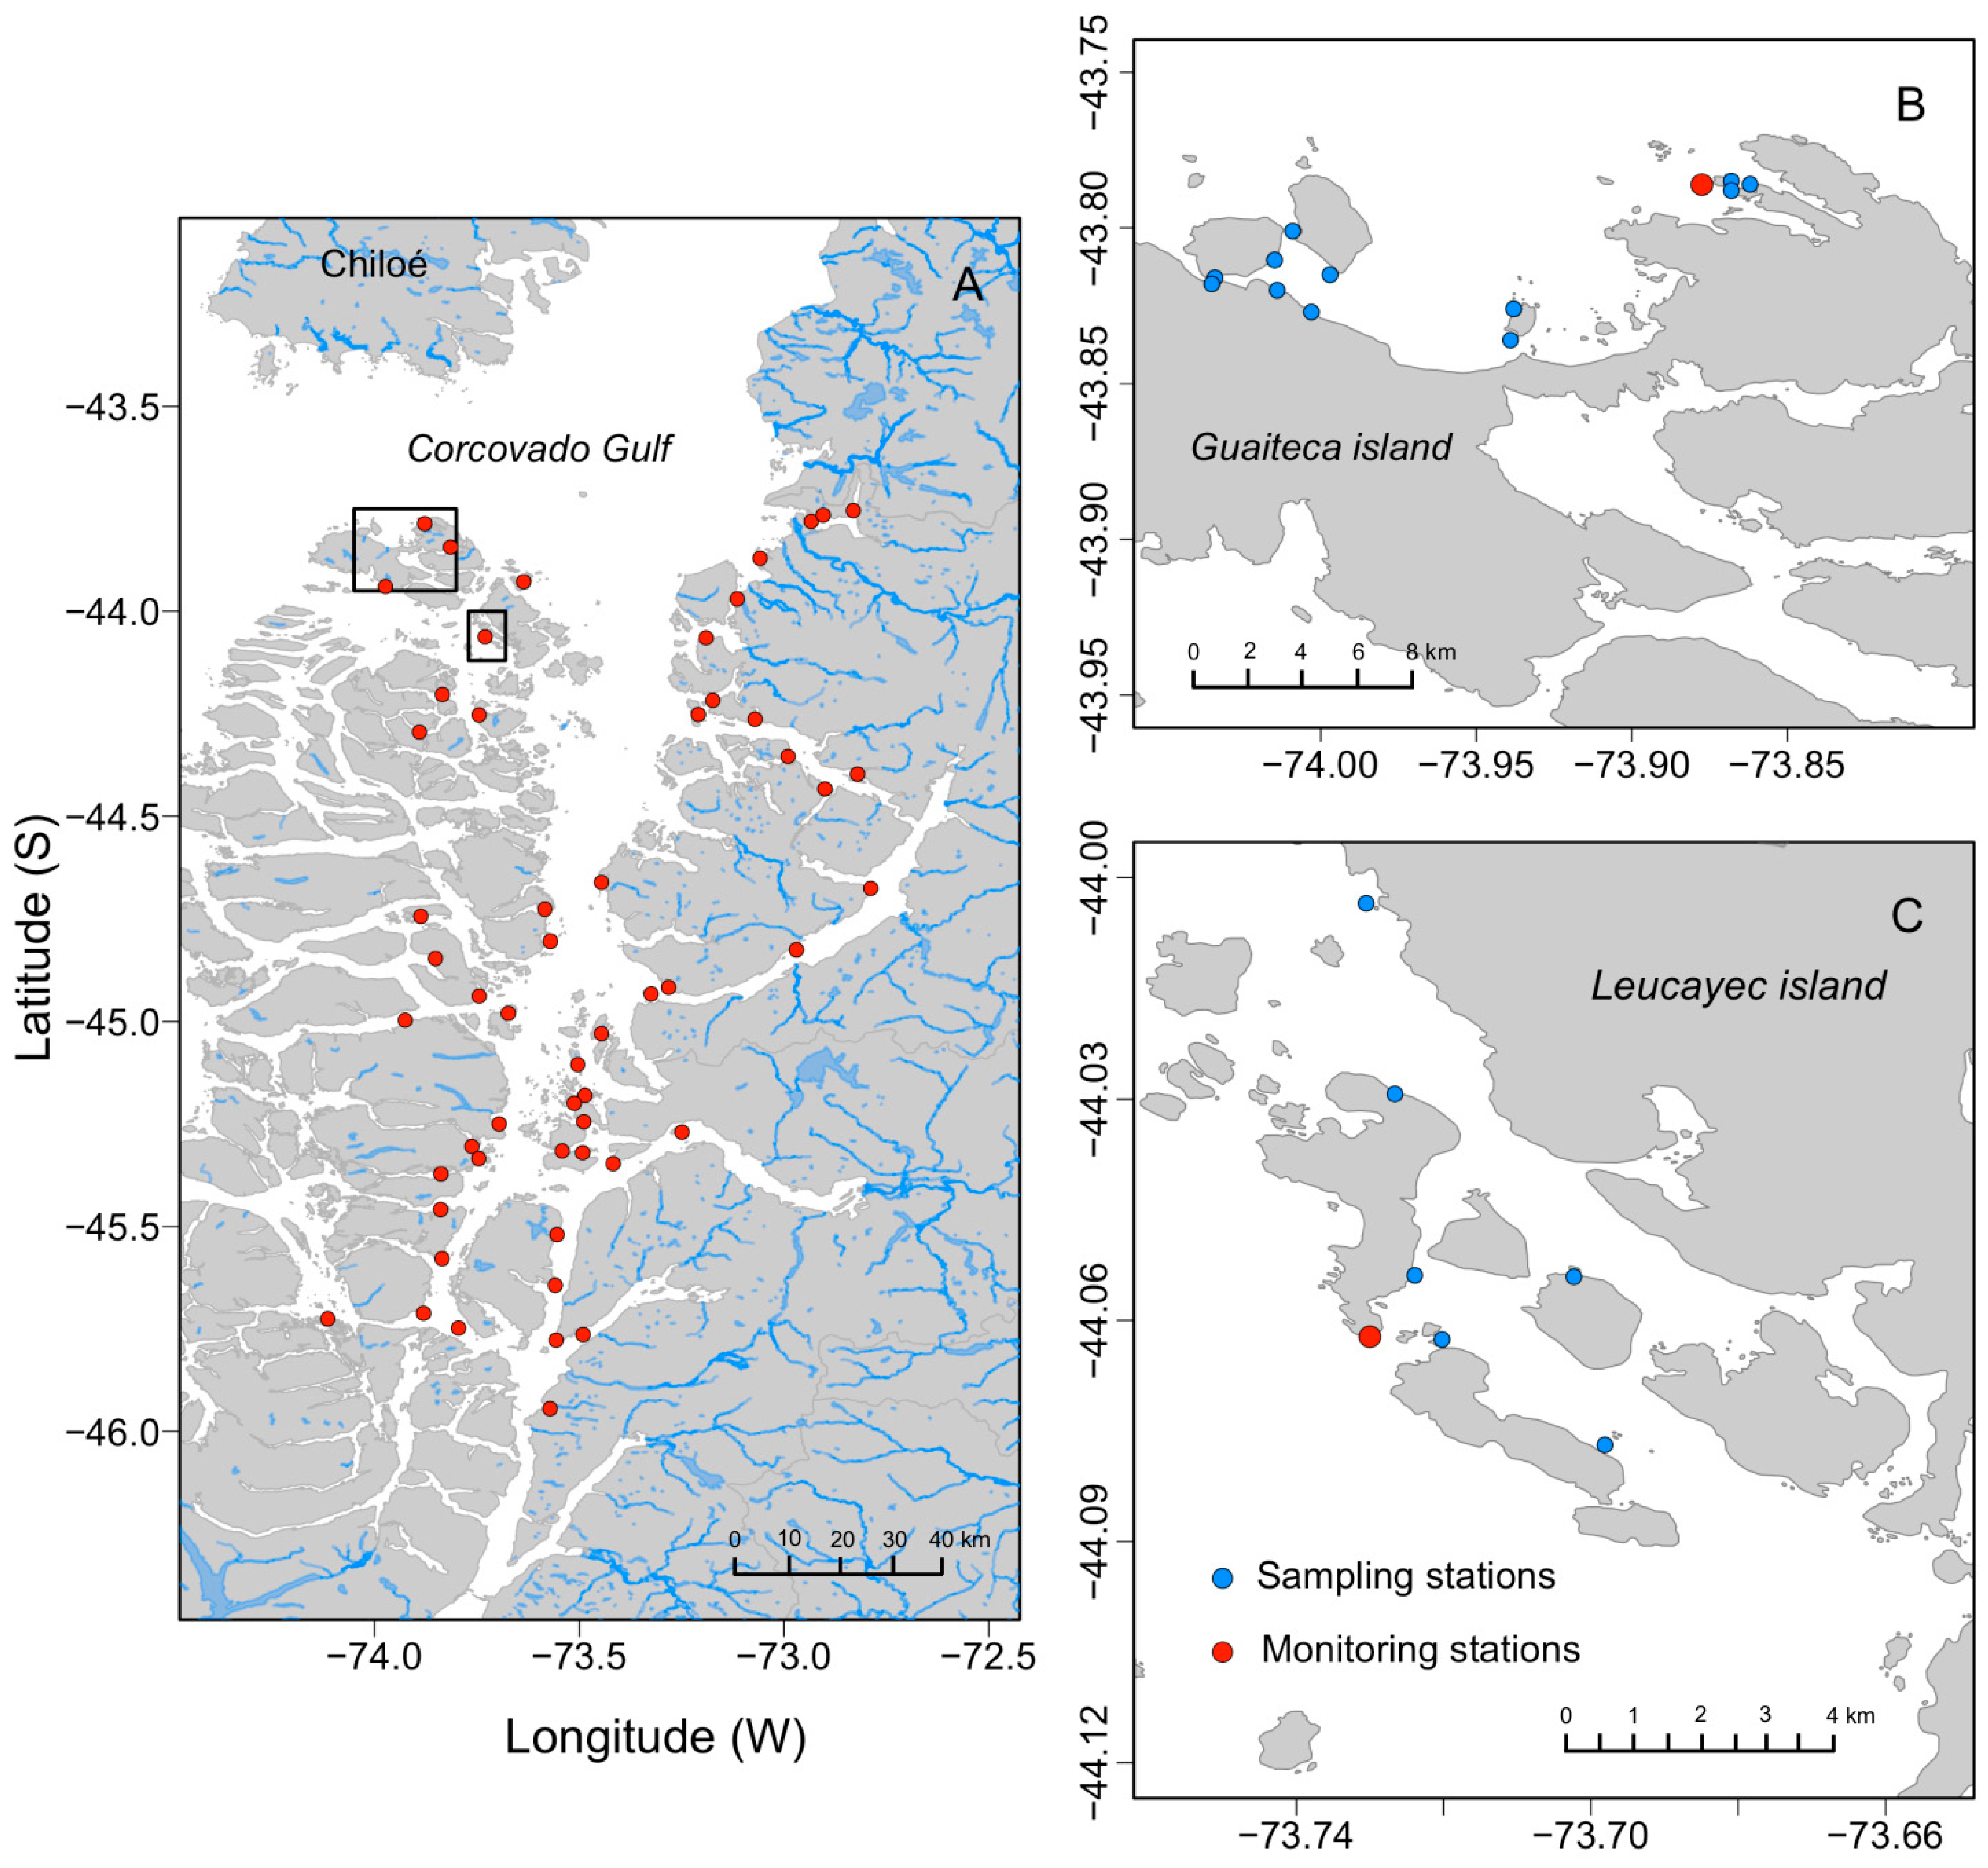
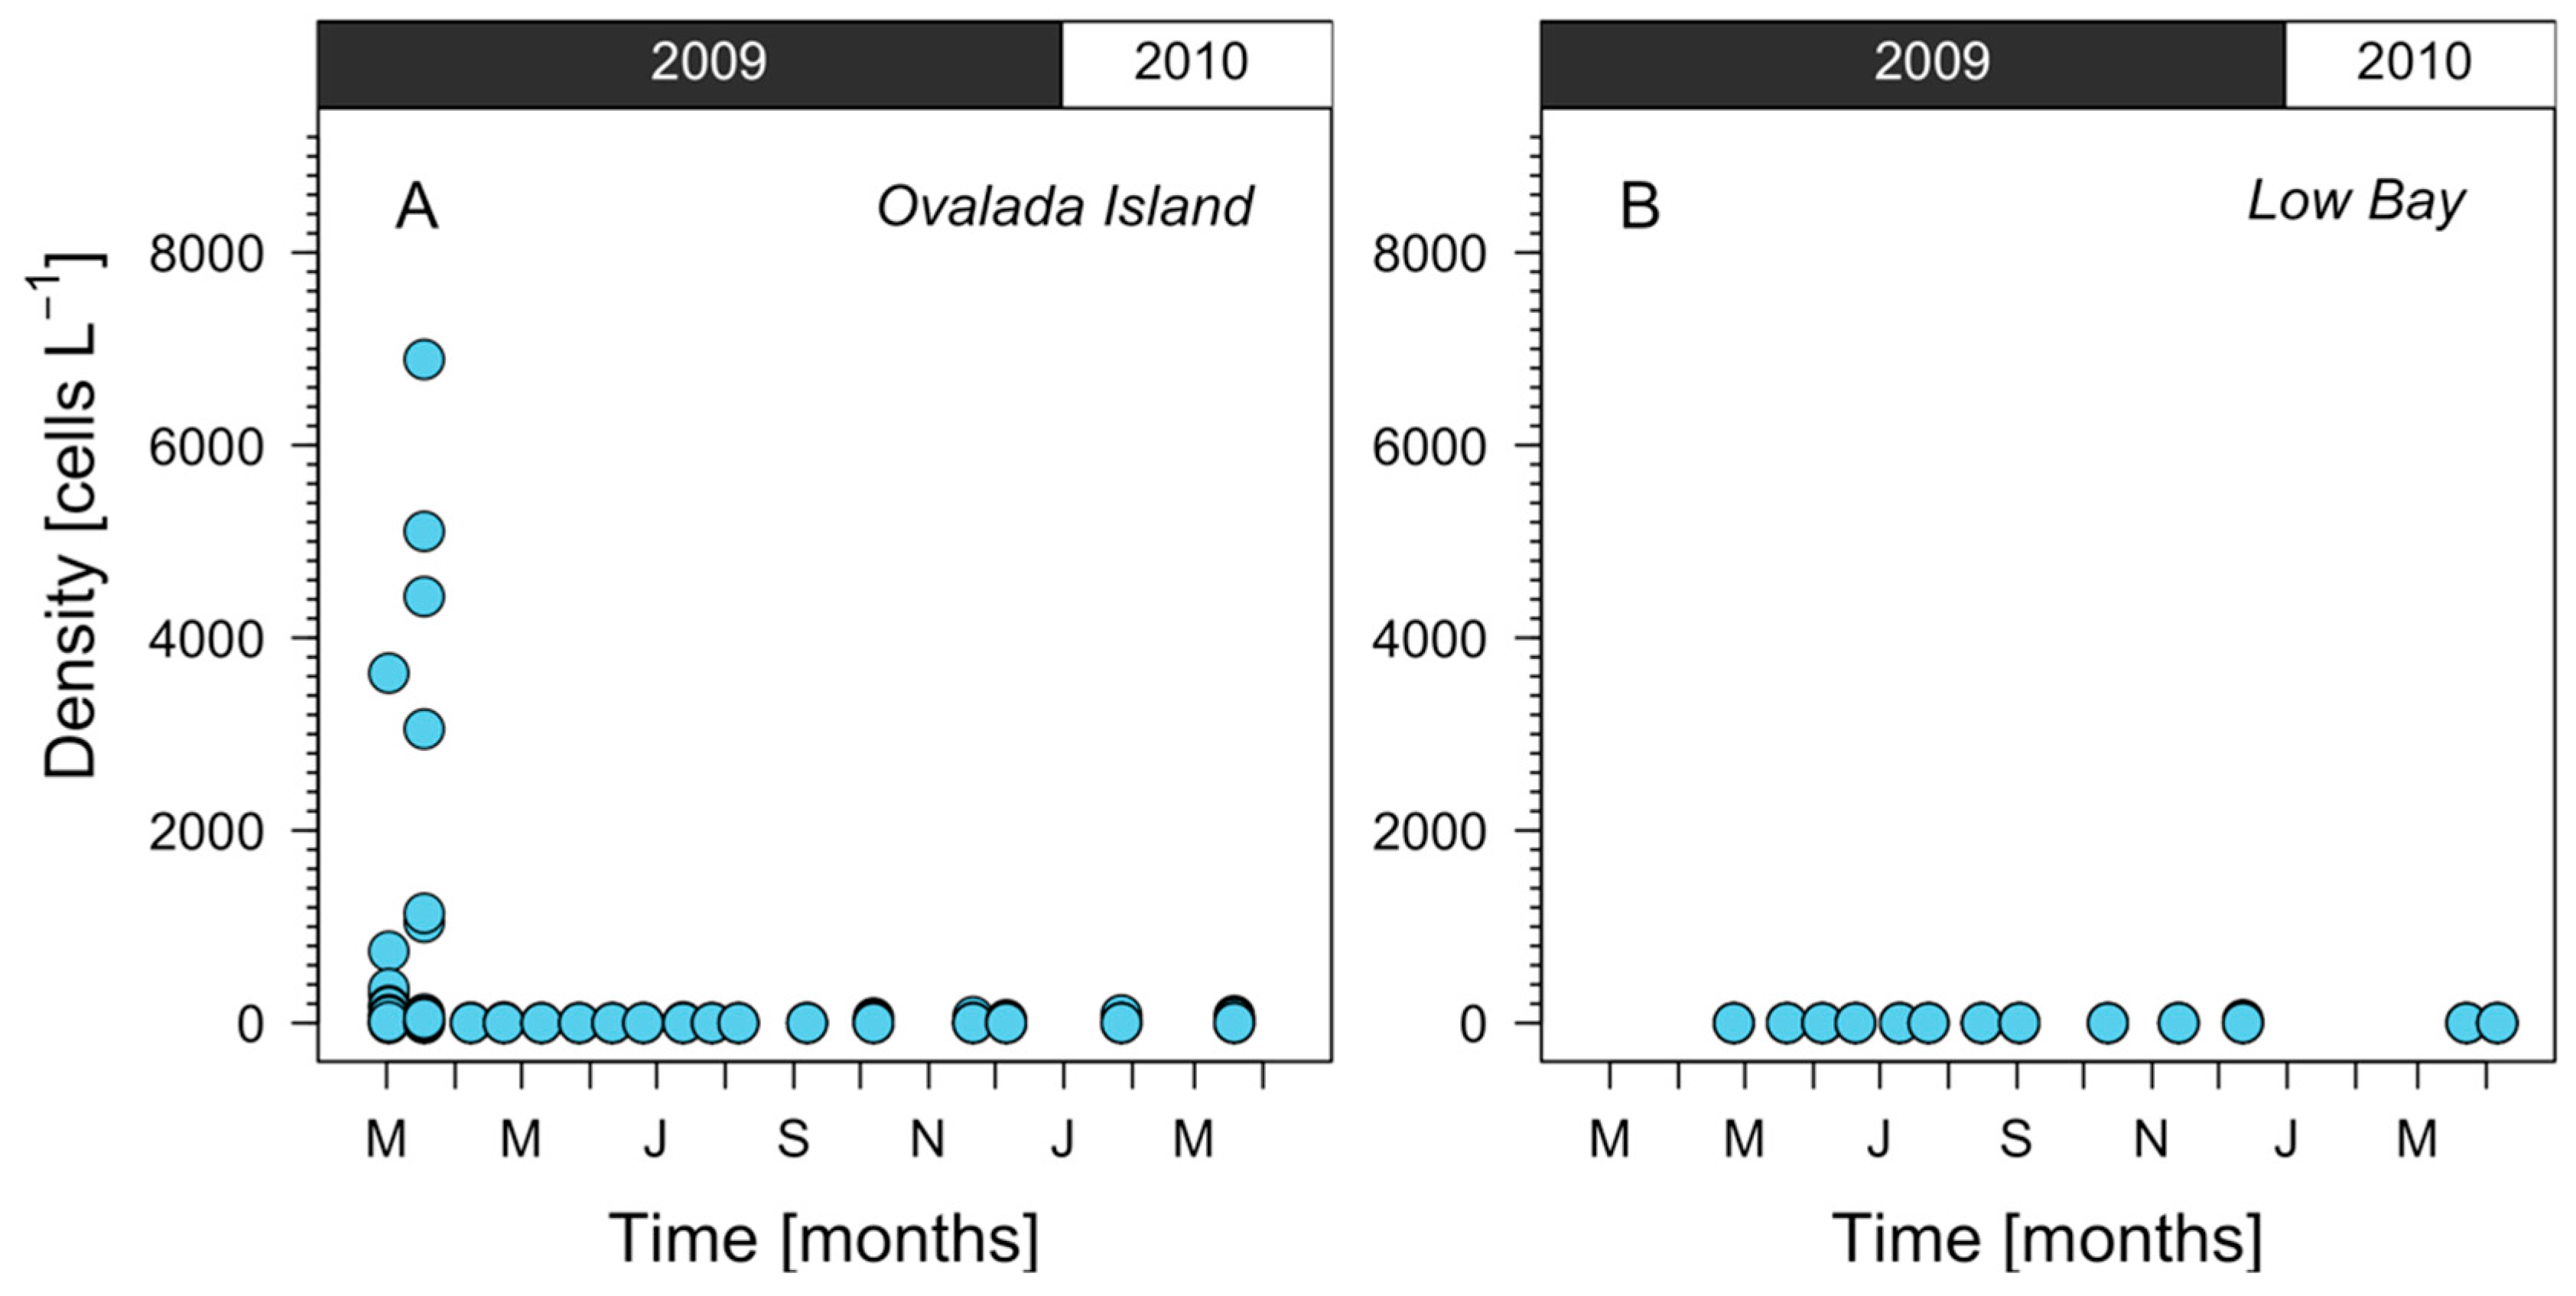
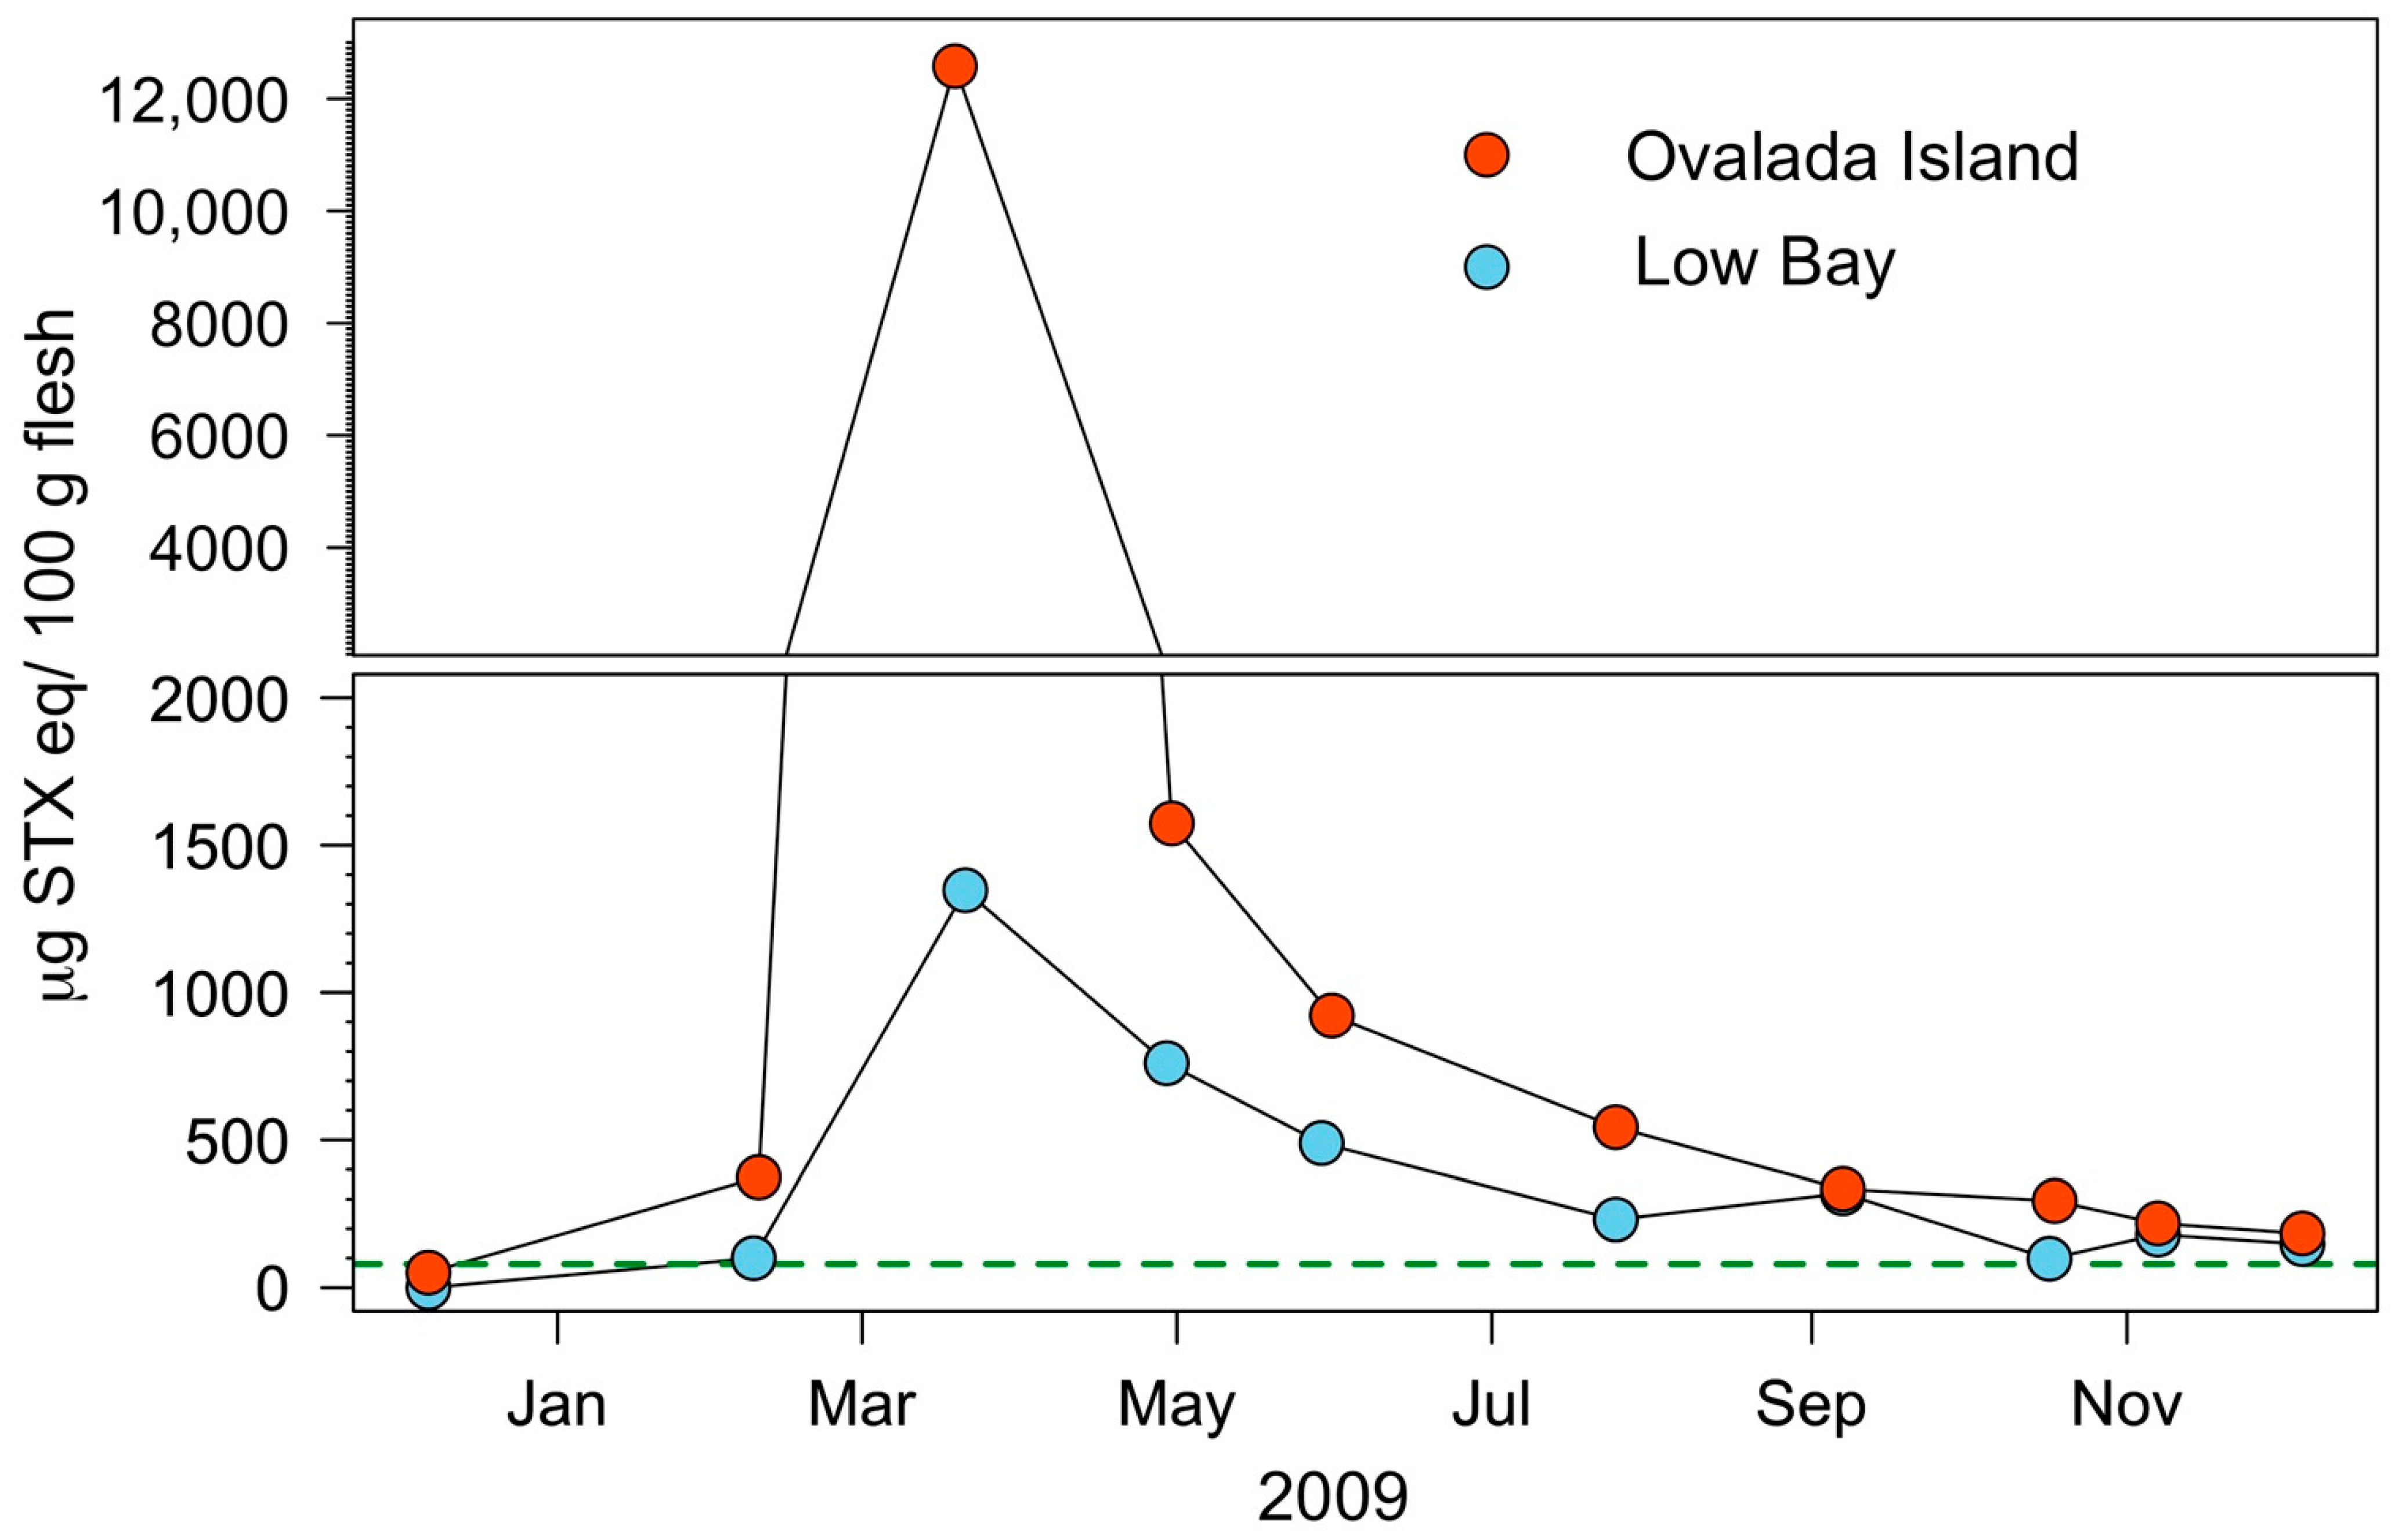
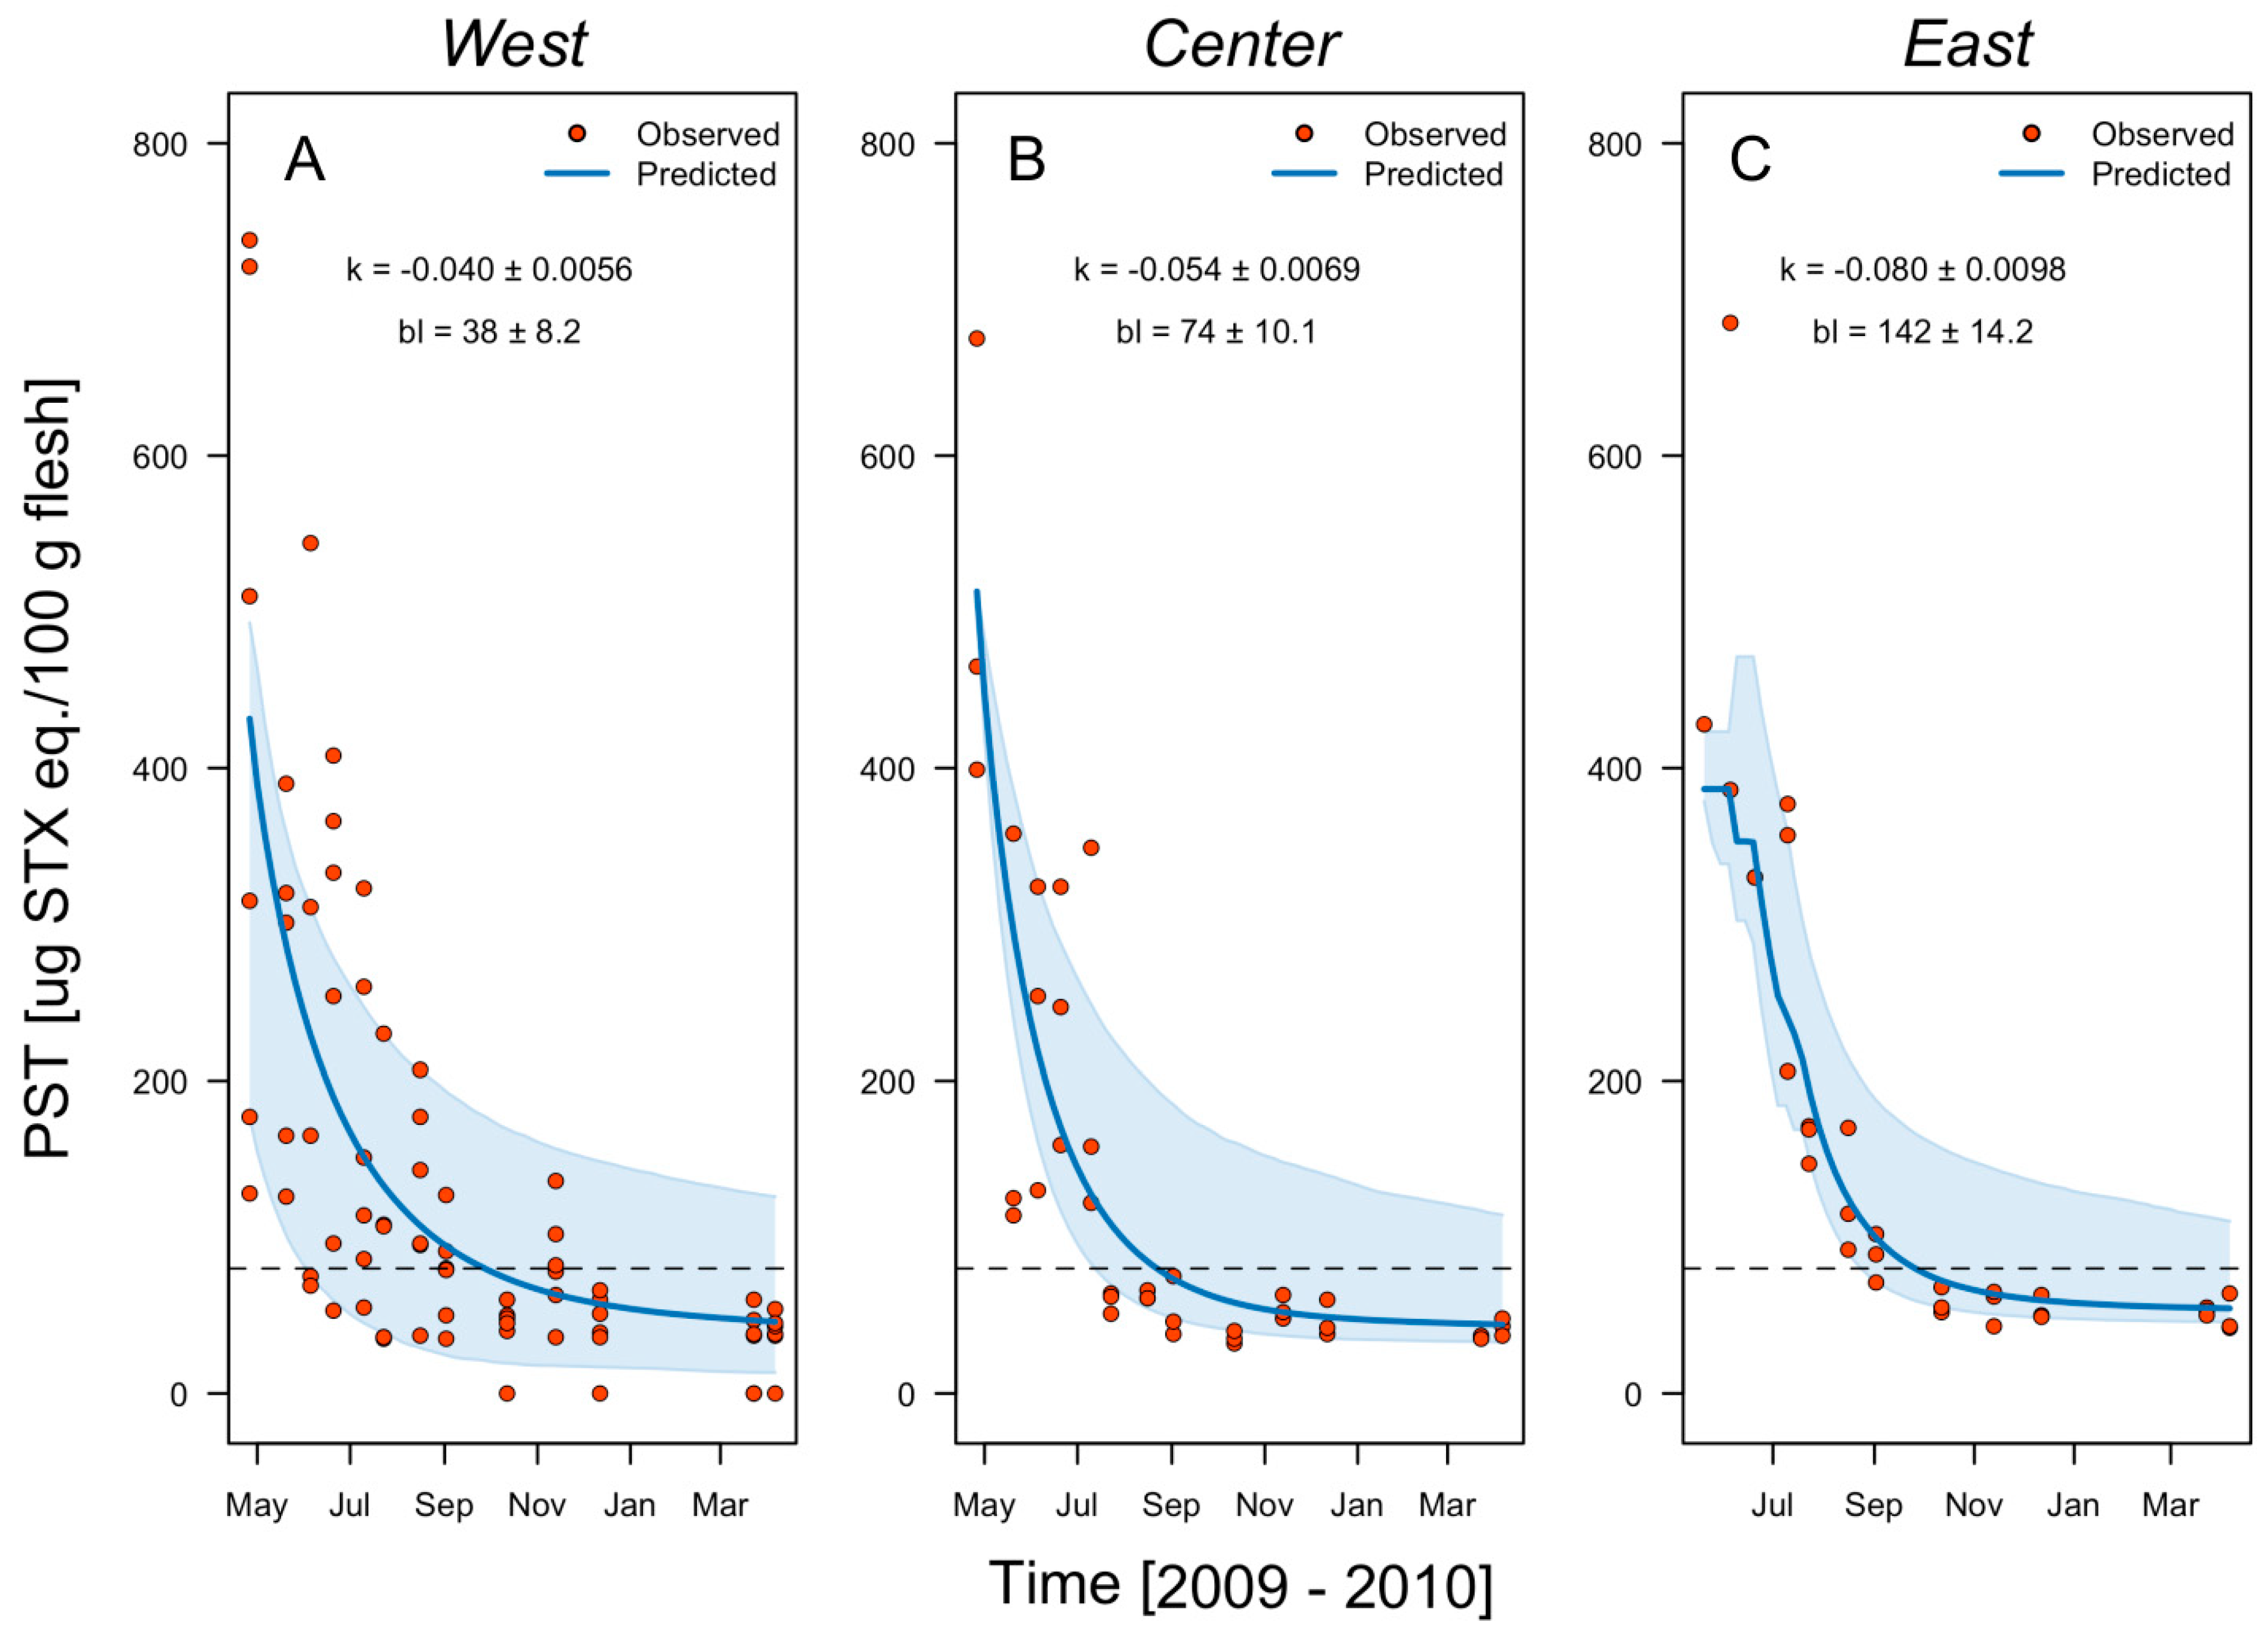
2.2. Harvesting Areas Scale
3. Discussion
4. Conclusions
5. Materials and Methods
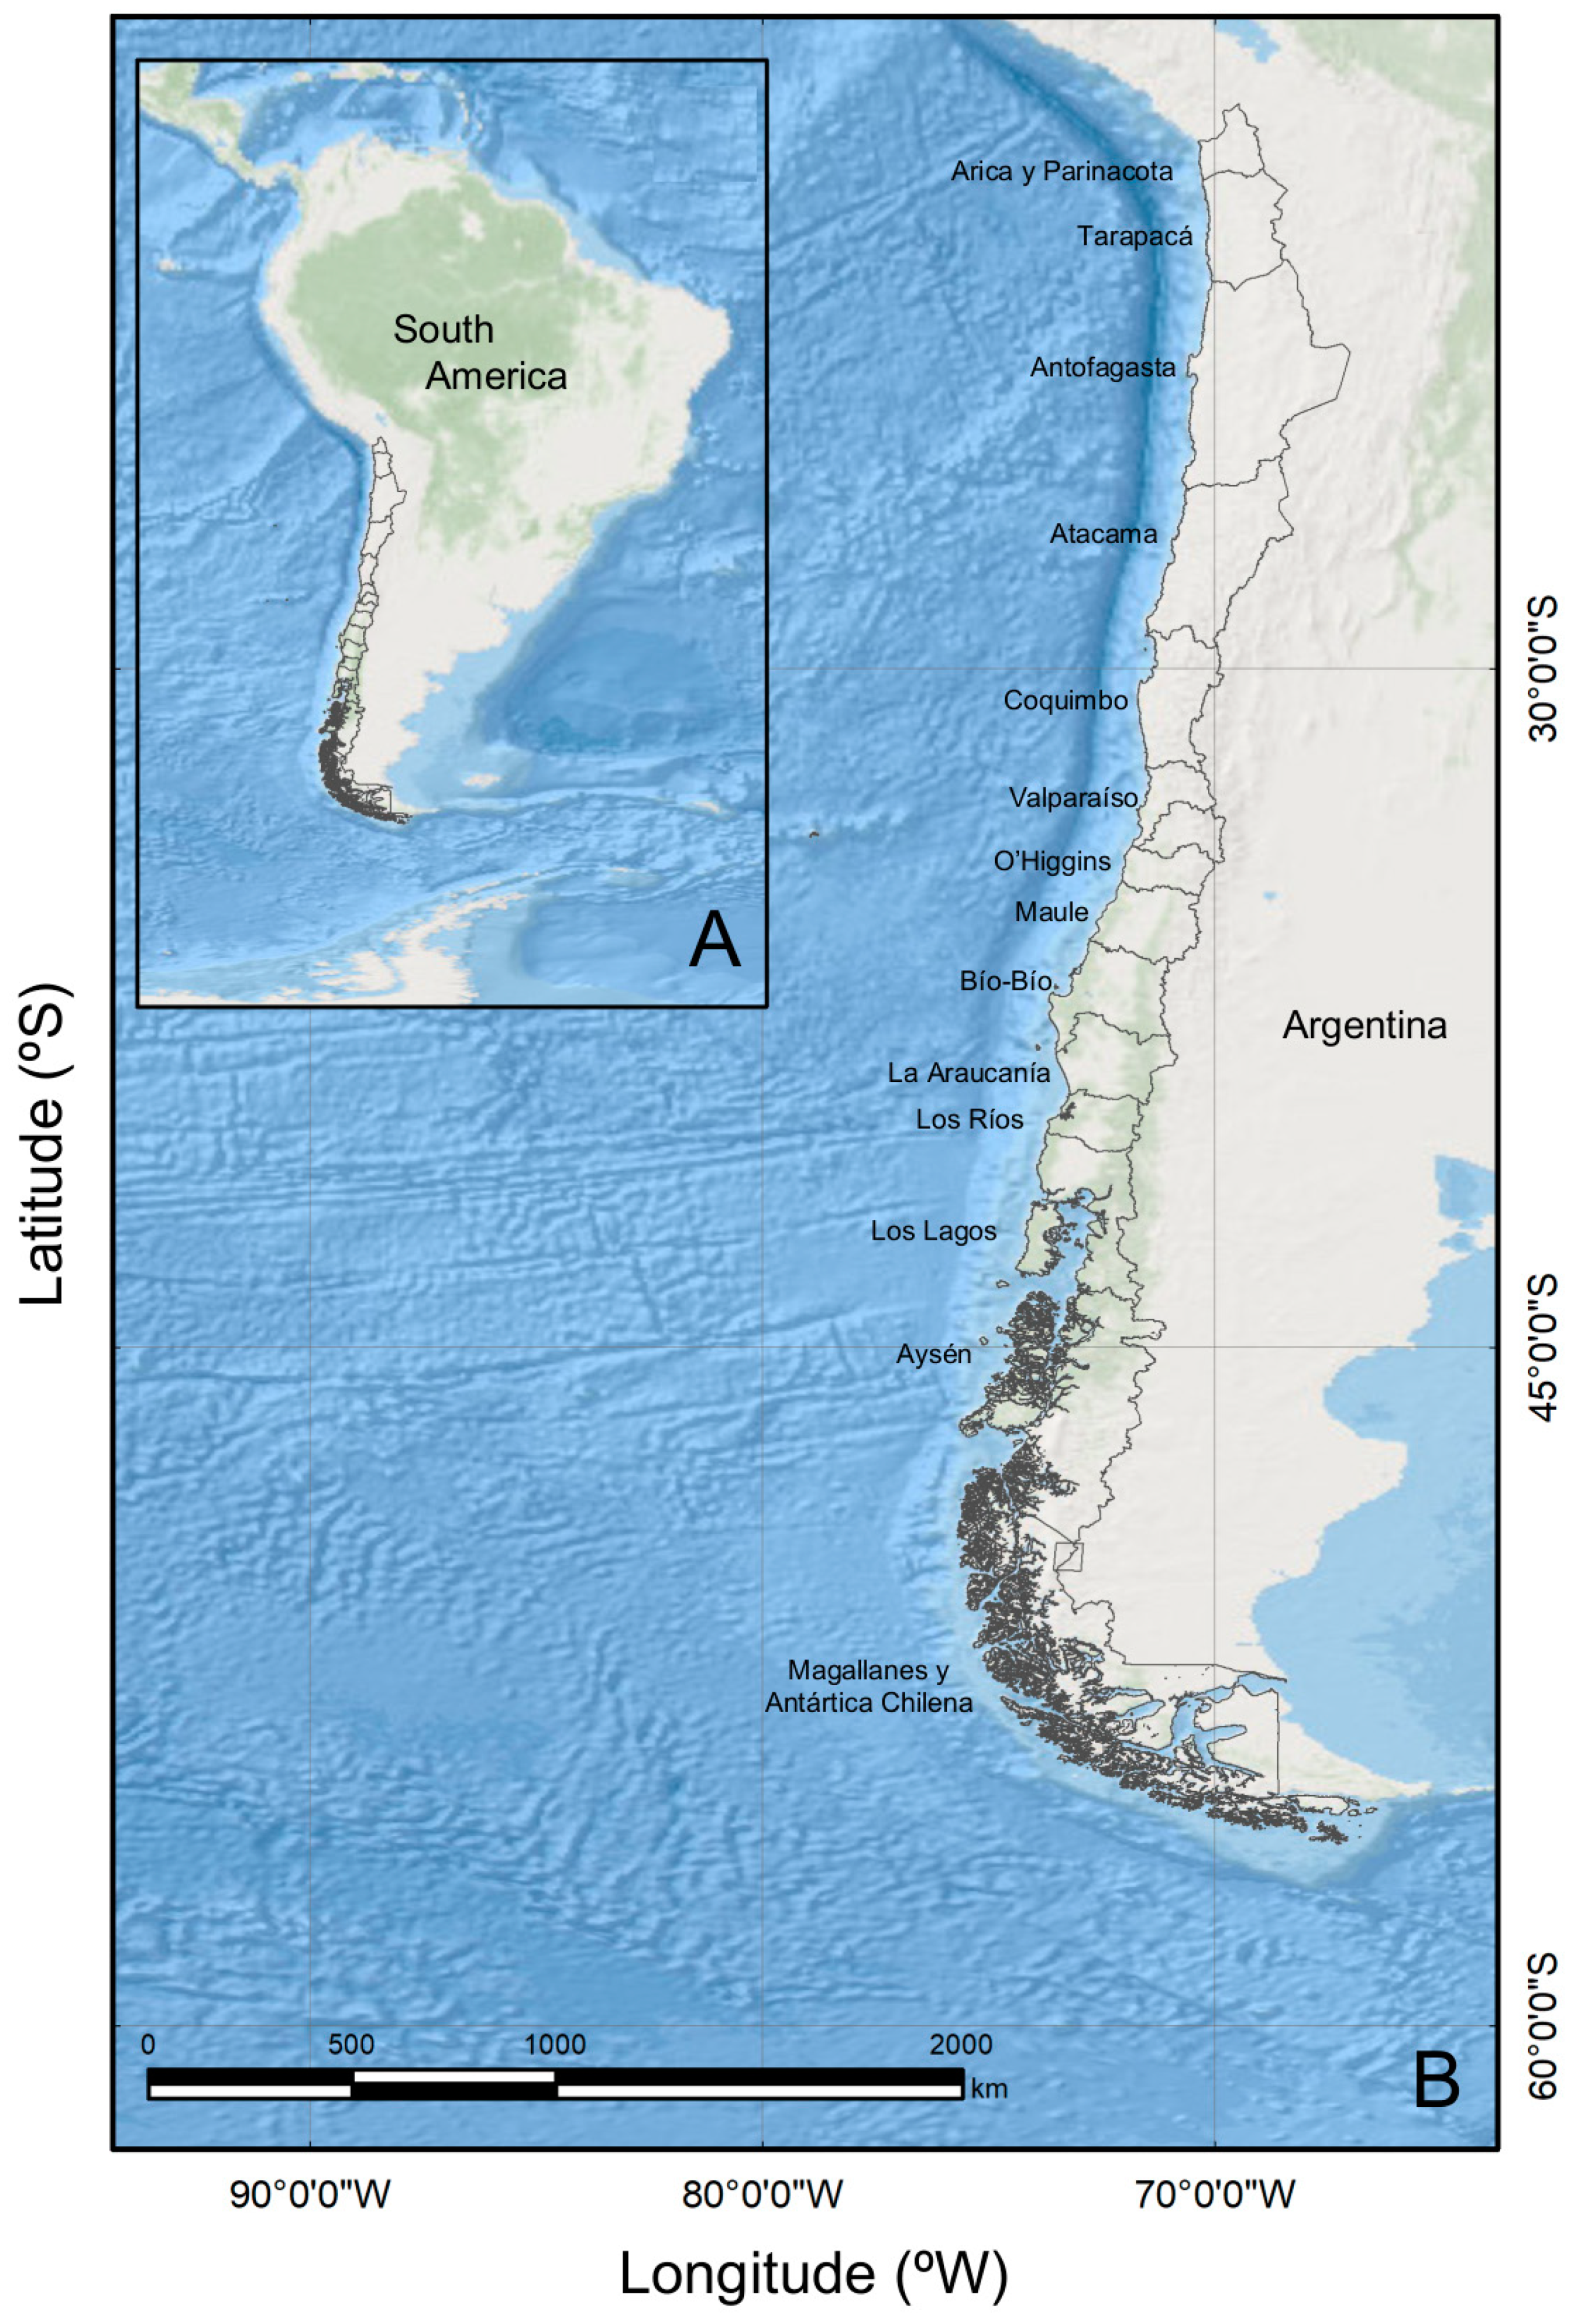
5.1. Study Area
5.2. Field Sampling
5.2.1. Regional Scale
5.2.2. Fishing Grounds Scale
5.3. Modeling of Field Detoxification Rates
Author Contributions
Funding
Institutional Review Board Statement
Informed Consent Statement
Data Availability Statement
Acknowledgments
Conflicts of Interest
Appendix A

References
- Anderson, D.M.; Alpermann, T.J.; Cembella, A.; Collos, Y.; Masseret, E.; Montresor, M. The globally distributed genus Alexandrium: Multifaceted roles in marine ecosystems and impacts on human health. Harmful Algae 2012, 14, 10–35. [Google Scholar] [CrossRef] [PubMed]
- Díaz, P.A.; Álvarez, A.; Varela, D.; Pérez-Santos, I.; Díaz, M.; Molinet, C.; Seguel, M.; Aguilera-Belmonte, A.; Guzmán, L.; Uribe, E.; et al. Impacts of harmful algal blooms on the aquaculture industry: Chile as a case study. Perspect. Phycol. 2019, 6, 39–50. [Google Scholar] [CrossRef]
- Díaz, P.A.; Álvarez, G.; Pizarro, G.; Blanco, J.; Reguera, B. Lipophilic toxins in Chile: History, producers and impacts. Mar. Drugs 2022, 20, 122. [Google Scholar] [CrossRef] [PubMed]
- Fraga, S.; Sampedro, N.; Larsen, J.; Moestrup, Ø.; Calado, A.J. Arguments against the proposal 2302 by John et al. to reject the name Gonyaulax catenella (Alexandrium catenella). Taxon 2015, 64, 634–635. [Google Scholar] [CrossRef]
- Molinet, C.; Lafón, A.; Lembeye, G.; Moreno, C.A. Patrones de distribución espacial y temporal de floraciones de Alexandrium catenella (Whedon & Kofoid) Balech 1985, en aguas interiores de la Patagonia noroccidental de Chile. Rev. Chil. Hist. Nat. 2003, 76, 681–698. [Google Scholar]
- Guzmán, L.; Pacheco, H.; Pizarro, G.; Alárcon, C. Alexandrium catenella y veneno paralizante de los mariscos en Chile. In Floraciones Algales Nocivas en el Cono Sur Americano; Sar, E.A., Ferrario, M.E., Reguera, B., Eds.; Instituto Español de Oceanografía: Madrid, Spain, 2002; Volume 11, pp. 235–255. [Google Scholar]
- Schantz, E.J. Chemistry and biology of saxitoxin and related toxins. Ann. N. Y. Acad. Sci. 1986, 479, 15–23. [Google Scholar] [CrossRef]
- Bricelj, V.M.; Shumway, S. Paralytic shellfish toxins in bivalve molluscs: Occurrence, transfer kinetics, and biotransformation. Rev. Fish. Sci. 1998, 6, 315–383. [Google Scholar] [CrossRef]
- Álvarez, G.; Díaz, P.A.; Godoy, M.; Araya, M.; Ganuza, I.; Pino, R.; Álvarez, F.; Rengel, J.; Hernández, C.; Uribe, E.; et al. Paralytic Shellfish Toxins in Mesodesma donacium during an exceptional bloom of Alexandrium catenella associated to an intense mass mortality. Toxins 2019, 11, 188. [Google Scholar] [CrossRef]
- Fernández, M.L.; Shumway, S.E.; Blanco, J. Management of shellfish resources. In Manual on Harmful Marine Microalgae; Hallegraeff, G.M., Cembella, A., Anderson, D.M., Eds.; UNESCO Publishing: Paris, France, 2003; pp. 657–692. [Google Scholar]
- Hernández, C.; Díaz, P.A.; Molinet, C.; Seguel, M. Exceptional climate anomalies and northwards expansion of Paralytic Shellfish Poisoning outbreaks in Southern Chile. Harmful Algae News 2016, 54, 1–2. [Google Scholar]
- Díaz, P.A.; Molinet, C.; Seguel, M.; Díaz, M.; Labra, G.; Figueroa, R. Coupling planktonic and benthic shifts during a bloom of Alexandrium catenella in southern Chile: Implications for bloom dynamics and recurrence. Harmful Algae 2014, 40, 9–22. [Google Scholar] [CrossRef]
- Mardones, J.I.; Clément, A.; Rojas, X.; Aparicio, C. Alexandrium catenella during 2009 in Chilean waters, and recent expansion to coastal ocean. Harmful Algae News 2010, 41, 8–9. [Google Scholar]
- Díaz, P.A.; Molinet, C.; Seguel, M.; Díaz, M.; Labra, G.; Figueroa, R.I. Species diversity and abundance of dinoflagellate resting cysts seven months after a bloom of Alexandrium catenella in two contrasting coastal systems of the Chilean Inland Sea. Eur. J. Phycol. 2018, 53, 410–421. [Google Scholar] [CrossRef]
- Rodríguez-Villegas, C.; Díaz, P.A.; Pizarro, G.; Salgado, P.; Pérez-Santos, I.; Díaz, M.; Seguel, M.; Baldrich, A.; Bravo, I.; Iriarte, L.; et al. Alexandrium catenella cyst accumulation by passive and active dispersal agents: Implications for the potential spreading risk in Chilean Patagonian fjords. Harmful Algae 2020, 96, 101832. [Google Scholar] [CrossRef] [PubMed]
- Paredes-Mella, J.; Mardones, J.I.; Norambuena, L.; Fuenzalida, G.; Labra, G.; Espinoza-González, O.; Guzmán, L. Toxic Alexandrium catenella expanding northward along the Chilean coast: New risk of paralytic shell sh poisoning off the Bío-Bío region (36° S). Mar. Pollut. Bull. 2021, 172, 112783. [Google Scholar] [CrossRef]
- Davidson, K.; Andersen, D.M.; Mateus, M.; Reguera, B.; Silke, J.; Sourisseau, M.; Maguire, J. Forecasting the risk of harmful algal blooms. Harmful Algae 2016, 53, 1–7. [Google Scholar] [CrossRef]
- Ruiz-Villarreal, M.; García-García, L.; Cobas, M.; Díaz, P.A.; Reguera, B. Modelling the hydrodynamic conditions associated with Dinophysis blooms in Galicia (NW Spain). Harmful Algae 2016, 53, 40–52. [Google Scholar] [CrossRef]
- Molinet, C.; Niklitschek, E.; Seguel, M.; Díaz, P. Trends of natural accumulation and detoxifcation of paralytic shellfsh poison in two bivalves from the Northwest Patagonian inland sea. Rev. Biol. Mar. Oceanogr. 2010, 45, 195–204. [Google Scholar]
- GEOHAB. Global Ecology and Oceanography of Harmful Algal Blooms, Science Plan; Glibert, P., Pitcher, G., Eds.; SCOR: Baltimore, MD, USA; IOC: Paris, France, 2001. [Google Scholar]
- Kudela, R.M.; Berdalet, E.; Enevoldsen, H.; Pitcher, G.; Raine, R.; Urban, E. GEOHAB–The Global Ecology and Oceanography of Harmful Algal Blooms Program: Motivation, goals, and legacy. Oceanography 2017, 30, 12–21. [Google Scholar] [CrossRef]
- Finnis, S.; Krstic, N.; McIntyre, L.; Nelson, T.A.; Henderson, S.B. Spatiotemporal patterns of paralytic shellfish toxins and their relationships with environmental variables in British Columbia, Canada from 2002 to 2012. Environ. Res. 2017, 156, 190–200. [Google Scholar] [CrossRef]
- Oshima, Y.; Yasumoto, T.; Kodama, M.; Ogata, T.; Fukuyo, Y.; Matsuura, F. Features of paralytic shellfish poison occurring in Tohoku District. Nippon Suisan Gakkaishi 1982, 48, 525–530. [Google Scholar] [CrossRef]
- Suzuki, T.; Yamasaki, M.; Ota, H. Comparison of paralytic shellfish toxin profiles between the scallop Patinopecten yessoensis and the mussel Mytilus galloprovincialis. Fish. Sci. 1998, 64, 850–851. [Google Scholar] [CrossRef]
- Olsson, P.; Edler, L. Dinoflagellate distribution in the Southeastern Kattegat during an autumm bloom. Sarsia 1990, 76, 23–28. [Google Scholar] [CrossRef]
- Incze, L.W.; Yentsch, C.M. Stable density fronts and dinoflagellate patches in a tidal estuary. Estuar. Coast. Shelf. Sci. 1981, 13, 547–556. [Google Scholar] [CrossRef]
- Anderson, D.M.; Aubrey, G.; Tyler, M.A.; Coats, D.W. Vertical and horizontal distributions of dinoflagellate cysts in sediments. Limnol. Oceanogr. 1982, 27, 757–765. [Google Scholar] [CrossRef]
- Schrey, S.E.; Carpenter, E.J.; Anderson, D.M. The abundance and distribution of the toxic dinoflagellate, Gonyaulax tamarensis, in Long Island estuaries. Estuaries 1984, 7, 472. [Google Scholar] [CrossRef]
- McIntyre, J.G.; Cullen, J.J.; Cembella, A.D. Vertical migration, nutrition and toxicity in the dinoflagellate Alexandrium tamarense. Mar. Ecol. Prog. Ser. 1997, 148, 201–216. [Google Scholar] [CrossRef]
- Anderson, D.M.; Couture, D.A.; Kleindinst, J.L.; Keafer, B.A.; McGuillicuddy, D.J.J.; Martin, J.L.; Richlen, M.L.; Hickey, J.M.; Solow, A.R. Understanding interannual, decadal level variability in paralytic shellfish poisoning toxicity in the Gulf of Maine: The HAB Index. Deep. Sea Res. Part II Top. Stud. Oceanogr. 2014, 103, 264–276. [Google Scholar] [CrossRef]
- Kaga, S.; Sato, S.; Kaga, Y.; Naiki, K.; Watanabe, S.; Yamada, Y.; Ogata, T. Prediction of on-site depuration of paralytic shellfish poisoning toxins accumulated in the scallop Patinopecten yessoensis of Ofunato Bay, Japan. Fish. Sci. 2015, 81, 635–642. [Google Scholar] [CrossRef]
- Yamamoto, T.; Flynn, K.J.; Takayama, H. Application of a two-compartment one-toxin model to predict the toxin accumulation in Pacific oysters in Hiroshima Bay, Japan. Fish. Sci. 2003, 69, 944–950. [Google Scholar] [CrossRef]
- Blanco, J.; Moroño, A.; Franco, J.; Reyero, M.I. PSP detoxification kinetics in the mussel Mytilus galloprovincialis. One- and two- comportment models and the effect of some environmental variables. Mar. Ecol. Prog. Ser. 1997, 158, 165–175. [Google Scholar] [CrossRef]
- Seguel, M.; Molinet, C.; Díaz, P.; Díaz, M.; Niklitschek, E.; Varela, D.; Sfeir, A.; Gangas, M. Spatial and temporal dynamic of PSP in natural beds of Venus antiqua in Southern Chile. In Proceedings of the 14th Internacional Conference on Harmful Algae, Hersonissos, Greece, 1–5 November 2010. [Google Scholar]
- Mardones, J.I.; Bolch, C.; Guzmán, L.; Paredes, J.; Varela, D.; Hallegraeff, G.M. Role of resting cysts in Chilean Alexandrium catenella dinoflagellate blooms revisited. Harmful Algae 2016, 55, 238–249. [Google Scholar] [CrossRef] [PubMed]
- Pantoja, S.; Iriarte, J.L.; Daneri, G. Oceanography of the Chilean Patagonia. Cont. Shelf. Res. 2011, 31, 149–153. [Google Scholar] [CrossRef]
- Dávila, P.; Figueroa, D.; Muller, E. Freshwater input into the coastal ocean and its relation with the salinity distribution of austral Chile (35–55° S). Cont. Shelf. Res. 2002, 22, 521–534. [Google Scholar] [CrossRef]
- Calvete, C.; Sobarzo, M. Quantification of the surface brackish water layer and frontal zones in southern Chilean fjords between Boca del Guafo (43°30′ S) and Estero Elefantes (46°30′ S). Cont. Shelf. Res. 2011, 31, 162–171. [Google Scholar] [CrossRef]
- Schneider, W.; Pérez-Santos, I.; Ross, L.; Bravo, L.; Seguel, R.; Hernández, F. On the hydrography of Puyuhuapi Channel, Chilean Patagonia. Prog. Oceanogr. 2014, 128, 8–18. [Google Scholar] [CrossRef]
- Daneri, G.; Montero, P.; Lizárraga, L.; Torres, R.; Iriarte, J.L.; Jacob, B.; González, H.E.; Tapia, F. Primary productivity and heterotrophic activity in an enclosed marine area of central Patagonia (Puyuhuapi channel; 44S, 73W). Biogeosci. Discuss. 2012, 9, 5929–5968. [Google Scholar]
- Montero, P.; Daneri, G.; Tapia, F.; Iriarte, J.L.; Crawford, D. Diatom blooms and primary production in a channel ecosystem of central Patagonia. Lat. Am. J. Aquat. Res. 2017, 45, 999–1016. [Google Scholar] [CrossRef]
- Castillo, M.; Valenzuela, C. Régimen de circulación en canales y fiordos australes. In Avances en el Conocimiento Oceanográfico de las Aguas Interiores Chilenas, Puerto Montt a Cabo de Hornos; Silva, N., Palma, S., Eds.; Comité Oceanográfico Nacional—Pontificia Universidad Católica de Valparaíso: Valparaíso, Chile, 2006; pp. 59–62. [Google Scholar]
- Valle-Levinson, A.; Blanco, J. Observations of wind influence on exchange flows in a strait of the Chilean inland sea. J. Mar. Res. 2004, 62, 721–741. [Google Scholar] [CrossRef]
- Valle-Levison, A.; Jara, F.; Molinet, C.; Soto, D. Observations of intratidal variability of flows over a sill/contraction combination in a Chilean fjord. J. Geophys. Res. 2001, 106, 7051–7064. [Google Scholar] [CrossRef]
- Saldías, G.S.; Sobarzo, M.; Quiñones, R. Freshwater structure and its seasonal variability off western Patagonia. Prog. Oceanogr. 2018, 174, 143–153. [Google Scholar] [CrossRef]
- Aguirre, C.; Pizarro, Ó.; Strub, P.T.; Garreaud, R.; Barth, J.A. Seasonal dynamics of the near-surface alongshore flow off central Chile. J. Geophys. Res. Oceans 2012, 117, C01006. [Google Scholar] [CrossRef]
- Ross, L.; Valle-Levinson, A.; Pérez-Santos, I.; Tapia, F.J.; Schneider, W. Baroclinic annular variability of internal motions in a Patagonian fjord. J. Geophys. Res. Oceans 2015, 120, 5668–5685. [Google Scholar] [CrossRef]
- Anonymous. AOAC Official Method 959.08. Paralytic shellfish poison. Biological method. Final action. In AOAC Official Methods for Analysis; Truckses, M.W., Ed.; AOAC International: Gaithersburg, MD, USA, 2008; pp. 79–80. [Google Scholar]
- Lovegrove, T. An improved form of sedimentation apparatus for use with an inverted microscope. J. Cons. Int. Explor. Mer. 1960, 25, 279–284. [Google Scholar] [CrossRef]
- Utermöhl, H. Zur Vervollkomnung der quantitativen phytoplankton-Methodik. Mitt. Int. Ver. Limnol. 1958, 9, 1–38. [Google Scholar]
- Parsons, T.R.; Maita, Y.; Lalli, C.M. A Manual of Chemical and Biological Methods for Seawater Analysis; Pergamon Press: Oxford, UK, 1984; 173p. [Google Scholar]
- Franco, J.M.; Fernández-Vila, P. Separation of paralytic shellfish toxins by reversed phase high performance liquid chromatography, with postcolumn reaction and fluorimetric detection. Chromatographia 1993, 35, 613–620. [Google Scholar] [CrossRef]
- Alexander, J.; Benford, D.; Boobis, A.; Ceccatelli, S.; Cravedi, J.P.; Domenico, A.D.; Doerge, D.; Dogliotti, E.; Edler, L.; Farmer, P.; et al. Scientific opinion of the panel on contaminants in the food chain on a request from the european commission of marine biotoxins in shellfish—Saxitoxin group. EFSA J. 2010, 8, 1–76. [Google Scholar]
- Burnham, K.P.; Anderson, D.R. Model Selection and Multimodel Inference: A Practical-Theoretic Approach; Springer: Amsterdam, The Netherlands, 2002; 496p. [Google Scholar]
- Fox, J.; Weisberg, S. An R Companion to Applied Regression, 3rd ed.; Sage: Thousand Oaks, CA, USA, 2019; Available online: https://socialsciences.mcmaster.ca/jfox/Books/Companion/ (accessed on 8 June 2022).
- R Development Core Team. R: A Language and Environment for Statistical Computing; R Foundation for Statistical Computing: Vienna, Austria, 2018; ISBN 3-900051-07-0. Available online: http://www.r-project.org/ (accessed on 8 June 2022).


| Predictive Variables | Df | SSQ | F Value | p (>F) |
|---|---|---|---|---|
| Null | 17 | 0.005754 | ||
| Fishing grounds | 1 | 0.001832 | 6.977 | 0.027 |
| Zone/patch | 3 | 0.000776 | 0.986 | 0.442 |
| Clam biomass | 1 | 0.000096 | 0.367 | 0.559 |
| Chlorophyll a | 1 | 0.000007 | 0.029 | 0.864 |
| Salinity | 1 | 0.000000 | 0.000 | 0.998 |
| Temperature | 1 | 0.000051 | 0.194 | 0.670 |
| Residuals | 10 | 0.002363 |
| Fishing Ground | Patch | K | g | PSTmax | PSTmin | Detoxification Time (d) | ||||
|---|---|---|---|---|---|---|---|---|---|---|
| Mean | SE | Mean | SE | Mean | SE | Mean | SE | |||
| Ovalada I. | North | −0.054 | 0.0069 | 0.82 | 0.065 | 2211 | 331 | 74 | 10.1 | 316 |
| South | −0.080 | 0.0098 | 0.82 | 0.065 | 9610 | 406 | 142 | 14.2 | NA | |
| Overall | −0.067 | 0.0083 | 0.82 | 0.065 | 5910 | 368 | 108 | 12.2 | NA | |
| Low Bay | East | −0.070 | 0.008 | 0.82 | 0.065 | 490 | 270 | 54 | 11.6 | 92 |
| Center | −0.055 | 0.008 | 0.82 | 0.065 | 513 | 382 | 39 | 11.6 | 103 | |
| West | −0.040 | 0.0056 | 0.82 | 0.065 | 432 | 331 | 38 | 8.2 | 136 | |
| Overall | −0.055 | 0.0072 | 0.82 | 0.065 | 478 | 328 | 44 | 10.5 | 110 | |
Publisher’s Note: MDPI stays neutral with regard to jurisdictional claims in published maps and institutional affiliations. |
© 2022 by the authors. Licensee MDPI, Basel, Switzerland. This article is an open access article distributed under the terms and conditions of the Creative Commons Attribution (CC BY) license (https://creativecommons.org/licenses/by/4.0/).
Share and Cite
Díaz, P.A.; Molinet, C.; Seguel, M.; Niklitschek, E.J.; Díaz, M.; Álvarez, G.; Pérez-Santos, I.; Varela, D.; Guzmán, L.; Rodríguez-Villegas, C.; et al. Modelling the Spatial and Temporal Dynamics of Paralytic Shellfish Toxins (PST) at Different Scales: Implications for Research and Management. Toxins 2022, 14, 786. https://doi.org/10.3390/toxins14110786
Díaz PA, Molinet C, Seguel M, Niklitschek EJ, Díaz M, Álvarez G, Pérez-Santos I, Varela D, Guzmán L, Rodríguez-Villegas C, et al. Modelling the Spatial and Temporal Dynamics of Paralytic Shellfish Toxins (PST) at Different Scales: Implications for Research and Management. Toxins. 2022; 14(11):786. https://doi.org/10.3390/toxins14110786
Chicago/Turabian StyleDíaz, Patricio A., Carlos Molinet, Miriam Seguel, Edwin J. Niklitschek, Manuel Díaz, Gonzalo Álvarez, Iván Pérez-Santos, Daniel Varela, Leonardo Guzmán, Camilo Rodríguez-Villegas, and et al. 2022. "Modelling the Spatial and Temporal Dynamics of Paralytic Shellfish Toxins (PST) at Different Scales: Implications for Research and Management" Toxins 14, no. 11: 786. https://doi.org/10.3390/toxins14110786
APA StyleDíaz, P. A., Molinet, C., Seguel, M., Niklitschek, E. J., Díaz, M., Álvarez, G., Pérez-Santos, I., Varela, D., Guzmán, L., Rodríguez-Villegas, C., & Figueroa, R. I. (2022). Modelling the Spatial and Temporal Dynamics of Paralytic Shellfish Toxins (PST) at Different Scales: Implications for Research and Management. Toxins, 14(11), 786. https://doi.org/10.3390/toxins14110786