The Impact of the Nephrotoxin Ochratoxin A on Human Renal Cells Studied by a Novel Co-Culture Model Is Influenced by the Presence of Fibroblasts


Abstract
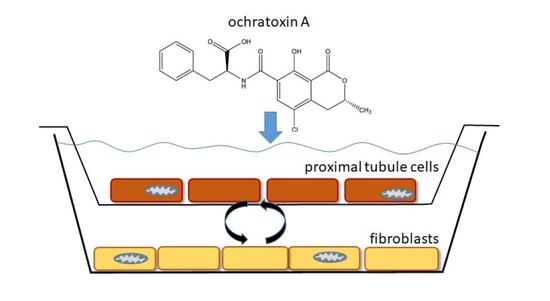
1. Introduction
2. Results
2.1. Protein, Lactate Dehydrogenase Release and Caspase-3 Activity
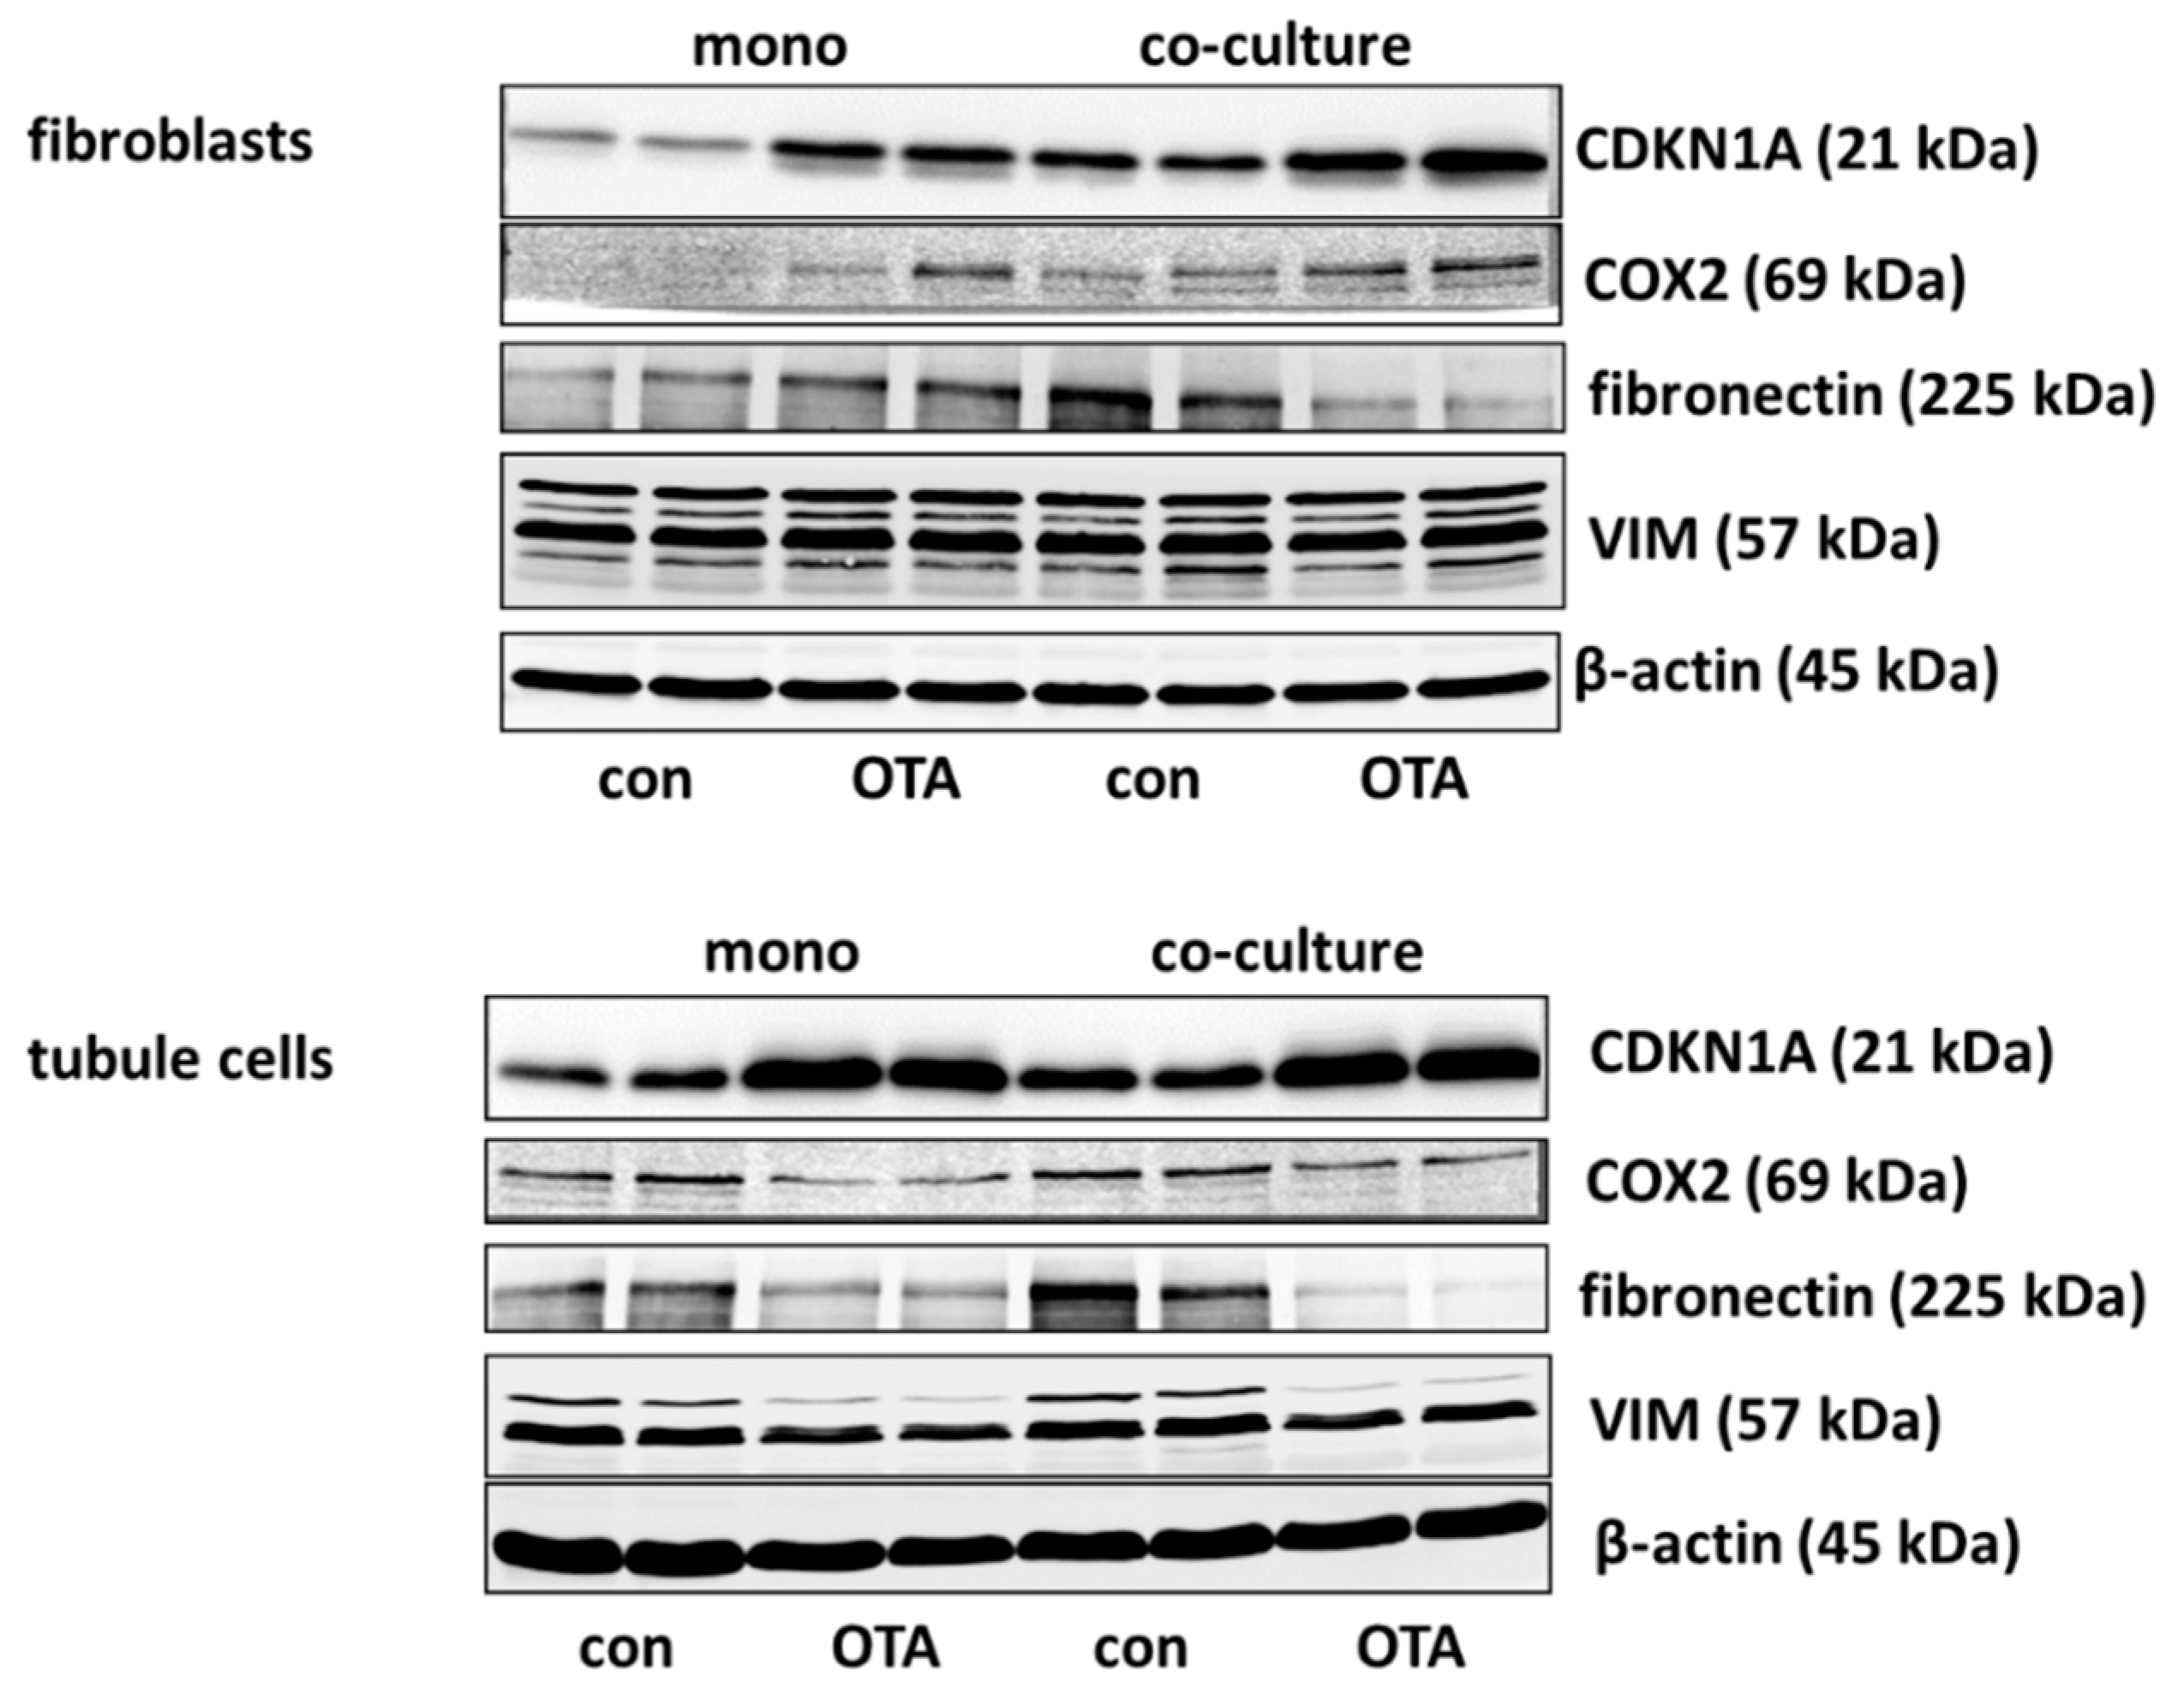
2.2. Western Blot and mRNA Expression
2.2.1. CDKN1A/p21
2.2.2. Cyclooxygenase 2 (COX2)
2.2.3. Fibronectin
2.2.4. Vimentin
2.3. Expression of Some Selected Genes
2.3.1. WISP1-AS1
2.3.2. GDF15
2.3.3. CDK2
2.3.4. Glycogen and Glucose-Related Proteins: PYGM, GYS1 and GLUT1 (SLC2A1)
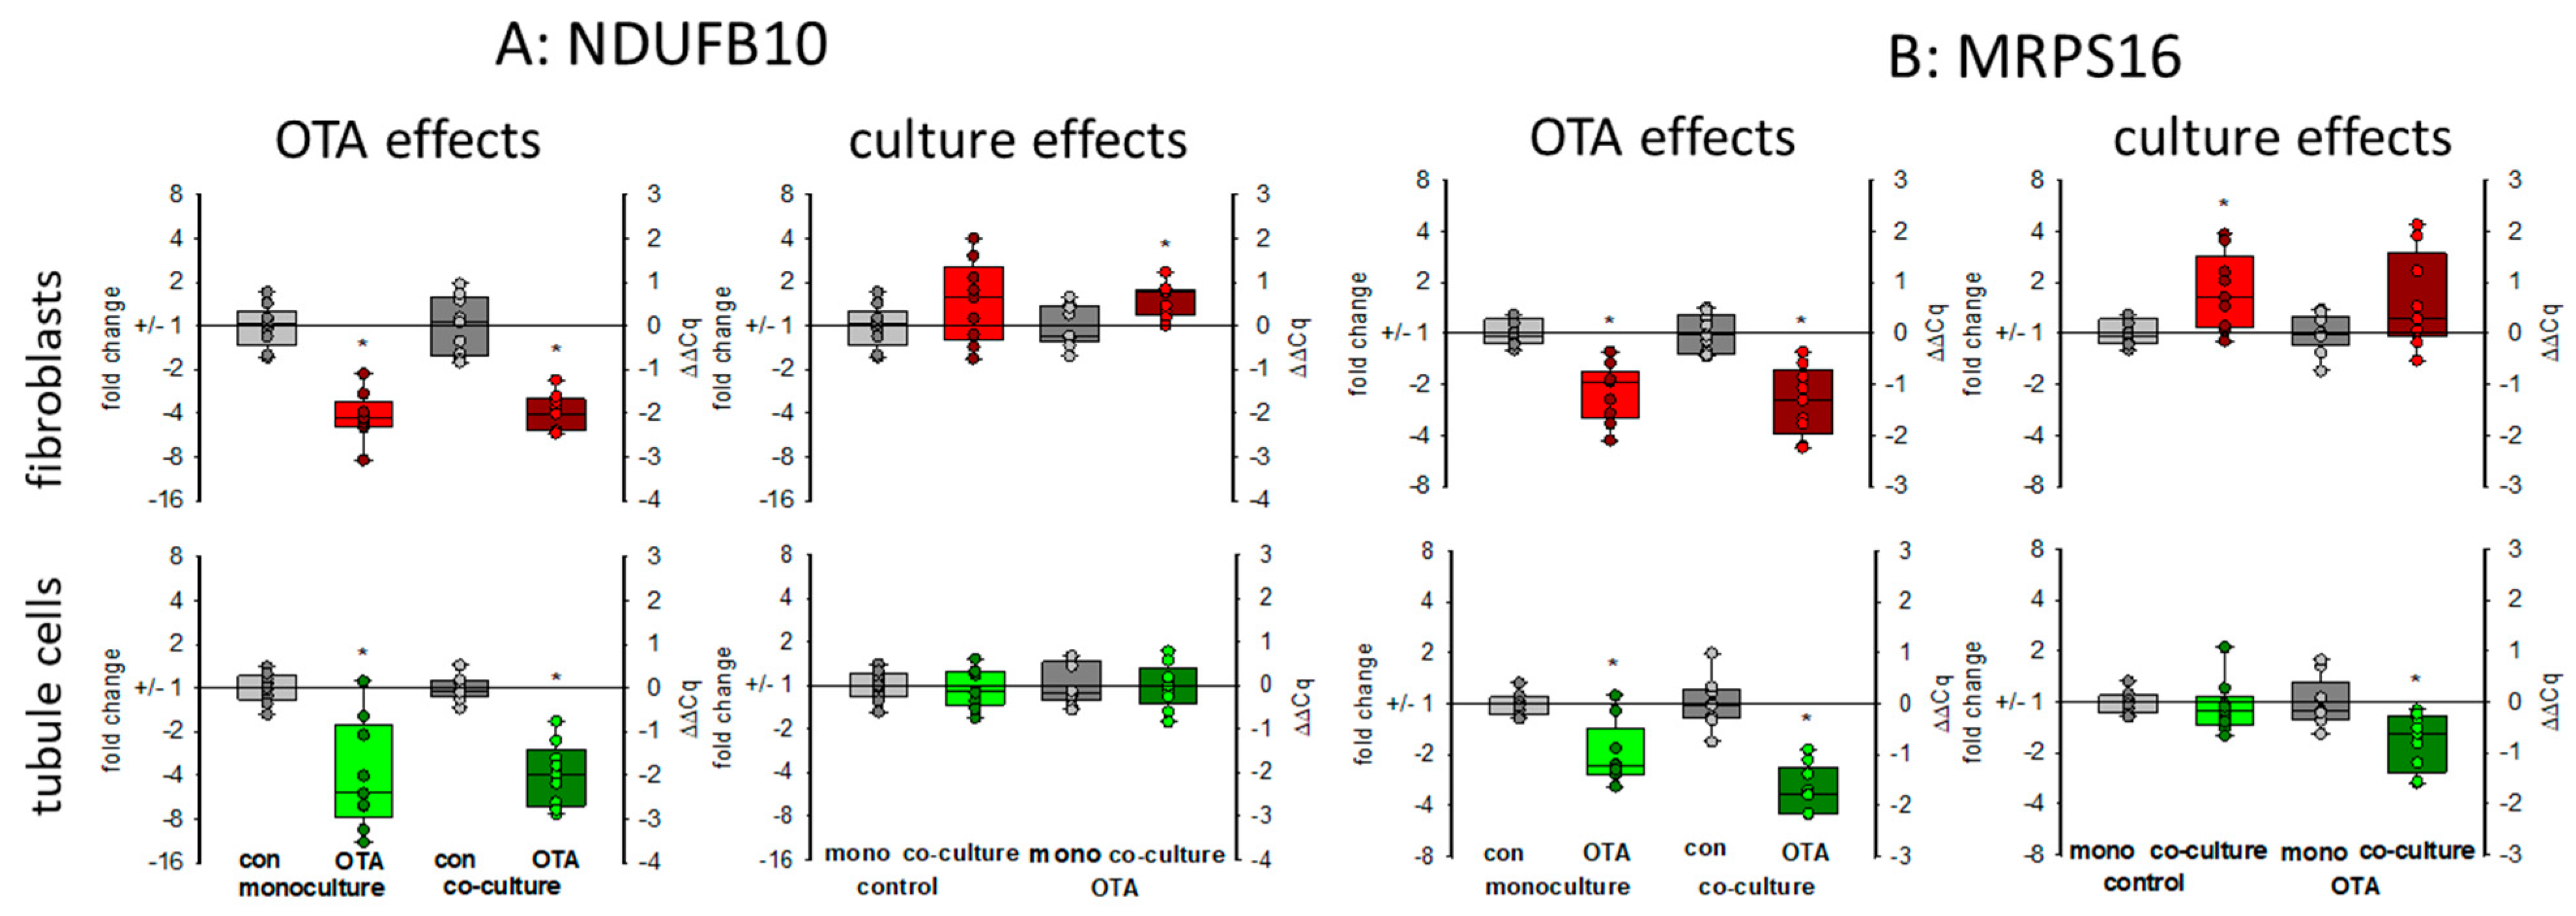
2.3.5. Mitochondria-Related Proteins: NDUFB10 and MRPS16
3. Discussion
3.1. Cell Survival
3.2. Protein and RNA Expression
4. Materials and Methods
4.1. Cell Culture
4.2. Determination of LDH and Caspase-3 Activities and of Protein Content
4.3. RT-PCR
4.4. Western Blots
4.5. Statistics
Supplementary Materials
Author Contributions
Funding
Institutional Review Board Statement
Informed Consent Statement
Data Availability Statement
Conflicts of Interest
References
- Ferguson, M.A.; Vaidya, V.S.; Bonventre, J.V. Biomarkers of nephrotoxic acute kidney injury. Toxicology 2008, 245, 182–193. [Google Scholar] [CrossRef] [PubMed]
- Hill, N.R.; Fatoba, S.T.; Oke, J.L.; Hirst, J.A.; O’Callaghan, C.A.; Lasserson, D.S.; Hobbs, F.D.R. Global prevalence of chronic kidney disease—A systematic review and meta-analysis. PLoS ONE 2016, 11, e0158765. [Google Scholar] [CrossRef] [PubMed]
- Damiano, S.; Andretta, E.; Longobardi, C.; Prisco, F.; Paciello, O.; Squillacioti, C.; Mirabella, N.; Florio, S.; Ciarcia, R. Effects of curcumin on the renal toxicity induced by ochratoxin a in rats. Antioxidants 2020, 9, 332. [Google Scholar] [CrossRef] [PubMed]
- Damiano, S.; Navas, L.; Lombari, P.; Montagnaro, S.; Forte, I.M.; Giordano, A.; Florio, S.; Ciarcia, R. Effects of δ-tocotrienol on ochratoxin A-induced nephrotoxicity in rats. J. Cell Physiol. 2018, 233, 8731–8739. [Google Scholar] [CrossRef]
- Yang, X.; Liu, S.; Huang, C.; Wang, H.; Luo, Y.; Xu, W.; Huang, K. Ochratoxin A induced premature senescence in human renal proximal tubular cells. Toxicology 2017, 382, 75–83. [Google Scholar] [CrossRef]
- Haugen, A.; Maehle, L.; Mollerup, S.; Rivedal, E.; Ryberg, D. Nickel-induced alterations in human renal epithelial cells. Environ. Health Perspect. 1994, 102 (Suppl. 3), 117–118. [Google Scholar] [PubMed]
- Schwerdt, G.; Holzinger, H.; Sauvant, C.; Königs, M.; Humpf, H.-U.; Gekle, M. Long-term effects of ochratoxin A on fibrosis and cell death in human proximal tubule or fibroblast cells in primary culture. Toxicology 2007, 232, 57–67. [Google Scholar] [CrossRef] [PubMed]
- Tan, R.J.; Zhou, D.; Liu, Y. Signaling crosstalk between tubular epithelial cells and interstitial fibroblasts after Kidney Injury. Kidney Dis. 2016, 2, 136–144. [Google Scholar] [CrossRef] [PubMed]
- Duarte, S.; Pena, A.; Lino, C. A review on ochratoxin A occurrence and effects of processing of cereal and cereal derived food products. Food Microbiol. 2010, 27, 187–198. [Google Scholar] [CrossRef]
- Cruz-Solbes, A.S.; Youker, K. Epithelial to Mesenchymal Transition (EMT) and endothelial to mesenchymal transition (EndMT): Role and implications in kidney fibrosis. Neurotransm. Interact. Cogn. Funct. 2017, 60, 345–372. [Google Scholar] [CrossRef]
- Panizo, S.; Martínez-Arias, L.; Alonso-Montes, C.; Cannata, P.; Martín-Carro, B.; Fernández-Martín, J.L.; Naves-Díaz, M.; Carrillo-López, N.; Cannata-Andía, J.B. Fibrosis in chronic kidney disease: Pathogenesis and consequences. Int. J. Mol. Sci. 2021, 22, 408. [Google Scholar] [CrossRef]
- Malir, F.; Ostry, V.; Pfohl-Leszkowicz, A.; Malir, J.; Toman, J. Ochratoxin A: 50 Years of Research. Toxins 2016, 8, 191. [Google Scholar] [CrossRef]
- Bui-Klimke, T.R.; Wu, F. Ochratoxin A and Human Health Risk: A Review of the Evidence. Crit. Rev. Food Sci. Nutr. 2015, 55, 1860–1869. [Google Scholar] [CrossRef]
- Marin, S.; Ramos, A.; Cano-Sancho, G.; Sanchis, V. Mycotoxins: Occurrence, toxicology, and exposure assessment. Food Chem. Toxicol. 2013, 60, 218–237. [Google Scholar] [CrossRef]
- Duarte, S.C.; Pena, A.; Lino, C.M. Ochratoxin A in Portugal: A Review to assess human exposure. Toxins 2010, 2, 1225–1249. [Google Scholar] [CrossRef] [PubMed]
- Arce-López, B.; Lizarraga, E.; Vettorazzi, A.; González-Peñas, E. Human biomonitoring of mycotoxins in blood, plasma and serum in recent years: A Review. Toxins 2020, 12, 147. [Google Scholar] [CrossRef] [PubMed]
- Pfohl-Leszkowicz, A.; Manderville, R.A. Ochratoxin A: An overview on toxicity and carcinogenicity in animals and humans. Mol. Nutr. Food Res. 2007, 51, 61–99. [Google Scholar] [CrossRef] [PubMed]
- Barnett, L.M.A.; Cummings, B.S. Nephrotoxicity and renal pathophysiology: A contemporary perspective. Toxicol. Sci. 2018, 164, 379–390. [Google Scholar] [CrossRef] [PubMed]
- Fuchs, R.; Peraica, M. Ochratoxin A in human kidney diseases. Food Addit. Contam. 2005, 22, 53–57. [Google Scholar] [CrossRef] [PubMed]
- Schulz, M.-C.; Gekle, M.; Schwerdt, G. Epithelial-fibroblast cross talk aggravates the impact of the nephrotoxin ochratoxin A. Biochim. Biophys. Acta Bioenergy 2019, 1866, 118528. [Google Scholar] [CrossRef] [PubMed]
- Dubourg, V.; Nolze, A.; Kopf, M.; Gekle, M.; Schwerdt, G. Weighted Correlation Network Analysis Reveals CDK2 as a regulator of a ubiquitous environmental toxin-induced cell-cycle arrest. Cells 2020, 9, 143. [Google Scholar] [CrossRef] [PubMed]
- Rios, A.; Vargas-Robles, H.; Gámez-Méndez, A.M.; Escalante, B. Cyclooxygenase-2 and kidney failure. Prostaglandins Other Lipid Mediat. 2012, 98, 86–90. [Google Scholar] [CrossRef]
- Guarino, M.; Tosoni, A.; Nebuloni, M. Direct contribution of epithelium to organ fibrosis: Epithelial-mesenchymal transition. Hum. Pathol. 2009, 40, 1365–1376. [Google Scholar] [CrossRef] [PubMed]
- Polovic, M.; Dittmar, S.; Hennemeier, I.; Humpf, H.-U.; Seliger, B.; Fornara, P.; Theil, G.; Azinovic, P.; Nolze, A.; Köhn, M.; et al. Identification of a novel lncRNA induced by the nephrotoxin ochratoxin A and expressed in human renal tumor tissue. Cell. Mol. Life Sci. 2017, 75, 2241–2256. [Google Scholar] [CrossRef] [PubMed]
- Desmedt, S.; Desmedt, V.; De Vos, L.; Delanghe, J.R.; Speeckaert, R.; Speeckaert, M.M. Growth differentiation factor 15: A novel biomarker with high clinical potential. Crit. Rev. Clin. Lab. Sci. 2019, 56, 333–350. [Google Scholar] [CrossRef] [PubMed]
- De Cos, G.M.; Benito, H.A.; Garcia Unzueta, M.T.; Mazon, R.J.; Lopez Del Moral, C.C.; Perez Canga, J.L.; San Segundo, A.D.; Valero San, C.R.; Ruiz San Millan, J.C.; Rodrigo, C.E. Growth differentiation factor 15: A biomarker with high clinical po-tential in the evaluation of kidney transplant candidates. J. Clin. Med. 2020, 9, 4112. [Google Scholar] [CrossRef]
- Fernandes, R. The controversial role of glucose in the diabetic kidney. Porto Biomed. J. 2021, 6, e113. [Google Scholar] [CrossRef] [PubMed]
- Adeva-Andany, M.M.; Gonzalez-Lucon, M.; Donapetry-Garcia, C.; Fernandez-Fernandez, C.; Ameneiros-Rodriguez, E. Gly-cogen metabolism in humans. BBA Clin. 2016, 5, 85–100. [Google Scholar] [CrossRef]
- Schwerdt, G.; Freudinger, R.; Mildenberger, S.; Silbernagl, S.; Gekle, M. The nephrotoxin ochratoxin A induces apoptosis in cultured human proximal tubule cells. Cell Biol. Toxicol. 1999, 15, 405–415. [Google Scholar] [CrossRef] [PubMed]
- Çelik, D.A.; Gurbuz, N.; Toğay, V.A.; Özçelik, N. Ochratoxin A causes cell cycle arrest in G1 and G1/S phases through p53 in HK-2 cells. Toxicon 2020, 180, 11–17. [Google Scholar] [CrossRef]
- Pyo, M.C.; Chae, S.A.; Yoo, H.J.; Lee, K.W. Ochratoxin A induces epithelial-to-mesenchymal transition and renal fibrosis through TGF-bete/Smad2/3 and Wnt1/beta-catenin signaling pathways in vitro and in vivo. Arch. Toxicol. 2020, 94, 3329–3342. [Google Scholar] [CrossRef]
- Chen, H.; Fan, Y.; Jing, H.; Tang, S.; Zhou, J. Emerging role of lncRNAs in renal fibrosis. Arch. Biochem. Biophys. 2020, 692, 108530. [Google Scholar] [CrossRef]
- Li, Q.; Dong, Z.; Lian, W.; Cui, J.; Wang, J.; Shen, H.; Liu, W.; Yang, J.; Zhang, X.; Cui, H. Ochratoxin A causes mitochondrial dysfunction, apoptotic and autophagic cell death and also induces mitochondrial biogenesis in human gastric epithelium cells. Arch. Toxicol. 2019, 93, 1141–1155. [Google Scholar] [CrossRef] [PubMed]
- Wang, Y.; Zhao, M.; Cui, J.; Wu, X.; Li, Y.; Wu, W.; Zhang, X. Ochratoxin A induces reprogramming of glucose metabolism by switching energy metabolism from oxidative phosphorylation to glycolysis in human gastric epithelium GES-1 cells in vitro. Toxicol. Lett. 2020, 333, 232–241. [Google Scholar] [CrossRef]
- Nakamura, J.; Sato, Y.; Kitai, Y.; Wajima, S.; Yamamoto, S.; Oguchi, A.; Yamada, R.; Kaneko, K.; Kondo, M.; Uchino, E.; et al. Myofibroblasts acquire retinoic acid–producing ability during fibroblast-to-myofibroblast transition following kidney injury. Kidney Int. 2019, 95, 526–539. [Google Scholar] [CrossRef] [PubMed]
- Smith, P.; Krohn, R.; Hermanson, G.; Mallia, A.; Gartner, F.; Provenzano, M.; Fujimoto, E.; Goeke, N.; Olson, B.; Klenk, D. Measurement of protein using bicinchoninic acid. Anal. Biochem. 1985, 150, 76–85. [Google Scholar] [CrossRef]
- Lane, R.D.; Federman, D.; Flora, J.L.; Beck, B.L. Computer-assisted determination of protein concentrations from dye-binding and bicinchoninic acid protein assays performed in microtiter plates. J. Immunol. Methods 1986, 92, 261–270. [Google Scholar] [CrossRef]
- Bergmeyer, H.U.; Bernt, E. Laktat-Dehydrogenase. In Methoden der Enzymatischen Analyse, 3rd ed.; Bergmeyer, H.U., Ed.; Verlag Chemie: Weinheim, Germany, 1974; Volume 3, pp. 607–612. [Google Scholar]
- Schwerdt, G.; Gordjani, N.; Benesic, A.; Freudinger, R.; Wollny, B.; Kirchhoff, A.; Gekle, M. Chloroacetaldehyde- and acrolein-induced death of human proximal tubule cells. Pediatr. Nephrol. 2005, 21, 60–67. [Google Scholar] [CrossRef] [PubMed]


| Gene Name | Forward | Reverse | Fragment Length |
|---|---|---|---|
| CDKN1A | ACTGTCTTGTACCCTTGTGC | CTCTTGGAGAAGATCAGCCG | 144 |
| CDK2 | ATTCATGGATGCCTCTGCTC | TTTAAGGTCTCGGTGGAGGA | 122 |
| EEF2 | GGAGTCGGGAGAGCATATCA | GGGTCAGATTTCTTGATGGG | 108 |
| FN | CCATAAAGGGCAACCAAGAG | AAACCAATTCTTGGAGCAGG | 142 |
| GDF15 | CTCCAGATTCCGAGAGTTGC | CACTTCTGGCGTGAGTATCC | 130 |
| GYS1 | TTCTACAACAACCTGGAG | CTGAGCAGATAGTTGAGC | 404 |
| NDUFB10 | ATGATGAAAGCGTTCGACCT | TTGCACTCAGTGATGTCTGG | 137 |
| MRPS16 | AGAAAAACTCGTTGCCCTCA | AGCAAGACCCAGAAGCTTTT | 97 |
| PYGM | TCAATGTCGGTGGCTACATC | CACCACGAAATACTCCTGCT | 131 |
| RPS17 | TCAGCCTTGGATCAGGAGAT | CATCCCAACTGTAGGCTGAG | 114 |
| SLC2A1 (GLUT1) | ACACTGGAGTCATCAATGCC | ACACTGGAGTCATCAATGCC | 148 |
| VIM | ATTGCAGGAGGAGATGCTTC | TTCCACTTTGCGTTCAAGGT | 112 |
| Antibody Against | Source | Dilution |
|---|---|---|
| CDKN1A/p21 | Cell Signaling | 0.7361111 |
| COX2 | Abcam | 0.3888889 |
| Fibronectin | Rockland | 0.7361111 |
| VIM | Cell Signaling | 0.7361111 |
| Beta-Actin | Cell Signaling | 0.7361111 |
| Mouse antibody (2nd antibody) | Licor | 1:40,000 |
| Rabbit Antibody (2nd antibody) | Licor | 1:40,000 |
Publisher’s Note: MDPI stays neutral with regard to jurisdictional claims in published maps and institutional affiliations. |
© 2021 by the authors. Licensee MDPI, Basel, Switzerland. This article is an open access article distributed under the terms and conditions of the Creative Commons Attribution (CC BY) license (http://creativecommons.org/licenses/by/4.0/).
Share and Cite
Schwerdt, G.; Kopf, M.; Gekle, M. The Impact of the Nephrotoxin Ochratoxin A on Human Renal Cells Studied by a Novel Co-Culture Model Is Influenced by the Presence of Fibroblasts. Toxins 2021, 13, 219. https://doi.org/10.3390/toxins13030219
Schwerdt G, Kopf M, Gekle M. The Impact of the Nephrotoxin Ochratoxin A on Human Renal Cells Studied by a Novel Co-Culture Model Is Influenced by the Presence of Fibroblasts. Toxins. 2021; 13(3):219. https://doi.org/10.3390/toxins13030219
Chicago/Turabian StyleSchwerdt, Gerald, Michael Kopf, and Michael Gekle. 2021. "The Impact of the Nephrotoxin Ochratoxin A on Human Renal Cells Studied by a Novel Co-Culture Model Is Influenced by the Presence of Fibroblasts" Toxins 13, no. 3: 219. https://doi.org/10.3390/toxins13030219
APA StyleSchwerdt, G., Kopf, M., & Gekle, M. (2021). The Impact of the Nephrotoxin Ochratoxin A on Human Renal Cells Studied by a Novel Co-Culture Model Is Influenced by the Presence of Fibroblasts. Toxins, 13(3), 219. https://doi.org/10.3390/toxins13030219