Effects of Deoxynivalenol and Fumonisins Fed in Combination to Beef Cattle: Immunotoxicity and Gene Expression


 , , ,
, , , 
Abstract
:1. Introduction
2. Results and Discussion
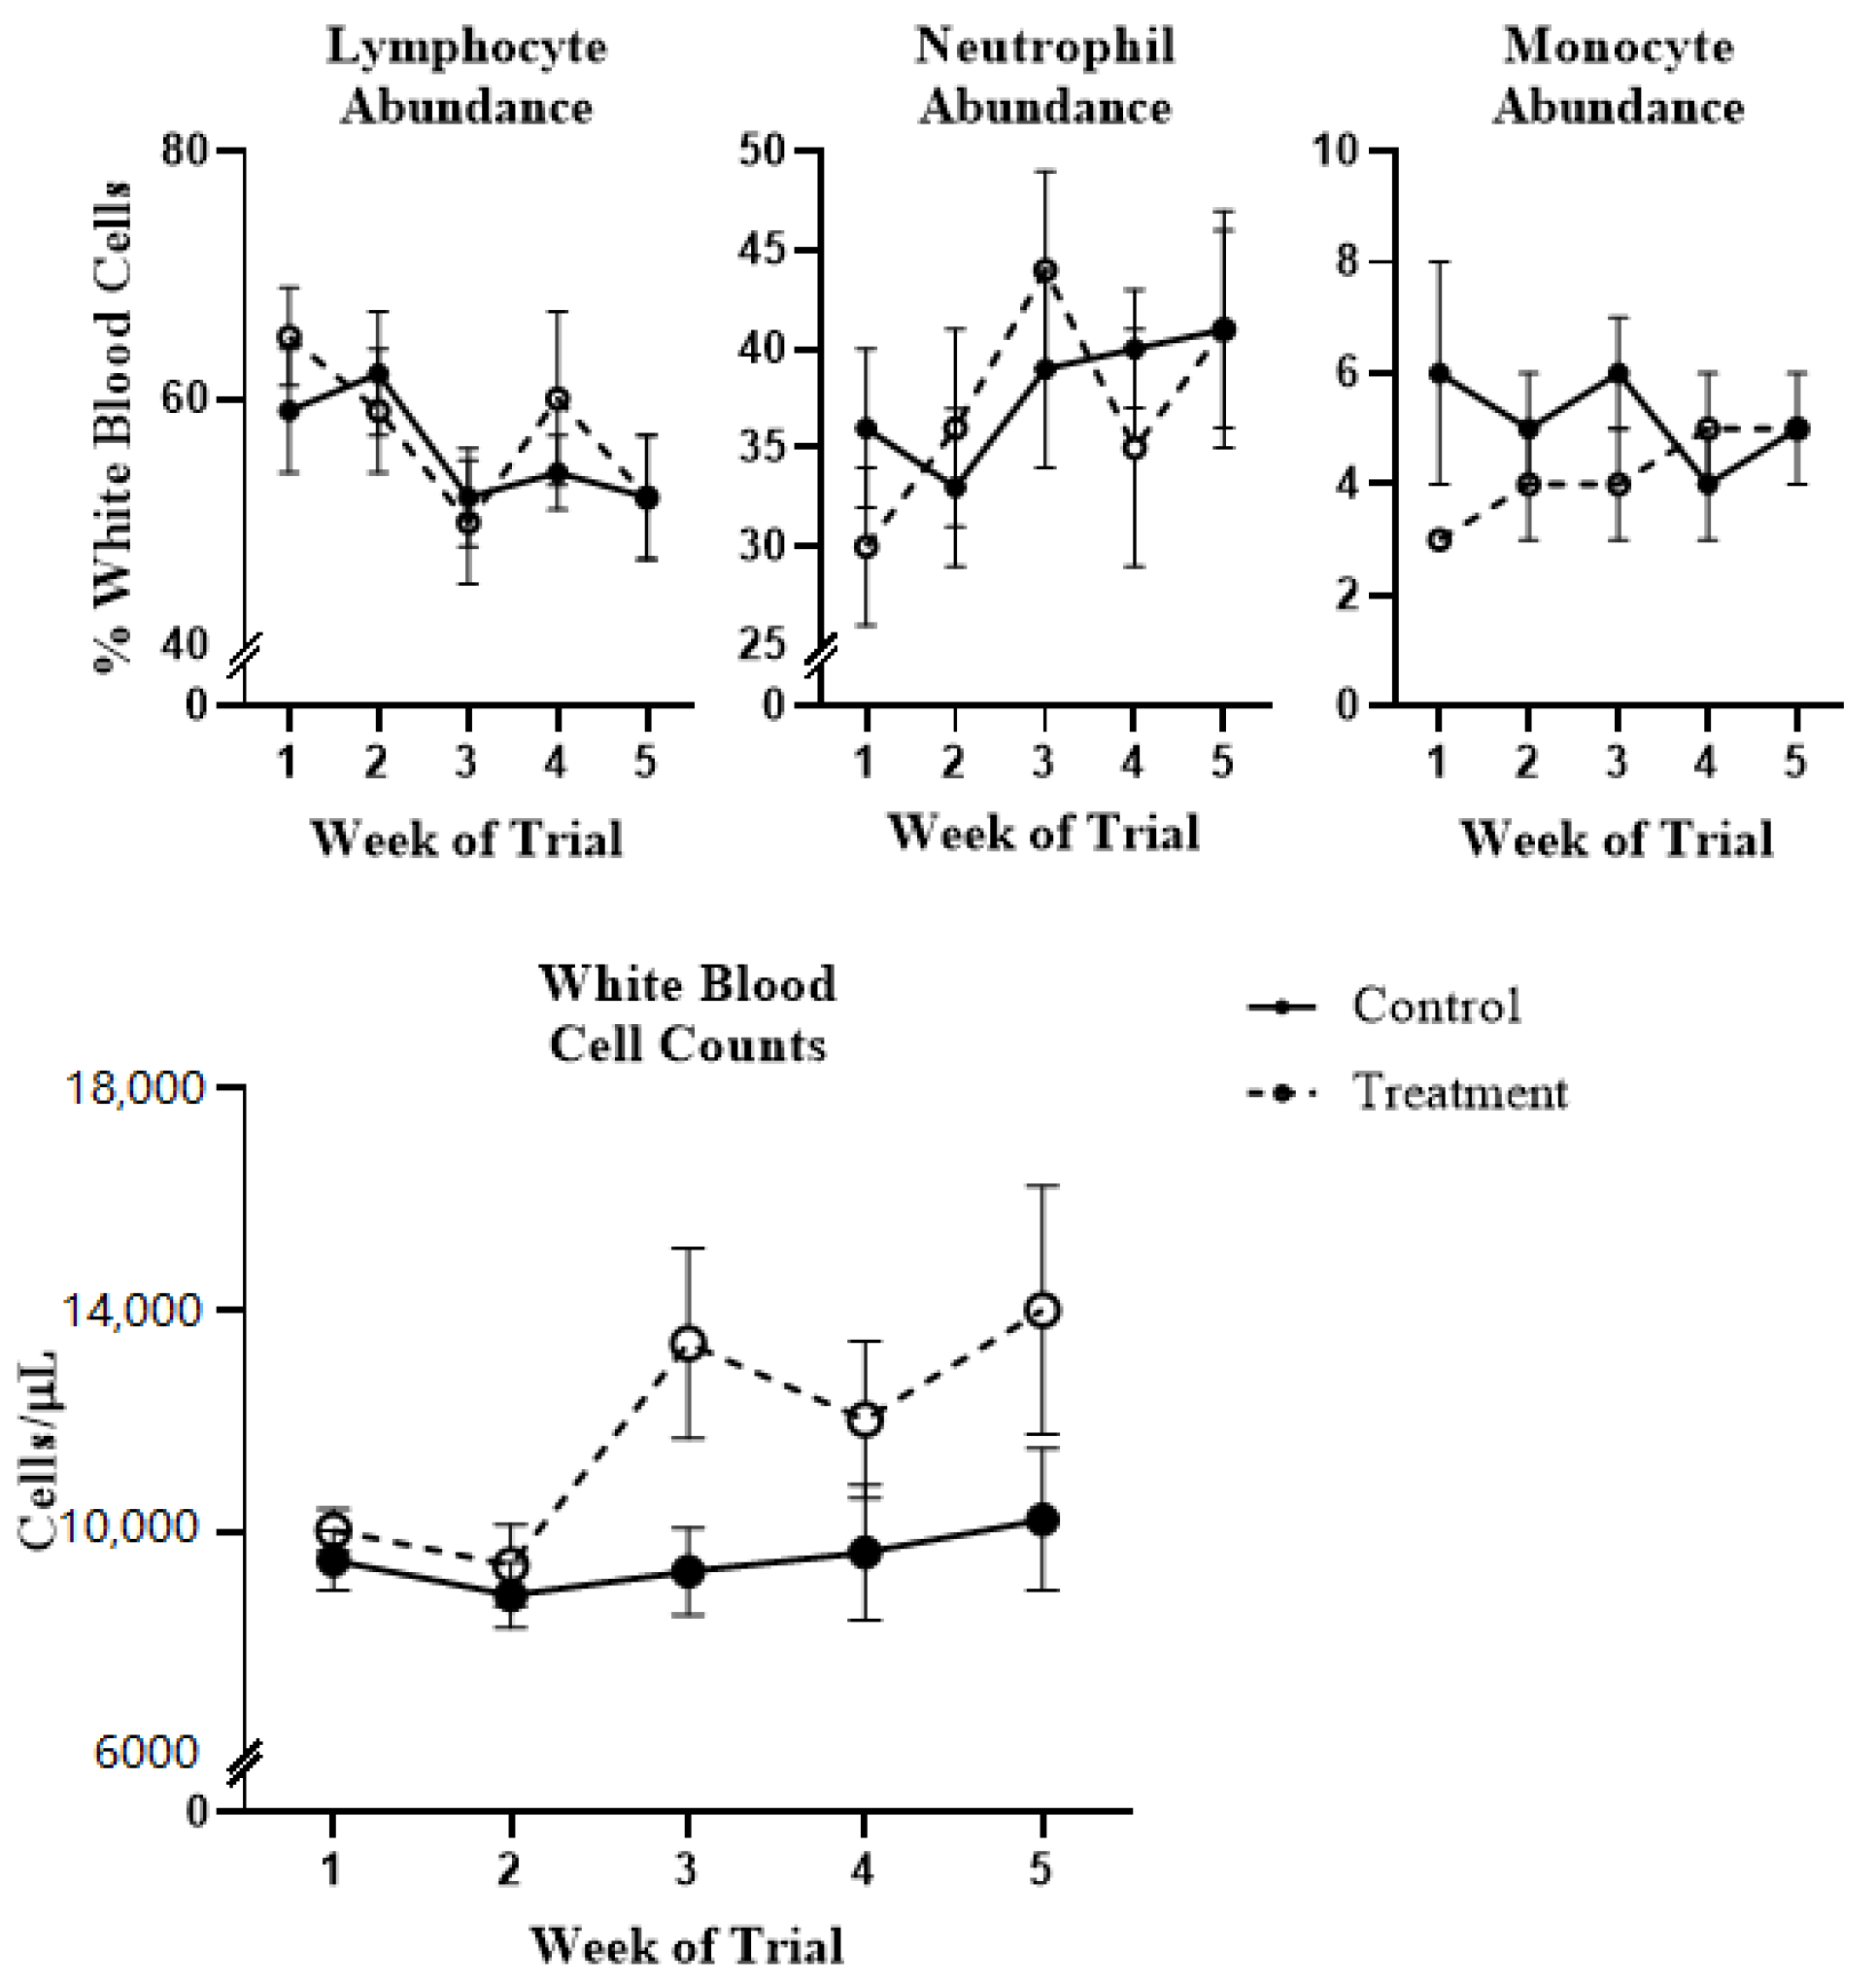
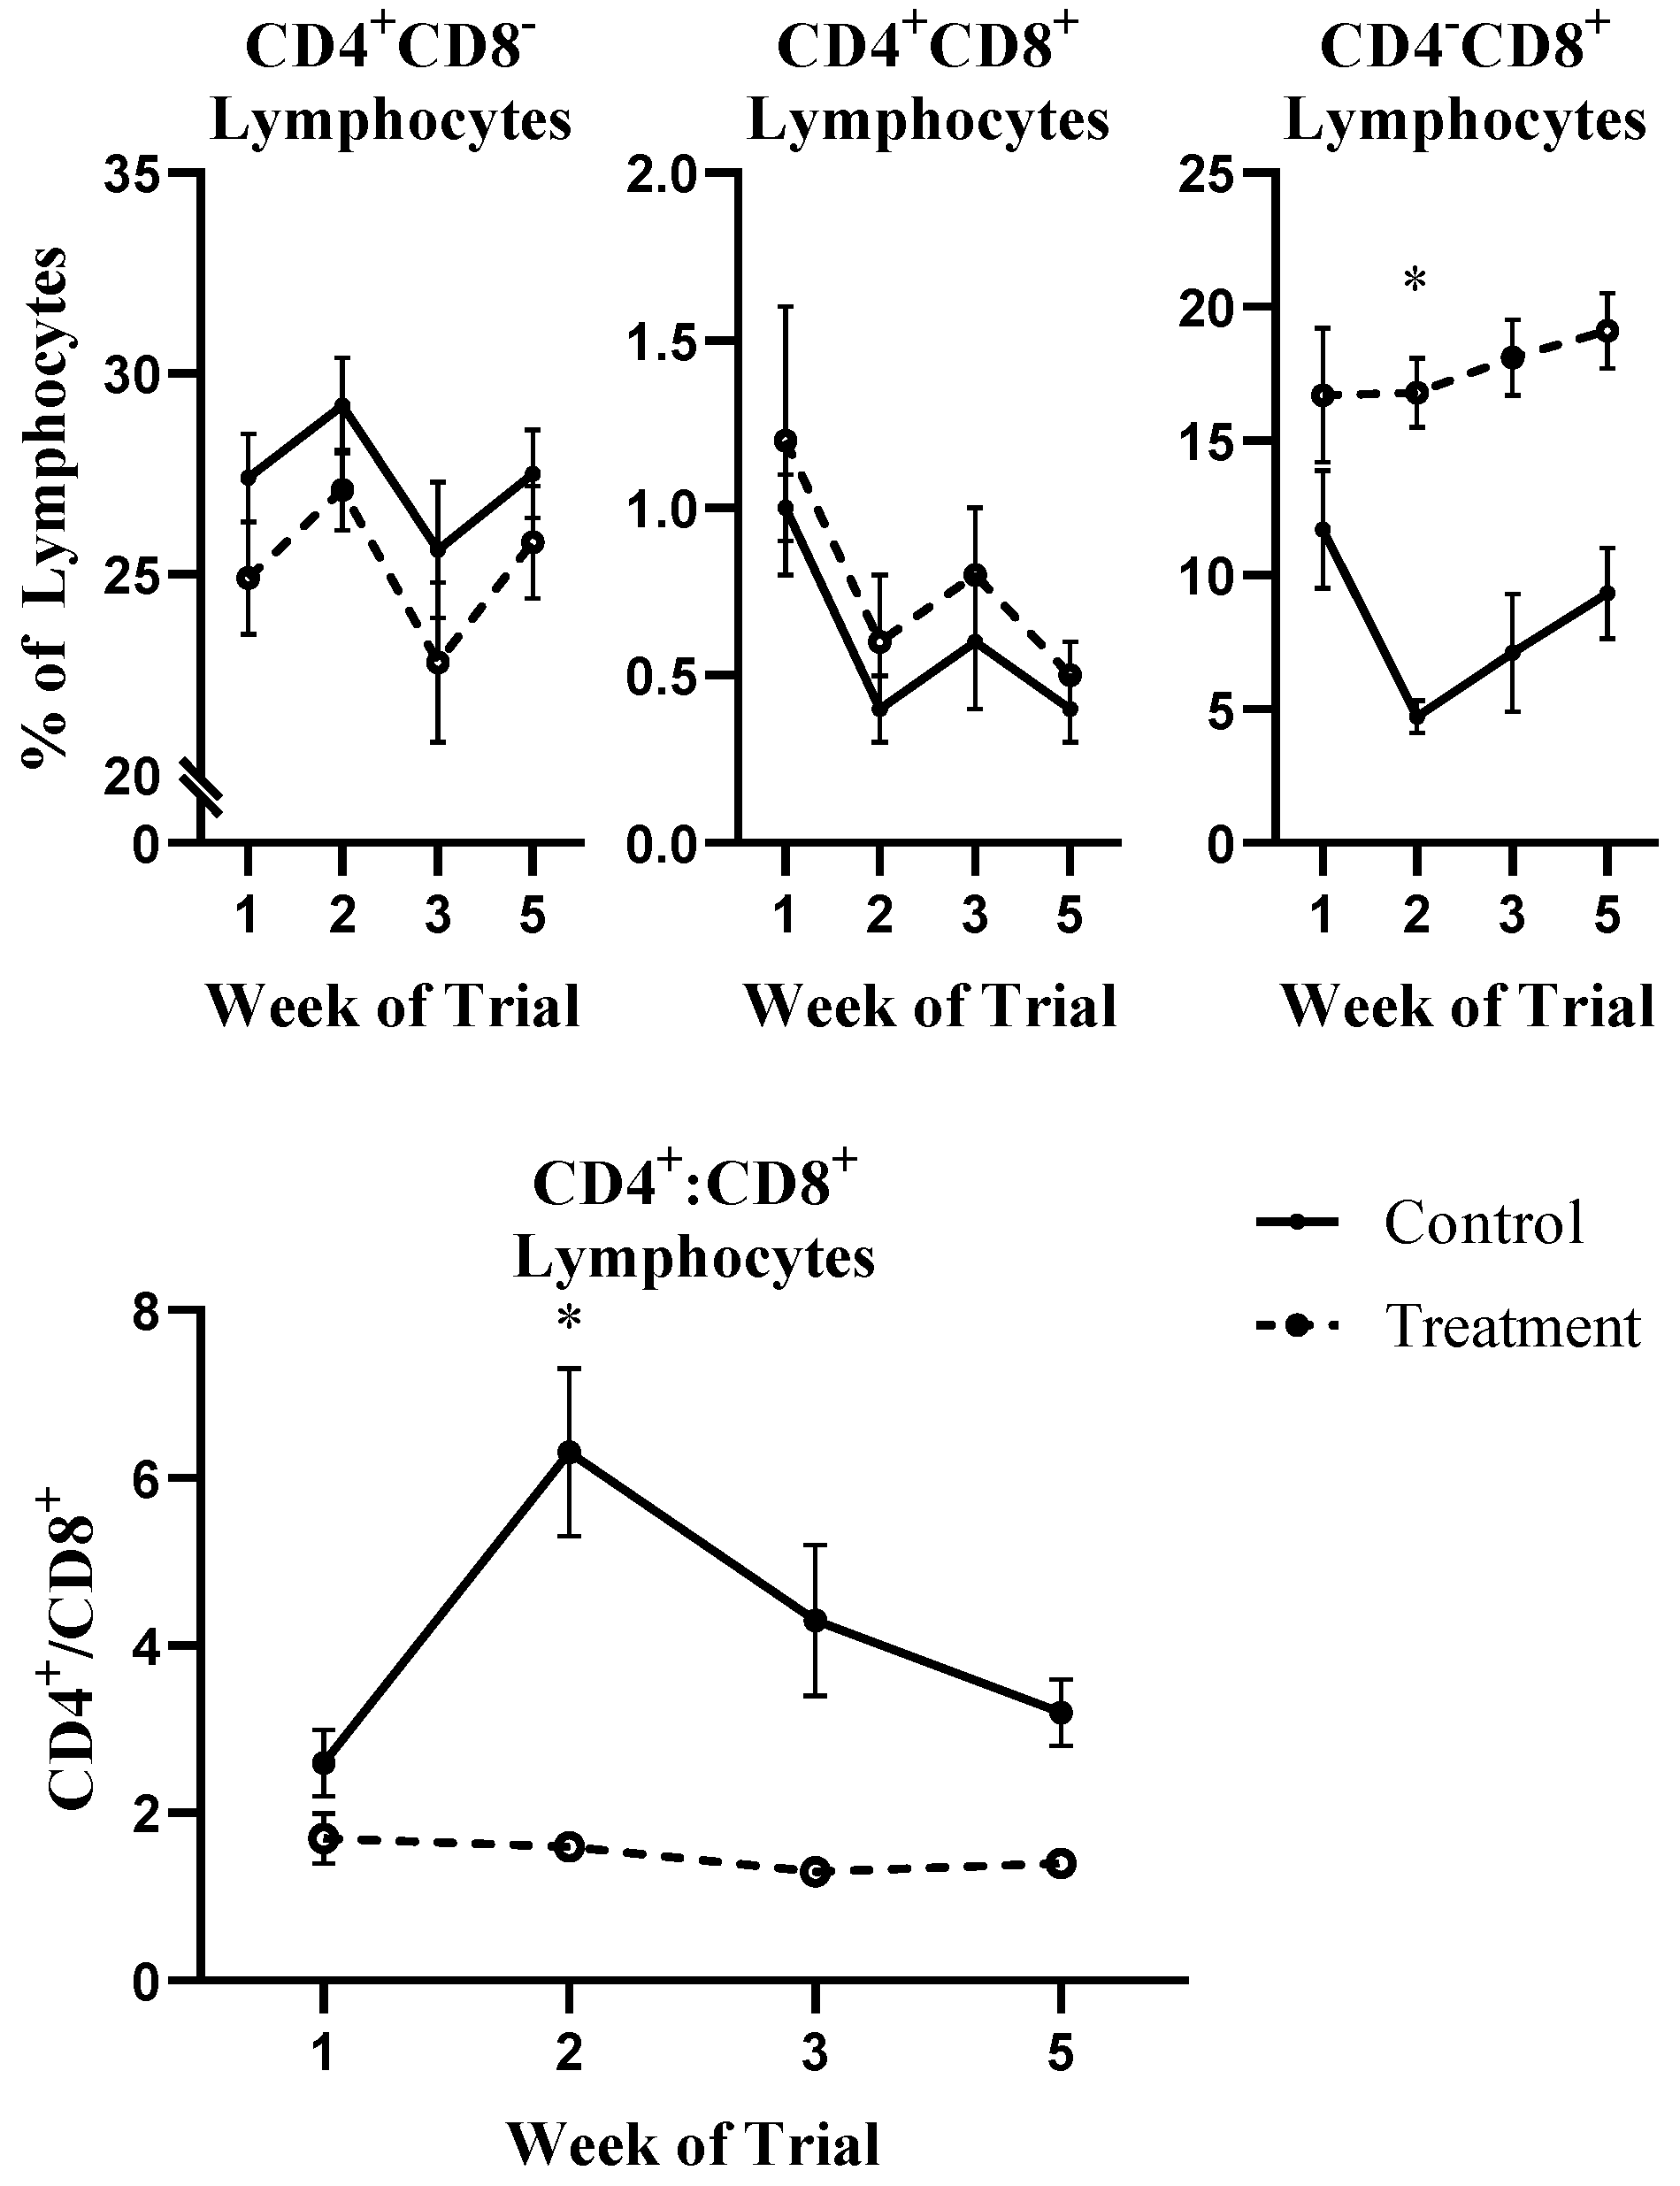
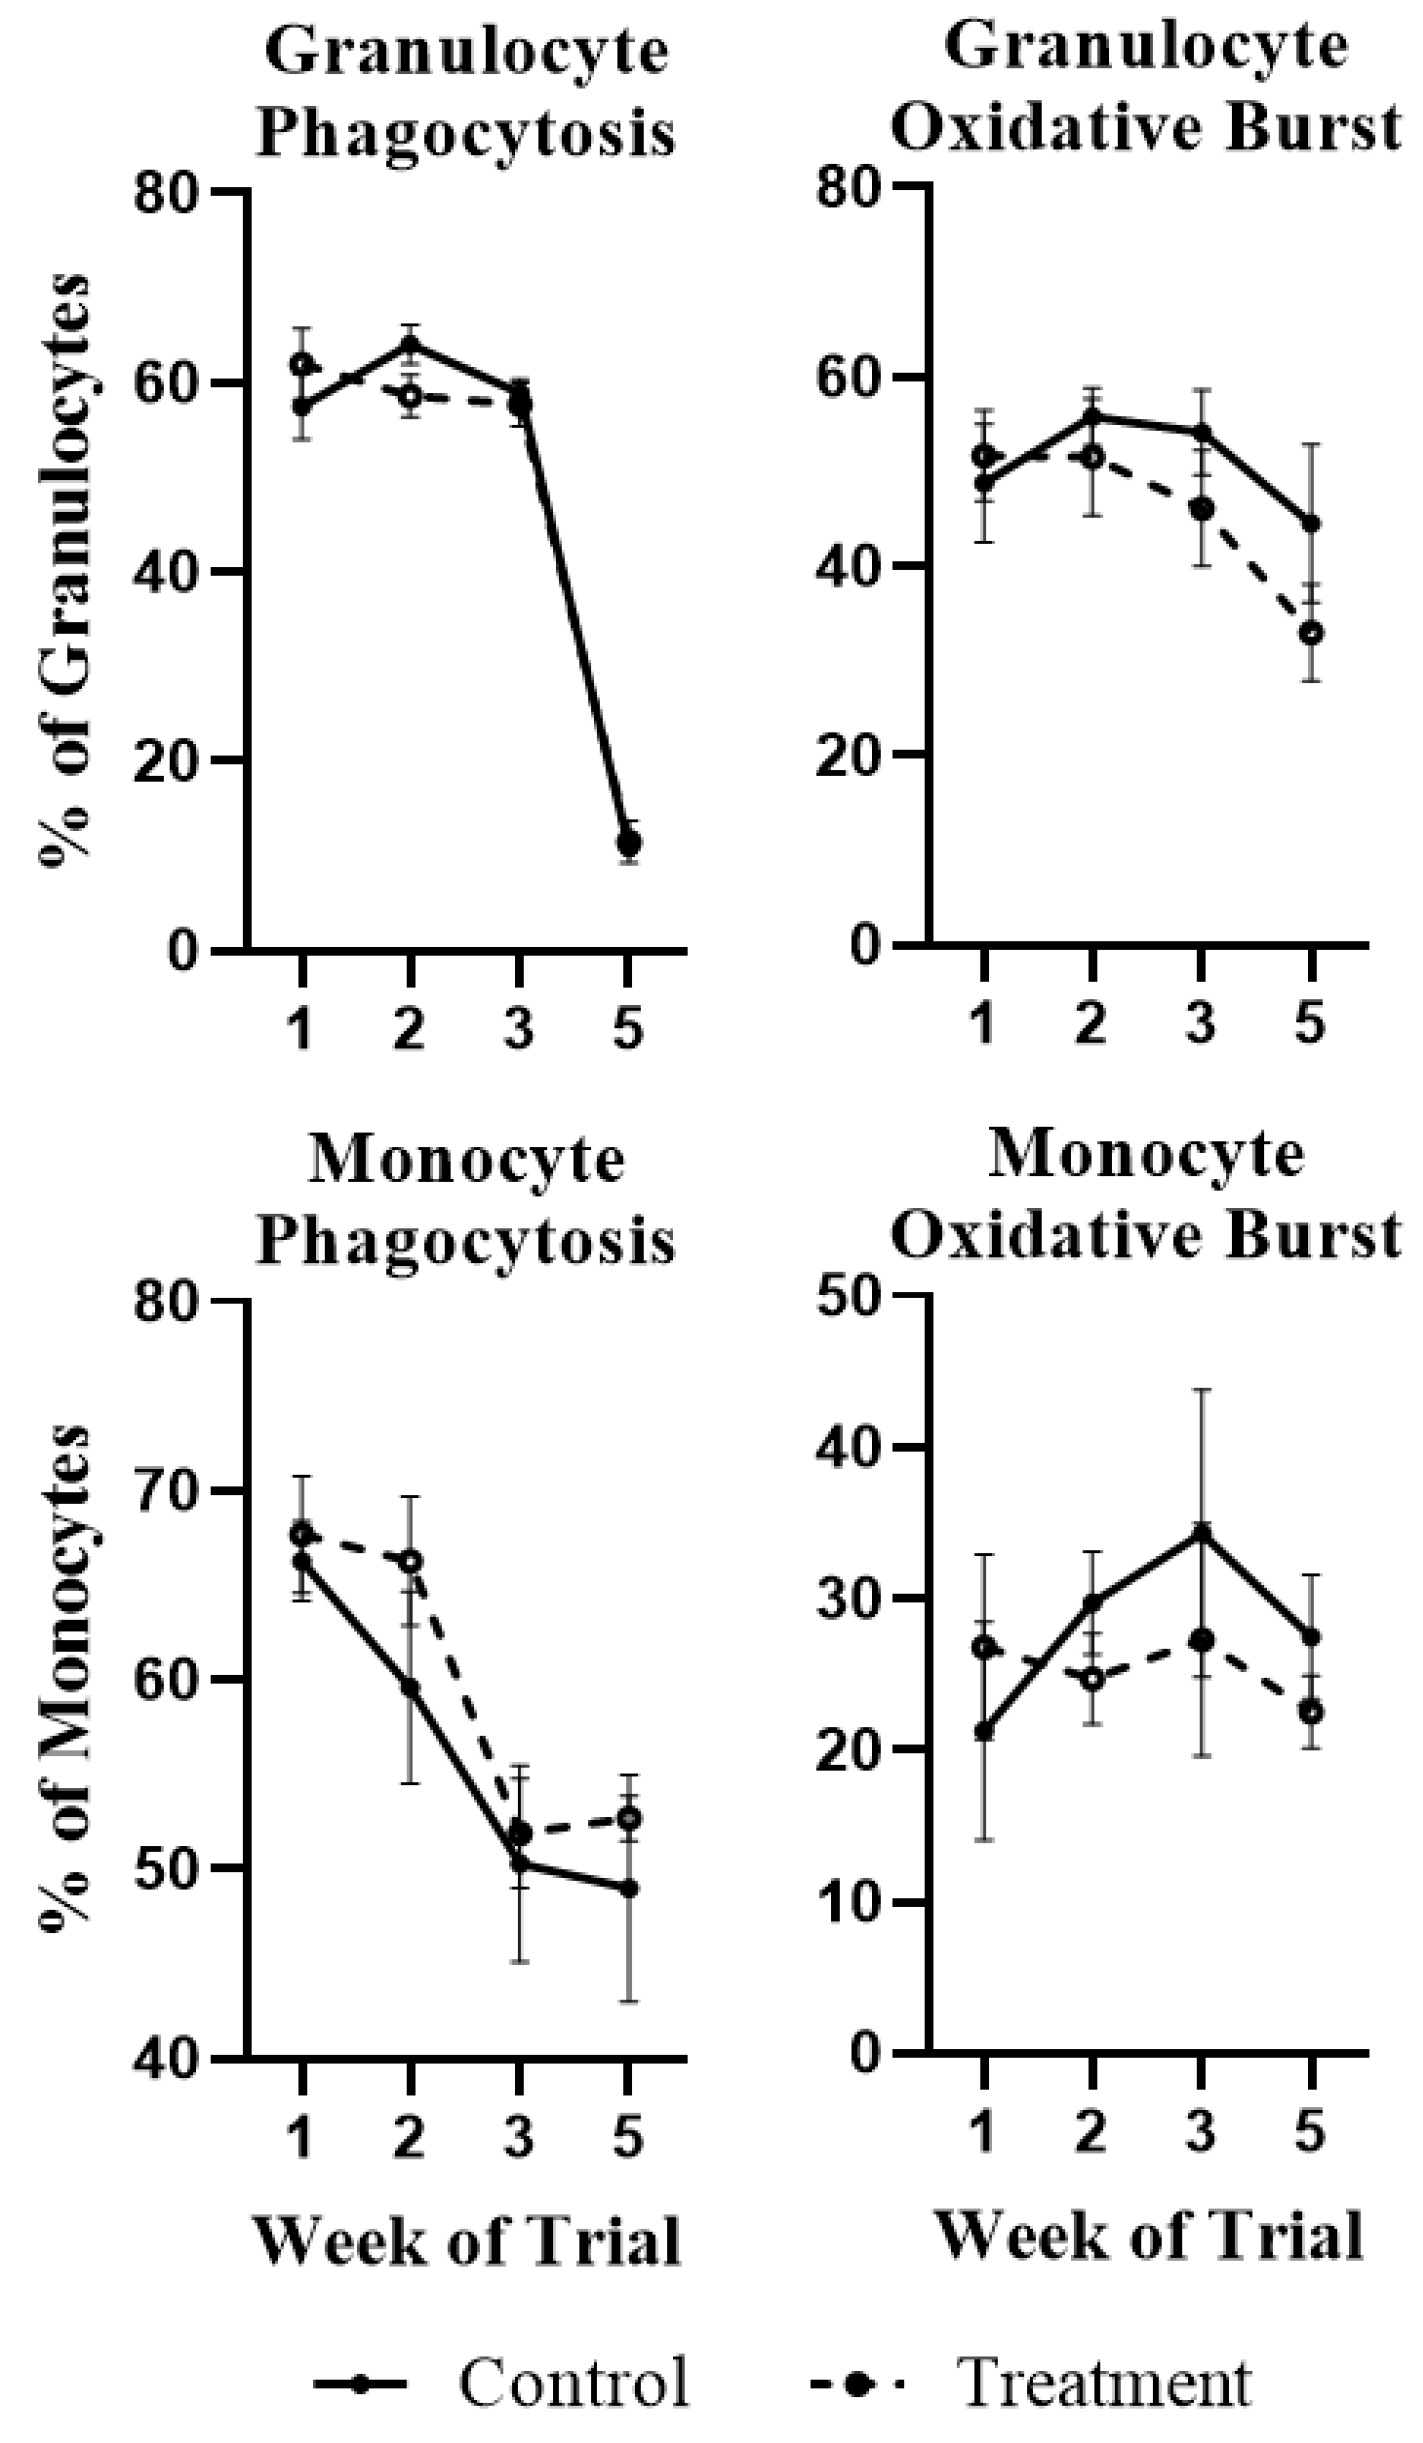
2.1. White Blood Cell Population Dynamics and Functionality
2.2. RNA-Seq
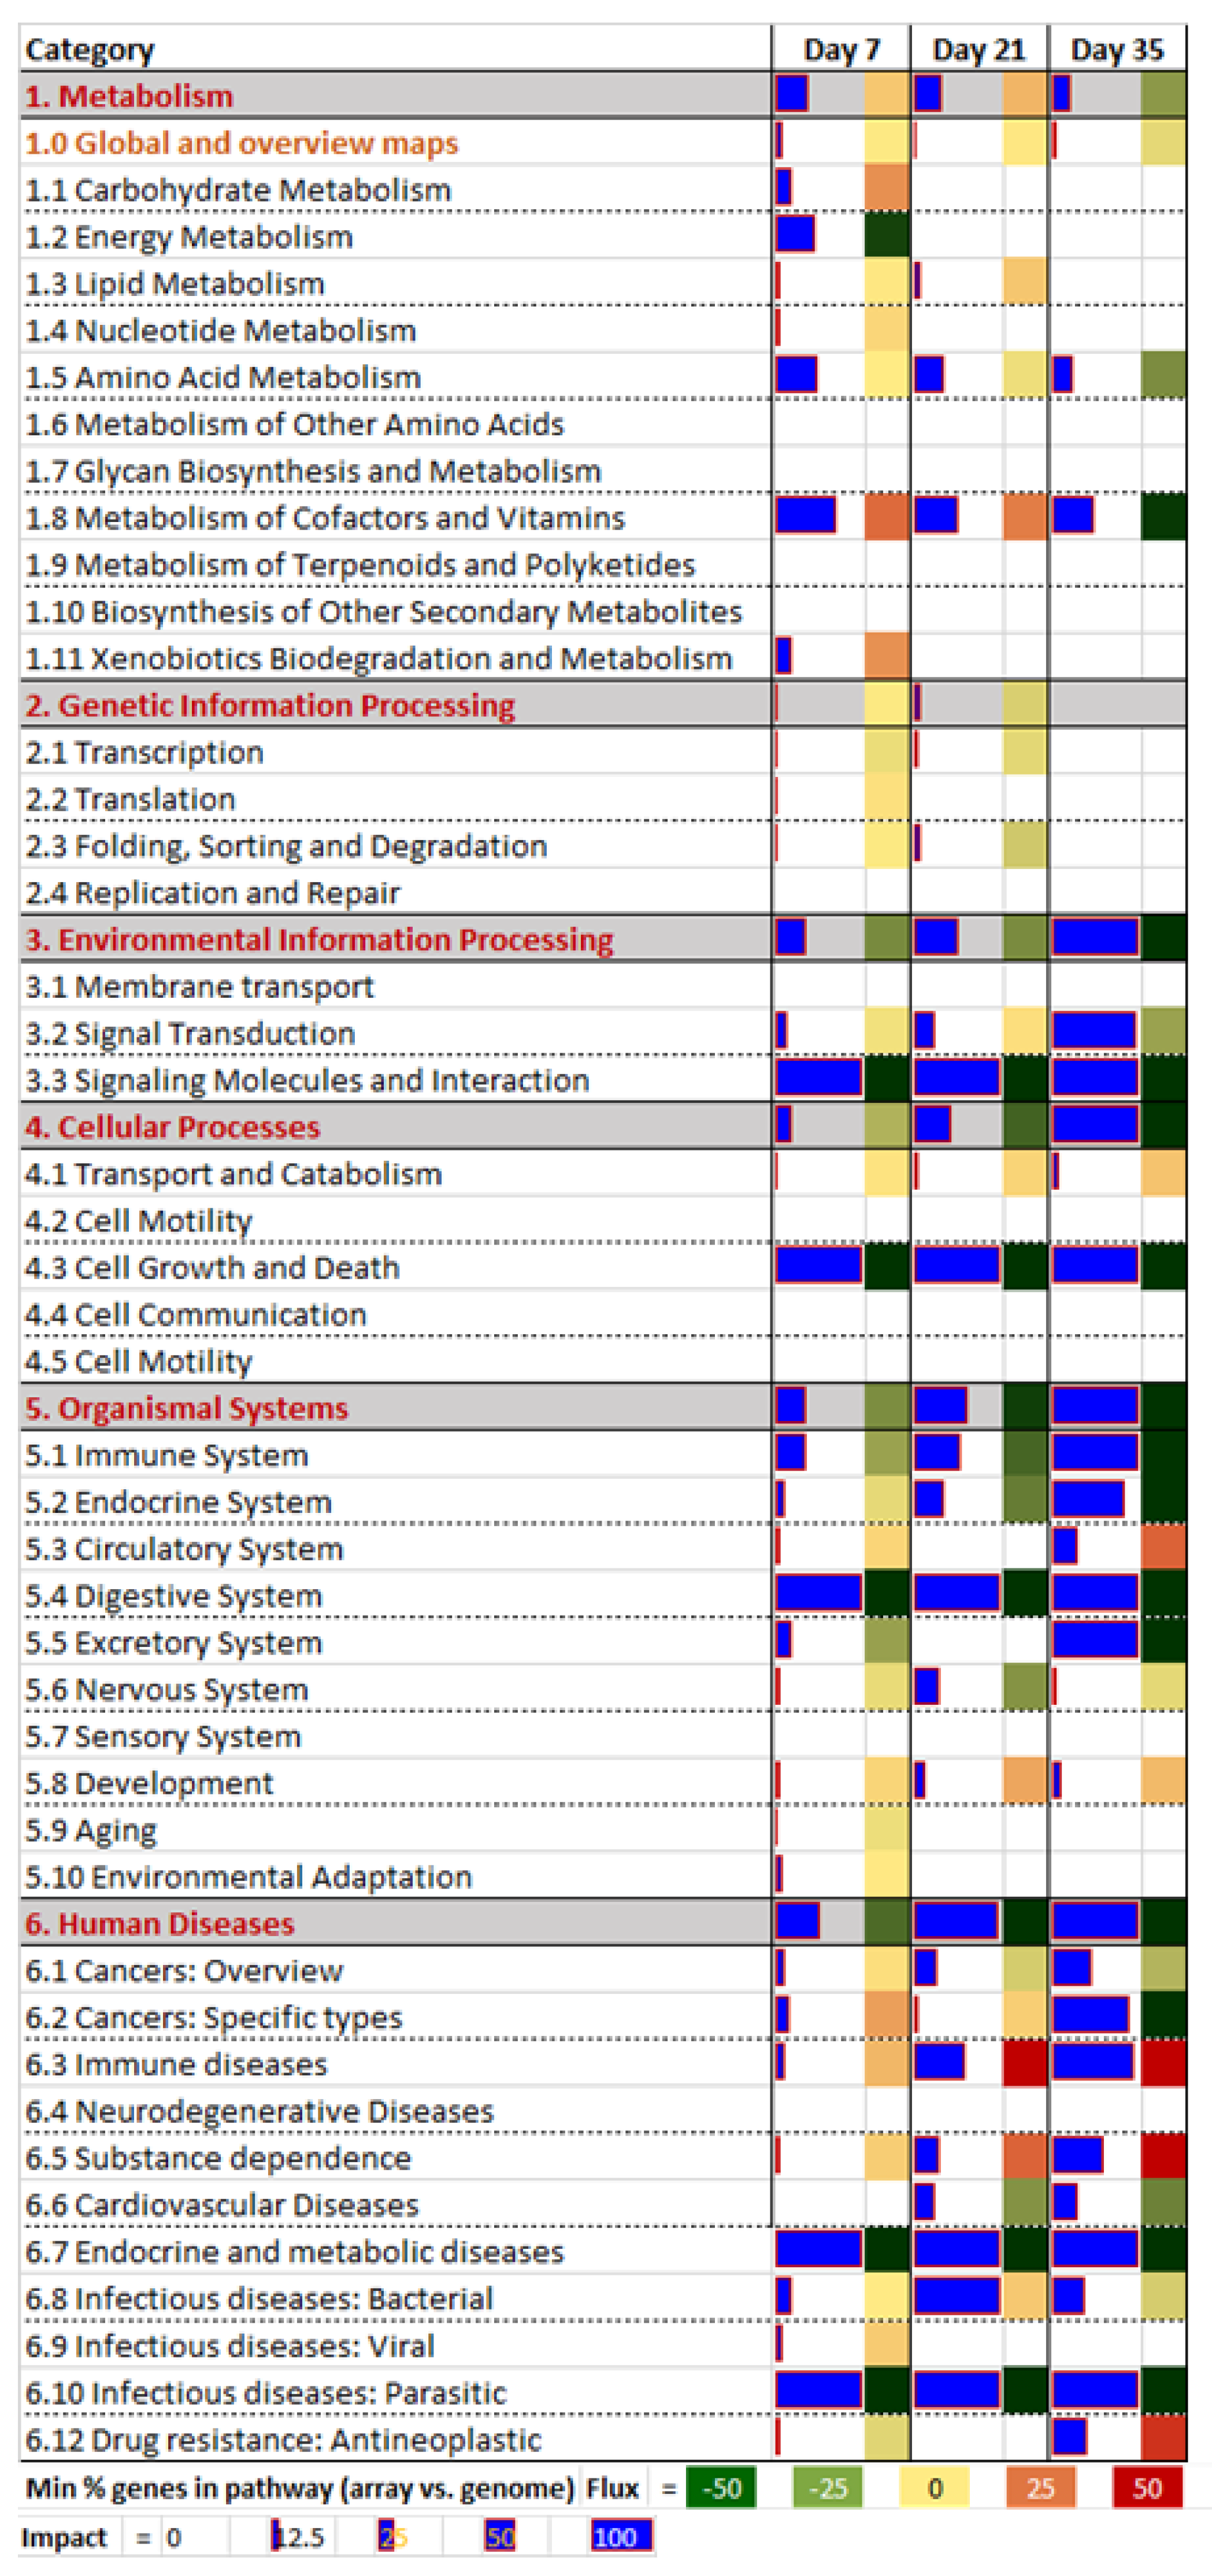
2.3. DIA Results
2.3.1. Human Diseases
2.3.2. Organismal System
2.3.3. Environmental Information Processing
2.3.4. Metabolism
2.4. DAVID Results
2.4.1. Oxygen Transport
2.4.2. Extracellular Matrix and Signaling Pathways
2.4.3. Inflammatory Response, Neutrophil Chemotaxis and Immunoglobulin
3. Conclusions
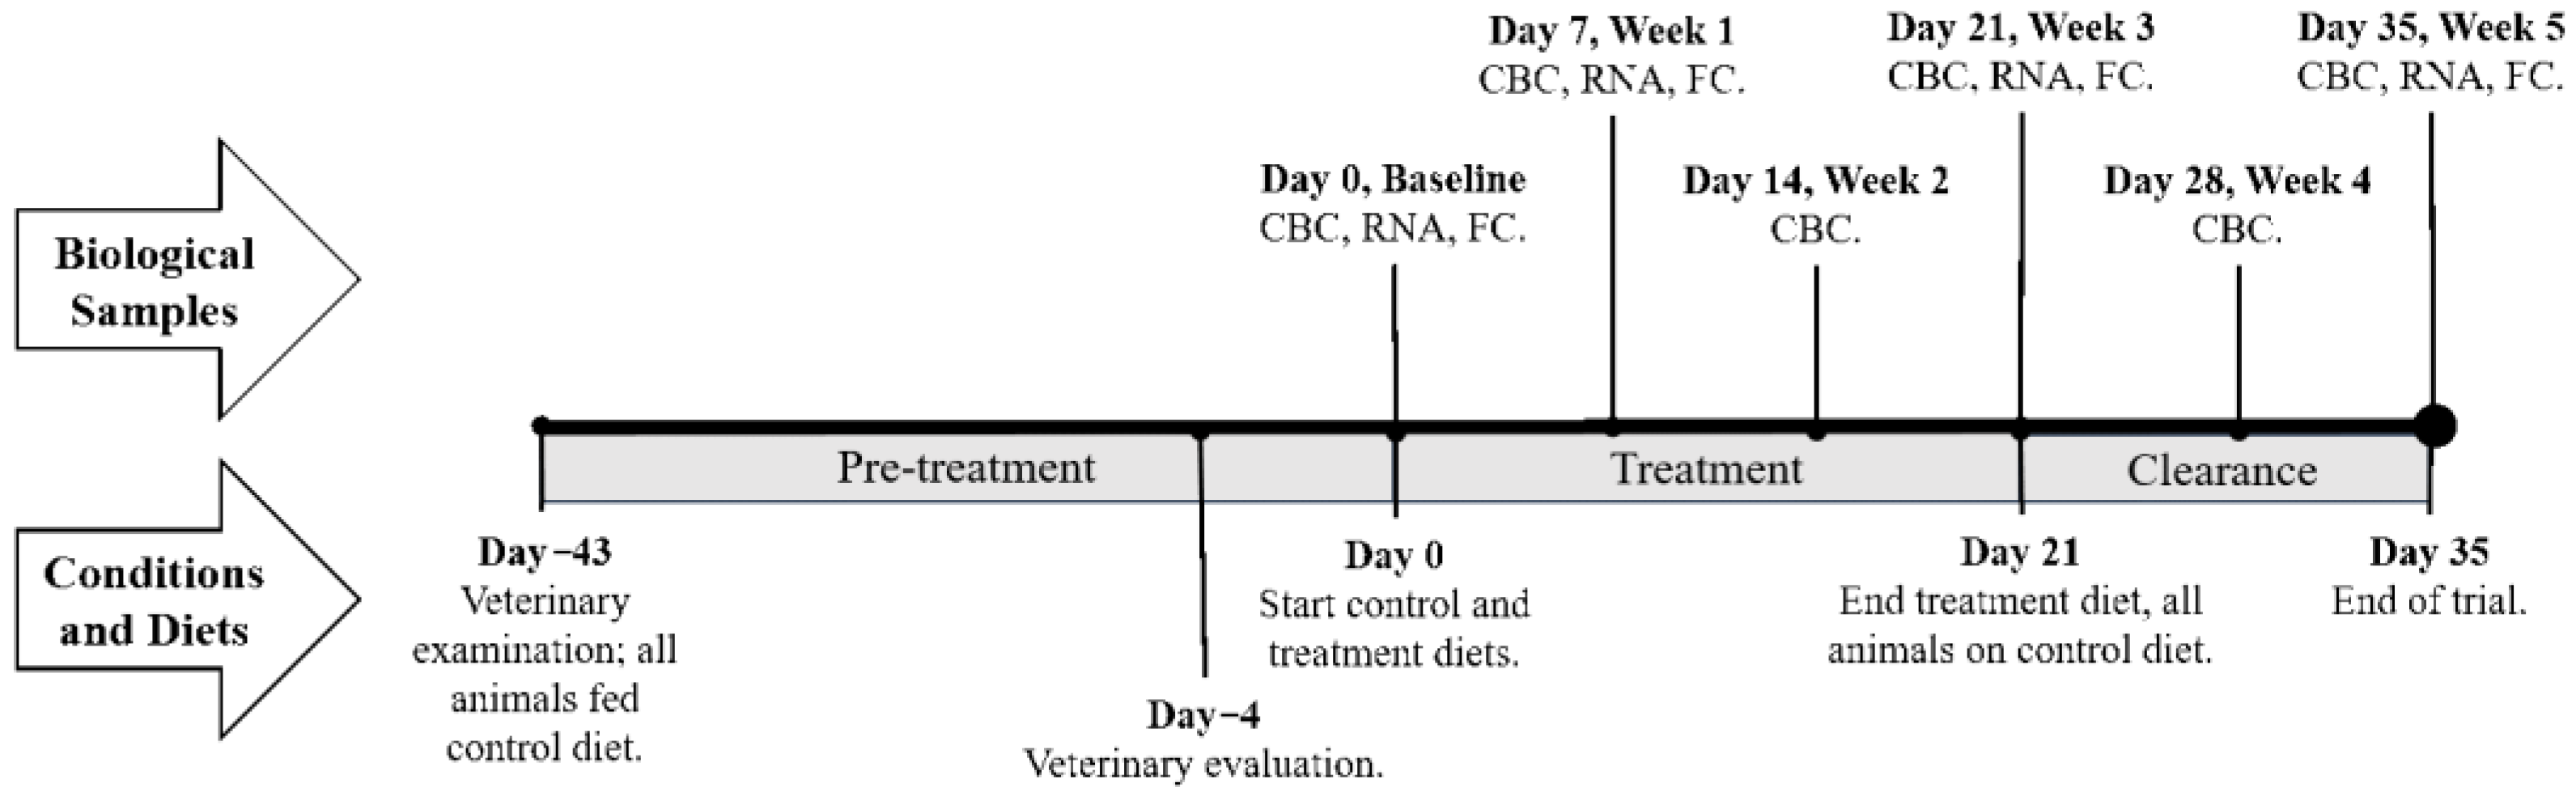
4. Materials and Methods
4.1. Study Design and Diet Formulation
4.2. Blood Collection
4.3. Reagents and Laboratory Conditions
4.4. RNA Isolation, Sequencing, and Pathway Analysis
4.5. Bioinformatics Analyses
4.6. Phagocytosis and Oxidative Burst
4.7. Data Handling and Statistical Analysis
Supplementary Materials
Author Contributions
Funding
Institutional Review Board Statement
Acknowledgments
Conflicts of Interest
References
- Bondy, G.S.; Pestka, J.J. Immunomodulation by Fungal Toxins. J. Toxicol. Environ. Health B Crit. Rev. 2000, 3, 109–143. [Google Scholar] [CrossRef] [PubMed]
- Trenholm, H.; Hamilton, R.; Friend, D.; Thompson, B.; Hartin, K. Feeding Trials with Vomitoxin (Deoxynivalenol)-Contaminated Wheat—Effects on Swine, Poultry, and Dairy-Cattle. J. Am. Vet. Med. Assoc. 1984, 185, 527–531. [Google Scholar]
- Gruber-Dorninger, C.; Jenkins, T.; Schatzmayr, G. Global Mycotoxin Occurrence in Feed: A Ten-Year Survey. Toxins 2019, 11, 375. [Google Scholar] [CrossRef] [PubMed] [Green Version]
- Streit, E.; Naehrer, K.; Rodrigues, I.; Schatzmayr, G. Mycotoxin Occurrence in Feed and Feed Raw Materials Worldwide: Long-Term Analysis with Special Focus on Europe and Asia. J. Sci. Food Agric. 2013, 93, 2892–2899. [Google Scholar] [CrossRef] [PubMed]
- U.S. Grains Council. Corn Harvest Quality Report 2016-17. 2016. Available online: https://grains.org/corn_report/corn-harvest-quality-report-2015-2016-2/ (accessed on 15 January 2021).
- Baker, D.C.; Rottinghaus, G.E. Chronic Experimental Fumonisin Intoxication of Calves. J. Vet. Diagn. Invest. 1999, 11, 289–292. [Google Scholar] [CrossRef] [PubMed] [Green Version]
- Dänicke, S.; Matthäus, K.; Lebzien, P.; Valenta, H.; Stemme, K.; Ueberschär, K.-H.; Razzazi-Fazeli, E.; Böhm, J.; Flachowsky, G. Effects of Fusarium Toxin-Contaminated Wheat Grain on Nutrient Turnover, Microbial Protein Synthesis and Metabolism of Deoxynivalenol and Zearalenone in the Rumen of Dairy Cows. J. Anim. Physiol. Anim. Nutr. 2005, 89, 303–315. [Google Scholar] [CrossRef] [PubMed]
- Dänicke, S.; Winkler, J.; Meyer, U.; Kersten, S.; Wernike, K.; Beer, M.; Frahm, J. Antibody Response of Growing German Holstein Bulls to a Vaccination against Bovine Viral Diarrhea Virus (BVDV) Is Influenced by Fusarium Toxin Exposure in a Non-Linear Fashion. Mycotoxin Res. 2018, 34, 123–139. [Google Scholar] [CrossRef] [PubMed] [Green Version]
- Korosteleva, S.N.; Smith, T.K.; Boermans, H.J. Effects of Feedborne Fusarium Mycotoxins on the Performance, Metabolism, and Immunity of Dairy Cows. J. Dairy Sci. 2007, 90, 3867–3873. [Google Scholar] [CrossRef]
- Gallo, A.; Giuberti, G.; Frisvad, J.C.; Bertuzzi, T.; Nielsen, K.F. Review on Mycotoxin Issues in Ruminants: Occurrence in Forages, Effects of Mycotoxin Ingestion on Health Status and Animal Performance and Practical Strategies to Counteract Their Negative Effects. Toxins 2015, 7, 3057–3111. [Google Scholar] [CrossRef]
- Pestka, J.J. Mechanisms of Deoxynivalenol-Induced Gene Expression and Apoptosis. Food Addit. Contam. Part Chem. Anal. Control Expo. Risk Assess. 2008, 25, 1128–1140. [Google Scholar] [CrossRef]
- Awad, W.A.; Ruhnau, D.; Hess, C.; Doupovec, B.; Schatzmayr, D.; Hess, M. Feeding of Deoxynivalenol Increases the Intestinal Paracellular Permeability of Broiler Chickens. Arch. Toxicol. 2019, 93, 2057–2064. [Google Scholar] [CrossRef] [Green Version]
- Novak, B.; Vatzia, E.; Springler, A.; Pierron, A.; Gerner, W.; Reisinger, N.; Hessenberger, S.; Schatzmayr, G.; Mayer, E. Bovine Peripheral Blood Mononuclear Cells Are More Sensitive to Deoxynivalenol than Those Derived from Poultry and Swine. Toxins 2018, 10, 152. [Google Scholar] [CrossRef] [Green Version]
- Taranu, I.; Marina, D.E.; Burlacu, R.; Pinton, P.; Damian, V.; Oswald, I.P. Comparative Aspects of in Vitro Proliferation of Human and Porcine Lymphocytes Exposed to Mycotoxins. Arch. Anim. Nutr. 2010, 64, 383–393. [Google Scholar] [CrossRef]
- Xu, L.; Eicher, S.D.; Applegate, T.J. Effects of Increasing Dietary Concentrations of Corn Naturally Contaminated with Deoxynivalenol on Broiler and Turkey Poult Performance and Response to Lipopolysaccharide. Poult. Sci. 2011, 90, 2766–2774. [Google Scholar] [CrossRef]
- Osweiler, G.D.; Kehrli, M.E.; Stabel, J.R.; Thurston, J.R.; Ross, P.F.; Wilson, T.M. Effects of Fumonisin-Contaminated Corn Screenings on Growth and Health of Feeder Calves. J. Anim. Sci. 1993, 71, 459–466. [Google Scholar] [CrossRef] [PubMed]
- Wang, E.; Norred, W.P.; Bacon, C.W.; Riley, R.T.; Merrill, A.H. Inhibition of Sphingolipid Biosynthesis by Fumonisins. Implications for Diseases Associated with Fusarium Moniliforme. J. Biol. Chem. 1991, 266, 14486–14490. [Google Scholar] [CrossRef]
- Yin, J.J.; Smith, M.J.; Eppley, R.M.; Page, S.W.; Sphon, J.A. Effects of Fumonisin B1 on Oxygen Transport in Membranes. Biochem. Biophys. Res. Commun. 1996, 225, 250–255. [Google Scholar] [CrossRef] [PubMed]
- Reddy, K.E.; Jeong, J.Y.; Lee, Y.; Lee, H.-J.; Kim, M.S.; Kim, D.-W.; Jung, H.J.; Choe, C.; Oh, Y.K.; Lee, S.D. Deoxynivalenol- and Zearalenone-Contaminated Feeds Alter Gene Expression Profiles in the Livers of Piglets. Asian-Australas. J. Anim. Sci. 2018, 31, 595–606. [Google Scholar] [CrossRef] [PubMed] [Green Version]
- Fernández-Blanco, C.; Frizzell, C.; Shannon, M.; Ruiz, M.-J.; Connolly, L. An in Vitro Investigation on the Cytotoxic and Nuclear Receptor Transcriptional Activity of the Mycotoxins Fumonisin B1 and Beauvericin. Toxicol. Lett. 2016, 257, 1–10. [Google Scholar] [CrossRef] [Green Version]
- He, K.; Zhou, H.-R.; Pestka, J.J. Targets and Intracellular Signaling Mechanisms for Deoxynivalenol-Induced Ribosomal RNA Cleavage. Toxicol. Sci. Off. J. Soc. Toxicol. 2012, 127, 382–390. [Google Scholar] [CrossRef] [Green Version]
- Pestka, J.J.; Islam, Z.; Amuzie, C.J. Immunochemical Assessment of Deoxynivalenol Tissue Distribution Following Oral Exposure in the Mouse. Toxicol. Lett. 2008, 178, 83–87. [Google Scholar] [CrossRef] [PubMed] [Green Version]
- Prelusky, D.B.; Trenholm, H.L.; Savard, M.E. Pharmacokinetic Fate of 14C-Labelled Fumonisin B1 in Swine. Nat. Toxins 1994, 2, 73–80. [Google Scholar] [CrossRef] [PubMed]
- Duringer, J.M.; Roberts, H.l.; Doupovec, B.; Faas, J.; Estill, C.T.; Jiang, D.; Schatzmayr, D. Effects of Deoxynivalenol and Fumonisins Fed in Combination on Beef Cattle: Health and Performance Indices. World Mycotoxin J. 2020, 13, 533–543. [Google Scholar] [CrossRef]
- Vatzia, E.; Pierron, A.; Hoog, A.M.; Saalmüller, A.; Mayer, E.; Gerner, W. Deoxynivalenol Has the Capacity to Increase Transcription Factor Expression and Cytokine Production in Porcine T Cells. Front. Immunol. 2020, 11, 2009. [Google Scholar] [CrossRef]
- Kierdorf, K.; Fritz, G. RAGE Regulation and Signaling in Inflammation and Beyond. J. Leukoc. Biol. 2013, 94, 55–68. [Google Scholar] [CrossRef]
- Cox, D.; Kerrigan, S.W.; Watson, S.P. Platelets and the Innate Immune System: Mechanisms of Bacterial-Induced Platelet Activation. J. Thromb. Haemost. JTH 2011, 9, 1097–1107. [Google Scholar] [CrossRef]
- Del Favero, G.; Woelflingseder, L.; Janker, L.; Neuditschko, B.; Seriani, S.; Gallina, P.; Sbaizero, O.; Gerner, C.; Marko, D. Deoxynivalenol Induces Structural Alterations in Epidermoid Carcinoma Cells A431 and Impairs the Response to Biomechanical Stimulation. Sci. Rep. 2018, 8, 11351. [Google Scholar] [CrossRef] [Green Version]
- van Kol, S.W.M.; Hendriksen, P.J.M.; van Loveren, H.; Peijnenburg, A. The Effects of Deoxynivalenol on Gene Expression in the Murine Thymus. Toxicol. Appl. Pharmacol. 2011, 250, 299–311. [Google Scholar] [CrossRef] [Green Version]
- Christofides, A.; Konstantinidou, E.; Jani, C.; Boussiotis, V.A. The Role of Peroxisome Proliferator-Activated Receptors (PPAR) in Immune Responses. Metabolism 2021, 114, 154338. [Google Scholar] [CrossRef]
- Harjunpää, H.; Llort Asens, M.; Guenther, C.; Fagerholm, S.C. Cell Adhesion Molecules and Their Roles and Regulation in the Immune and Tumor Microenvironment. Front. Immunol. 2019, 10, 1078. [Google Scholar] [CrossRef] [Green Version]
- Weichhart, T.; Säemann, M.D. The PI3K/Akt/MTOR Pathway in Innate Immune Cells: Emerging Therapeutic Applications. Ann. Rheum. Dis. 2008, 67, iii70–iii74. [Google Scholar] [CrossRef]
- Rose, D.M.; Liu, S.; Woodside, D.G.; Han, J.; Schlaepfer, D.D.; Ginsberg, M.H. Paxillin Binding to the A4 Integrin Subunit Stimulates LFA-1 (Integrin ALβ2)-Dependent T Cell Migration by Augmenting the Activation of Focal Adhesion Kinase/Proline-Rich Tyrosine Kinase-2. J. Immunol. 2003, 170, 5912–5918. [Google Scholar] [CrossRef] [Green Version]
- Zimin, A.V.; Delcher, A.L.; Florea, L.; Kelley, D.R.; Schatz, M.C.; Puiu, D.; Hanrahan, F.; Pertea, G.; Van Tassell, C.P.; Sonstegard, T.S.; et al. A Whole-Genome Assembly of the Domestic Cow, Bos Taurus. Genome Biol. 2009, 10, R42. [Google Scholar] [CrossRef] [Green Version]
- Bray, N.L.; Pimentel, H.; Melsted, P.; Pachter, L. Near-Optimal Probabilistic RNA-Seq Quantification. Nat. Biotechnol. 2016, 34, 525–527. [Google Scholar] [CrossRef]
- Soneson, C.; Love, M.I.; Robinson, M.D. Differential Analyses for RNA-Seq: Transcript-Level Estimates Improve Gene-Level Inferences. F1000Research 2015, 4, 1521. [Google Scholar] [CrossRef] [PubMed]
- Bionaz, M.; Periasamy, K.; Rodriguez-Zas, S.L.; Hurley, W.L.; Loor, J.J. A Novel Dynamic Impact Approach (DIA) for Functional Analysis of Time-Course Omics Studies: Validation Using the Bovine Mammary Transcriptome. PLoS ONE 2012, 7, e32455. [Google Scholar] [CrossRef] [Green Version]
- Huang, D.W.; Sherman, B.T.; Lempicki, R.A. Bioinformatics Enrichment Tools: Paths toward the Comprehensive Functional Analysis of Large Gene Lists. Nucleic Acids Res. 2009, 37, 1–13. [Google Scholar] [CrossRef] [PubMed] [Green Version]
- Huang, D.W.; Sherman, B.T.; Lempicki, R.A. Systematic and Integrative Analysis of Large Gene Lists Using DAVID Bioinformatics Resources. Nat. Protoc. 2009, 4, 44–57. [Google Scholar] [CrossRef]
- Fletez-Brant, K.; Špidlen, J.; Brinkman, R.R.; Roederer, M.; Chattopadhyay, P.K. FlowClean: Automated Identification and Removal of Fluorescence Anomalies in Flow Cytometry Data. Cytom. Part J. Int. Soc. Anal. Cytol. 2016, 89, 461–471. [Google Scholar] [CrossRef] [PubMed]
- Overton, W.R. Modified Histogram Subtraction Technique for Analysis of Flow Cytometry Data. Cytometry 1988, 9, 619–626. [Google Scholar] [CrossRef] [Green Version]
- R Core Team. R: A Language and Environment for Statistical Computing; R Foundation for Statistical Computing: Vienna, Austria, 2019. [Google Scholar]
- McCarthy, D.J.; Chen, Y.; Smyth, G.K. Differential Expression Analysis of Multifactor RNA-Seq Experiments with Respect to Biological Variation. Nucleic Acids Res. 2012, 40, 4288–4297. [Google Scholar] [CrossRef] [Green Version]
- Ritchie, M.E.; Phipson, B.; Wu, D.; Hu, Y.; Law, C.W.; Shi, W.; Smyth, G.K. Limma Powers Differential Expression Analyses for RNA-Sequencing and Microarray Studies. Nucleic Acids Res. 2015, 43, e47. [Google Scholar] [CrossRef] [PubMed]
- Robinson, M.D.; McCarthy, D.J.; Smyth, G.K. EdgeR: A Bioconductor Package for Differential Expression Analysis of Digital Gene Expression Data. Bioinformatics 2010, 26, 139–140. [Google Scholar] [CrossRef] [PubMed] [Green Version]


Publisher’s Note: MDPI stays neutral with regard to jurisdictional claims in published maps and institutional affiliations. |
© 2021 by the authors. Licensee MDPI, Basel, Switzerland. This article is an open access article distributed under the terms and conditions of the Creative Commons Attribution (CC BY) license (https://creativecommons.org/licenses/by/4.0/).
Share and Cite
Roberts, H.L.; Bionaz, M.; Jiang, D.; Doupovec, B.; Faas, J.; Estill, C.T.; Schatzmayr, D.; Duringer, J.M. Effects of Deoxynivalenol and Fumonisins Fed in Combination to Beef Cattle: Immunotoxicity and Gene Expression. Toxins 2021, 13, 714. https://doi.org/10.3390/toxins13100714
Roberts HL, Bionaz M, Jiang D, Doupovec B, Faas J, Estill CT, Schatzmayr D, Duringer JM. Effects of Deoxynivalenol and Fumonisins Fed in Combination to Beef Cattle: Immunotoxicity and Gene Expression. Toxins. 2021; 13(10):714. https://doi.org/10.3390/toxins13100714
Chicago/Turabian StyleRoberts, Heaven L., Massimo Bionaz, Duo Jiang, Barbara Doupovec, Johannes Faas, Charles T. Estill, Dian Schatzmayr, and Jennifer M. Duringer. 2021. "Effects of Deoxynivalenol and Fumonisins Fed in Combination to Beef Cattle: Immunotoxicity and Gene Expression" Toxins 13, no. 10: 714. https://doi.org/10.3390/toxins13100714
APA StyleRoberts, H. L., Bionaz, M., Jiang, D., Doupovec, B., Faas, J., Estill, C. T., Schatzmayr, D., & Duringer, J. M. (2021). Effects of Deoxynivalenol and Fumonisins Fed in Combination to Beef Cattle: Immunotoxicity and Gene Expression. Toxins, 13(10), 714. https://doi.org/10.3390/toxins13100714