Article

Metabolic Traits of Bovine Shiga Toxin-Producing Escherichia coli (STEC) Strains with Different Colonization Properties

1
Friedrich-Loeffler-Institut/Federal Research Institute for Animal Health, Institute of Molecular Pathogenesis, Naumburger Str. 96a, 07743 Jena, Germany
2
Free University Berlin, Institute of Microbiology and Epizootics, Robert-von-Ostertag-Str. 7-13, 14163 Berlin, Germany
3
University of Greifswald, Pharmaceutical Microbiology, Friedrich-Ludwig-Jahn-Str. 17, 17489 Greifswald, Germany
*
Author to whom correspondence should be addressed.
In memoriam.
Toxins 2020, 12(6), 414; https://doi.org/10.3390/toxins12060414
Submission received: 15 May 2020 / Revised: 10 June 2020 / Accepted: 17 June 2020 / Published: 22 June 2020

Abstract

:
Cattle harbor Shiga toxin-producing Escherichia coli (STEC) in their intestinal tract, thereby providing these microorganisms with an ecological niche, but without this colonization leading to any clinical signs. In a preceding study, genotypic characterization of bovine STEC isolates unveiled that their ability to colonize cattle persistently (STECper) or only sporadically (STECspo) is more closely associated with the overall composition of the accessory rather than the core genome. However, the colonization pattern could not be unequivocally linked to the possession of classical virulence genes. This study aimed at assessing, therefore, if the presence of certain phenotypic traits in the strains determines their colonization pattern and if these can be traced back to distinctive genetic features. STECspo strains produced significantly more biofilm than STECper when incubated at lower temperatures. Key substrates, the metabolism of which showed a significant association with colonization type, were glyoxylic acid and L-rhamnose, which were utilized by STECspo, but not or only by some STECper. Genomic sequences of the respective glc and rha operons contained mutations and frameshifts in uptake and/or regulatory genes, particularly in STECper. These findings suggest that STECspo conserved features leveraging survival in the environment, whereas the acquisition of a persistent colonization phenotype in the cattle reservoir was accompanied by the loss of metabolic properties and genomic mutations in the underlying genetic pathways.
Key Contribution: This manuscript links, for the first time, persistent colonization of STEC strains in the cattle reservoir to the loss of phenotypic properties because of mutations in the underlying genetic pathways. Not being classical virulence factors, these specific traits of strains with enhanced adaptation to the main animal reservoir may represent a basis for differentiation between strongly and weakly colonizing STEC strains and foster the development of novel intervention measures against these human pathogens at the level of the reservoir host.

1. Introduction

Enterohemorrhagic Escherichia coli (EHEC), a subgroup of Shiga toxin-producing E. coli (STEC), pose a risk to humans, especially infants and children, by causing diseases ranging from mild diarrhea to life-threatening hemorrhagic uremic syndrome (HUS). The STEC pathovar consists of a plethora of different strains sharing a single property, the eponymous, highly toxic Shiga toxin (Stx). This protein exists in two serologically differentiable forms, Stx1 and Stx2, which can be further divided into subtypes (Stx1a, Stx1c, Stx1d, and Stx2a through Stx2h) [1,2]. Besides Stx, STEC strains may possess additional virulence traits such as adhesion factors, protein secretion systems or additional toxins, partially encoded on mobile genetic elements, such as plasmids or pathogenicity islands. The resulting very high genomic flexibility of this pathovar is reflected by the fact that strains from more than 400 different E. coli serotypes are known to encode Stx. Yet, only very few of these, including those possessing O-antigens O26, O45, O103, O111, O121, O145, and O157 [3], are responsible for the majority of the human infections.
Cattle harbor STEC in their intestinal tract without displaying any clinical symptoms, thereby providing an ecological niche for the bacteria. Numerous attempts have been undertaken to subdivide the many different STEC strains that are shed by cattle in order to predict a given strain’s degree of threat to human health. Various levels of host adaptation could be traced back to certain patterns of virulence genes and their expression levels. EHEC O157:H7 strains, e.g., were found to express iha, espA, rfbE, and ehxA to different extents upon natural infections of humans and cattle [4]. Spontaneous Stx production is higher in HUS-associated EHEC clones than in bovine STEC isolates, and Stx1 production is induced more strongly by iron deprivation in vitro in the former [5]. A lower capacity to produce Stx2 in bovine STEC correlates with the presence of the Q21 allele of the late antiterminator Q upstream of stx in the genome of stx-converting prophages, whereas strongly inducible Stx production seems to be linked to the Q933 allele [6]. Indeed, a support vector machine analysis of bovine E. coli O157 isolate sequences, by comparison with sequences from human isolates, identified cattle strains more likely to be a serious threat to human health [7]. Distinction was possible despite the fact that the majority of the isolates considered were members of previously defined pathogenic lineages and encoded key virulence factors. The major differences between human and bovine E. coli O157 isolates were the relative abundances of predicted prophage proteins. However, the predictive value for human pathogenicity of such analyses was severely questioned by the appearance of unusual EHEC strains possessing a blended virulence profile combining genetic patterns of EHEC and human-adapted enteroaggregative E. coli (EAEC), rarely detected in animal hosts before [8,9]. Although the O104:H4 EHEC/EAEC hybrid strain, having caused the 2011 German outbreak, appears to be preferably adapted to humans, the strain’s ability to colonize the intestinal epithelial cells of humans and cattle [10] indicates that even EHEC strains with an unusual genotype can colonize other reservoir hosts. Indeed, the outbreak strain colonizes calves under experimental conditions [11], its genetic markers are present in the cattle population [12], and the strain has been grouped in the midst of bovine commensal strains in a recent comprehensive genome analysis unveiling the evolutionary sources of the emergence of human intestinal pathogenic strains [13].
Although many human EHEC infections originate from ruminants as a direct or an indirect source of infection, the molecular basis of the complex shedding and transmission dynamics of the plethora of STEC strains in animal populations is poorly understood. Cumulative evidence exists that STEC strains isolated from cattle can be subdivided into subsets of strains based on their colonization pattern in the reservoir host. Stx1 and Stx2 have been shown to suppress host-adaptive immune responses [14,15,16] affecting STEC colonization and shedding [17]. Certain Stx subtypes, in particular Stx2a, are epidemiologically associated with increased excretion levels of E. coli O157 from cattle, also known as super-shedding [18,19,20]. Stx2a increases the efficiency of E. coli O157 transmission between animals, presumably because it is more rapidly produced than Stx2c and restricts cellular proliferation of bovine epithelial cells [21]. A previous longitudinal study by our group identified STEC strains belonging to distinct serotypes that were repeatedly isolated from cattle feces over a period of several months, while other strains were isolated only at single or a few time points [22]. This observation allowed us to group these strains into either persistent (STECper) or sporadic (STECspo) colonizers of the bovine intestine. Interestingly, the majority of bovine STECper strains belonged to other serotypes (O156, O165) than those commonly linked to human infections [22,23,24], although O26:H11 were also found to be STECper [25]. An initial genetic analysis of STECper and STECspo strains revealed that the capacity to colonize cattle correlates with the accessory genome and the presence of virulence-associated genes (VAG) and not with the core genome, represented by multilocus sequence typing (MLST) [26]. However, no single genes or gene clusters could be directly associated with the colonization type despite the fact that several genes displayed a significantly higher prevalence in one of the groups. The genes stx1, eae, efa-1, lpfA or several type III secretion system-associated genes are more often found in STECper, while stx2, toxB or cdt are more often present in STECspo.
The subgroup of STECper forms a resilient VAG gene pool within the mixing vessel of the ruminant’s intestine that may build the basis for the evolution of new zoonotic strains. Studying the genomic content of strains provides information on a strain’s potential, but it is mandatory to evaluate which genetic properties are actually translated into phenotypes if we aim at a better understanding of the molecular basis behind the varying lifestyles that STEC strains realize in cattle populations. This includes properties that enable strains to stand out, perhaps as a small proportion of the entire E. coli population, by being able to colonize or survive in particular ecological niches. This might occur through metabolizing special nutrients or macroelements such as a carbon, nitrate, phosphorus or sulfate source, through pronounced acid resistance, or through occupying or even contributing to specific niches, e.g., by biofilm formation. Therefore, we assessed phenotypic properties of 28 STEC strains representing different colonization types, VAG-patterns, and MLSTs, selected as being representative of a set of 178 Illumina whole genome-sequenced STEC strains [26].

2. Results

2.1. Acid Resistance

The ability of the STEC strains to survive at low pH values was tested by incubation of approx. 7.3 log10 colony-forming units (cfu) per mL of each strain in LB broth adjusted to pH 1.5, pH 2.5 and, as control, pH 7.8. Surviving cells were quantified by cfu counts. These showed no general significant differences between the STECper and STECspo isolates (p > 0.05; Table 1), but rather between serotypes. The O156/O182 and O157 STEC strains were highly susceptible to acid stress as the incubation at pH 2.5 strikingly reduced the cfu, and only one strain survived at pH 1.5. In contrast, O26 STEC strains were highly resistant against acidic broth as all four strains withstood exposure to pH 1.5.

2.2. Biofilm, Curli, and Cellulose Production

Analysis of STEC strains in the crystal violet plate assay yielded a broad variety of biofilm formation ability (Figure 1). While some strains markedly produced biofilm, even exceeding that of the positive control E. coli Nissle 1917 (e.g., strains 13E0634, 31E0704, and 13E0659), several strains produced no measurable biofilm (e.g., strains 12E0115, 13E0609, and 13E0611). Interestingly, strains defined as sporadically colonizing STEC produced significantly more biofilm on average when incubated at lower temperatures (20 °C) than STECper (p = 0.016). In contrast, STECper preferentially produced biofilm at 37 °C. O157-STEC strains displayed no or only very little biofilm formation, independent of the incubation temperature.
A search for biofilm-related genes (bcs genes, csg genes, adrA, rpoS, mlrA) in the WGS data of the strains showed only a correlation between the presence and integrity of mlrA in a given strain and its relative ability to form a biofilm (Figure 1).
These results were confirmed by incubation of the strains on Congo red agar (Figure 2). Here, strains with high-level biofilm formation in the crystal violet plate assay (e.g., 13E0591, 13E0634, 13E0704, and 13E0659) showed the production of curli (brown), cellulose (pink) or both (rdar phenotype) at the respective incubation temperature. Analyzing STECper, especially O26 strains, produced biofilm at 37 °C as shown with the rdar phenotype. In STECspo, the rdar phenotype was predominantly found after incubation at 20 or 28 °C. Also, in this assay, the O157 STECspo remained white, indicating no curli or cellulose production, or only exhibited a light brownish color after incubation at 37 °C.

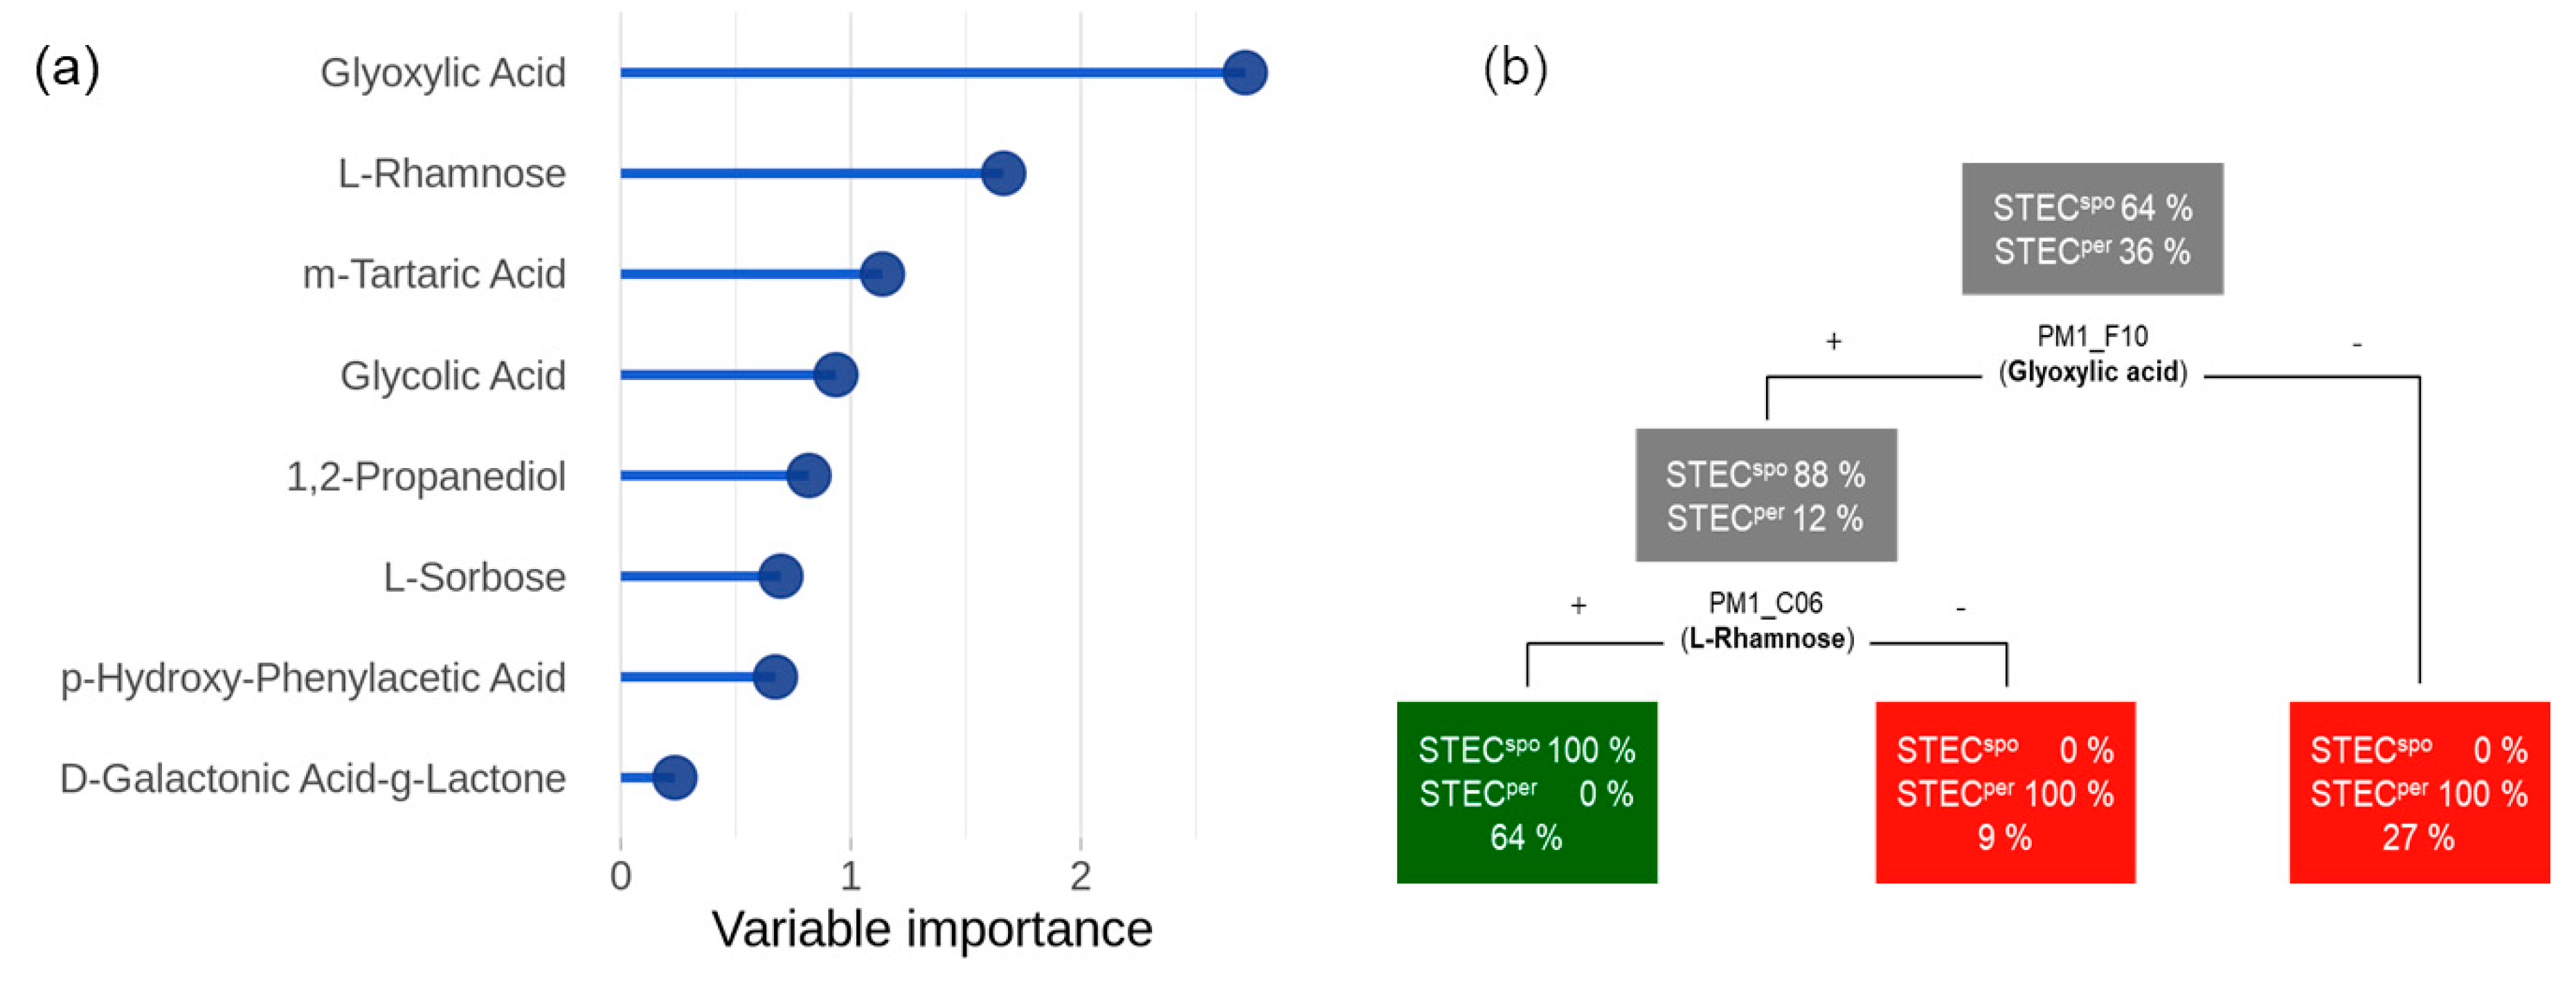
2.3. Metabolic Activity of the Strains and Classification According to Their Colonization Type

Using the Omnilog® phenotype microarray, the strains were tested for their utilization of 190 individual C-, 95 N-, 59 P-, and 35 S-sources during a 48 h incubation period at 37 °C. Inspection of the metabolic activity of the strains on each plate revealed that three strains belonging to the O165/O172 STEC cluster (strains 13E0711, 13E0718, and 13E0812) utilized fewer substrates than the other 25 strains (Figure S1). Interestingly, the fourth strain belonging to this cluster (O165:H25, 13E0734) grew in the presence of nearly half of the substrates and showed a mean metabolic activity comparable to many other strains. To analyze the metabolic patterns, we excluded the three poorly-metabolizing strains and analyzed the 25 remaining strains. In order to take the overall performance as well as the kinetics of substrate utilization into account, an area-under-the-growth curve approach (AUC) was applied, and the analysis was based on an AUC cutoff value of 500 (Table S1). Out of 379 substrates tested, 144 substrates were metabolized by 23 or more strains and 100 substrates were metabolized by no more than three strains. The remaining 135 substrates were metabolized to different extents, including 61 C-sources, 36 N-sources, 11 P-sources, and 27 S-sources, and were included in the further analysis.
To identify substrates that might discriminate between STECper and STECspo, the mean AUC of each variably metabolized substrate was analyzed for significant differences between the two groups by two-sample Wilcoxon tests. As a result, the oxidization of eight C- and of seven S-sources differed significantly between the groups (Figure 3 and Figure S2). Values measured for the S-sources were very low and, although their mean AUC values differed significantly, the value ranges of both groups overlapped notably (Figure S2). Data for the metabolism of S-sources were therefore not analyzed further. In contrast, the value ranges of the metabolic activities determined for all eight C-sources differed significantly between the STECper and STECspo groups (Figure 3).
Only three C-substrates yielded a significantly higher mean AUC value in the STECper group (D-galactonic acid-γ-lactone [PM1_C02], p-hydroxy-phenylacetic acid [4-HPAA, PM1_H02], and L-sorbose [PM2A_D04]), while the remaining five C-substrates were significantly better metabolized by STECspo strains (glyoxylic acid [PM1_F10], glycolic acid [PM1_F09], tartaric acid [PM1_E02], 1,2-propanediol [PM1_D04], and L-rhamnose [PM1_C06]). Interestingly, three of the latter substrates (glyoxylic acid, glycolic acid, and tartaric acid) can be allocated to a single metabolic pathway, namely, glyoxylate metabolism.
Substrates with significant discriminating power in the statistical tests were further investigated by classification analysis. In a first step, we transformed the normalized AUC growth values according to the cutoff value of 500 into binary values (“positive” versus “negative”). This step resulted in a binary data matrix, which served as input for all following procedures. The matrix consisted of eight columns (discriminatory C-substrates) and 25 rows (STEC strains) and is visualized by a binary heatmap (Figure 4). Agglomerative clustering of the rows illustrated a clear separation of persistent and sporadic colonizers in the row dendrogram.
However, a perfect discrimination between the colonization classes was not possible using just a single feature. Therefore, we conducted a multivariate classification with the objective to (1) identify relevant discriminatory substrates and (2) quantify their capability to predict the colonization type correctly. Using the random forest method, a ranked feature list ordered by variable importance was generated (Figure 5a). The most important feature was glyoxylic acid, followed by L-rhamnose and m-tartaric acid. A random forest classifier trained on the top feature (glyoxylic acid) resulted in a receiver operating characteristic (ROC) AUC value of 0.81 (95% CI: 0.77 to 0.84). Adding L-rhamnose to the training matrix increased the classification power up to 1.00 (95% CI: 0.99 to 1.00). Therefore, we considered glyoxylic acid and L-rhamnose as a minimal set in order to permit reliable predictions concerning the colonization type of an STEC strain. To analyze the decision process, we trained a single decision tree on the entire dataset (Figure 5b). This tree suggests that a strain is classified as STECper if it is either unable to metabolize glyoxylic acid or is capable of glyoxylic acid utilization but negative for L-rhamnose. Conversely, STECspo are strains which are positive for both glyoxylic acid and L-rhamnose metabolizing capability.
To verify the results obtained with the discriminatory substrates glyoxylic acid and L-rhamnose in the Omnilog® system, we tested all 28 representative strains in M9 minimal medium supplemented with either of the substrates. The growth kinetics were measured for 24 h, and the AUC was calculated for each STEC strain. For direct comparison, we used the AUC of the Omnilog® experiments also including only the first 24 h of the incubation. Resulting Pearson’s correlation coefficients showed that the results of both test systems corresponded well (Figure S3), as the mean AUC values of both test systems correlated at r = 0.822 (y = 0.1547x − 385.47) using glyoxylic acid as the C source and at r = 0.802 (y = 0.2475x − 267.77) when L-rhamnose was present.

2.4. Genetic Basis for Key Metabolic Reactions

As glyoxylic acid and L-rhamnose were identified to be key substrates for the classification of STECper and STECspo, we checked the genetic organization of the strains with respect to the enzymes involved in the respective metabolic pathways.
Analysis of the glc operon, which is involved in glycolate utilization, shows that glcA, encoding the permease for glycolate uptake [27], was missing (O26, O157), disrupted (O182) or truncated by a frameshift (O165, O172) in nearly all STEC strains deficient in glycolate-, glyoxylate- or tartrate-dependent metabolism (Figure 6). Despite their inability to grow on glyoxylic acid, the O156-STECper strains possess a complete glc operon, while, in contrast, no O157 STECspo possess a glc operon, but were positive for glyoxylic acid metabolism. Of note, all O26 STECper strains were indistinguishable in the genetic organization of the operon, although two strains were glycolic and glyoxylic acid positive in the Omnilog® assay and two strains were not (Figure 7).
We also assessed the Illumina sequences of the STEC strains for the presence of rhaT, the gene encoding the rhamnose/proton symporter [28], responsible for rhamnose uptake, rhaS/rhaR, the transcriptional activators of rhaT expression [29], as well as the genes rhaB, rhaA, rhaD, and rhaM encoding proteins involved in rhamnose catabolism [30]. This revealed that the deficiency of O26 STECper to utilize rhamnose correlates with a frameshift in rhaS and that of O165/O172 STECper with a frameshift in rhaR, both resulting in truncated transcriptional activator proteins. All four O157 STECspo strains had a frameshift in the rhaT gene, resulting in an N-terminally truncated symporter protein, but tested positive in the phenotype microarray for rhamnose utilization.

3. Discussion

Cattle are the most relevant source of human EHEC infections, and the majority of cattle are believed to harbor STEC strains. Evidence exists that, under farming conditions, shedding and transmission dynamics differ between STEC strains in the bovine reservoir [33,34,35], yet the molecular basis for certain colonization and shedding patterns is only recently being unveiled [7]. Longitudinal studies examining fecal shedding of STEC by the bovine reservoir host allowed us to distinguish two different groups of STEC: strains isolated either over several weeks or months and therefore designated as persistent colonizing STEC strains (STECper) or STEC strains excreted only for short time periods, referred to as sporadic colonizers (STECspo) [22]. Subsequent studies failed to link distinct genetic markers with the colonization type of the strains [26]. Moreover, the genetic distance between the different geno-serotype groups of STECper strains [36] was greater to each other than to the STECspo strains, indicating a more distinct and separate evolution. In order to disclose commonalities of strains exhibiting one of either colonization habits, phenotypic differences between the persisting and sporadic colonizing strains were looked for in the present study.
Some STEC strains possess a very low infectious dose of less than 100 bacteria in humans [37]. One factor contributing to such a low infectious dose might be an enhanced acid tolerance that enables the pathogen to survive the passage through the human stomach without gross damage. In the adult cow’s four forestomachs, only the abomasum exhibits an acidic milieu with pH 2–2.5 in its lumen [38,39], similar to the pH value of 1.5–2 in the human monogastric stomach [40]. Based on this, it is tempting to assume that strains traversing more frequently through the stomach or abomasum, i.e., STECspo strains, exhibit a higher acid tolerance than persisting strains. In E. coli, several acid resistance systems (AR) have been described: one oxidative system that is repressed by a yet unknown glucose metabolite and regulated by RpoS (named AR1) and systems based on the decarboxylation of amino acids (the glutamate [AR2 or GDAR], the arginine [AR3, ADAR], the lysine [AR4, LDAR] or the ornithine system [ODAR]) [41]. The assay setup used here (LB broth, aerobic incubation) primarily monitors the functionality of the AR1 system [42], which is the AR system that provides the bacteria with the highest level of protection, functioning at pH 2 or even less [43]. Accordingly, STEC strains analyzed in this study with a truncation or complete deletion of the rpoS gene displayed either no or only reduced acid resistance. Overall, testing revealed no clear correlation between colonization type and acid resistance of the strains, since the STECper group comprised both, strains with the highest and the lowest acid tolerance. However, the rpoS gene is probably non-functional in five out of eleven STECper tested (45.5%), but only in three out of 14 STECspo strains (21.4%). This supports our hypothesis that the potential of the strains to adjust to milieu changes via the global regulator RpoS that regulates acid resistance, among other stress conditions, might be more important in STECspo than in STECper. Mutations in rpoS are common in E. coli and STEC isolates and are assumed to reflect an increased ability to scavenge for scarce nutrients at the expense of stress protection (see [44] and references cited therein). Analysis of O157:H7 isolates related to a spinach-associated outbreak revealed the presence of rpoS mutations in clinical isolates as opposed to the wild-type allele found in strains from environmental sources. The niche associated with the selection for the mutants was not identified [44].
Strains with a shorter retention time in the host must, in turn, have strategies to survive in the environment, while strains persisting in the gut need to adapt to this niche. Biofilms can serve to protect the E. coli strains from adverse conditions either within the host or outside in the environment. Biofilm formation by E. coli mainly relies on the production of cellulose (encoded in the bcs gene cluster) and curli (encoded by the csg genes) [45,46]. Expression of both requires CsgD, a transcriptional regulator directly inducing the csgBAC operon and indirectly inducing cellulose production by enhanced adrA transcription [47]. The signal cascade to regulate csgD additionally includes the rpoS-encoded sigma factor as well as MlrA [48,49]. To monitor host- versus environment-adapted conditions, we varied the incubation temperature from 20 °C (approximated environmental conditions) to 37 °C (approximated conditions inside the host). The STECspo strains seemed to be better adapted to environmental conditions as they produced significantly more biofilm at 20 °C than the STECper strains. Interestingly, STECper produced nearly no biofilm at 20 °C. These results are in line with results showing that plant-associated E. coli produce significantly more biofilm and curli at lower temperatures than host-associated isolates from the ECOR collection [50]. To identify the genetic background for this phenotype, we assessed several genes related to biofilm production (bcs genes, csg genes, adrA, rpoS, mlrA) in the WGS data. Cellulose- and curli-encoding gene clusters (bcs and csg) were present in all strains tested. Besides differences in the rpoS gene as mentioned above, the integrity and presence of the mlrA gene differed between the STEC strains. In the STEC O157:H7 strains, the insertion of the stx1-carrying prophage often disrupts the mlrA (synonymous yehV) gene [51]. The truncated MlrA protein is then unable to up-regulate transcription of csgD, the central regulator of biofilm formation [52]. Besides the O157 STECspo strains, we found the majority of the STECper strains to possess an only 215-residue-long truncated MlrA, and we could verify in PacBio sequences, additionally available for some strains under study here [53], that the disruption was due to the insertion of an stx1-carrying prophage.
Such strains were similarly unable to produce biofilm in greater amounts, suggesting that biofilm production might not be as relevant for persistently colonizing STEC as for strains more likely to be exposed to environmental conditions.
Depending on the preferred niche(s) of sporadic- and persistent-colonizing strains, their metabolic abilities might differ. We checked this with the Omnilog® system that allows measuring the utilization of single carbon, nitrogen, sulphur and phosphorus substrates by quantification of the respective strain’s respiratory activity. From a total set of 379 different substrates available as a sole nutrient, STECper and STECspo utilized only 15 substrates (8 C- and 7 S-sources) to significantly different extents. Using bioinformatics, a cascade of two key substrates, glyoxylic acid and L-rhamnose, allowed for differentiating STECper from STECspo. The importance of glyoxylate metabolism in the lifestyle of STECspo is substantiated by the presence of the three components glyoxylic acid, glycolic acid, and m-tartaric acid as substrates that were differently utilized by STECper and STECspo.
To understand why these substrates were differently utilized, WGS data of the strains were searched for the presence and integrity of genes involved in glyoxylate metabolism. This particularly included the glc-operon that comprises seven genes. All events leading to gene inactivation were associated with glcA, the gene encoding the glycolate permease responsible for glycolate uptake [27]. Differing between serotypes, three types of glcA inactivation were identified: two were insertions of a mobile element (traT in O26 and IS3 in O182 STECper strains) and one the truncation of the open reading frame due to a frame shift (in O165/O172 STECper strains). All other genes in the cluster were found to be intact, implying that the bacteria can use the glyoxylate cycle as an anabolic pathway for the synthesis of carbohydrates during regular metabolism when glycolic acid, glyoxylic acid or m-tartaric acid are synthesized by other pathways. The loss of GlcA in STECper may be fostered by the fact that glycolate is produced in plants as an intermediate of photorespiration when oxygen is available but glycolate may not be readily available in the ingesta in the bovine gut due to the low partial pressure of oxygen. In contrast, STECspo, which might be more frequently in contact with metabolically active plants in the environment, would have a clear benefit by retaining the ability to acquire and metabolize glycolate as an additional C-source.
By contrast, inspection of the rha operon revealed that the missing metabolic activity does not only result from the alteration of just a single gene, but that several different genes have rather lost their functionality by independent mutation events. The rha operon comprises seven genes, one of which encodes RhaT, the rhamnose/proton-symporter in the inner membrane. Two genes encode the transcriptional activators RhaS and RhaR [29]. Additionally, genes encoding proteins involved in the metabolism of rhamnose, e.g., the rhamnulose kinase RhaB, the rhamnose isomerase RhaA, the rhamnulose-1-phosphate aldolase RhaD [31], and RhaM, a rhamnose mutarotase, are present [30,32]. Only three of these seven genes, rhaA, rhaD, and rhaM, seem to encode full-length proteins in all strains, although the presence of amino acid substitutions in these three genes in any of the strains hampers any prediction of gene functionality. In contrast, in strains not able to metabolize rhamnose, the open reading frames of the rhaB, rhaS or rhaR genes are obviously dysfunctional. These three genes are truncated or split into two putative protein-encoding fragments by frameshifts as the result of single nucleotide deletions (rhaB, rhaR) or insertions (rhaS). It is surprising that the O157 STECspo strains are able to utilize L-rhamnose because the predicted RhaT seems to be truncated. According to Tate and Henderson [54], the RhaT symporter consists of 10 transmembrane helices. In O157 STECspo, the first two helices are missing. We assume that the symporter is still functional, as another L-rhamnose transporter has not been described in E. coli to date and the genes encoding RhiTN, a protein complex described to transport rhamnose-containing oligosaccharides [30], were not present in our strain collection.
The missing correlation between pheno- and genotype in some strains lacks an obvious explanation. The O26 STECper strains all possess the same disruption of glcA, but two out of the four strains were able to grow when only glycolic or glyoxylic acid was available. Furthermore, O156 STECper strains possess a full-length glcA without any amino acid substitution compared to most positive STECspo strains but are not able to metabolize glycolic or glyoxylic acid. Similarly, three O165/O172 STECper strains utilized a significantly lower number of substrates than the fourth O165 STECper strain and all other STEC strains assessed, but did not possess any obvious genome differences to the other strains of the O165/O172 STECper group. Such discrepancies have also been observed in other E. coli WGS/phenotype analyses. Alqasim, et al. [55] showed that E. coli strains of MLST ST131 exhibited heterogeneous metabolic phenotypes, and, obviously, did not belong to one metabolically distinct lineage. This underlines the difficulties in predicting exerted phenotypes solely based on sequence data. This problem is also well known when trying to deduce susceptibilities of strains against antimicrobials based on molecular genetic analyses [56,57]. In order to mechanistically understand the metabolic backgrounds of the strains, a deeper analysis of the genome data taking into account the frequently complex interactions decisive for a specific phenotype is clearly necessary.
It is noteworthy that several different inactivation events affected the integrity of glyoxylic acid uptake or rhamnose metabolism in STECper strains. Including previously published genome analyses of the strains, it has to be considered that the convergent development of the different STECper strain clusters by gaining similar virulence-associated gene patterns and the inactivation of single metabolic pathways are not independent evolutionary events [26]. One such example is the disruption of mlrA by stx1-converting bacteriophages. It was recently shown that carriage of the stx-converting phage profoundly affects E. coli gene expression and carbon source utilization [58]. Phage-encoded regulators may mediate such effects, but prophage-encoded metabolic genes such as nanS-p also have an impact on the overall metabolic capabilities of the affected strains [59]. Due to the loss of stx-converting prophages in some strains, we were able to investigate the influence of the prophages on the metabolic profiles of very similar strains, but contrary to the published data, we did not find significant differences (data not shown). We therefore believe that the differences in metabolic traits described herein are not related to the presence or absence of prophage sequences, and the conclusion that these differences have impacted the colonization pattern of the STEC parent strains in the cattle population sampled is valid. Nevertheless, we cannot exclude that gene products of single prophages might modulate the gene expression in STEC, but a global effect across different phage types could not be confirmed.
It will be interesting to determine if the key substrates found in this limited set of strains from a single region in Germany also allow the discrimination between STECper and STECspo in larger collections of strains and in other geographic regions. Basing the decision tree on a broader combination of pheno- and genotypic markers is likely to help improve the predictive value of this approach. Despite these limitations, the current study was able to correlate bovine STEC colonization types to distinct in vitro phenotypes and, for the most part, associate these phenotypes with changes in the genetic backgrounds. The loss of certain phenotypes in STECper is in line with their presumed stronger host association compared to more generalist strains [60]. The proposed metabolic and genetic distinction between persistent and sporadic colonizing strains helps us to better understand host and niche adaptation of E. coli strains. In a human outbreak scenario, identifying the causative agent as “bovine-persistent” STEC might indicate a meat-associated origin, while identification of “sporadic” STEC might hint at an environmental contribution. Classification of STEC strains is also instrumental for developing novel approaches to tackle STECper strains which serve as the genetic source for the continuous generation of novel STEC strains in the reservoir host [61].

4. Material and Methods

4.1. Strain Collection

From a collection of 178 whole genome sequenced and genotypically characterized Shiga toxin-producing Escherichia coli (STEC) [26], 28 strains were selected according to their MLST and virulence-associated gene patterns to represent the genomic diversity of this STEC population. All strains were originally isolated based on the presence of an stx gene [22,35], but several strains had lost the bacteriophage-encoded genes during storage as described previously [26,62]. Nevertheless, all strains were designated “STEC” in the current study. Relevant characteristics of all strains investigated in the current study are listed in Table 2.
Additionally, two apathogenic E. coli strains served as controls in several assays: E. coli Nissle 1917 (EcN; kindly provided by PD Dr. U. Methner, Jena) and E. coli K-12 (C600; kindly provided by Prof. Dr. R. Bauerfeind, Gießen).

4.2. Illumina Sequencing

The strains were whole genome sequenced using Illumina MiSeq (Illumina Solutions Center, Berlin, Germany) 300 bp paired-end sequencing with greater than 40× coverage. The sequence read data were first subjected to quality control using the NGS tool kit [64]. Reads with a minimum of 70% of the bases having a phred score of greater than 20 were defined as high quality reads. De novo assembly of the resulting high-quality filtered reads into contiguous sequences (contigs and scaffolds) was conducted using the SpaDes assembler in careful mode to enable additional mismatch correction. All contigs of length longer than 500 bp were included in the final assembly. Annotation of coding sequences was conducted with Prokka (default settings). Raw NGS files (fastq) were uploaded to the NCBI SRA database (Bioproject no. PRJNA559322).

4.3. Genome Analysis

To check the presence or absence of specific genes within the WGS scaffolds, the command line tool blastp was used. Reference protein sequences from the E. coli K-12 strain MG16255 were aligned to translated and annotated coding sequences of our genome assemblies (percentage identity >40% and query coverage >50%) to identify the location of the genes. To visualize the composition and similarity of the gene clusters identified this way, we used the R packages rtracklayer, Biostrings, and gggenes. They provided helpful functions to load, process, and plot the structure of gene clusters in our strains. Further analyses at the nucleotide level were conducted by mapping the contig sequences to the reference sequence (Geneious version 8.1.3; Biomatters Ltd., Auckland, New Zealand).

4.4. Acid Resistance Assay

Survival rates of the bacteria in media with different pH values were measured by a protocol modified from Coldewey, et al. [65]. Bacteria (7.3 ± 0.2 log10 cfu) from an overnight culture in LB broth (37 °C, 180 rpm) were inoculated in 1 mL fresh LB broth with the pH adjusted to 1.5, 2.5 or 7.8 (acidified with HCl) and incubated (2 h, 37 °C, without shaking). Colony forming units (cfu) were calculated from the overnight culture to confirm the inoculation dose as well as from the inoculated broth cultures after the 2 h incubation. For this, log10 serial dilutions were prepared in phosphate-buffered saline (PBS), and one aliquot of 100 µL from each of the first two dilution steps and two aliquots of 10 µL from each further dilution were spotted on sheep-blood agar plates. After incubation (overnight, 37 °C), single colonies were counted in the dilution steps which contained 10–100 colonies, and the cfu/mL was calculated. The acid resistance assay was performed with three biological replicates for each strain.

4.5. Biofilm Crystal Violet Plate Assay

Biofilm production was quantified by a crystal violet assay modified from O’Toole [66]. In brief, bacteria from an overnight culture in LB broth (37 °C, 180 rpm) were diluted 1:100 in salt-free lysogeny broth (LBnoS broth) and plated in quadruplicate in 96-well polystyrene microtiter plates (150 µL/well). After incubation (24–48 h, 20 °C, 28 °C or 37 °C), the liquid cultures were removed and the wells rinsed with dH2O. The biofilm was stained with 0.1% crystal violet solution (15 min) and then the wells washed three times with dH2O. After drying, 200 µL 20% acetic acid/well was added and incubated (15 min, room temperature). Finally, 100 µL were transferred to a new plate and the OD590 nm measured. Four wells, containing LBnoS broth without bacteria, served as a negative control.

4.6. Curli Detection by Congo Red Agar

LBnoS agar plates containing 40 µg/mL Congo red dye and 20 µg/mL Coomassie Brilliant Blue G were spotted with 5 µL LB of an overnight culture of an STEC strain and incubated for up to 48 h at 20 °C, 28 °C or 37 °C [67]. Colonies were macroscopically checked for color and consistency of the surface. Strains expressing curli are able to bind the Congo red dye and are stained brown, strains producing cellulose pink, and strains producing both exhibit the rdar phenotype (red, dry, and rough).

4.7. Metabolic Phenotype Microarray (Omnilog®)

The metabolic activity of the strains was measured using the Omnilog® phenotype microarray (PM) system (Biolog Inc., Hayward, CA, USA). At least three biological replicates of each strain were tested in a microtiter plate-based microarray for the metabolism of 190 different carbon (plates PM1 and PM2A), 95 nitrogen (plate PM3B), 59 phosphorus, and 35 sulfur (both plate PM4A) sources. For the assay, the strains were freshly grown on sheep-blood-agar (Sifin, Berlin, Germany; overnight, 37 °C). The PM plates were inoculated with a bacterial suspension containing approx. 105 cells/100 µL/well prepared in IF-Oa medium containing Dye-Mix A and, in the case of plates PM3B and PM4A, 20 mM Na-succinate as recommended by the manufacturer. Plates were incubated (48 h, 37 °C) and bacterial respiration measured every 15 min by reduction of the tetrazolium violet dye.

4.8. M9 Minimal Medium Growth Kinetics with Differing C-Sources

The utilization of selected carbon sources (L-rhamnose and glyoxylic acid [Sigma–Aldrich Chemie GmbH, Munich, Germany]) was additionally tested by measuring the growth kinetics of the strains in M9 medium (M9 Minimal Salts; Fisher Scientific GmbH, Nidderau, Germany) supplemented with 2 mM MgSO4, 0.1 mM CaCl2, the respective carbon source (0.4%), and, if necessary, the pH adjusted to pH 7. Then, LB overnight cultures of the STEC strains were diluted 1:100 in 800 µL in M9 medium and plated in 48-well microtiter plates. The plates were incubated (24 h, 37 °C) in an Epoch2T reader (BioTek Instruments GmbH, Bad Friedrichshall, Germany) with continuous linear shaking and the OD600 nm measured every hour. The control was one well per strain with M9 medium without any carbon source on each plate. Each strain was tested with each carbon source in three biological replicates.

4.9. Data Analysis

The metabolic activity was analyzed with the opm package in the statistical environment R [68,69]. Kinetic data of the Omnilog® units were exported as Microsoft® Excel files and loaded with the function “read_opm”. The area under the curve (AUC) was calculated with the opm_fast method for the first 48 h of the growth kinetics with one measurement per hour. After subtraction of the negative control (plate- and substrate-specific), the values were rated as follows: <500 negative and ≥500 positive. Substrates with constant positive or negative levels in most strains were discarded, i.e., only substrates with at least three positive or three negative samples were selected for further analysis. The cutoff value of 500 was approximated from histograms of all plate distributions. Significant differences in the mean AUC of grouped strains (persistent and sporadic) were calculated using a two-sample Wilcoxon test and a p-value cutoff of 0.05. All further analyses were based on a preprocessed dataset, which included only eight C-substrates with significantly different utilization between the colonization groups.
For substrate multidimensional data analysis, we performed a series of visualization, classification, and selection methods. First, a two-dimensional scatterplot of the dataset (eight substrates, 25 strains) was generated by using a scaling (cmdscale) approach. The resulting plot allowed us to visually inspect the cluster structure of the data. Prior to classification, we decided to transform our dataset into a binary format (0 = negative, 1 = positive) to facilitate the classification process and remove unnecessary bias from the data. A binary heatmap was generated with function pheatmap, which orders rows (strains) and columns (substrates), applying a hierarchical clustering (average linkage). Next, random forest classification was conducted using the colonization type (persistent, sporadic) as a class attribute. Here, we applied the packages caret and randomForest. Identification of substrates that allowed for predictions of the colonization type was the main objective. We performed repeated cross-validation (10-fold, 50-repeats) on the dataset and evaluated the predicted classes in a receiver operating characteristic (ROC) analysis. AUC ROC values and confidence intervals were computed with the pROC package to quantify the performance of both sensitivity and specificity and to compare them between different substrate sets. To rank substances according to their effect on classification, we analyzed the random forest importance values (mean decrease in accuracy). Those performance values provide estimates about the importance of each substrate and were used in a recursive feature elimination to optimize the classifier, which was implemented by the rfe function in the caret package. A final representative decision tree was learned with the rpart package to visualize the tree structure and resulting decision paths.
Differences in the potential of the strains to produce biofilms were analyzed by comparison of the mean OD590 nm of four biological replicates by a Dunnett-T test to be significantly greater than the mean of the negative control E. coli K-12 strain at the respective incubation temperature.

Supplementary Materials

The following are available online at https://www.mdpi.com/2072-6651/12/6/414/s1, Figure S1: Metabolic activity of each strain on the Omnilog® plates tested (PM1, PM2A, PM3B, PM4A), shown as AUC (area under the curve) after subtraction of the respective negative control. Each AUC is the mean of three biological replicates.; Figure S2: S-Substrates with significantly different metabolic activity in STECper and STECspo. Shown are the AUC values of each group as Box Whisker plots of the discriminatory sulfate substrates with significant (p < 0.05) differences in the mean AUC between STECper (red) and STECspo (green). The STEC strains with an unknown colonization type are depicted in blue; Figure S3: Correlation of two test systems to quantify the utilization of glyoxylic acid or L-rhamnose as single C-source by bovine STEC as measured by respiration (Omnilog®) and growth (M9). For correlation determination, the AUC values were calculated for three replicates of each strain during a 24 h incubation period. Glyoxylic acid (black dots) correlates with r = 0.822 (y = 0.1547x − 385.47) and L-rhamnose (grey triangles) with r = 0.802 (y = 0.2475x − 267.77). Table S1: Raw data of the metabolic activity of each strain on the Omnilog® plates tested (PM1, PM2A, PM3B, PM4A) as mean AUC after 48 h incubation at 37 °C of three biological replicates.

Author Contributions

Conceptualization, L.G., C.M., C.B. and S.A.B.; methodology, S.A.B., L.G. and K.S.; software, M.W.; formal analysis, S.A.B., K.S. and M.W.; investigation, S.A.B.; data curation, M.W.; writing—original draft preparation, S.A.B.; writing—review and editing, C.B. and C.M.; visualization, S.A.B. and M.W.; supervision, C.M.; funding acquisition, L.G. and C.M. All authors have read and agreed to the published version of the manuscript.

Funding

This research, including the efforts of Stefanie A. Barth, Christian Menge, and Lutz Geue, was funded by the Deutsche Forschungsgemeinschaft (DFG) (grant no. GE2509/1-1).

Acknowledgments

The generous provision of strains by U. Methner (Friedrich-Loeffler-Institut [FLI], Jena Germany), and R. Bauerfeind (Justus-Liebig-Universität Gießen, Germany) is acknowledged. The authors thank W. Maginot (FLI Jena) for technical support, as well as I. Eichhorn (Freie Universität Berlin, Germany), T. Semmler, L.H. Wieler (both Robert Koch Institute Berlin, Germany), and D. Pickard (The Wellcome Trust Genome Campus, Cambridge, UK) for help during the whole genome sequencing of the strains, A. Busch (FLI Jena) for assistance in analyzing the nucleotide sequences, and T.M. Fuchs (FLI Jena) and K. Lofthus (University of Wisconsin-River Falls, Wisconsin, USA) for support with the M9 medium assays.

Conflicts of Interest

The authors declare no conflict of interest.

References

  1. Scheutz, F.; Teel, L.D.; Beutin, L.; Pierard, D.; Buvens, G.; Karch, H.; Mellmann, A.; Caprioli, A.; Tozzoli, R.; Morabito, S.; et al. Multicenter evaluation of a sequence-based protocol for subtyping Shiga toxins and standardizing Stx nomenclature. J. Clin. Microbiol. 2012, 50, 2951–2963. [Google Scholar] [CrossRef] [PubMed] [Green Version]
  2. Bai, X.; Fu, S.; Zhang, J.; Fan, R.; Xu, Y.; Sun, H.; He, X.; Xu, J.; Xiong, Y. Identification and pathogenomic analysis of an Escherichia coli strain producing a novel Shiga toxin 2 subtype. Sci. Rep. 2018, 8, 6756. [Google Scholar] [CrossRef] [PubMed]
  3. Brooks, J.T.; Sowers, E.G.; Wells, J.G.; Greene, K.D.; Griffin, P.M.; Hoekstra, R.M.; Strockbine, N.A. Non-O157 Shiga toxin-producing Escherichia coli infections in the United States, 1983–2002. J. Infect. Dis. 2005, 192, 1422–1429. [Google Scholar] [CrossRef] [PubMed] [Green Version]
  4. Rashid, R.A.; Tabata, T.A.; Oatley, M.J.; Besser, T.E.; Tarr, P.I.; Moseley, S.L. Expression of putative virulence factors of Escherichia coli O157:H7 differs in bovine and human infections. Infect. Immun. 2006, 74, 4142–4148. [Google Scholar] [CrossRef] [Green Version]
  5. Ritchie, J.M.; Wagner, P.L.; Acheson, D.W.; Waldor, M.K. Comparison of Shiga toxin production by hemolytic-uremic syndrome-associated and bovine-associated Shiga toxin-producing Escherichia coli isolates. Appl. Environ. Microbiol. 2003, 69, 1059–1066. [Google Scholar] [CrossRef] [Green Version]
  6. Lejeune, J.T.; Abedon, S.T.; Takemura, K.; Christie, N.P.; Sreevatsan, S. Human Escherichia coli O157:H7 genetic marker in isolates of bovine origin. Emerg. Infect. Dis. 2004, 10, 1482–1485. [Google Scholar] [CrossRef]
  7. Lupolova, N.; Dallman, T.J.; Matthews, L.; Bono, J.L.; Gally, D.L. Support vector machine applied to predict the zoonotic potential of E. coli O157 cattle isolates. Proc. Natl. Acad. Sci. USA 2016, 113, 11312–11317. [Google Scholar] [CrossRef] [Green Version]
  8. Bielaszewska, M.; Mellmann, A.; Zhang, W.; Kock, R.; Fruth, A.; Bauwens, A.; Peters, G.; Karch, H. Characterisation of the Escherichia coli strain associated with an outbreak of haemolytic uraemic syndrome in Germany, 2011: A microbiological study. Lancet Infect. Dis. 2011, 11, 671–676. [Google Scholar] [CrossRef] [Green Version]
  9. Rasko, D.A.; Webster, D.R.; Sahl, J.W.; Bashir, A.; Boisen, N.; Scheutz, F.; Paxinos, E.E.; Sebra, R.; Chin, C.S.; Iliopoulos, D.; et al. Origins of the E. coli strain causing an outbreak of hemolytic-uremic syndrome in Germany. N. Engl. J. Med. 2011, 365, 709–717. [Google Scholar] [CrossRef] [Green Version]
  10. Stalb, S.; Barth, S.A.; Sobotta, K.; Liebler-Tenorio, E.; Geue, L.; Menge, C. Pro-inflammatory capacity of Escherichia coli O104:H4 outbreak strain during colonization of intestinal epithelial cells from human and cattle. Int. J. Med. Microbiol. 2018, 308, 899–911. [Google Scholar] [CrossRef]
  11. Hamm, K.; Barth, S.A.; Stalb, S.; Geue, L.; Liebler-Tenorio, E.; Teifke, J.P.; Lange, E.; Tauscher, K.; Kotterba, G.; Bielaszewska, M.; et al. Experimental infection of calves with Escherichia coli O104:H4 outbreak strain. Sci. Rep. 2016, 6. [Google Scholar] [CrossRef] [PubMed] [Green Version]
  12. Cabal, A.; Geue, L.; Gomez-Barrero, S.; Barth, S.; Barcena, C.; Hamm, K.; Porrero, M.C.; Valverde, A.; Canton, R.; Menge, C.; et al. Detection of virulence-associated genes characteristic of intestinal Escherichia coli pathotypes, including the enterohemorrhagic/enteroaggregative O104:H4 in bovines from Germany and Spain. Microbiol. Immunol. 2015. [Google Scholar] [CrossRef] [PubMed]
  13. Arimizu, Y.; Kirino, Y.; Sato, M.P.; Uno, K.; Sato, T.; Gotoh, Y.; Auvray, F.; Brugere, H.; Oswald, E.; Mainil, J.G.; et al. Large-scale genome analysis of bovine commensal Escherichia coli reveals that bovine-adapted E. coli lineages are serving as evolutionary sources of the emergence of human intestinal pathogenic strains. Genome Res. 2019, 29, 1495–1505. [Google Scholar] [CrossRef] [PubMed] [Green Version]
  14. Hoffman, M.A.; Menge, C.; Casey, T.A.; Laegreid, W.; Bosworth, B.T.; Dean-Nystrom, E.A. Bovine immune response to shiga-toxigenic Escherichia coli O157:H7. Clin. Vaccine Immunol. 2006, 13, 1322–1327. [Google Scholar] [CrossRef] [PubMed] [Green Version]
  15. Menge, C.; Stamm, I.; Blessenohl, M.; Wieler, L.H.; Baljer, G. Verotoxin 1 from Escherichia coli affects Gb3/CD77+ bovine lymphocytes independent of interleukin-2, tumor necrosis factor-alpha, and interferon-alpha. Exp. Biol. Med. 2003, 228, 377–386. [Google Scholar] [CrossRef]
  16. Menge, C.; Loos, D.; Bridger, P.S.; Barth, S.; Werling, D.; Baljer, G. Bovine macrophages sense Escherichia coli Shiga toxin 1. Innate Immun. 2015, 21, 655–664. [Google Scholar] [CrossRef] [Green Version]
  17. Schmidt, N.; Barth, S.A.; Frahm, J.; Meyer, U.; Danicke, S.; Geue, L.; Menge, C. Decreased STEC shedding by cattle following passive and active vaccination based on recombinant Escherichia coli Shiga toxoids. Vet. Res. 2018, 49. [Google Scholar] [CrossRef] [Green Version]
  18. Chase-Topping, M.E.; McKendrick, I.J.; Pearce, M.C.; MacDonald, P.; Matthews, L.; Halliday, J.; Allison, L.; Fenlon, D.; Low, J.C.; Gunn, G.; et al. Risk factors for the presence of high-level shedders of Escherichia coli O157 on Scottish farms. J. Clin. Microbiol. 2007, 45, 1594–1603. [Google Scholar] [CrossRef] [Green Version]
  19. Matthews, L.; Reeve, R.; Gally, D.L.; Low, J.C.; Woolhouse, M.E.; McAteer, S.P.; Locking, M.E.; Chase-Topping, M.E.; Haydon, D.T.; Allison, L.J.; et al. Predicting the public health benefit of vaccinating cattle against Escherichia coli O157. Proc. Natl. Acad. Sci. USA 2013, 110, 16265–16270. [Google Scholar] [CrossRef] [Green Version]
  20. Munns, K.D.; Selinger, L.B.; Stanford, K.; Guan, L.; Callaway, T.R.; McAllister, T.A. Perspectives on super-shedding of Escherichia coli O157:H7 by cattle. Foodborne Pathog. Dis. 2015, 12, 89–103. [Google Scholar] [CrossRef]
  21. Fitzgerald, S.F.; Beckett, A.E.; Palarea-Albaladejo, J.; McAteer, S.; Shaaban, S.; Morgan, J.; Ahmad, N.I.; Young, R.; Mabbott, N.A.; Morrison, L.; et al. Shiga toxin sub-type 2a increases the efficiency of Escherichia coli O157 transmission between animals and restricts epithelial regeneration in bovine enteroids. PLoS Pathog. 2019, 15, e1008003. [Google Scholar] [CrossRef] [PubMed] [Green Version]
  22. Geue, L.; Segura-Alvarez, M.; Conraths, F.J.; Kuczius, T.; Bockemühl, J.; Karch, H.; Gallien, P. A long-term study on the prevalence of Shiga toxin-producing Escherichia coli (STEC) on four German cattle farms. Epidemiol. Infect. 2002, 129, 173–185. [Google Scholar] [CrossRef] [PubMed]
  23. Geue, L.; Schares, S.; Mintel, B.; Conraths, F.J.; Muller, E.; Ehricht, R. Rapid microarray-based genotyping of enterohemorrhagic Escherichia coli serotype O156:H25/H-/Hnt isolates from cattle and clonal relationship analysis. Appl. Environ. Microbiol. 2010, 76, 5510–5519. [Google Scholar] [CrossRef] [PubMed] [Green Version]
  24. Geue, L.; Selhorst, T.; Schnick, C.; Mintel, B.; Conraths, F.J. Analysis of the clonal relationship of shiga toxin-producing Escherichia coli serogroup O165:H25 isolated from cattle. Appl. Environ. Microbiol. 2006, 72, 2254–2259. [Google Scholar] [CrossRef] [Green Version]
  25. Geue, L.; Klare, S.; Schnick, C.; Mintel, B.; Meyer, K.; Conraths, F.J. Analysis of the clonal relationship of serotype O26:H11 enterohemorrhagic Escherichia coli isolates from cattle. Appl. Environ. Microbiol. 2009, 75, 6947–6953. [Google Scholar] [CrossRef] [Green Version]
  26. Barth, S.A.; Menge, C.; Eichhorn, I.; Semmler, T.; Wieler, L.H.; Pickard, D.; Belka, A.; Berens, C.; Geue, L. The accessory genome of Shiga toxin-producing Escherichia coli defines a persistent colonization type in cattle. Appl. Environ. Microbiol. 2016, 82, 5455–5464. [Google Scholar] [CrossRef] [Green Version]
  27. Pellicer, M.T.; Badia, J.; Aguilar, J.; Baldoma, L. glc locus of Escherichia coli: Characterization of genes encoding the subunits of glycolate oxidase and the glc regulator protein. J. Bacteriol. 1996, 178, 2051–2059. [Google Scholar] [CrossRef] [Green Version]
  28. Tate, C.G.; Muiry, J.A.; Henderson, P.J. Mapping, cloning, expression, and sequencing of the rhaT gene, which encodes a novel L-rhamnose-H+ transport protein in Salmonella typhimurium and Escherichia coli. J. Biol. Chem. 1992, 267, 6923–6932. [Google Scholar]
  29. Via, P.; Badia, J.; Baldoma, L.; Obradors, N.; Aguilar, J. Transcriptional regulation of the Escherichia coli rhaT gene. Microbiology 1996, 142, 1833–1840. [Google Scholar] [CrossRef] [Green Version]
  30. Rodionova, I.A.; Li, X.; Thiel, V.; Stolyar, S.; Stanton, K.; Fredrickson, J.K.; Bryant, D.A.; Osterman, A.L.; Best, A.A.; Rodionov, D.A. Comparative genomics and functional analysis of rhamnose catabolic pathways and regulons in bacteria. Front. Microbiol. 2013, 4, 407. [Google Scholar] [CrossRef] [Green Version]
  31. Moralejo, P.; Egan, S.M.; Hidalgo, E.; Aguilar, J. Sequencing and characterization of a gene cluster encoding the enzymes for L-rhamnose metabolism in Escherichia coli. J. Bacteriol. 1993, 175, 5585–5594. [Google Scholar] [CrossRef] [PubMed] [Green Version]
  32. Ryu, K.S.; Kim, C.; Kim, I.; Yoo, S.; Choi, B.S.; Park, C. NMR application probes a novel and ubiquitous family of enzymes that alter monosaccharide configuration. J. Biol. Chem. 2004, 279, 25544–25548. [Google Scholar] [CrossRef] [PubMed] [Green Version]
  33. Shaw, D.J.; Jenkins, C.; Pearce, M.C.; Cheasty, T.; Gunn, G.J.; Dougan, G.; Smith, H.R.; Woolhouse, M.E.; Frankel, G. Shedding patterns of verocytotoxin-producing Escherichia coli strains in a cohort of calves and their dams on a Scottish beef farm. Appl. Environ. Microbiol. 2004, 70, 7456–7465. [Google Scholar] [CrossRef] [PubMed] [Green Version]
  34. Callaway, T.R.; Carr, M.A.; Edrington, T.S.; Anderson, R.C.; Nisbet, D.J. Diet, Escherichia coli O157:H7, and cattle: A review after 10 years. Curr. Issues Mol. Biol. 2009, 11, 67–79. [Google Scholar]
  35. Fröhlich, J.; Baljer, G.; Menge, C. Maternally and naturally acquired antibodies to Shiga toxins in a cohort of calves shedding Shiga-toxigenic Escherichia coli. Appl. Environ. Microbiol. 2009, 75, 3695–3704. [Google Scholar] [CrossRef] [Green Version]
  36. Wirth, T.; Falush, D.; Lan, R.; Colles, F.; Mensa, P.; Wieler, L.H.; Karch, H.; Reeves, P.R.; Maiden, M.C.; Ochman, H.; et al. Sex and virulence in Escherichia coli: An evolutionary perspective. Mol. Microbiol. 2006, 60, 1136–1151. [Google Scholar] [CrossRef] [Green Version]
  37. Tuttle, J.; Gomez, T.; Doyle, M.P.; Wells, J.G.; Zhao, T.; Tauxe, R.V.; Griffin, P.M. Lessons from a large outbreak of Escherichia coli O157:H7 infections: Insights into the infectious dose and method of widespread contamination of hamburger patties. Epidemiol. Infect. 1999, 122, 185–192. [Google Scholar] [CrossRef]
  38. Van Winden, S.C.L.; Muller, K.E.; Kuiper, R.; Noordhuizen, J.P.T.M. Studies on the pH value of abomasal contents in dairy cows during the first 3 weeks after calving. J. Vet. Med. A 2002, 49, 157–160. [Google Scholar] [CrossRef]
  39. Sarashina, T.; Ichijo, S.; Takahashi, J.; Osame, S. Origin of abomasum gas in the cows with displaced abomasum. Jpn. J. Vet. Sci. 1990, 52, 371–378. [Google Scholar] [CrossRef]
  40. Bhaskar, K.R.; Garik, P.; Turner, B.S.; Bradley, J.D.; Bansil, R.; Stanley, H.E.; Lamont, J.T. Viscous fingering of HCl through gastric mucin. Nature 1992, 360, 458–461. [Google Scholar] [CrossRef]
  41. Aquino, P.; Honda, B.; Jaini, S.; Lyubetskaya, A.; Hosur, K.; Chiu, J.G.; Ekladious, I.; Hu, D.; Jin, L.; Sayeg, M.K.; et al. Coordinated regulation of acid resistance in Escherichia coli. BMC Syst. Biol. 2017, 11, 1. [Google Scholar] [CrossRef] [PubMed] [Green Version]
  42. Cui, S.; Meng, J.; Bhagwat, A.A. Availability of glutamate and arginine during acid challenge determines cell density-dependent survival phenotype of Escherichia coli strains. Appl. Environ. Microbiol. 2001, 67, 4914–4918. [Google Scholar] [CrossRef] [PubMed] [Green Version]
  43. Audia, J.P.; Webb, C.C.; Foster, J.W. Breaking through the acid barrier: An orchestrated response to proton stress by enteric bacteria. Int. J. Med. Microbiol. 2001, 291, 97–106. [Google Scholar] [CrossRef] [PubMed]
  44. Parker, C.T.; Kyle, J.L.; Huynh, S.; Carter, M.Q.; Brandl, M.T.; Mandrell, R.E. Distinct transcriptional profiles and phenotypes exhibited by Escherichia coli O157:H7 isolates related to the 2006 spinach-associated outbreak. Appl. Environ. Microbiol. 2012, 78, 455–463. [Google Scholar] [CrossRef] [PubMed] [Green Version]
  45. Zogaj, X.; Nimtz, M.; Rohde, M.; Bokranz, W.; Römling, U. The multicellular morphotypes of Salmonella typhimurium and Escherichia coli produce cellulose as the second component of the extracellular matrix. Mol. Microbiol. 2001, 39, 1452–1463. [Google Scholar] [CrossRef] [PubMed]
  46. Römling, U.; Bian, Z.; Hammar, M.; Sierralta, W.D.; Normark, S. Curli fibers are highly conserved between Salmonella typhimurium and Escherichia coli with respect to operon structure and regulation. J. Bacteriol. 1998, 180, 722–731. [Google Scholar] [CrossRef] [Green Version]
  47. Uhlich, G.A.; Chen, C.Y.; Cottrell, B.J.; Nguyen, L.H. Growth media and temperature effects on biofilm formation by serotype O157:H7 and non-O157 Shiga toxin-producing Escherichia coli. FEMS Microbiol. Lett. 2014, 354, 133–141. [Google Scholar] [CrossRef] [Green Version]
  48. Brown, P.K.; Dozois, C.M.; Nickerson, C.A.; Zuppardo, A.; Terlonge, J.; Curtiss, R. MlrA, a novel regulator of curli (AgF) and extracellular matrix synthesis by Escherichia coli and Salmonella enterica serovar typhimurium. Mol. Microbiol. 2001, 41, 349–363. [Google Scholar] [CrossRef]
  49. Mika, F.; Hengge, R. Small RNAs in the control of RpoS, CsgD, and biofilm architecture of Escherichia coli. RNA Biol. 2014, 11, 494–507. [Google Scholar] [CrossRef] [Green Version]
  50. Meric, G.; Kemsley, E.K.; Falush, D.; Saggers, E.J.; Lucchini, S. Phylogenetic distribution of traits associated with plant colonization in Escherichia coli. Environ. Microbiol. 2013, 15, 487–501. [Google Scholar] [CrossRef]
  51. Shaikh, N.; Tarr, P.I. Escherichia coli O157:H7 Shiga toxin-encoding bacteriophages: Integrations, excisions, truncations, and evolutionary implications. J. Bacteriol. 2003, 185, 3596–3605. [Google Scholar] [CrossRef] [Green Version]
  52. Uhlich, G.A.; Chen, C.Y.; Cottrell, B.J.; Hofmann, C.S.; Dudley, E.G.; Strobaugh, T.P.; Nguyen, L.H. Phage insertion in mlrA and variations in rpoS limit curli expression and biofilm formation in Escherichia coli serotype O157: H7. Microbiology 2013, 159, 1586–1596. [Google Scholar] [CrossRef] [PubMed] [Green Version]
  53. Geue, L.; Menge, C.; Berens, C.; Barth, S.A. Complete annotated genome sequences of two Shiga toxin-producing Escherichia coli strains and one atypical enteropathogenic E. coli strain, isolated from naturally colonized cattle of german origin. Genome Announc. 2017, 5. [Google Scholar] [CrossRef] [Green Version]
  54. Tate, C.G.; Henderson, P.J. Membrane topology of the L-rhamnose-H+ transport protein (RhaT) from enterobacteria. J. Biol. Chem. 1993, 268, 26850–26857. [Google Scholar]
  55. Alqasim, A.; Emes, R.; Clark, G.; Newcombe, J.; La Ragione, R.; McNally, A. Phenotypic microarrays suggest Escherichia coli ST131 is not a metabolically distinct lineage of extra-intestinal pathogenic E. coli. PLoS ONE 2014, 9, e88374. [Google Scholar] [CrossRef] [Green Version]
  56. Davis, M.A.; Besser, T.E.; Orfe, L.H.; Baker, K.N.K.; Lanier, A.S.; Broschat, S.L.; New, D.; Call, D.R. Genotypic-phenotypic discrepancies between antibiotic resistance characteristics of Escherichia coli Isolates from calves in management settings with high and low antibiotic use. Appl. Environ. Microbiol. 2011, 77, 3293–3299. [Google Scholar] [CrossRef] [Green Version]
  57. Ruppe, E.; Cherkaoui, A.; Charretier, Y.; Girard, M.; Schicklin, S.; Lazarevic, V.; Schrenzel, J. From genotype to antibiotic susceptibility phenotype in the order enterobacterales: A clinical perspective. Clin. Microbiol. Infect. 2019. [Google Scholar] [CrossRef] [PubMed]
  58. Berger, P.; Kouzel, I.U.; Berger, M.; Haarmann, N.; Dobrindt, U.; Koudelka, G.B.; Mellmann, A. Carriage of Shiga toxin phage profoundly affects Escherichia coli gene expression and carbon source utilization. BMC Genome 2019, 20, 504. [Google Scholar] [CrossRef] [PubMed]
  59. Saile, N.; Voigt, A.; Kessler, S.; Stressler, T.; Klumpp, J.; Fischer, L.; Schmidt, H. Escherichia coli O157:H7 strain EDL933 harbors multiple functional prophage-associated genes necessary for the utilization of 5-N-acetyl-9-O-acetyl neuraminic acid as a growth substrate. Appl. Environ. Microbiol. 2016, 82, 5940–5950. [Google Scholar] [CrossRef] [Green Version]
  60. Langridge, G.C.; Fookes, M.; Connor, T.R.; Feltwell, T.; Feasey, N.; Parsons, B.N.; Seth-Smith, H.M.B.; Barquist, L.; Stedman, A.; Humphrey, T.; et al. Patterns of genome evolution that have accompanied host adaptation in Salmonella. Proc. Natl. Acad. Sci. USA 2015, 112, 863–868. [Google Scholar] [CrossRef] [Green Version]
  61. Leopold, S.R.; Magrini, V.; Holt, N.J.; Shaikh, N.; Mardis, E.R.; Cagno, J.; Ogura, Y.; Iguchi, A.; Hayashi, T.; Mellmann, A.; et al. A precise reconstruction of the emergence and constrained radiations of Escherichia coli O157 portrayed by backbone concatenomic analysis. Proc. Natl. Acad. Sci. USA 2009, 106, 8713–8718. [Google Scholar] [CrossRef] [PubMed] [Green Version]
  62. Barth, S.A.; Menge, C.; Eichhorn, I.; Semmler, T.; Pickard, D.; Geue, L. Evaluation of applicability of DNA microarray-based characterization of bovine Shiga toxin-producing Escherichia coli isolates using whole genome sequence analysis. J. Vet. Diagn. Investig. 2017, 29, 721–724. [Google Scholar] [CrossRef] [PubMed] [Green Version]
  63. Clermont, O.; Bonacorsi, S.; Bingen, E. Rapid and simple determination of the Escherichia coli phylogenetic group. Appl. Environ. Microbiol. 2000, 66, 4555–4558. [Google Scholar] [CrossRef] [PubMed] [Green Version]
  64. Patel, R.K.; Jain, M. NGS QC Toolkit: A toolkit for quality control of next generation sequencing data. PLoS ONE 2012, 7, e30619. [Google Scholar] [CrossRef]
  65. Coldewey, S.M.; Hartmann, M.; Schmidt, D.S.; Engelking, U.; Ukena, S.N.; Gunzer, F. Impact of the rpoS genotype for acid resistance patterns of pathogenic and probiotic Escherichia coli. BMC Microbiol. 2007, 7, 21. [Google Scholar] [CrossRef] [Green Version]
  66. O’Toole, G.A. Microtiter dish biofilm formation assay. J. Vis. Exp. JoVE 2011. [Google Scholar] [CrossRef]
  67. Richter, A.M.; Povolotsky, T.L.; Wieler, L.H.; Hengge, R. Cyclic-di-GMP signalling and biofilm-related properties of the Shiga toxin-producing 2011 German outbreak Escherichia coli O104:H4. EMBO Mol. Med. 2014, 6, 1622–1637. [Google Scholar] [CrossRef]
  68. R Core Team. R: A Language and Environment for Statistical Computing (R.app GUI 1.69); R Foundation for Statistical Computing: Vienna, Austria, 2016. [Google Scholar]
  69. Vaas, L.A.I.; Sikorski, J.; Hofner, B.; Fiebig, A.; Buddruhs, N.; Klenk, H.P.; Goker, M. opm: An R package for analysing OmniLog® phenotype microarray data. Bioinformatics 2013, 29, 1823–1824. [Google Scholar] [CrossRef] [Green Version]
Figure 1. Biofilm production in polystyrene plates after incubation of the STEC strains at different temperatures in salt-free lysogeny broth. Results of the crystal violet assay are shown as the mean + standard deviation [SD] of four biological replicates. Significant differences in mean values relative to the negative control strain Escherichia coli K-12 are indicated by an asterisk (p < 0.05, Dunnett-T). The completeness of the mlrA gene is displayed by ‘+’ (complete, 243 amino acids) or ‘−’ (truncated, 215 amino acids) for each strain.
Toxins 12 00414 g001
Figure 2. Curli expression of STEC strains after growth on Congo red agar. The plates were incubated at different temperatures for 24–48 h. After incubation, the colony morphology was macroscopically assessed and documented by photography.
Toxins 12 00414 g002
Figure 3. C-Substrates with significant differences in the metabolic activity between STEC strains able to colonize cattle persistently (STECper) and only sporadically (STECspo). Shown are the area-under-the-growth curve (AUC) values of each group as box-whisker plots of the discriminatory carbohydrate substrates with significant (p < 0.05) differences in their mean AUC values between STECper (red) and STECspo (green). The blue color depicts STEC with an unknown colonization type included for comparison.
Toxins 12 00414 g003
Figure 4. Individual profiles of C-substrates with significantly different metabolic activity between STECper and STECspo for each strain. Visualization of the binary substance matrix as a heatmap. The heatmap displays positive (black)/negative (grey) values for 25 columns (strains) and eight rows (discriminatory substrates). The annotation column “class” indicates the respective strain’s linked colonization type STECper (red) and STECspo (green). Rows and columns are ordered according to agglomerative clustering (average linkage).
Toxins 12 00414 g004
Figure 5. Feature importance and decision tree. Results of the classification analysis are displayed in a feature importance plot (a) and a summary decision tree (b). In (a), features are ordered with respect to their individual impact on classification accuracy. The decision tree in (b) is applied by top-down decisions that classify strains into colonization type based on the features glyoxylic acid and L-rhamnose.
Toxins 12 00414 g005
Figure 6. Gene map of different glc operons in bovine STEC. The transcription of the glc operon is regulated by integration host factor (IHF) and GlcC, the latter itself being modulated by the anoxic redox control regulators ArcA-P. The glc operon encodes subunits of glycolate oxidase (GlcD, GlcE, GlcF), malate synthetase (GlcB), and glycolate permease (GlcA). The function of GlcG is not clear [27]. Serotypes in red represent STECper, in green STECspo, in blue STEC with unknown colonization type; their respective glyoxylic acid utilizing phenotype is shown in parentheses (−, negative; +, positive). Strains included in this study and belonging to the same serotype did not differ in their glc operon composition and are therefore not shown individually in the figure.
Toxins 12 00414 g006
Figure 7. Gene map of the rha operon in bovine STEC. Genes relevant for the uptake of rhamnose encode for the rhamnose/proton-symporter RhaT in the inner membrane of E. coli and the transcriptional activators RhaS and RhaR [29]. Genes involved in the metabolism of rhamnose encode the rhamnulose kinase RhaB, the rhamnose isomerase RhaA, the rhamnulose-1-phosphate aldolase RhaD [31], and RhaM, a rhamnose mutarotase [30,32]. Serotypes in red represent STECper, in green STECspo, in blue STEC with unknown colonization type; the respective L-rhamnose utilizing phenotype is shown in parentheses (−, negative; +, positive). Strains included in this study and belonging to the same serotype did not differ in their rha operon and are therefore not depicted individually in the figure.
Toxins 12 00414 g007
Table 1. Survival of Shiga toxin-producing Escherichia coli (STEC) strains after 2 h incubation in acidic lysogeny broth (LB broth, pH 1.5 and pH 2.5), measured by colony forming units (cfu) after 2 h incubation in LB broth adjusted to the respective pH value and shown as mean log10 cfu/mL of three biological replicates.
StrainGeno-Serotypelog10 cfu/mL
(Mean of n = 3)
log10 Reduction Compared to Control pH 7.8RpoS Protein
InoculumpH 1.5pH 2.5pH 7.8pH 1.5pH 2.5
Persistent Colonization Type (STECper):
13E0591O26:H117.330.527.028.237.711.21full-length
13E0663O26:H117.311.006.897.836.830.95full-length
13E0674O26:H117.423.916.967.934.020.97full-length
13E0634O26:H117.363.436.887.954.521.07full-length
13E0753O156:H257.46n.d.5.108.298.293.19full-length
13E0780O156:H257.58n.d.3.358.248.244.89truncated (26 AS) due to an SNP at pos. 79GT
13E0725O182:H257.43n.d.3.178.278.275.10truncated (289 AS) due to a frame shift at pos. 847 (deletion of 4 nucleotides)
13E0711O165:H257.260.825.517.776.942.25full-length
13E0718O165:H257.47n.d.5.767.907.902.14truncated (177 AS) due to an SNP at pos. 559CG
13E0734O165:H256.992.904.517.404.502.90deleted
13E0812O172:H257.30n.d.1.828.038.036.20truncated (189 AS) due to an insertion of the phage-related gene mom
Sporadic Colonization Type (STECspo):
13E0609O157:H77.32n.d.2.627.707.705.08deleted
13E0613O157:H76.991.825.147.525.702.39truncated (70 AS) due to a 22 nucleotide insertion at pos. 170
13E0762O157:H77.16n.d.4.437.387.382.95full-length
13E0793O157:H76.99n.d.3.977.787.783.80full-length
13E0611O84:H27.51n.d.5.747.917.912.17full-length
13E0822O103:H27.452.435.668.375.942.70full-length
13E0704O185:H287.484.537.168.373.841.20full-length
13E0895O8:HNT7.481.305.498.327.012.82deleted
13E0899Ont:H257.39n.d.2.528.398.395.87331 AS, due to a duplication of triplet GTA at pos. 307
13E0659O35:H27.515.007.148.203.201.06full-length
13E0867O171:H27.360.525.358.227.692.87full-length
13E0869O6:H497.442.325.608.055.742.45full-length
13E0892O6:H497.231.606.177.986.371.81full-length
13E0767O156:H87.57n.d.6.758.308.301.55full-length
Unknown Colonization Type:
12E0115O84:H27.416.267.377.881.620.52full-length
12E0117O8:H217.522.237.227.825.590.60full-length
12E0119O174:H217.13n.d.6.978.278.271.30deleted
Control Strains:
EcNO6:K5:H17.40n.d.3.708.328.324.63not known
C600K-126.751.943.768.276.334.50not known
EcN, E. coli Nissle 1917; n.d. = not detectable; RpoS protein full length = rpoS gene encoding a 330 amino acid long RpoS protein, positions refer to the gene; SNP = single nucleotide polymorphism.
Table 2. E. coli strain collection used in this study.
StrainGeno-SerotypeMLST 1Phylo-Group 2Selected VAGs 3 SRA 4 Accession No.
ST ComplexSTstx SubtypeOther ToxinsAdhesins
Strains Representing the Persistent Colonization Type (STECper):
13E0591O26:H11ST29 Cplx21B1noneastA, ehxA, toxBβ-eae, efa-1, ihaSRR9972680
13E0663O26:H11ST29 Cplx21B11aastA, ehxAβ-eae, efa-1, ihaSRR9972674
13E0674O26:H11ST29 Cplx21B11a, 2aastA, ehxA, toxBβ-eae, efa-1, ihaSRR9972669
13E0634O26:H11ST29 Cplx1705B11a, 2aastA, ehxA, toxBβ-eae, efa-1, ihaSRR9972676
13E0753O156:H25none688B11aastA, ehxAζ-eaeSRR9972663
13E0780O156:H25none300B11aastA, ehxAζ-eaeSRR9972672
13E0725O182:H25none300B11aastA, ehxAζ-eaeSRR9972665
13E0711O165:H25none119Anonenoneε-eaeSRR9972667
13E0718O165:H25none119A2aastAε-eae, efa-1SRR9972668
13E0734O165:H25none119A2aastAε-eae, efa-1SRR9972666
13E0812O172:H25none660A2aastAε-eae, efa-1SRR9972661
Strains Representing the Sporadic Colonization Type (STECspo):
13E0609O157:H7ST11 Cplx11D2castA, cdt, ehxA, toxBγ-eae, ihaSRR9972677
13E0613O157:H7ST11 Cplx11D1a, 2castA, cdt, ehxA, toxBγ-eaeSRR9972675
13E0762O157:H7ST11 Cplx11DnoneastA, cdt, ehxA, toxBγ-eae, ihaSRR9972664
13E0793O157:H7ST11 Cplx11DnoneastA, cdt, ehxA, toxBγ-eae, ihaSRR9972662
13E0611O84:H2none306B11aastA, cdt, ehxAζ-eaeSRR9972678
13E0822O103:H2ST20 Cplx17B11aehxAε-eae, efa-1SRR9972660
13E0704O185:H28none658D2aehxALEE-neg., iha, saaSRR9972670
13E0895O8:HNTST155 Cplx155DnonenoneLEE-neg.SRR9972656
13E0899Ont:H25ST155 Cplx58B12aastA, ehxA, subALEE-neg., iha, saaSRR9972655
13E0659O35:H2none5266B1nonenoneβ-eaeSRR9972673
13E0867O171:H2none332B12dnoneLEE-neg., ihaSRR9972659
13E0869O6:H49none1079B1nonenoneLEE-neg., ihaSRR9972658
13E0892O6:H49none1079B11anoneLEE-neg., ihaSRR9972657
13E0767O156:H8none327B1nonenoneθ-eae, ihaSRR9972671
Strains with Unknown Colonization Type:
12E0115O84:H2none306B11aastA, ehxAζ-eaeSRR9972681
12E0117O8:H21none1794B12dastALEE-neg.SRR9972682
12E0119O174:H21none677B12cnoneLEE-neg.SRR9972679
1 MLST, multi locus sequence typing; 2 PCR according to Clermont, et al. [63]; 3 VAGs (virulence associated genes) as described by Barth and colleagues [26]; SRA, Sequence Read Archive of the NCBI, Bethesda, MD, USA.

