Harmful Algal Bloom Toxicity in Lithobates catesbeiana Tadpoles

 , ,
, ,  ,
,  and
and
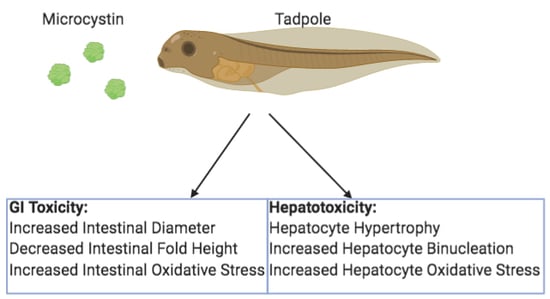
Abstract
1. Introduction
2. Results
2.1. Intestinal Diameters
2.2. Intestinal Fold Heights
2.3. Intestinal Fold Numbers
2.4. Hepatocyte Size
2.5. Hepatocyte Binucleation
2.6. Immunohistochemistry for Protein Carbonylation
3. Discussion
4. Materials and Methods
4.1. HAB Toxin Collection and Characterization
4.2. Tadpole Sampling and Treatment
4.3. Histology Preparation
4.4. Intestine Histopathological Analysis
4.5. Liver Histopathological Analysis
4.6. Immunohistochemistry
4.7. Statistical Analysis
Author Contributions
Funding
Conflicts of Interest
References
- Emanuela-Testai, F.M.B.; Enzo, F.; Manganelli, M.; Vichi, S.; Arnich, N.; Fessard, V.; Sialehaamoa, A. Review and analysis of occurrence, exposure, and toxicity of cyanobacteria toxins in food. EFSA Support. Publ. 2016, 998. [Google Scholar]
- Campos, A.; Vasconcelos, V. Molecular Mechanisms of Microcystin Toxicity in Animal Cells. Int. J. Mol. Sci. 2010, 11, 268–287. [Google Scholar] [CrossRef] [PubMed]
- Greer, B.; Meneely, J.P.; Elliott, C.T. Uptake, and accumulation of Microcystin-LR based on exposure through drinking water: An animal model assessing the human health risk. Sci. Rep. 2018, 8, 4913. [Google Scholar] [CrossRef] [PubMed]
- Gaudin, J.; Huet, S.; Jarry, G.; Fessard, V. In vivo DNA damage induced by the cyanotoxin microcystin-LR: Comparison of intra-peritoneal and oral administrations by use of the comet assay. Mutat. Res. Toxicol. Environ. Mutagen. 2008, 652, 65–71. [Google Scholar] [CrossRef]
- Sedan, D.; Laguens, M.; Copparoni, G.; Aranda, J.O.; Leda, G.; Marra, C.A.; Andrinolo, D. Hepatic and intestine alterations in mice after prolonged exposure to low oral doses of Microcystin-LR. Toxicon 2015, 104, 26–33. [Google Scholar] [CrossRef]
- Zhang, H.-J.; Zhang, J.; Hong, Y.; Chen, Y.-X. Evaluation of organ distribution of microcystins in the freshwater phytoplanktivorous fish Hypophthalmichthys molitrix. J. Zhejiang Univ. Sci. B 2007, 8, 116–120. [Google Scholar] [CrossRef]
- Palagama, D.S.; Baliu-Rodriguez, D.; Lad, A.; Levison, B.S.; Kennedy, D.J.; Haller, S.T.; Westrick, J.; Hensley, K.; Isailovic, D. Development and applications of solid-phase extraction and liquid chromatography-mass spectrometry methods for quantification of microcystins in urine, plasma, and serum. J. Chromatogr. A 2018, 1573, 66–77. [Google Scholar] [CrossRef]
- Lad, A.; Su, R.C.; Breidenbach, J.D.; Stemmer, P.M.; Carruthers, N.; Sanchez, N.K.; Khalaf, F.K.; Zhang, S.; Kleinhenz, A.L.; Dube, P.; et al. Chronic Low Dose Oral Exposure to Microcystin-LR Exacerbates Hepatic Injury in a Murine Model of Non-Alcoholic Fatty Liver Disease. Toxins 2019, 11, 486. [Google Scholar] [CrossRef]
- Baliu-Rodriguez, D.; Kucheriavaia, D.; Palagama, D.; Lad, A.; O’Neill, G.; Birbeck, J.; Kennedy, D.J.; Haller, S.T.; Westrick, J.; Isailovic, D. Development and Application of Extraction Methods for LC-MS Quantification of Microcystins in Liver Tissue. Toxins 2020, 12, 263. [Google Scholar] [CrossRef]
- Pham, T.-L.; Utsumi, M. An overview of the accumulation of microcystins in aquatic ecosystems. J. Environ. Manag. 2018, 213, 520–529. [Google Scholar] [CrossRef]
- Svircev, Z.; Drobac, D.; Tokodi, N.; Mijović, B.; Codd, G.A.; Meriluoto, J. Toxicology of microcystins with reference to cases of human intoxications and epidemiological investigations of exposures to cyanobacteria and cyanotoxins. Arch. Toxicol. 2017, 91, 621–650. [Google Scholar] [CrossRef] [PubMed]
- Nishiwaki-Matsushima, R.; Ohta, T.; Nishiwaki, S.; Suganuma, M.; Kohyama, K.; Ishikawa, T.; Carmichael, W.W.; Fujiki, H. Liver tumor promotion by the cyanobacterial cyclic peptide toxin microcystin-LR. J. Cancer Res. Clin. Oncol. 1992, 118, 420–424. [Google Scholar] [CrossRef] [PubMed]
- Lone, Y.; Koiri, R.K.; Bhide, M. An overview of the toxic effect of potential human carcinogen Microcystin-LR on testis. Toxicol. Rep. 2015, 2, 289–296. [Google Scholar] [CrossRef] [PubMed]
- Jochimsen, E.M.; Carmichael, W.; An, J.; Cardo, D.M.; Cookson, S.T.; Holmes, C.E.; Antunes, M.B.; Filho, D.A.D.M.; Lyra, T.M.; Barreto, V.S.T.; et al. Liver Failure and Death after Exposure to Microcystins at a Hemodialysis Center in Brazil. N. Engl. J. Med. 1998, 338, 873–878. [Google Scholar] [CrossRef] [PubMed]
- Carmichael, W.W.; Azevedo, S.M.; An, J.S.; Molica, R.J.; Jochimsen, E.M.; Lau, S.; Eaglesham, G.K. Human fatalities from cyanobacteria: Chemical and biological evidence for cyanotoxins. Environ. Health Perspect. 2001, 109, 663–668. [Google Scholar] [CrossRef]
- Azevedo, S.M.F.D.O.E.; Carmichael, W.W.; Jochimsen, E.M.; Rinehart, K.L.; Lau, S.; Shaw, G.R.; Eaglesham, G.K. Human intoxication by microcystins during renal dialysis treatment in Caruaru—Brazil. Toxicology 2002, 181, 441–446. [Google Scholar] [CrossRef]
- Gkelis, S.; Lanaras, T.; Sivonen, K. The presence of microcystins and other cyanobacterial bioactive peptides in aquatic fauna collected from Greek freshwaters. Aquat. Toxicol. 2006, 78, 32–41. [Google Scholar] [CrossRef]
- Malbrouck, C.; Kestemont, P. Efects of Microcystins on Fish. Environ. Toxicol. Chem. 2006, 25, 72–86. [Google Scholar] [CrossRef]
- Miller, M.A.; Kudela, R.M.; Mekebri, A.; Crane, D.; Oates, S.C.; Tinker, M.T.; Staedler, M.; Miller, W.A.; Toy-Choutka, S.; Dominik, C.; et al. Evidence for a Novel Marine Harmful Algal Bloom: Cyanotoxin (Microcystin) Transfer from Land to Sea Otters. PLoS ONE 2010, 5, e12576. [Google Scholar] [CrossRef]
- Lecoz, N.; Malécot, M.; Quiblier, C.; Puiseux-Dao, S.; Bernard, C.; Crespeau, F.; Edery, M. Effects of cyanobacterial crude extracts from Planktothrix agardhii on embryo–larval development of medaka fish, Oryzias latipes. Toxicon 2008, 51, 262–269. [Google Scholar] [CrossRef]
- Liu, W.; Qiao, Q.; Chen, Y.; Wu, K.; Zhang, X. Microcystin-LR exposure to adult zebrafish (Danio rerio) leads to growth inhibition and immune dysfunction in F1 offspring, a parental transmission effect of toxicity. Aquat. Toxicol. 2014, 155, 360–367. [Google Scholar] [CrossRef]
- Qi, M.; Dang, Y.; Xu, Q.; Yu, L.; Liu, C.; Yuan, Y.; Wang, J. Microcystin-LR induced developmental toxicity and apoptosis in zebrafish (Danio rerio) larvae by activation of ER stress response. Chemosphere 2016, 157, 166–173. [Google Scholar] [CrossRef]
- Azevedo-Linhares, M.; Souza, A.; Lenz, C.; Leite, N.F.; Brito, I.; Folle, N.; Garcia, J.; Neto, F.F.; Ribeiro, C.A.D.O. Microcystin and pyriproxyfen are toxic to early stages of development in Rhamdia quelen: An experimental and modelling study. Ecotoxicol. Environ. Saf. 2018, 166, 311–319. [Google Scholar] [CrossRef]
- Vasconcelos, V.; Oliveira, S.; Teles, L.O. Impact of a toxic and a non-toxic strain of Microcystis aeruginosa on the crayfish Procambarus clarkii. Toxicon 2001, 39, 1461–1470. [Google Scholar] [CrossRef]
- Konishi, T.; Kato, K.; Araki, T.; Shiraki, K.; Takagi, M.; Tamaru, Y. Molecular cloning, and characterization of α-class glutathione S-transferase genes from the hepatopancreas of red sea bream, Pagrus major. Comp. Biochem. Physiol. Part C Toxicol. Pharmacol. 2005, 140, 309–320. [Google Scholar] [CrossRef]
- Zhang, H.; Wu, Y.; Fang, W.; Wang, D. Regulatory effect of quercetin on hazardous microcystin-LR-induced apoptosis of Carassius auratus lymphocytes in vitro. Fish Shellfish. Immunol. 2014, 37, 278–285. [Google Scholar] [CrossRef]
- Chen, J.; Xie, P.; Guo, L.; Zheng, L.; Ni, L. Tissue distributions and seasonal dynamics of the hepatotoxic microcystins-LR and -RR in a freshwater snail (Bellamya aeruginosa) from a large shallow, eutrophic lake of the subtropical China. Environ. Pollut. 2005, 134, 423–430. [Google Scholar] [CrossRef]
- Choi, J.; Ishizuya-Oka, A.; Buchholz, D.R. Growth, Development, and Intestinal Remodeling Occurs in the Absence of Thyroid Hormone Receptor α in Tadpoles of Xenopus tropicalis. Endocrinology 2017, 158, 1623–1633. [Google Scholar] [CrossRef]
- Longstreth, G.F.; Thompson, W.G.; Chey, W.D.; Houghton, L.; Mearin, F.; Spiller, R.C. Functional Bowel Disorders. Gastroenterology 2006, 130, 1480–1491. [Google Scholar] [CrossRef]
- Albaba, M.; Takahashi, P.Y. 83-Year-Old Woman with Abdominal Distention and Constipation. Mayo Clin. Proc. 2009, 84, 1126–1129. [Google Scholar] [CrossRef]
- Skomorochow, E.; Pico, J. Toxic Megacolon; StatPearls: Treasure Island, FL, USA, 2019. [Google Scholar]
- D’Amico, C.; Vitale, A.; Angriman, I.; Ruffolo, C.; D’Amico, F.; Valente, D.; Berto, M.; Vella, V.; Scarpa, M.; D’Amico, D.F. Early Surgery for the Treatment of Toxic Megacolon. Digestion 2005, 72, 146–149. [Google Scholar] [CrossRef]
- Bláha, L.; Babica, P.; Maršálek, B. Toxins produced in cyanobacterial water blooms—Toxicity and risks. Interdiscip. Toxicol. 2009, 2, 36–41. [Google Scholar] [CrossRef]
- Kubickova, B.; Babica, P.; Hilscherová, K.; Šindlerová, L. Effects of cyanobacterial toxins on the human gastrointestinal tract and the mucosal innate immune system. Environ. Sci. Eur. 2019, 31. [Google Scholar] [CrossRef]
- Su, R.C.; Blomquist, T.M.; Kleinhenz, A.L.; Khalaf, F.K.; Dube, P.; Lad, A.; Breidenbach, J.D.; Mohammed, C.J.; Zhang, S.; Baum, C.E.; et al. Exposure to the Harmful Algal Bloom (HAB) Toxin Microcystin-LR (MC-LR) Prolongs and Increases Severity of Dextran Sulfate Sodium (DSS)-Induced Colitis. Toxins 2019, 11, 371. [Google Scholar] [CrossRef]
- Hall, A.P.; Elcombe, C.R.; Foster, J.R.; Harada, T.; Kaufmann, W.; Knippel, A.; Küttler, K.; Malarkey, D.E.; Maronpot, R.R.; Nishikawa, A.; et al. Liver hypertrophy: A review of adaptive (adverse and non-adverse) changes-conclusions from the 3rd International ESTP Expert Workshop. Toxicol. Pathol. 2012, 40, 971–994. [Google Scholar] [CrossRef]
- Carmichael, N.G.; Enzman, H.; Pate, I.; Waechter, F. The significance of mouse liver tumor formation for carcinogenic risk assessment: Results and conclusions from a survey of ten years of testing by the agrochemical industry. Environ. Health Perspect. 1997, 105, 1196–1203. [Google Scholar] [CrossRef]
- Allen, D.; Pearse, G.; Haseman, J.; Maronpot, R. Prediction of Rodent Carcinogenesis: An Evaluation of Prechronic Liver Lesions as Forecasters of Liver Tumors in NTP Carcinogenicity Studies. Toxicol. Pathol. 2004, 32, 393–401. [Google Scholar] [CrossRef]
- Wang, M.-J.; Chen, F.; Lau, J.T.Y.; Hu, Y.-P. Hepatocyte polyploidization and its association with pathophysiological processes. Cell Death Dis. 2017, 8, e2805. [Google Scholar] [CrossRef]
- Puerto, M.; Pichardo, S.; Jos, A.; Prieto, A.I.; Sevilla, E.; Frías, J.E.; Cameán, A.M. Differential oxidative stress responses to pure Microcystin-LR and Microcystin-containing and non-containing cyanobacterial crude extracts on Caco-2 cells. Toxicon 2010, 55, 514–522. [Google Scholar] [CrossRef]
- Fedorova, M.; Bollineni, R.C.; Hoffmann, R. Protein carbonylation as a major hallmark of oxidative damage: Update of analytical strategies. Mass Spectrom. Rev. 2013, 33, 79–97. [Google Scholar] [CrossRef]
- Júnior, O.R.P.; de Oliveira, N.B.; Bosque, R.J.; Ferreira, M.F.N.; da Silva, V.M.A.; Magalhães, A.C.M.; De Santana, C.J.C.; Castro, M.D.S. Histopathological Evaluation of the Exposure by Cyanobacteria Cultive Containing [d-Leu1]Microcystin-LR on Lithobates catesbeianus Tadpoles. Toxins 2018, 10, 318. [Google Scholar] [CrossRef] [PubMed]
- Ziková, A.; Lorenz, C.; Lutz, I.; Pflugmacher, S.; Kloas, W. Physiological responses of Xenopus laevis tadpoles exposed to cyanobacterial biomass containing microcystin-LR. Aquat. Toxicol. 2013, 128, 25–33. [Google Scholar] [CrossRef]
- Fischer, W. Toxicity of the cyanobacterial cyclic heptapeptide toxins microcystin-LR and -RR in early life-stages of the African clawed frog (Xenopus laevis). Aquat. Toxicol. 2000, 49, 189–198. [Google Scholar] [CrossRef]
- Zhang, X.; Song, L.; Zhang, P.; He, J.; Liu, Y.; Matsuura, H.; Watanabe, M.M. Grazing on toxic cyanobacterial blooms by tadpoles of edible frog Rana grylio. Phycol. Res. 2011, 60, 20–26. [Google Scholar] [CrossRef]
- Olson, N.E.; Cooke, M.E.; Shi, J.H.; Birbeck, J.A.; Westrick, J.A.; Ault, A.P. Harmful Algal Bloom Toxins in Aerosol Generated from Inland Lake Water. Environ. Sci. Technol. 2020, 54, 4769–4780. [Google Scholar] [CrossRef]
- Palagama, D.S.; Baliu-Rodriguez, D.; Snyder, B.K.; Thornburg, J.A.; Bridgeman, T.B.; Isailovic, D. Identification and quantification of microcystins in western Lake Erie during 2016 and 2017 harmful algal blooms. J. Great Lakes Res. 2020, 46, 289–301. [Google Scholar] [CrossRef]
- Sepulcre, M.P.; Alcaraz-Pérez, F.; López-Muñoz, A.; Roca, F.J.; Meseguer, J.; Cayuela, M.L.; Mulero, V. Evolution of Lipopolysaccharide (LPS) Recognition and Signaling: Fish TLR4 Does Not Recognize LPS and Negatively Regulates NF-κB Activation. J. Immunol. 2009, 182, 1836–1845. [Google Scholar] [CrossRef]
- Wendel, E.S.; Yaparla, A.; Melnyk, M.L.S.; Koubourli, D.V.; Grayfer, L. Amphibian (Xenopus laevis) Tadpoles and Adult Frogs Differ in Their Use of Expanded Repertoires of Type I and Type III Interferon Cytokines. Viruses 2018, 10, 372. [Google Scholar] [CrossRef]
- Chaffin, J.D.; Bridgeman, T.B. Organic and inorganic nitrogen utilization by nitrogen-stressed cyanobacteria during bloom conditions. Environ. Boil. Fishes 2013, 26, 299–309. [Google Scholar] [CrossRef]
- Steffen, M.M.; Davis, T.W.; McKay, R.M.L.; Bullerjahn, G.; Krausfeldt, L.E.; Stough, J.M.; Neitzey, M.L.; Gilbert, N.E.; Boyer, G.L.; Johengen, T.H.; et al. Ecophysiological Examination of the Lake Erie Microcystis Bloom in 2014: Linkages between Biology and the Water Supply Shutdown of Toledo, OH. Environ. Sci. Technol. 2017, 51, 6745–6755. [Google Scholar] [CrossRef]
- Kitchens, C.M.; Johengen, T.H.; Davis, T.W. Establishing spatial and temporal patterns in Microcystis sediment seed stock viability and their relationship to subsequent bloom development in Western Lake Erie. PLoS ONE 2018, 13, e0206821. [Google Scholar] [CrossRef]
- Chaffin, J.D.; Sigler, V.; Bridgeman, T.B. Connecting the blooms: Tracking and establishing the origin of the record-breaking Lake Erie Microcystis bloom of 2011 using DGGE. Aquat. Microb. Ecol. 2014, 73, 29–39. [Google Scholar] [CrossRef]
- National Oceanic and Atmospheric Administration. Experimental Lake Erie Harmful Algal Bloom Bulletin. Available online: https://tidesandcurrents.noaa.gov/hab/lakeerie_bulletins/HAB20171107_2017035_LE.pdf (accessed on 5 June 2020).
- Rivasseau, C.; Racaud, P.; Deguin, A.; Hennion, M.C. Evaluation of an ELISA Kit for the Monitoring of Microcystins (Cyanobacterial Toxins) in Water and Algae Environmental Samples. Environ. Sci. Technol. 1999, 33, 1520–1527. [Google Scholar] [CrossRef]
- Zhang, H.; Cai, C.; Wu, Y.; Shao, D.; Ye, B.; Zhang, Y.; Liu, J.; Wang, J.; Jia, X. Mitochondrial and endoplasmic reticulum pathways involved in microcystin-LR-induced apoptosis of the testes of male frog (Rana nigromaculata) in vivo. J. Hazard. Mater. 2013, 252, 382–389. [Google Scholar] [CrossRef]
- Schindelin, J.; Arganda-Carreras, I.; Frise, E.; Kaynig, V.; Longair, M.; Pietzsch, T.; Preibisch, S.; Rueden, C.; Saalfeld, S.; Schmid, B.; et al. Fiji: An open-source platform for biological-image analysis. Nat. Methods 2012, 9, 676–682. [Google Scholar] [CrossRef]
- Rueden, C.T.; Schindelin, J.; Hiner, M.C.; Dezonia, B.E.; Walter, A.E.; Arena, E.T.; Eliceiri, K.W. ImageJ2: ImageJ for the next generation of scientific image data. BMC Bioinform. 2017, 18, 529. [Google Scholar] [CrossRef]
- Kennedy, D.J.; Khalaf, F.K.; Sheehy, B.; Weber, M.E.; Agatisa-Boyle, B.; Conic, J.; Fedorova, O.V. Telocinobufagin, a Novel Cardiotonic Steroid, Promotes Renal Fibrosis via Na(+)/K(+)-ATPase Profibrotic Signaling Pathways. Int. J. Mol. Sci. 2018, 19, 2566. [Google Scholar] [CrossRef]
- Wallenstein, S.; Zucker, C.L.; Fleiss, J.L. Some statistical methods useful in circulation research. Circ. Res. 1980, 47, 1–9. [Google Scholar] [CrossRef]


© 2020 by the authors. Licensee MDPI, Basel, Switzerland. This article is an open access article distributed under the terms and conditions of the Creative Commons Attribution (CC BY) license (http://creativecommons.org/licenses/by/4.0/).
Share and Cite
Su, R.C.; Meyers, C.M.; Warner, E.A.; Garcia, J.A.; Refsnider, J.M.; Lad, A.; Breidenbach, J.D.; Modyanov, N.; Malhotra, D.; Haller, S.T.; et al. Harmful Algal Bloom Toxicity in Lithobates catesbeiana Tadpoles. Toxins 2020, 12, 378. https://doi.org/10.3390/toxins12060378
Su RC, Meyers CM, Warner EA, Garcia JA, Refsnider JM, Lad A, Breidenbach JD, Modyanov N, Malhotra D, Haller ST, et al. Harmful Algal Bloom Toxicity in Lithobates catesbeiana Tadpoles. Toxins. 2020; 12(6):378. https://doi.org/10.3390/toxins12060378
Chicago/Turabian StyleSu, Robin C., Casey M. Meyers, Emily A. Warner, Jessica A. Garcia, Jeanine M. Refsnider, Apurva Lad, Joshua D. Breidenbach, Nikolai Modyanov, Deepak Malhotra, Steven T. Haller, and et al. 2020. "Harmful Algal Bloom Toxicity in Lithobates catesbeiana Tadpoles" Toxins 12, no. 6: 378. https://doi.org/10.3390/toxins12060378
APA StyleSu, R. C., Meyers, C. M., Warner, E. A., Garcia, J. A., Refsnider, J. M., Lad, A., Breidenbach, J. D., Modyanov, N., Malhotra, D., Haller, S. T., & Kennedy, D. J. (2020). Harmful Algal Bloom Toxicity in Lithobates catesbeiana Tadpoles. Toxins, 12(6), 378. https://doi.org/10.3390/toxins12060378