Occurrence of Deoxynivalenol, Nivalenol, and Their Glucosides in Korean Market Foods and Estimation of Their Population Exposure through Food Consumption

 ,
, 
Abstract
1. Introduction
2. Results and Discussion
2.1. Accuracy and Precision of the High-Performance Liquid Chromatography (HPLC) Method
2.2. Amount of DON, NIV, and Their 3-β-D-glucosides
2.3. Co-Occurrence
2.4. Exposure to DON, NIV, and Their 3-β-D-Glucosides via Food Intake
3. Conclusions
4. Materials and Methods
4.1. Samples
4.2. Chemicals and Reagents
4.3. Extraction and Purification of Samples
4.4. HPLC–UV Analysis
4.5. Method Validation
4.6. Estimation of Dietary Exposure
Author Contributions
Funding
Acknowledgments
Conflicts of Interest
Abbreviations
References
- Foroud, N.A.; Eudes, F. Trichothecenes in Cereal Grains. Int. J. Mol. 2009, 10, 147–173. [Google Scholar] [CrossRef]
- CONTAM (EFSA Panel on Contaminants in the Food Chain). Scientific Opinion on risks for animal and public health related to the presence of nivalenol in food and feed. EFSA J. 2013, 11, 3262. [Google Scholar] [CrossRef]
- Ok, H.E.; Choi, S.-W.; Chung, S.H.; Kang, Y.-W.; Kim, D.-S.; Chun, H.S. Natural occurrence of type-B trichothecene mycotoxins in Korean cereal-based products. Food Addit. Contam. B 2011, 4, 132–140. [Google Scholar] [CrossRef]
- Lee, U.-S.; Jang, H.-S.; Tanaka, T.; Hasegawa, A.; Oh, Y.-J.; Cho, C.-M.; Sugiura, Y.; Ueno, Y. Further survey on the Fusarium mycotoxins in Korean cereals. Food Addit. Contam. 1985, 3, 253–261. [Google Scholar] [CrossRef]
- Osborne, L.E.; Stein, J.M. Epidemiology of Fusarium head blight on small-grain cereals. Int. J. Food Microbiol. 2007, 119, 103–108. [Google Scholar] [CrossRef]
- Ok, H.E.; Lee, S.Y.; Chun, H.S. Occurrence and simultaneous determination of nivalenol and deoxynivalenol in rice and bran by HPLC-UV detection and immunoaffinity cleanup. Food Control. 2018, 87, 53–59. [Google Scholar] [CrossRef]
- Yoshinari, T.; Sakuda, S.; Furihata, K.; Furusawa, H.; Ohnishi, T.; Konishi, Y.S.; Ishizaki, N.; Terajima, J. Structural Determination of a Nivalenol Glucoside and Development of an Analytical Method for the Simultaneous Determination of Nivalenol and Deoxynivalenol, and Their Glucosides, in Wheat. J. Agric. Food Chem. 2014, 62, 1174–1180. [Google Scholar] [CrossRef]
- Nagl, V.; Woechtl, B.; Elisabeth, H.; Zimmermann, S.; Pauk, I.H.; Moll, W.D.; Adam, G.; Berthiller, F. Metabolism of the masked mycotoxin deoxynivalenol-3-glucoside in pigs. Toxicol. Lett. 2014, 229, 190–197. [Google Scholar] [CrossRef]
- Gratz, S.W.; Dinesh, R.; Yoshinari, T.; Holtrop, G.; Richardson, A.J.; Duncan, G.; MacDonald, S.; Lloyd, A.; Tarbin, J. Masked trichothecene and zearalenone mycotoxins withstand digestion and absorption in the upper GI tract but are efficiently hydrolyzed by human gut microbiotain vitro. Mol. Nutr. Food Res. 2017, 61, 1600680. [Google Scholar] [CrossRef]
- Berthiller, F.; Crews, C.; Dall’Asta, C.; Saeger, S.D.; Haesaert, G.; Karlovsky, P.; Oswald, I.P.; Seefelder, W.; Speijers, G.; Stroka, J.; et al. Masked mycotoxins: A review. Mol. Nutr. Food Res. 2009, 57, 165–186. [Google Scholar] [CrossRef]
- Rychlik, M.; Humpf, H.U.; Marko, D.; Dänicke, S.; Mally, A.; Berthiller, F.; Klaffke, H.; Lorenz, N. Proposal of a comprehensive definition of modified and other forms of mycotoxins including “masked” mycotoxins. Mycotoxin Res. 2014, 30, 197–205. [Google Scholar] [CrossRef] [PubMed]
- Berthiller, F.; Dall’asta, C.; Corradini, R.; Marchelli, R.; Sulyok, M.; Krska, R.; Adam, G.; Schuhmacher, R. Occurrence of deoxynivalenol and its 3-β-D-glucoside in wheat and maize. Food Addit. Contam. A. 2013, 26, 507–511. [Google Scholar] [CrossRef] [PubMed]
- Bryła, M.; Woźniak, E.K.; Waśkiewicz, A.; Szymczyk, K.; Jędrzejczak, R. Natural Occurrence of Nivalenol, Deoxynivalenol, and Deoxynivalenol-3-Glucoside in Polish Winter Wheat. Toxins 2018, 10, 81. [Google Scholar] [CrossRef] [PubMed]
- KCDC (Korea Centers for Disease Control and Prevention). (2013). The Fifth Korea National Health and Nutrition Examination Survey (KNHANES V). Available online: https://knhanes.cdc.go.kr/knhanes/sub04/sub04_03.do (accessed on 20 December 2019).
- Ji, X.; Yang, H.; Wang, J.; Li, R.; Zhao, H.; Xu, J.; Xiao, Y.; Tang, B.; Qian, M. Occurrence of deoxynivalenol (DON) in cereal-based food products marketed through e-commerce stores and an assessment of dietary exposure of Chinese consumers to DON. Food Control. 2018, 92, 391–398. [Google Scholar] [CrossRef]
- Abramović, B.; Jajić, I. Natural occurrence of deoxynivalenol in soybean grown in Serbia. In Soybean and Wheat Crops: Growth, Fertilization, and Yield; Davies, S., Evans, G., Eds.; Editors Nova Science Publishers Inc.: Hauppauge, NY, USA, 2009; pp. 103–113. Available online: http://www.novapublishers.org/catalog/product_info.php?products_id=9577 (accessed on 10 December 2019).
- Hazel, C.M.; Patel, S. Influence of processing on trichothecene levels. Toxicol. Lett. 2004, 153, 51–59. [Google Scholar] [CrossRef]
- Scott, P.M.; Kanhere, S.R.; Daley, E.F.; Farber, J.M. Fermentation of wort containing deoxynivalenol and zearalenone. Mycotoxin Res. 1992, 8, 58–66. [Google Scholar] [CrossRef]
- McCormick, S. The role of DON in pathogenicity. In Fusarium Head Blight of Wheat and Barley; Leonard, K.J., Bushnell, W.R., Eds.; The American Phytopathological Society: St. Paul, MN, USA, 2003; pp. 35–43. Available online: https://www.worldcat.org/title/fusarium-head-blight-of-wheat-and-barley/oclc/52290463#relatedsubjects (accessed on 10 December 2019).
- Pestka, J.J. Deoxynivalenol: mechanisms of action, human exposure, and toxicological relevance. Arch. Toxicol. 2010, 84, 663–679. [Google Scholar] [CrossRef]
- FSCJ (Food Safety Commission of Japan). Risk Assessment Report 4 Deoxynivalenol and Nivalenol (Mycotoxin), FS/872/2010. 2010. Available online: https://www.fsc.go.jp/english/evaluationreports/nm_toxins/toxs_fullreport_fs872_2010.pdf (accessed on 28 January 2020).
- Cheat, S.; Gerez, J.R.; Cognié, J.; Alassane-Kpembi, I.; Bracarense, A.P.F.L.; Raymond-Letron, I.; Oswald, I.P.; Kolf-Clauw, M. Nivalenol Has a Greater Impact than Deoxynivalenol on Pig Jejunum Mucosa in Vitro on Explants and in Vivo on Intestinal Loops. Toxins 2015, 7, 1945–1961. [Google Scholar] [CrossRef]
- JECFA (Joint FAO/WHO Expert Committee on Food Additives). Evaluation of certain food additives and contaminants. (Report of the 72nd meeting of the joint FAO/WHO Expert Committee on Food Additives (JECFA)). WHO Technical Report Series 2010, 958. Available online: https://apps.who.int/iris/bitstream/handle/10665/44514/WHO_TRS_959_eng.pdf (accessed on 28 January 2020).
- CONTAM (European Food Safety Authority Panel on Contaminants in the Food Chain). Appropriateness to set a group health based guidance value for nivalenol and its modified forms. EFSA J. 2017, 15, 4751–4776. [Google Scholar]
- CONTAM (European Food Safety Authority Panel on Contaminants in the Food Chain). Risks to human and animal health related to the presence of deoxynivalenol and its acetylated and modified forms in food and feed. EFSA J. 2017, 15, 4718–5063. [Google Scholar] [CrossRef]
- Lee, S.Y.; Woo, S.Y.; Malachová, A.; Michlmayr, H.; Kim, S.H.; Kang, G.J.; Chun, H.S. Simple validated method for simultaneous determination of deoxynivalenol, nivalenol, and their 3-β-D-glucosides in baby formula and Korean rice wine via HPLC-UV with immunoaffinity cleanup. Food Addit. Contam. A 2019, 36, 964–975. [Google Scholar] [CrossRef] [PubMed]
- Lancova, K.; Hajslova, J.; Poustka, J.; Krplova, A.; Zachariasova, M.; Dostalek, P.; Sachambula, L. Transfer of Fusarium mycotoxins and ‘masked’ deoxynivalenol (deoxynivalenol-3-glucoside) from field barley through malt to beer. Food Addit. Contam. A 2008, 25, 732–744. [Google Scholar] [CrossRef] [PubMed]
- Lee, J.K.; Chang, I.Y.; Kim, H.; Yun, S.H.; Leslie, J.F.; Lee, Y.W. Genetic Diversity and Fitness of Fusarium graminearum Populations from Rice in Korea. Appl. Environ. Microbiol. 2009, 75, 3289–3295. [Google Scholar] [CrossRef]
- Lee, S.H.; Lee, J.K.; Nam, Y.J.; Lee, S.H.; Ryu, J.G.; Lee, T. Population Structure of Fusarium graminearum from Maize and Rice in 2009 in Korea. Plant Pathol. 2010, 26, 321–327. [Google Scholar]
- Kim, D.H.; Hong, S.Y.; Jeon, M.H.; An, J.M.; Kim, S.Y.; Kim, H.Y.; Yoon, B.R.; Chung, S.H. Simultaneous determination of the levels of deoxynivalenol, 3-acetyldeoxynivalenol, and nivalenol in grain and feed samples from South Korea using a high-performance liquid chromatography–photodiode array detector. Appl. Biol. Chem. 2016, 59, 881–887. [Google Scholar] [CrossRef]
- Zhao, Y.; Guan, X.; Zong, Y.; Hua, X.; Xing, F.; Wang, Y.; Wang, F.; Liu, Y. Deoxynivalenol in wheat from the Northwestern region in China. Food Addit. Contam. B 2018, 11, 281–285. [Google Scholar] [CrossRef]
- Xu, W.; Han, X.; Li, F. Co-occurrence of multi-mycotoxins in wheat grains harvested in Anhui province, China. Food Control. 2019, 96, 180–185. [Google Scholar] [CrossRef]
- Dong, F.; Wang, S.; Yu, M.; Sun, Y.; Xu, J.; Shi, J. Natural occurrence of deoxynivalenol and deoxynivalenol-3-glucoside in various wheat cultivars grown in Jiangsu province, China. World Mycotoxin J. 2017, 10, 285–293. [Google Scholar] [CrossRef]
- Yoshinari, T.; Suzuki, Y.; Sugita-Konishi, Y.; Ohnishi, T.; Terajima, J. Occurrence of beauvericin and enniatins in wheat flour and corn grits on the Japanese market, and their co-contamination with type B trichothecene mycotoxins. Food Addit. Contam. A 2016, 33, 1620–1626. [Google Scholar] [CrossRef]
- Simsek, S.; Burgess, K.; Whitney, K.L.; Gu, Y.; Qian, S.Y. Analysis of deoxynivalenol and deoxynivalenol-3-glucoside in wheat. Food Control. 2012, 26, 287–292. [Google Scholar] [CrossRef]
- Kushiro, M. Effects of Milling and Cooking Processes on the Deoxynivalenol Content in Wheat. Int. J. Mol. 2008, 9, 2127–2145. [Google Scholar] [CrossRef] [PubMed]
- Li, X.; Michlmayr, H.; Schweiger, W.; Malachova, A.; Shin, S.; Huang, Y.; Dong, Y.; Wiesenberger, G.; McCormick, S.; Lemmens, M.; et al. A barley UDP-glucosyltransferase inactivates nivalenol and provides Fusarium Head Blight resistance in transgenic wheat. J. Exp. Bot. 2017, 68, 1287–2197. [Google Scholar] [CrossRef] [PubMed]

 ), DON3G (
 ), NIV (
 ), and NIV3G (
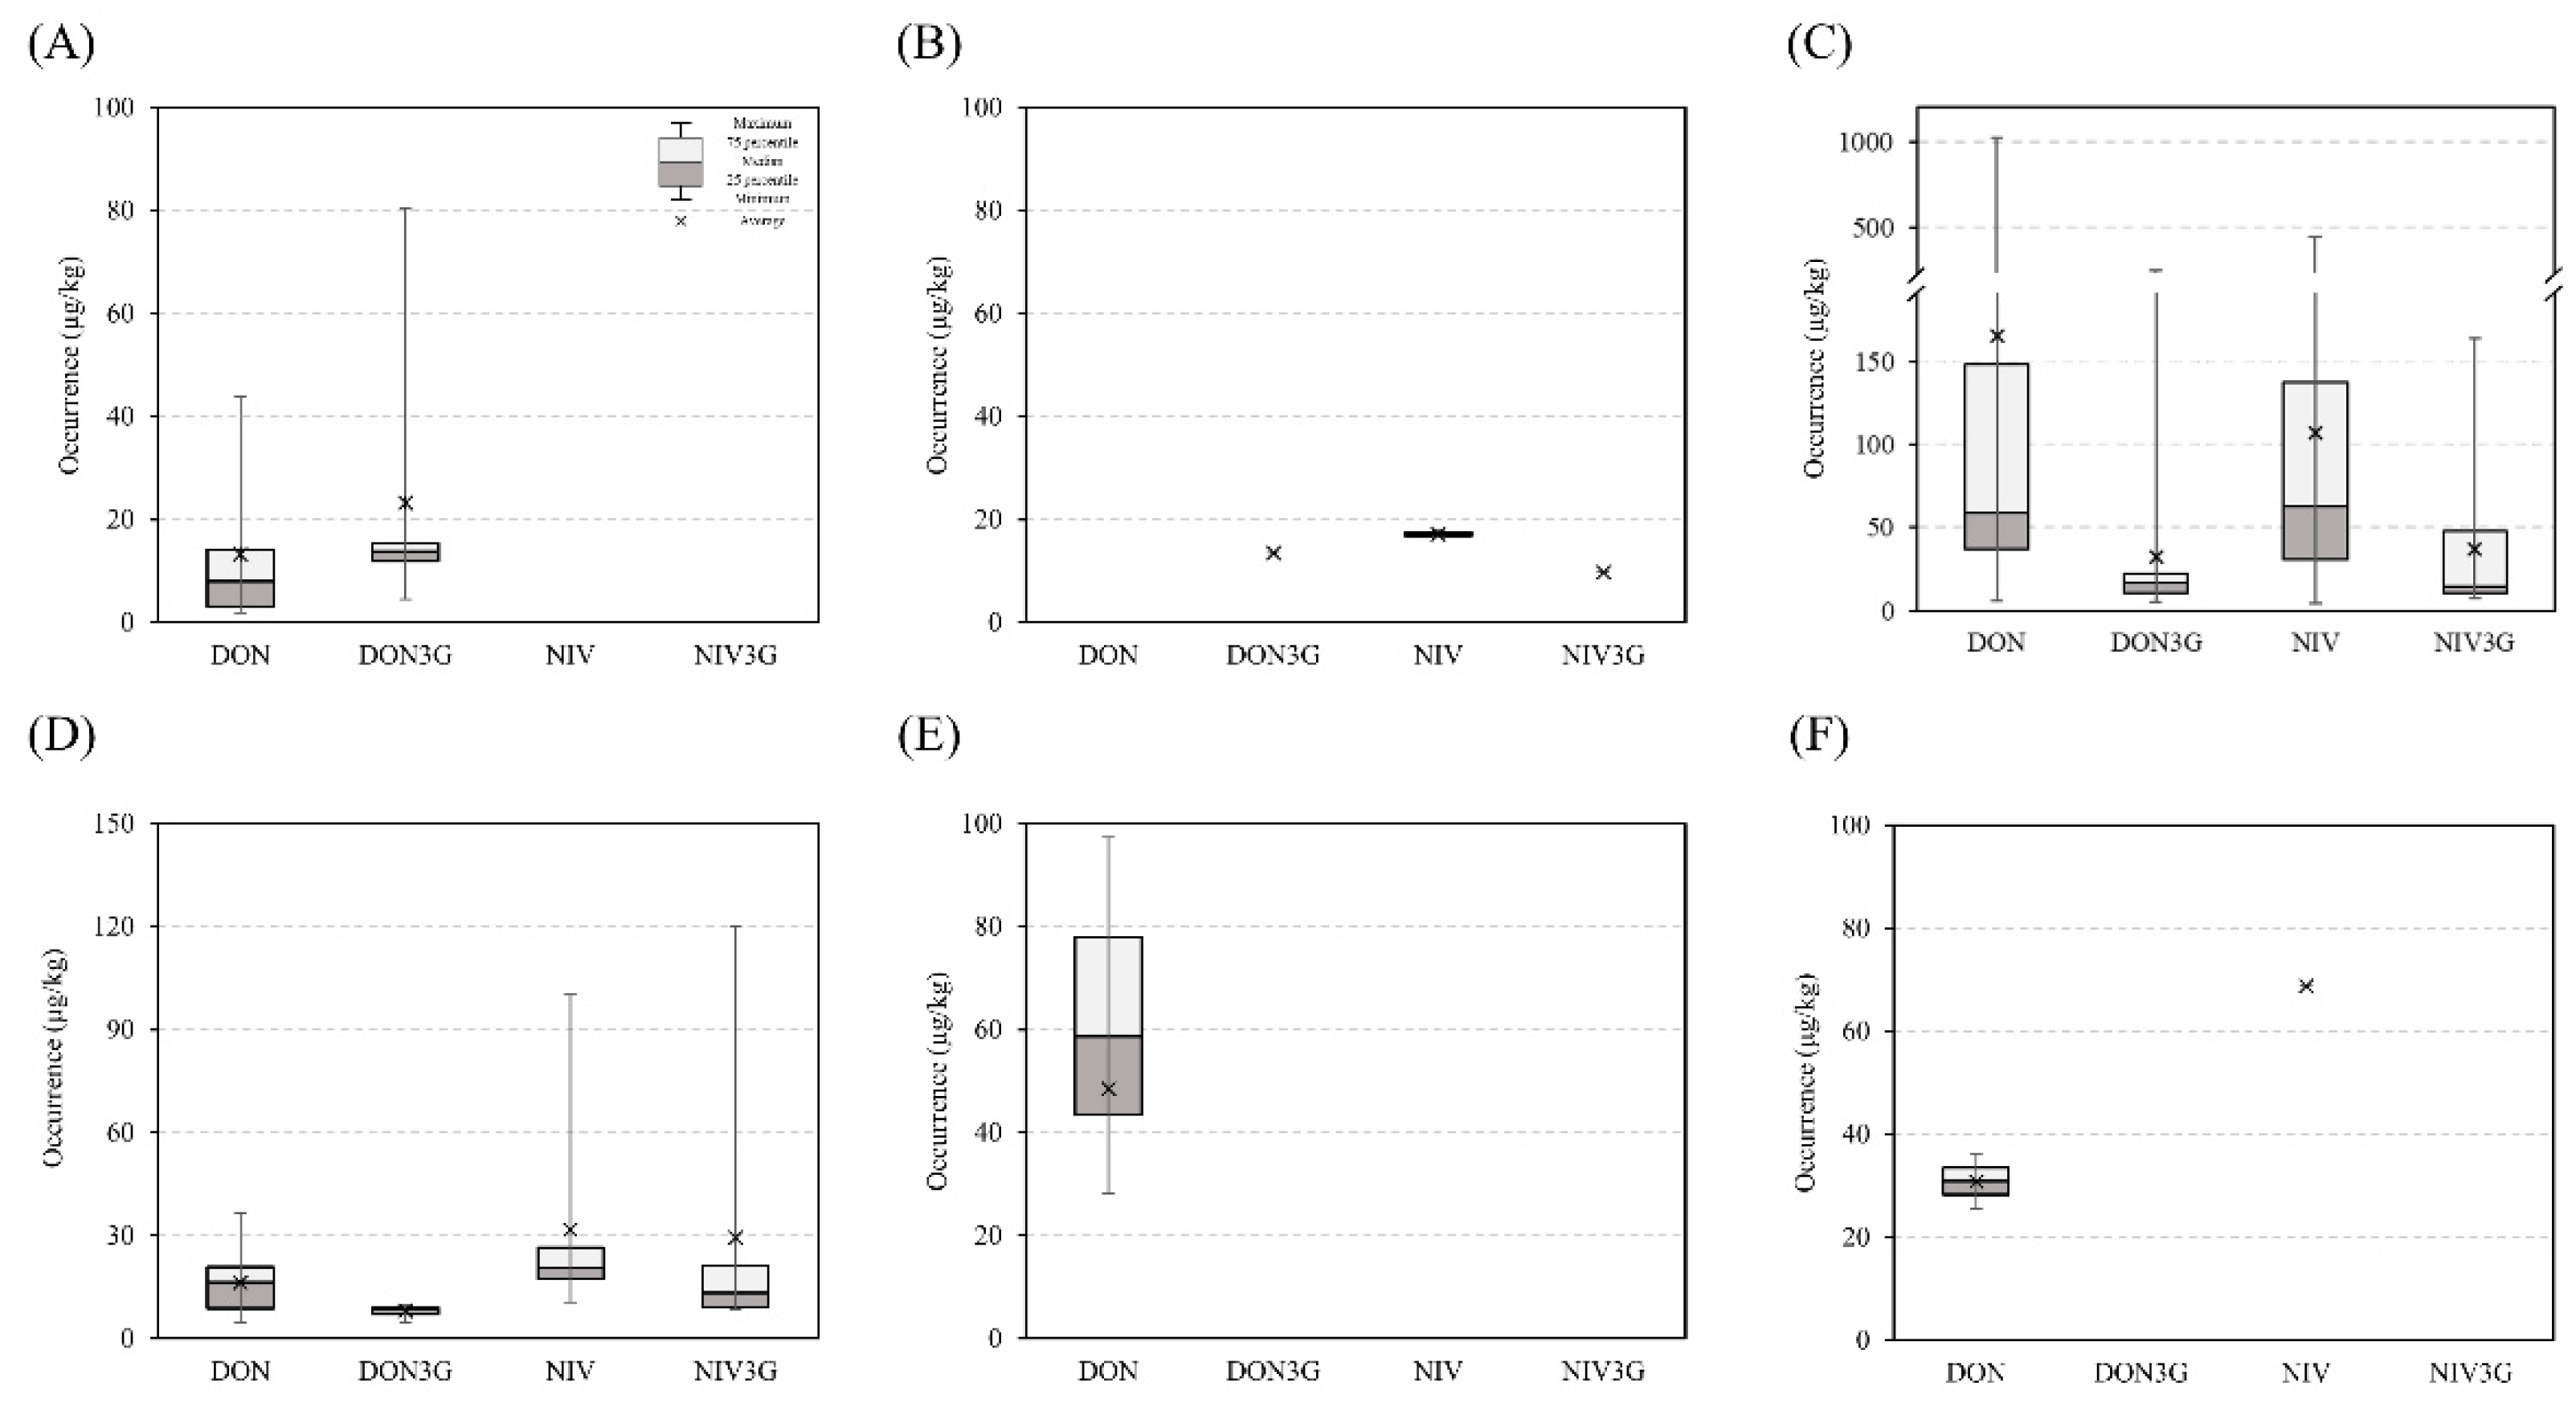
 ) in commercial food groups. Panels (A), (B), (C), (D), (E), and (F) indicate alcoholic beverages, baby foods, cereals and cereal-based products, legumes and legume-based products, noodles, and snacks, respectively.
), DON3G (), NIV (), and NIV3G () in commercial food groups. Panels (A), (B), (C), (D), (E), and (F) indicate alcoholic beverages, baby foods, cereals and cereal-based products, legumes and legume-based products, noodles, and snacks, respectively.
) in commercial food groups. Panels (A), (B), (C), (D), (E), and (F) indicate alcoholic beverages, baby foods, cereals and cereal-based products, legumes and legume-based products, noodles, and snacks, respectively.
), DON3G (), NIV (), and NIV3G () in commercial food groups. Panels (A), (B), (C), (D), (E), and (F) indicate alcoholic beverages, baby foods, cereals and cereal-based products, legumes and legume-based products, noodles, and snacks, respectively.
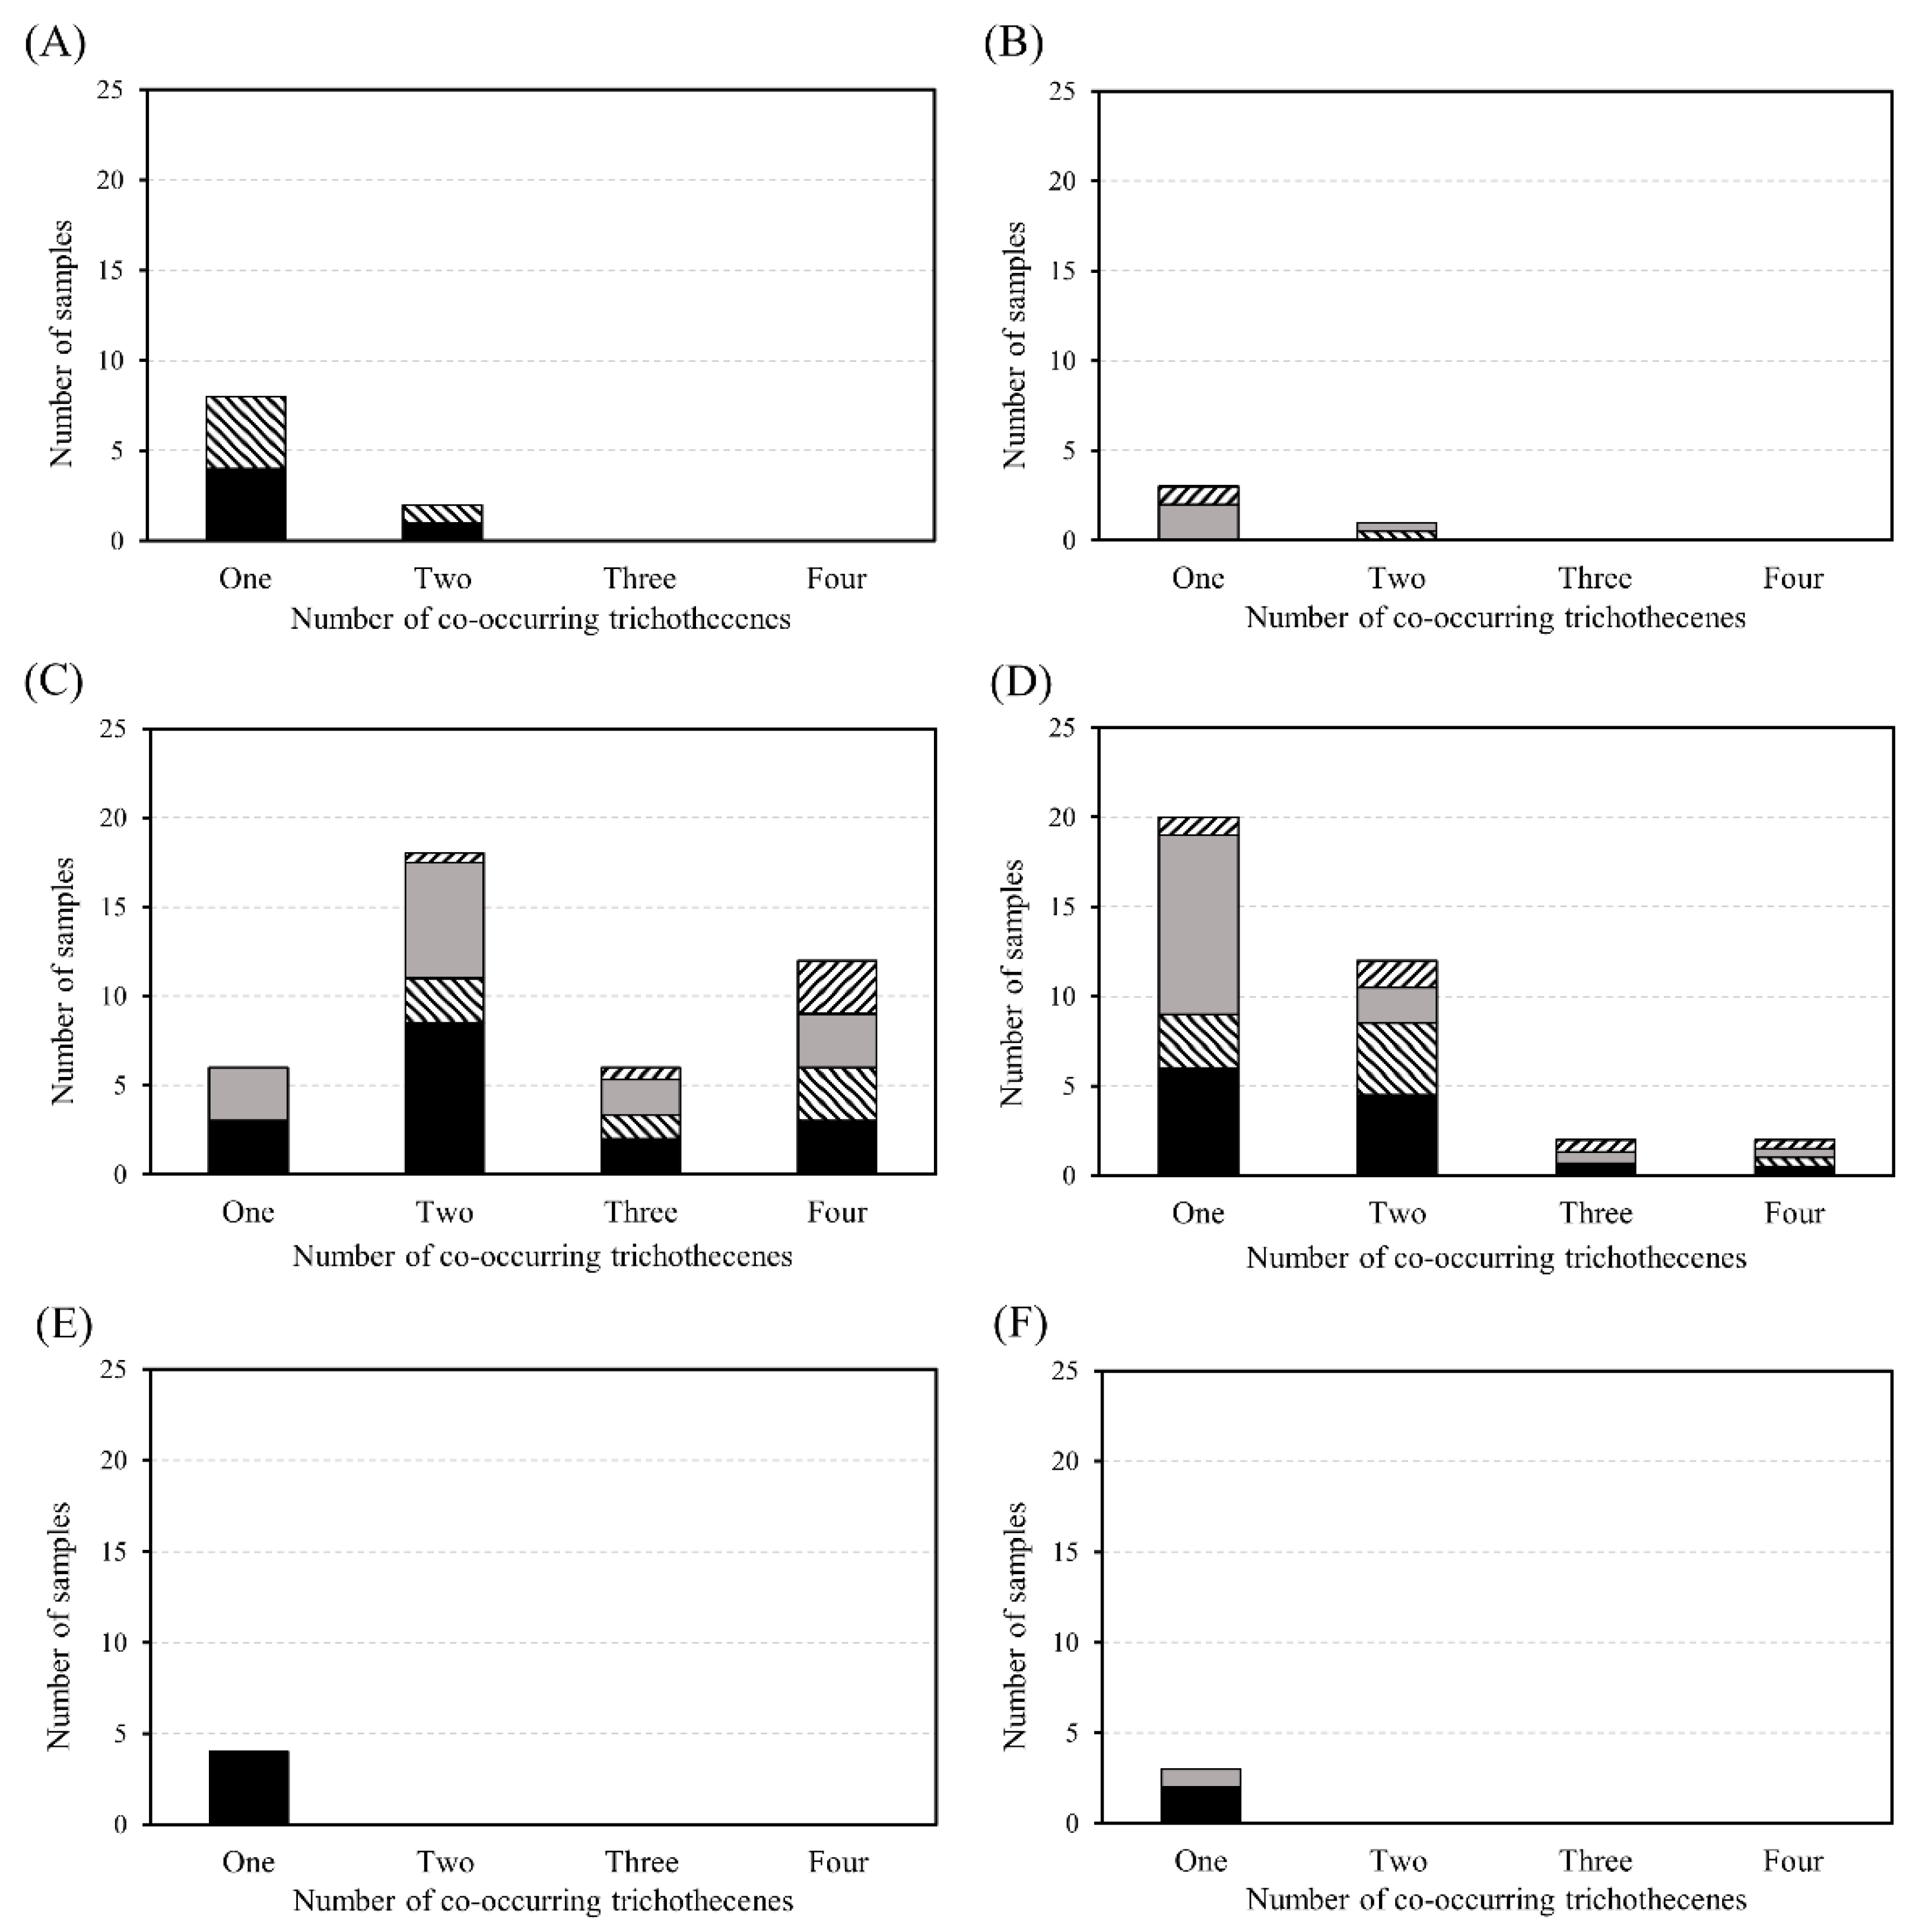
 : alcoholic beverages,
  : baby foods,
  : cereals and cereal based products,
  : legumes and legumes-based products,
  : noodles,
  : snacks).
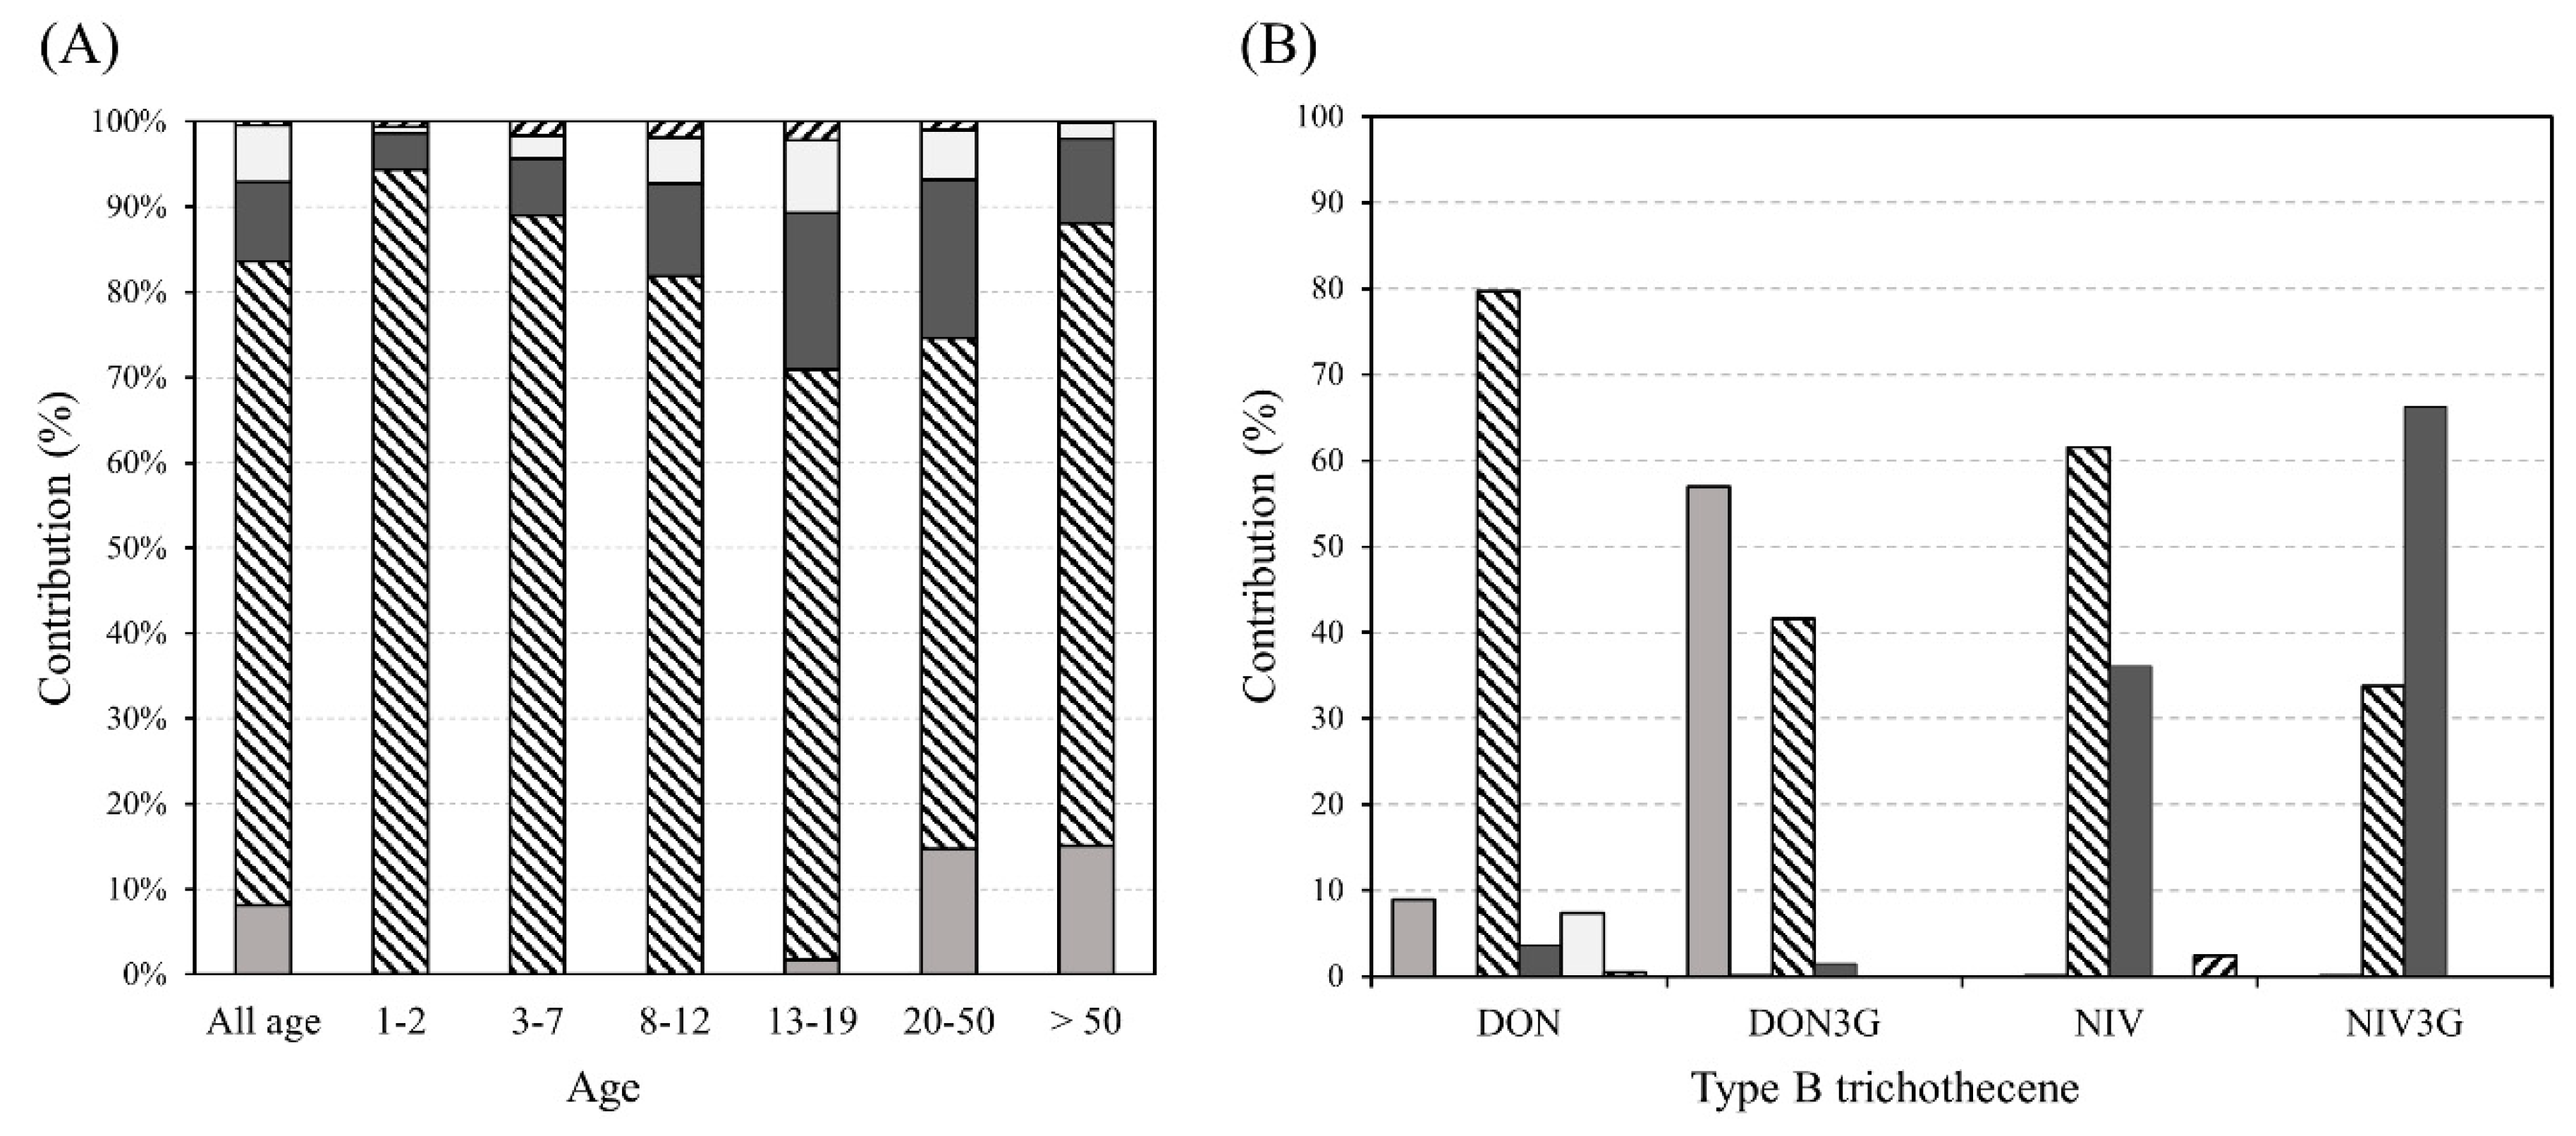
: alcoholic beverages, : baby foods, : cereals and cereal based products, : legumes and legumes-based products, : noodles, : snacks).
: snacks).
: alcoholic beverages, : baby foods, : cereals and cereal based products, : legumes and legumes-based products, : noodles, : snacks).

| Toxin | Parameter | Matrix | |||
|---|---|---|---|---|---|
| Baby Food (Solid-Flour) | Soybean Paste (Solid-Paste) | Sorghum (Solid-Colored) | Korean Rice Wine (Liquid) | ||
| DON | LOD (μg kg−1) | 3.9 | 1.4 | 1.4 | 1.5 |
| LOQ (μg kg−1) | 11.7 | 4.3 | 4.1 | 4.4 | |
| Recovery (%) | |||||
| 2LOQ | 87.4 | 95.8 | 103.9 | 100.0 | |
| 5LOQ | 84.7 | 96.7 | 87.9 | 104.7 | |
| RSD (%) | |||||
| 2LOQ | 9.3 | 3.4 | 3.4 | 3.4 | |
| 5LOQ | 12.4 | 5.3 | 1.9 | 3.0 | |
| DON3G | LOD (μg kg−1) | 5.3 | 1.5 | 1.4 | 1.5 |
| LOQ (μg kg−1) | 16.1 | 4.6 | 4.1 | 4.5 | |
| Recovery (%) | |||||
| 2LOQ | 86.5 | 84.5 | 87.1 | 103.0 | |
| 5LOQ | 82.9 | 89.7 | 86.5 | 96.2 | |
| RSD (%) | |||||
| 2LOQ | 0.3 | 5.0 | 5.8 | 2.8 | |
| 5LOQ | 2.0 | 7.2 | 9.9 | 2.0 | |
| NIV | LOD (μg kg−1) | 3.5 | 1.3 | 1.9 | 2.0 |
| LOQ (μg kg−1) | 10.6 | 3.9 | 5.8 | 6.1 | |
| Recovery (%) | |||||
| 2LOQ | 103.3 | 85.4 | 98.2 | 95.0 | |
| 5LOQ | 90.8 | 84.9 | 80.1 | 100.1 | |
| RSD (%) | |||||
| 2LOQ | 4.1 | 12.9 | 9.5 | 2.5 | |
| 5LOQ | 7.2 | 4.3 | 6.3 | 2.4 | |
| NIV3G | LOD (μg kg−1) | 4.6 | 1.2 | 1.0 | 1.1 |
| LOQ (μg kg−1) | 13.8 | 3.5 | 3.1 | 3.3 | |
| Recovery (%) | |||||
| 2LOQ | 90.6 | 98.3 | 88.9 | 106.5 | |
| 5LOQ | 88.2 | 94.1 | 80.6 | 105.8 | |
| RSD (%) | |||||
| 2LOQ | 1.5 | 2.6 | 6.1 | 2.5 | |
| 5LOQ | 9.4 | 5.6 | 2.6 | 3.0 | |
| Food Group 1/Subgroup | DON | DON3G | NIV | NIV3G | ||||
|---|---|---|---|---|---|---|---|---|
| Range | Positive Mean | Range | Positive Mean | Range | Positive Mean | Range | Positive Mean | |
| A | ||||||||
| Beer | 2.0–43.9 | 14.7 (5/20)2 | 4.5–80.3 | 23.3 (6/20) | -5 | 0.0 (0/20) | - | 0.0 (0/20) |
| Rice wine | 6.2 | 6.2 (1/15) | - | 0.0 (0/15) | - | 0.0 (0/15) | - | 0.0 (0/15) |
| B | ||||||||
| Baby formula3 | - | 0.0 (0/16) | 13.5 | 14.0 (1/16) | 16.5–17.9 | 17.0 (3/16) | 9.8 | 10.0 (1/16) |
| Baby formula4 | - | 0.0 (0/11) | - | 0.0 (0/11) | - | 0.0 (0/11) | - | 0.0 (0/11) |
| C | ||||||||
| Barley | 11.7–286.0 | 75.8 (5/15) | 18.0–20.6 | 19.3 (2/15) | 17.3–229.6 | 90.2 (6/15) | 10.4–110.3 | 60.3 (2/15) |
| Barley tea | - | 0.0 (0/6) | - | 0.0 (0/6) | - | 0.0 (0/6) | - | 0.0 (0/6) |
| Breakfast cereal | 5.6–88.6 | 44.0 (4/23) | 5.0–17.0 | 9.7 (4/23) | - | 0.0 (0/23) | - | 0.0 (0/23) |
| Brown rice | - | 0.0 (0/22) | - | 0.0 (0/22) | 47.4 | 47.4 (1/22) | - | 0.0 (0/22) |
| Buckwheat | - | 0.0 (0/5) | - | 0.0 (0/5) | - | 0.0 (0/5) | - | 0.0 (0/5) |
| Canned corn | - | 0.0 (0/4) | - | 0.0 (0/4) | - | 0.0 (0/4) | - | 0.0 (0/4) |
| Foxtail millet | 18.8–1018.4 | 214.8 (6/11) | 56.2–93.6 | 74.9 (2/11) | 27.4–370.8 | 151.8 (5/11) | 56.2–164.1 | 110.2 (2/11) |
| Glutinous rice | - | 0.0 (0/7) | - | 0.0 (0/7) | - | 0.0 (0/7) | - | 0.0 (0/7) |
| Job’s tears | 22.6–751.4 | 306.3 (9/11) | 6.6–26.4 | 15.9 (7/11) | 12.6–337.6 | 133.8 (10/11) | 7.6–39.2 | 14.6 (7/11) |
| Maize | 445.0 | 445.0 (1/12) | 56.3 | 56.3 (1/12) | 51.3 | 51.3 (1/12) | - | 0.0 (0/12) |
| Oat | - | 0.0 (0/11) | - | 0.0 (0/11) | 23.5 | 23.5 (1/11) | 33.5 | 33.5 (1/11) |
| Scorched rice | - | 0.0 (0/5) | - | 0.0 (0/5) | - | 0.0 (0/5) | - | 0.0 (0/5) |
| Sorghum | 18.9–711.7 | 119.0 (12/12) | 10.4–43.4 | 18.8 (5/12) | 4.6–145.8 | 54.3 (11/12) | 11.5–14.8 | 13.2 (2/12) |
| Wheat | - | 0.0 (0/13) | - | 0.0 (0/13) | 211.9 | 211.9 (1/13) | 250.6 | 250.6 (1/13) |
| White rice | - | 0.0 (0/17) | - | 0.0 (0/17) | - | 0.0 (0/17) | - | 0.0 (0/17) |
| D | ||||||||
| Cheonggukjang | - | 0.0 (0/15) | 7.5 | 7.5 (1/15) | - | 0.0 (0/15) | - | 0.0 (0/15) |
| Chunjang | 19.0–36.5 | 23.0 (7/15) | 7.1–9.9 | 8.0 (8/15) | 83.8 | 83.8 (1/15) | 54.5 | 54.5 (1/15) |
| Gochujang | 4.7–32.2 | 16.0 (4/15) | 6.7 | 6.7 (1/15) | 16.0–89.9 | 29.0 (9/15) | 8.5–120.2 | 34.0 (5/15) |
| Mixed paste | 7.7–8.2 | 8.0 (2/15) | 4.7 | 4.7 (1/15) | 15.9–100.6 | 35.0 (6/15) | 12.8–16.3 | 14.0 (3/15) |
| Mungbean | - | 0.0 (0/10) | - | 0.0 (0/10) | - | 0.0 (0/10) | - | 0.0 (0/10) |
| Pea | - | 0.0 (0/10) | - | 0.0 (0/10) | - | 0.0 (0/10) | - | 0.0 (0/10) |
| Red bean | 4.9–9.6 | 8.0 (3/15) | 9.4 | 9.4 (1/15) | 17.2 | 17.2 (1/15) | - | 0.0 (0/15) |
| Soybean | 15.7 | 15.7 (1/15) | 9.6 | 9.6 (1/15) | - | 0.0 (0/15) | - | 0.0 (0/15) |
| Soybean paste | 11.1–16.5 | 14.0 (2/15) | - | 0.0 (0/15) | - | 0.0 (0/15) | - | 0.0 (0/15) |
| Soymilk | - | 0.0 (0/11) | - | 0.0 (0/11) | 10.6 | 10.6 (1/10) | - | 0.0 (0/11) |
| Soy sauce | - | 0.0 (0/15) | - | 0.0 (0/15) | 21.8 | 21.8 (1/15) | - | 0.0 (0/15) |
| Tofu | - | 0.0 (0/10) | - | 0.0 (0/10) | - | 0.0 (0/10) | - | 0.0 (0/10) |
| E | ||||||||
| Kalguksu | - | 0.0 (0/4) | - | 0.0 (0/4) | - | 0.0 (0/4) | - | 0.0 (0/4) |
| Noodle | 10.1 | 10.1 (1/15) | - | 0.0 (0/15) | - | 0.0 (0/15) | - | 0.0 (0/15) |
| Ramen | 28.3–97.3 | 61.4 (3/22) | - | 0.0 (0/22) | - | 0.0 (0/22) | - | 0.0 (0/22) |
| Spaghetti | - | 0.0 (0/16) | - | 0.0 (0/16) | - | 0.0 (0/16) | - | 0.0 (0/10) |
| F | ||||||||
| Biscuit, cookie | - | 0.0 (0/11) | 0.0 | 0.0 (0/11) | 0.0 | 0.0 (0/11) | - | 0.0 (0/11) |
| Popcorn | - | 0.0 (0/4) | 0.0 | 0.0 (0/4) | 68.7 | 68.7 (1/4) | - | 0.0 (0/4) |
| Snack | 25.7–36.1 | 30.9 (2/37) | 0.0 | 0.0 (0/37) | 0.0 | 0.0 (0/37) | - | 0.0 (0/37) |
| Total | 2.0–1018.4 | 101.9 (68/506) | 4.5–93.6 | 22.9 (41/506) | 4.6–370.8 | 77.1 (59/506) | 7.6–250.6 | 33.4 (25/506) |
| Parameter | DON | DON3G | ∑ (DON + DON3G | NIV | NIV3G | ∑ (NIV + NIV3G) |
|---|---|---|---|---|---|---|
| Occurrence (μg kg−1) | ||||||
| Lower bound | 13.7 | 1.9 | 7.8 | 8.8 | 1.6 | 5.2 |
| Upper bound | 17.3 | 6.9 | 12.1 | 12.9 | 7.6 | 10.3 |
| Food consumption (g kg−1 b.w. day−1) | ||||||
| Mean intake | 0.00–160.06 | |||||
| 95% intake | 0.00–347.73 | |||||
| EDI (μg kg−1 b.w. day−1)/%TDI1 | ||||||
| Scenario 12 | 0.019/1.9 | 0.004/0.4 | 0.023/2.3 | 0.007/1.8 | 0.002/0.5 | 0.009/2.3 |
| Scenario 2 | 0.046/4.6 | 0.006/0.6 | 0.052/5.2 | 0.029/7.2 | 0.009/2.2 | 0.038/9.4 |
| Scenario 3 | 0.038/3.8 | 0.032/3.2 | 0.070/7.0 | 0.030/7.4 | 0.032/7.9 | 0.062/15.3 |
| Scenario 4 | 0.102/10.2 | 0.089/8.9 | 0.191/19.1 | 0.094/23.5 | 0.095/23.8 | 0.189/47.3 |
© 2020 by the authors. Licensee MDPI, Basel, Switzerland. This article is an open access article distributed under the terms and conditions of the Creative Commons Attribution (CC BY) license (http://creativecommons.org/licenses/by/4.0/).
Share and Cite
Lee, S.Y.; Woo, S.Y.; Tian, F.; Song, J.; Michlmayr, H.; Kim, J.-B.; Chun, H.S. Occurrence of Deoxynivalenol, Nivalenol, and Their Glucosides in Korean Market Foods and Estimation of Their Population Exposure through Food Consumption. Toxins 2020, 12, 89. https://doi.org/10.3390/toxins12020089
Lee SY, Woo SY, Tian F, Song J, Michlmayr H, Kim J-B, Chun HS. Occurrence of Deoxynivalenol, Nivalenol, and Their Glucosides in Korean Market Foods and Estimation of Their Population Exposure through Food Consumption. Toxins. 2020; 12(2):89. https://doi.org/10.3390/toxins12020089
Chicago/Turabian StyleLee, Sang Yoo, So Young Woo, Fei Tian, Jeonghun Song, Herbert Michlmayr, Jung-Bok Kim, and Hyang Sook Chun. 2020. "Occurrence of Deoxynivalenol, Nivalenol, and Their Glucosides in Korean Market Foods and Estimation of Their Population Exposure through Food Consumption" Toxins 12, no. 2: 89. https://doi.org/10.3390/toxins12020089
APA StyleLee, S. Y., Woo, S. Y., Tian, F., Song, J., Michlmayr, H., Kim, J.-B., & Chun, H. S. (2020). Occurrence of Deoxynivalenol, Nivalenol, and Their Glucosides in Korean Market Foods and Estimation of Their Population Exposure through Food Consumption. Toxins, 12(2), 89. https://doi.org/10.3390/toxins12020089