Article

A Gold Growth-Based Plasmonic ELISA for the Sensitive Detection of Fumonisin B1 in Maize

1
State Key Laboratory of Food Science and Technology, Nanchang University, Nanchang 330047, China
2
Jiangxi Institute of Veterinary Drug and Feedstuff Control, Nanchang 330096, China
3
Jiangxi-OAI Joint Research Institute, Nanchang University, Nanchang 330047, China
*
Authors to whom correspondence should be addressed.
These authors contributed equally to this work.
Toxins 2019, 11(6), 323; https://doi.org/10.3390/toxins11060323
Submission received: 24 April 2019 / Revised: 31 May 2019 / Accepted: 4 June 2019 / Published: 5 June 2019
(This article belongs to the Special Issue Advanced Methods for Mycotoxins Detection)

Abstract

:
In this paper, a highly sensitive plasmonic enzyme-linked immunosorbent assay (pELISA) was developed for the naked-eye detection of fumonisin B1 (FB1). Glucose oxidase (GOx) was used as an alternative to horseradish peroxidase as the carrier of the competing antigen. GOx catalyzed the oxidation of glucose to produce hydrogen peroxide, which acted as a reducing agent to reduce Au3+ to Au on the surface of gold seeds (5 nm), This reaction led to a color change in the solution from colorless to purple, which was observable to the naked eye. Various parameters that could influence the detection performance of pELISA were investigated. The developed method exhibited a considerably high sensitivity for FB1 qualitative naked-eye detection, with a visible cut-off limit of 1.25 ng/mL. Moreover, the proposed pELISA showed a good linear range of 0.31–10 ng/mL with a half maximal inhibitory concentration (IC50) of 1.86 ng/mL, which was approximately 13-fold lower than that of a horseradish peroxidase- (HRP)-based conventional ELISA. Meanwhile, the proposed method was highly specific and accurate. In summary, the new pELISA exhibited acceptable accuracy and precision for sensitive naked-eye detection of FB1 in maize samples and can be applied for the detection of other chemical contaminants.
Key Contribution: A novel dc-pELISA was developed for the naked eye detection of fumonisin B1. In this method, glucose oxidase (GOx) was used as an alternative to horseradish peroxidase as the carrier of the competing antigen. GOx catalyzed the oxidation of glucose to produce hydrogen peroxide, which acted as a reducing agent to reduce Au3+ to Au0 on the surface of gold seeds (5 nm). The combination of ultrahigh sensitivity of pELISA and the vivid color change generated from AuNPs growth, a visible cut-off limit of the proposed method was achieved at 1.25 ng/mL. Moreover, our proposed method exhibited a good quantitative detection performance in real maize samples.

1. Introduction

Fumonisins (FBs), a group of mycotoxins that are mainly produced by a number of Fusarium species, occur worldwide in foods, such as maize and maize-based products. Their presence in food leads to cases of acute and chronic exposure in humans and animals [1]. To date, 28 fumonisins have been isolated, and they can be categorized into four series, known as A, B, C, and P. Fumonisin B1 (FB1), B2 (FB2), and B3 (FB3) are the principal fumonisins that are the relevant contaminants of cereal [1,2]. Among them, FB1 has already been classified as a potential carcinogen (group 2B) by the International Agency for Research on Cancer because of its carcinogenic, nephrotoxic, and hepatotoxic effects on humans and animals [3]. The European Commission has set action levels for a sum of 4000 μg/kg FB1 in unprocessed maize, and maximum levels at 200 μg/kg in processed maize-based and baby foods [4,5]. A maximum level of 2.0–4.0 mg/kg for total fumonisins (FB1, FB2, and FB3) in human foods is recommended by the U.S. Food and Drug Administration [5,6].
Various instrumental detection methods, including the high performance liquid chromatographic method [4,7] and liquid chromatography coupled to mass spectrometry, or tandem mass spectrometry (LC/MS/MS) [8,9], have been developed for FB1 detection in different food samples. These methods have high accuracy, good specificity, and reliability; however, they are generally limited by the required sophisticated instruments, tedious sample preparation, and highly trained/skilled technicians. Thus, they are not suitable for routine screening of suspected contaminants in many samples [5]. A gold nanoparticle (AuNP)-based immunochromatographic assay (ICA) has been widely used for on-site detection of various mycotoxins because of its simplicity, rapidity (less than 10 min), and naked-eye detection [10]. However, it is commonly limited by poor sensitivity. The enzyme-linked immunosorbent assay (ELISA) has relatively high sensitivity, because it involves the usage of horseradish peroxidase (HRP)-catalyzed tetramethylbenzidine for signal amplification. However, the insufficient signal intensity of the resulting products, with an extinction coefficient as low as 5.9 × 10⁴ M−1 cm−1, limited the detection sensitivity of a conventional ELISA [11].
Compared with a conventional ELISA, the plasmonic enzyme-linked immunoassay (pELISA), based on the localized surface plasmon resonance (LSPR) of AuNPs as signal output, shows a higher sensitivity because the extinction coefficient of AuNPs is 4–5 order higher than that of the traditional chromophoric group [11,12,13,14,15,16,17,18,19]. Distinct LSPR change can be induced by slight changes of the compositions, shapes, sizes or aggregation states of AuNPs, and thus promotes various AuNPs-based colorimetric assays for detection of antigens, nucleic acids, mycotoxins and microorganisms. Among all these strategies, the controlled growth kinetics strategy was widely used due to its high detection sensitivity and good robustness [15,20,21,22]. AuNPs with a size of 30–40 nm exhibit a bright purple color, whereas the small-sized AuNP solution (~5 nm) is colorless at the same molar concentration because of its lower molar extinction coefficient. When the solution contains gold seeds (5 nm AuNPs), HAuCl4·3H2O, and reductant, such as hydrogen peroxide (H2O2), the Au3+ is prone to reduction into the Au atom on the surface of gold seeds. The small-sized AuNPs are grown into large-sized AuNPs, thereby resulting in a dramatic color change from colorless to purple, which is easy to be observed by the naked eye.
In this study, a novel pELISA based on the controlled growth kinetics of AuNPs was developed for naked-eye detection of FB1 in food samples. The combination of the ultrahigh sensitivity of pELISA and the vivid color change generated from AuNPs growth contributed to the high sensitivity of the proposed method for FB1 visual inspection, with a cut-off limit of 1.25 ng/mL. This method also showed a good linear range of 0.31 ng/mL to 10 ng/mL for FB1 quantitative detection, with a half maximal inhibitory concentration (IC50) of 1.86 ng/mL. The accuracy, robustness, and reliability of the proposed pELISA were evaluated by analyzing FB1-spiked agricultural products and further comparing the results with the conventional ELISA method. The results demonstrated that the proposed pELISA has a great potential for sensitive detection of FB1 contamination by the naked eye or a plate reader, especially in resource-constrained regions.

2. Results and Discussion

2.1. Principle of the Proposed pELISA Method

The principle of the proposed method is shown in Figure 1. Glucose oxidase (GOx) was used as an alternative to HRP as the carrier of competing antigen. In the absence of FB1 in the solution, GOx-FB1 conjugates (GOx@FB1) were captured by the antibodies that were immobilized on the wells and catalyzed glucose to generate H2O2. Au3+ was reduced to Au atom on the surface of 5 nm gold seeds (which was originally diluted to be colorless with a concentration of 5 nM), resulting in an increase in the size of the AuNPs and a remarkable color change from colorless to purple red. Conversely, less GOx was captured on the plate wells, resulting in lower growth of AuNPs and color change of the solution.

2.2. Feasibility of GOx Regulated AuNPs Growth

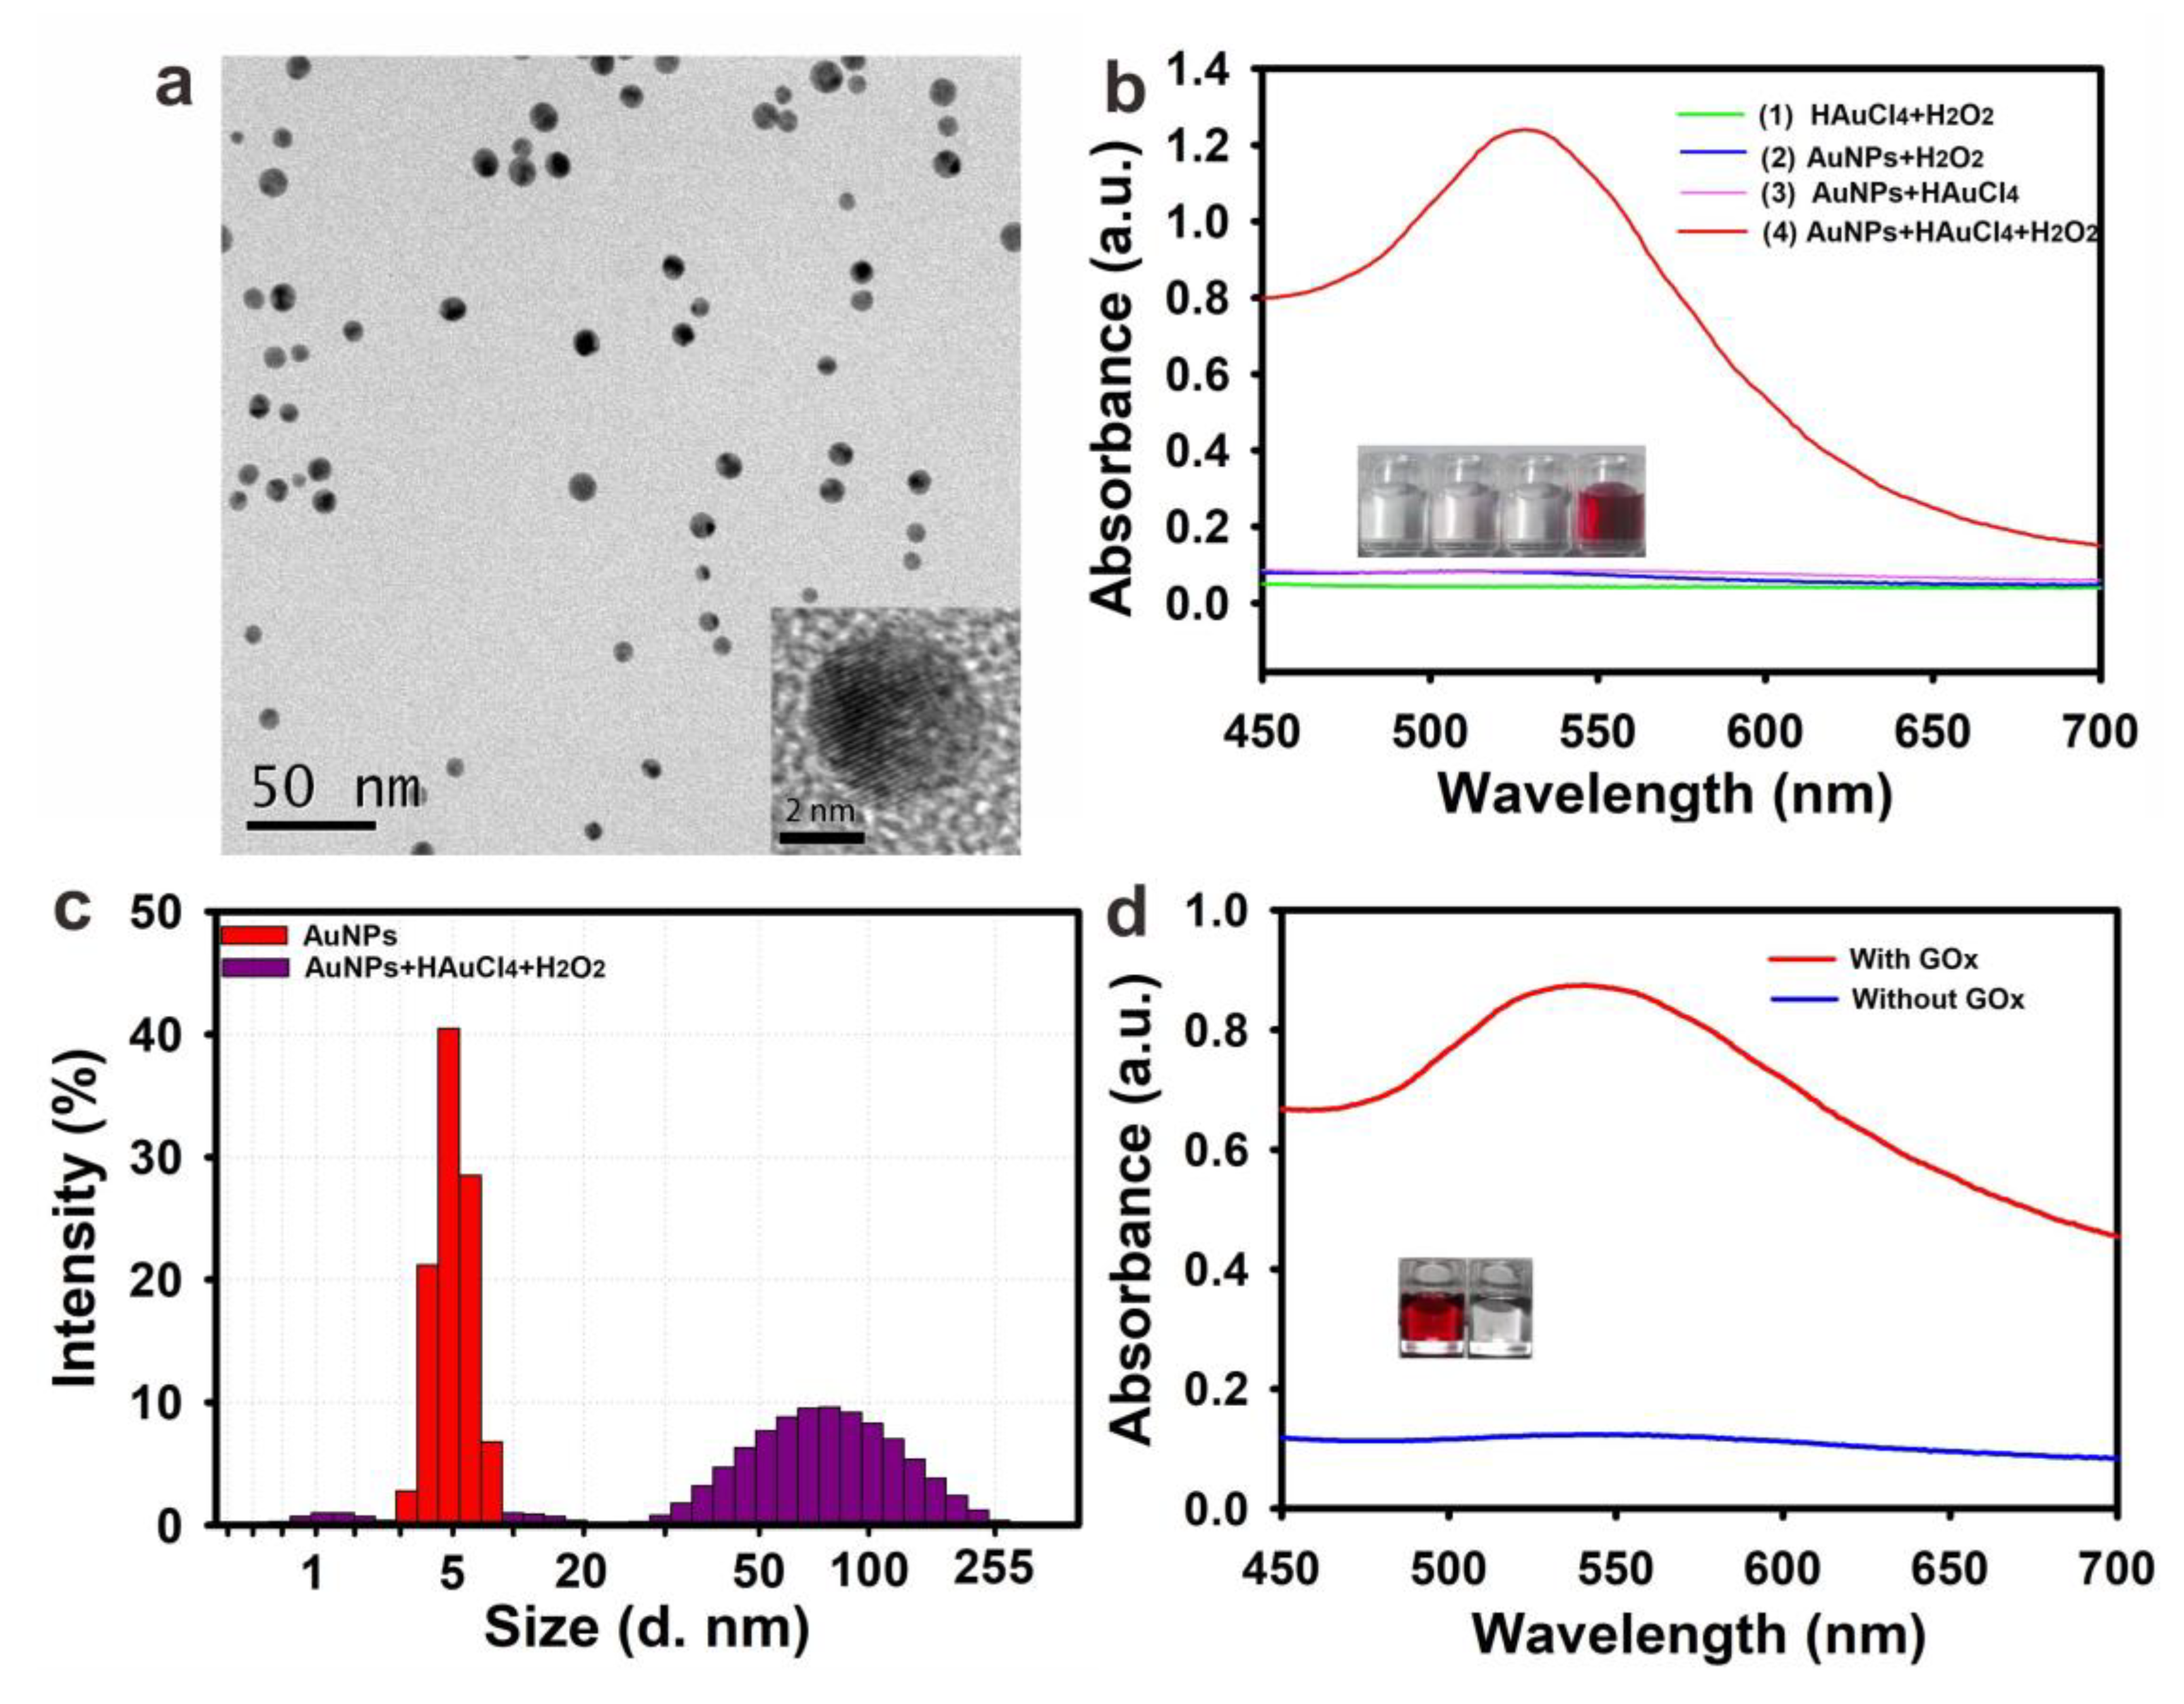
As is reported, the extinction coefficient of small-sized AuNPs, such as 5 nm, is much lower than those of larger-sized AuNPs [13]. Thus, the diluted small-sized AuNPs at a relatively low concentration were colorless. These kinds of small-sized AuNPs are easy to grow into larger-sized AuNPs with a red or purple red color in the presence of H2O2 and HAuCl4 to produce a vivid color contrast. In this study, the small-sized AuNPs were synthesized according to a previously described method [23]. The TEM image in Figure 2a shows that the as-prepared gold seeds displayed a narrow size distribution with an average diameter of 5.0 nm ± 0.5 nm (n = 50). The UV-visible (UV-vis) spectra (Figure S1a) revealed that the gold seed solution exhibited a maximum surface plasma resonance (SPR) peak at 520 nm. The Dynamic light scattering (DLS) analysis (Figure S1b) indicated that the average hydrodynamic diameter of gold seeds was 5.5 nm ± 0.3 nm (n = 3) with a polydispersity index (PDI) at 0.191, indicating an excellent monodispersity of the synthesized gold seed solution. Furthermore, no aggregation and flocculation were observed after the storage of the as-prepared gold seed solution at 4 °C for six months.
To verify the feasibility of the H2O2-mediated of AuNPs growth, four tracers, including (1) HAuCl4 + H2O2, (2) gold seed solution + H2O2, (3) gold seed solution + HAuCl4, and (4) gold seed solution + HAuCl4 + H2O2, were performed. To obtain a high signal-to-noise ratio, the optimal H2O2 and HAuCl4 concentrations were 100 μM and 0.4 mM, respectively, because the excess contents of H2O2 and HAuCl4 are prone to directly reduce HAuCl4 into the Au atom in the absence of gold seeds, which could generate a color background that could interfere with the naked-eye observation [13]. The gold seed solution was diluted to colorless (5 nM). The results in the inset of the Figure 1b showed that the color of the solution in the group (4) turned into purple red, indicating that the HAuCl4 can be reduced into the Au atom in the addition of gold seeds and H2O2 in generating large-sized AuNPs. The red-shift SPR peak at 530 nm of the purple red solution further demonstrated the growth of AuNPs. The TEM image in Figure S2 showed that the shape of AuNPs changed from a regular sphere to irregular morphology with an increased size of 45 nm ± 13 nm. The DLS analysis (Figure 2c) showed that the average hydrodynamic diameter of AuNPs also increased to 67 nm ± 3 nm, whereas the PDI value increased to 0.375, indicating a non-uniform size distribution of grown AuNPs. The irregular size and morphology of grown AuNPs were ascribed to the reduced Au atoms that were clustered and deposited on the surfaces of the gold seeds when the H2O2 concentration is at a low level. This result is similar with the previous report [13]. Furthermore, we also investigated the impact of GOx on the growth of AuNPs. With the catalytic oxidation of glucose to generate H2O2 using GOx, the gold solution observably turned into purple red with an obvious SPR peak at 530 nm (Figure 2d). This result demonstrated that the H2O2 generated from the oxidation of GOx to glucose can also induce the gold seed growth mode and accordingly paves the way for further developed GOx-mediated pELISA.

2.3. Optimization of the Parameters of pELISA

In this study, the GOx was used as an alternative for HRP in the development of a direct competitive pELISA. The competing antigen was prepared by coupling the carboxyl group of FB1 molecule with the amino group of GOx. The UV–visible spectra of FB1, GOx, and GOx@FB1 conjugates are shown in Figure S3. The results displayed that the FB1 molecule have no characteristic absorption peak in the range of 200 nm to 350 nm. The results showed that, compared with the FB1 molecule, an obvious characteristic absorption peak in the range of 280 nm was observed on GOx@FB1 conjugates, and the peak was with a slight red shift with further comparison of GOx, indicating the successful conjugation of the FB1 molecule and GOx. To further verify whether the FB1 molecule was coupled with the GOx, the GOx@FB1 conjugate was bound to an anti-FB1 mAbs pre-coated onto the plate well. The glucose substrate was added after washing the unbound GOx@FB1 conjugate, and the bioactivity of GOx was evaluated by determining the concentration of the generated H2O2. The results in the inset of Figure S3 show that the GOx was bound on the plate well by the FB1 and mAbs interaction, further showing that the GOx@FB1 conjugate was successfully prepared for subsequent analysis.
In the directly competitive pELISA, the concentrations of the coating antibody (anti-FB1 ascitic fluids) and the competitive antigen were two key parameters that influenced the detection sensitivity [24]. The optimal concentrations of the coating antibody and the competitive antigen were obtained through a checkerboard titration method. The increase in the concentrations of the coating antibody and GOx@FB1 resulted to the gradual change from colorless to purple red of the solution color in the plate wells (Figure S4) and the sharp rise in the optical density at 530 nm (OD530) (Table S1). When the concentrations of the coating antibody and GOx@FB1 were 2.00 μg/mL and 1.56 μg/mL, respectively, the solution color in the plate well appeared as clear purple red with an OD530 value at 0.15, which was easily identified by the naked eye. The lower concentrations of coating antibody and GOx@FB1 were not enough to produce significant color contrast, thereby reducing the signal-to-noise ratio. Thus, the optimal concentrations of anti-FB1 mAbs and GOx@FB1 were set at 2.00 μg/mL and 1.56 μg/mL, respectively.
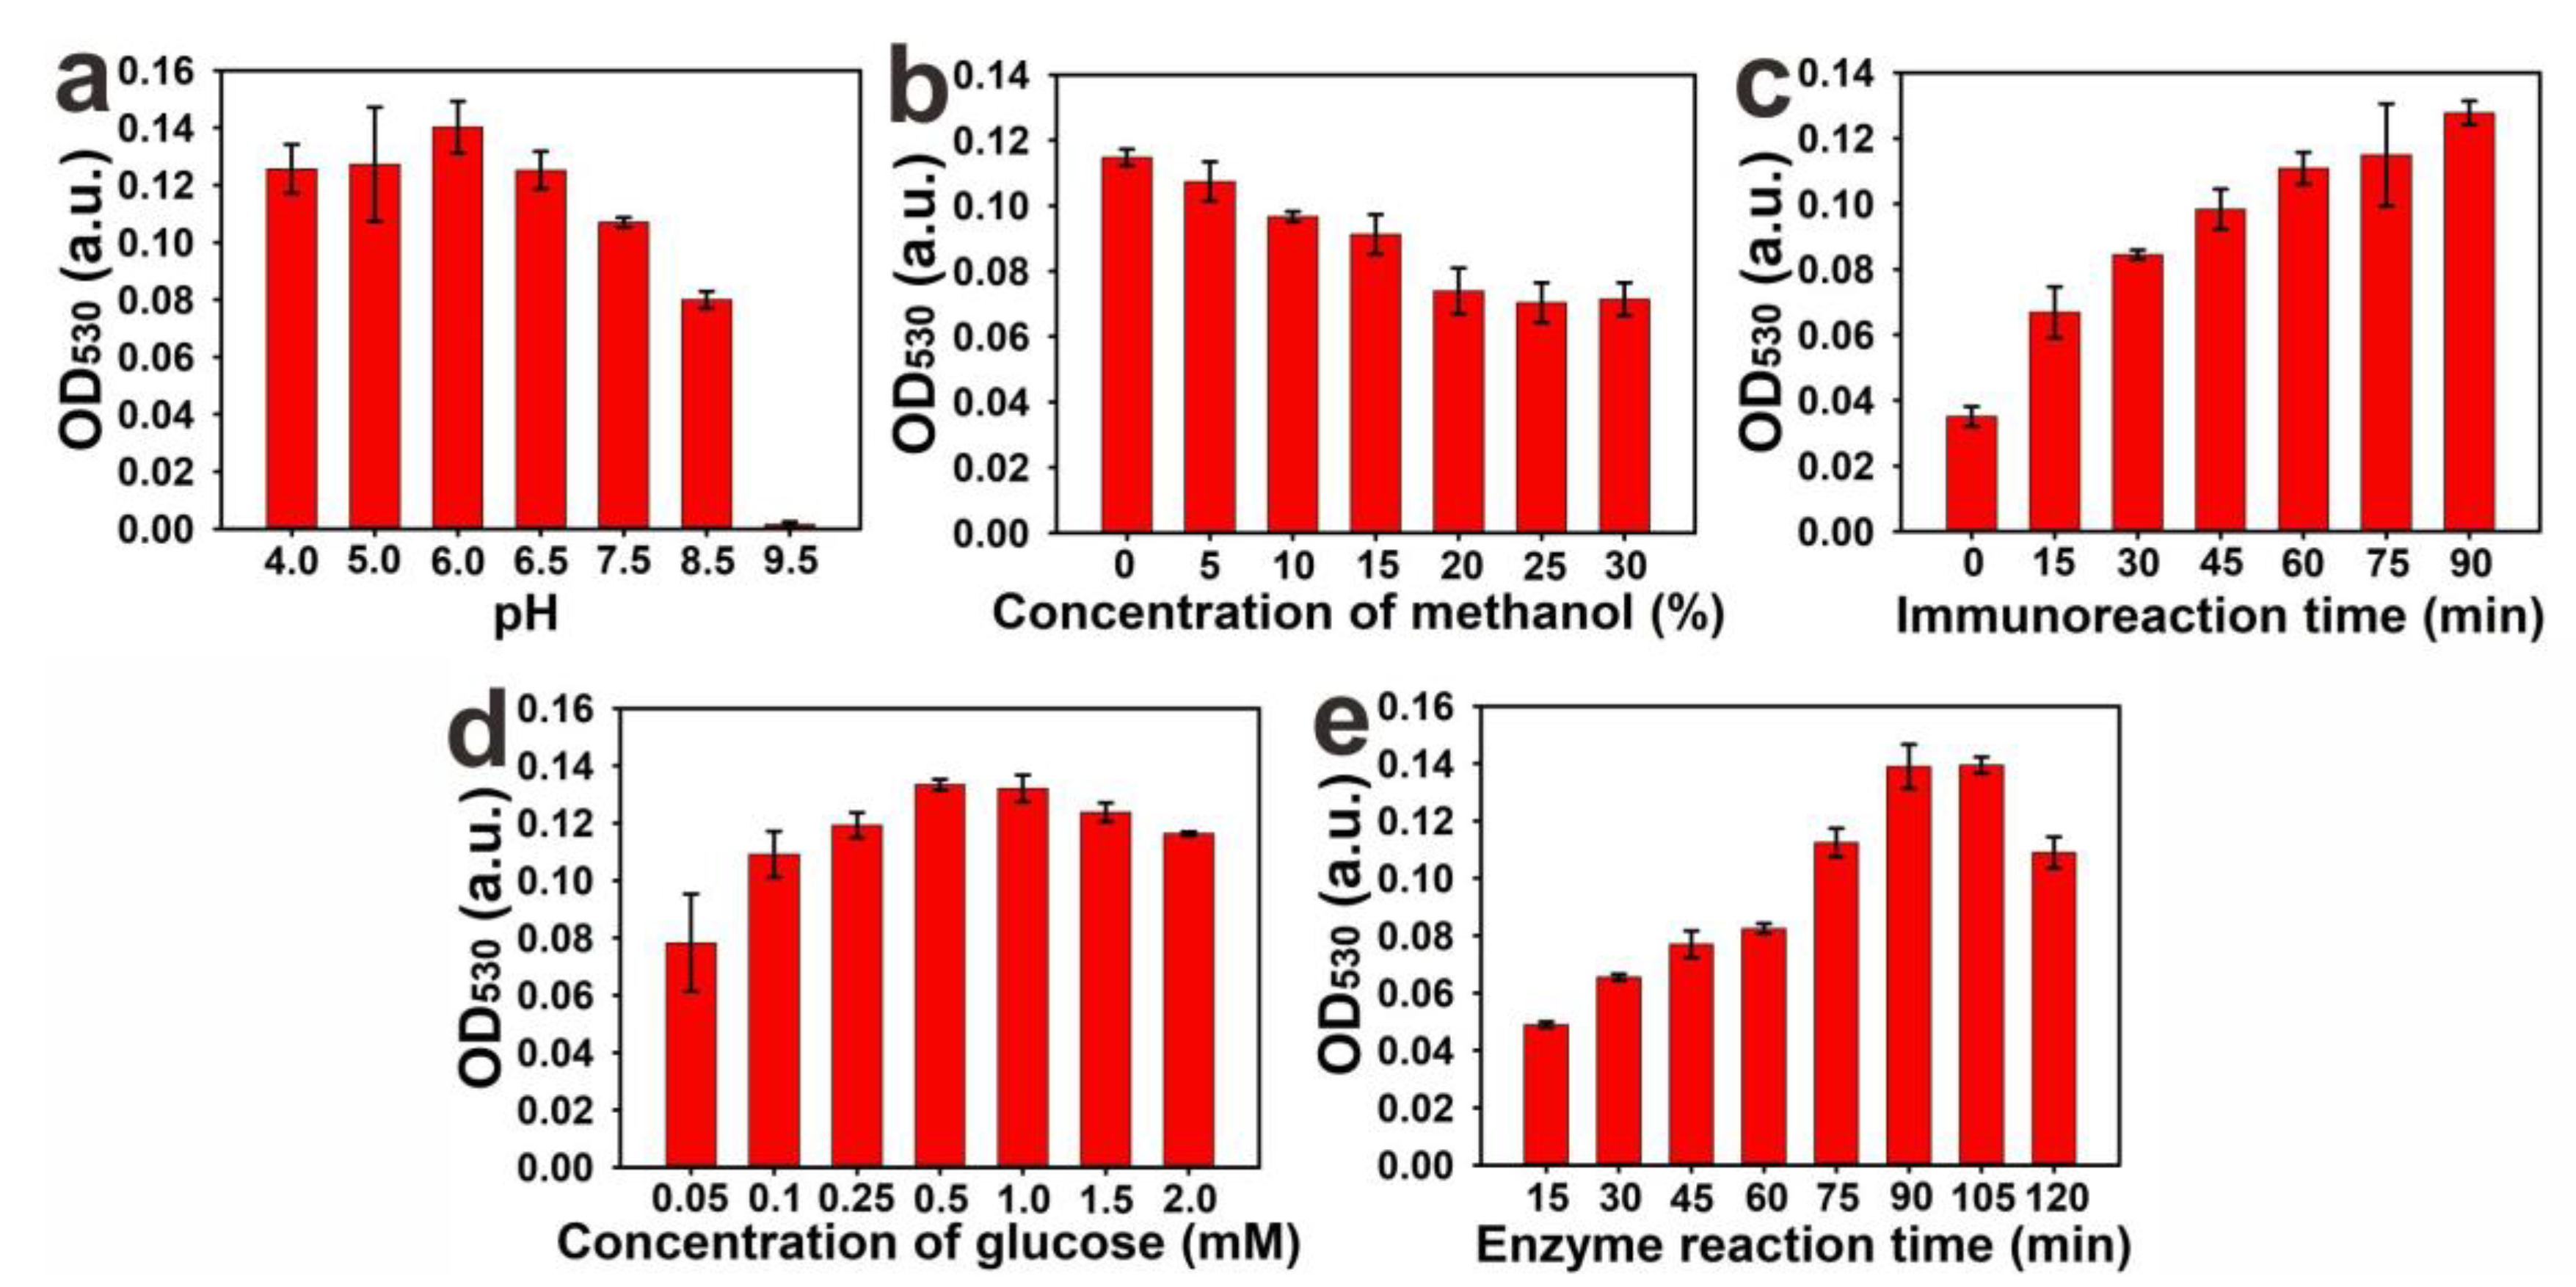
Moreover, previous studies demonstrated that pH value, methanol content, and immunoreaction time could significantly influence the immunoreactions between the antigen and the antibody, thereby reducing the detection sensitivity of the immunoassay [24,25]. Thus, the determination of the effects of the pH on the immunoassay was performed by adjusting the pH within the range of 4.0 to 9.5. As shown in Figure 3a, the OD530 values showed a relatively high level at a relatively low pH, indicating that the weak acid condition (pH = 4.0–6.0) may be conducive to the interaction of the FB1 molecule and mAbs. Increasing the pH from 6.0 to 8.5 resulted to the gradual decrease of the OD530 value from 0.141 to 0.075. At pH 9.5, the OD530 value sharply decreased to 0.002. To ensure an efficient immunological response, pH 6.0 was considered as the optimal pH condition for the subsequent experiments. The extraction solution containing a certain concentration of methanol can effectively reduce the matrix interference of the protein or water-soluble components from maize samples. However, antibody-antigen interaction can be influenced by a high content of methanol [26]. Thus, we investigated the effects of different methanol concentrations ranging from 0% to 30% on the immunoassay. As depicted in Figure 3b, the OD530 values significantly decreased with the increase in methanol content from 0% to 30%, indicating that the methanol concentration has a great impact on the interaction of FB1 and mAbs. Considering the high sensitivity of the proposed method, the actual extraction solution was suggested to be diluted with pH 6.0 PBS (0.01 M) to a final methanol concentration of 5% for further analysis. The results of the effects of immunoreaction time between mAbs and FB1@GOx on the immunoassay are shown in Figure 3c. The results indicate that the OD530 value gradually increased and did not reached a plateau when the reaction time was extended to 90 min. However, the solution color exhibited an obvious purple red after 60 min. Therefore, 60 min of immunoreaction time was sufficient to ensure a high ratio of signal to noise for the naked-eye observation. In addition, the concentration of glucose and the time of GOx catalyzed-glucose oxidation could also impact the H2O2 production, further affecting the sensitivity of pELISA. Figure 3d indicates that the OD530 values reached the maximum when the glucose concentration was 0.5 M. An excessive glucose concentration could result in the occurrence of substrate inhibition effect, which in turn would decrease the catalytic efficiency of GOx and lower the OD530 value. Additionally, the catalysis reaction time between FB1@GOx and glucose substrate were investigated. Figure 3e shows that the OD530 value increased greatly by prolonging the reaction time. It then reached a plateau when the catalysis time was 90 min. Collectively, the optimized experimental conditions were described as follows: the 0.01 M PBS with pH of 6.0 was used for mAbs and antigen immunoreactions; the real sample extraction containing 60% methanol should be further diluted to a final concentration of 5%; the immunoreaction time between mAbs and antigen was set at 60 min; 0.5 M glucose was used as the enzyme substrate; and reaction time of GOx catalysis catalyzed-glucose oxidation was set at 90 min.

2.4. Analytical Performance of pELISA for the Sensitive Detection of FB1

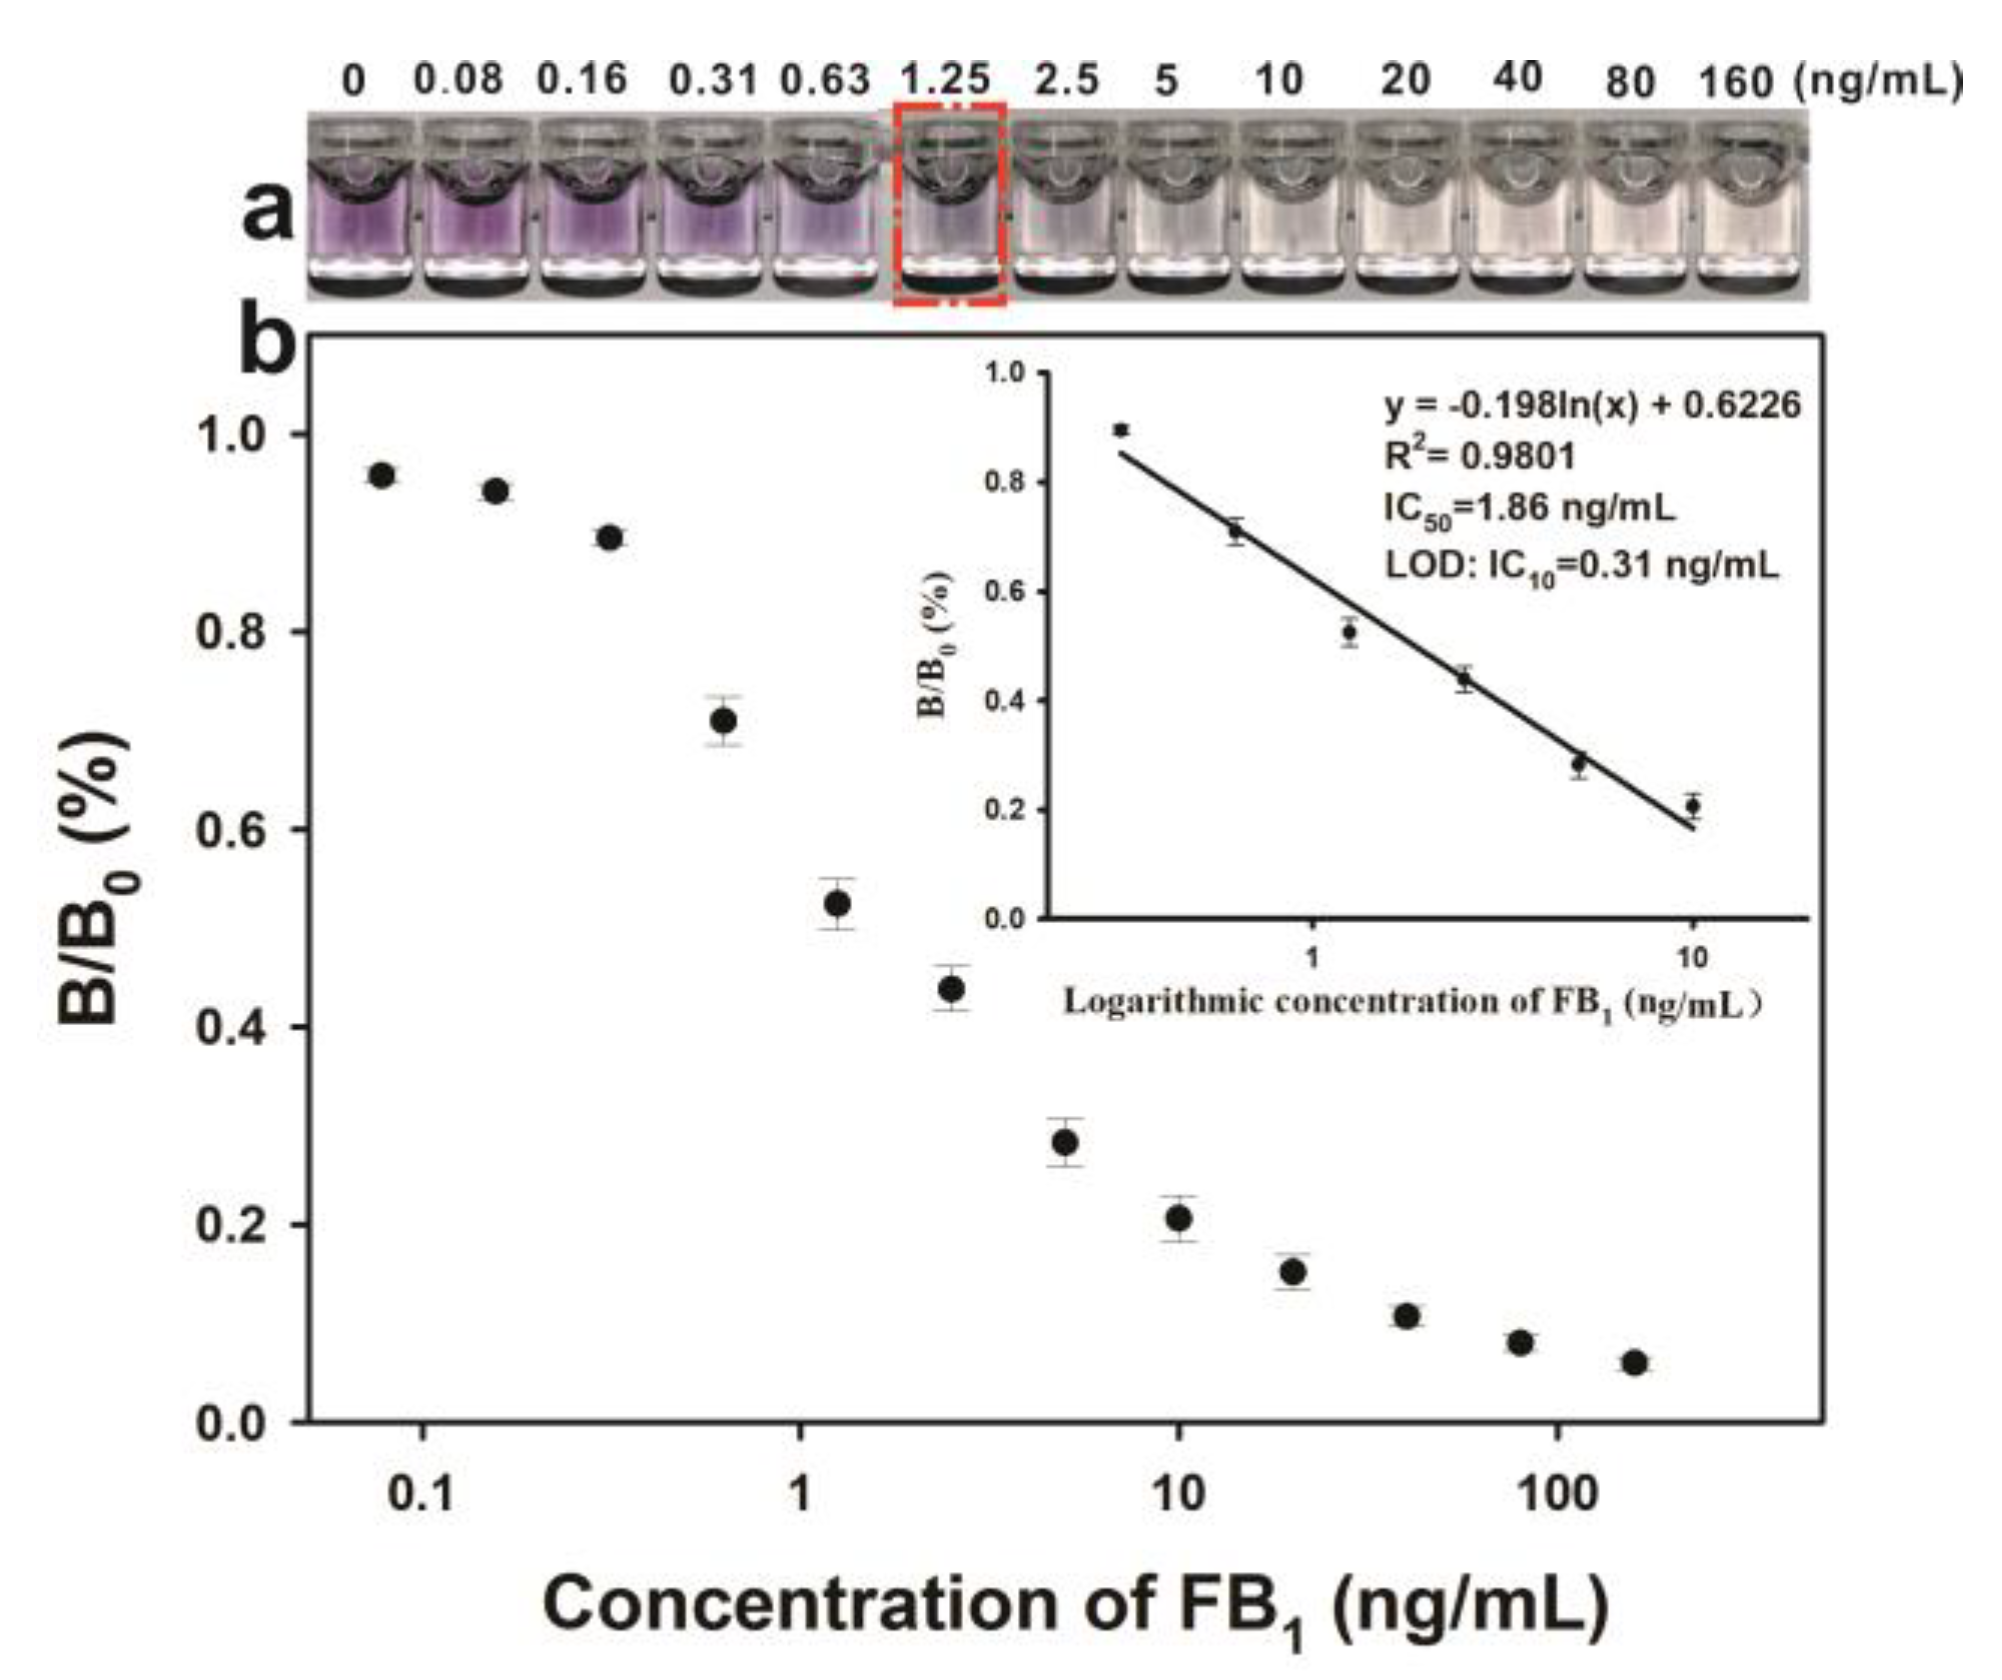
Under the optimal experimental conditions, the competitive inhibition curve of the pELISA was developed. Figure 4a shows that the color of the solution obviously changed from purple red to colorless by increasing the FB1 concentration from 0 ng/mL to 1.25 ng/mL. The tonality from purple red to colorless was easily distinguishable by the naked eye. Therefore, 1.25 ng/mL of FB1 was defined as the visible cut-off limit by the naked eye. Quantitative analysis of the proposed pELISA method was performed based on the FB1 calibration curve. The calibration curve was constructed by plotting the B/B0 against different FB1 concentrations (0 ng/mL, 0.08 ng/mL, 0.16 ng/mL, 0.31 ng/mL, 0.63 ng/mL, 1.25 ng/mL, 2.5 ng/mL, 5 ng/mL, 10 ng/mL, 20 ng/mL, 40 ng/mL, 80 ng/mL, and 160 ng/mL), where B and B0 represented the OD530 values of sample with and without FB1, respectively. Figure 4b shows that the developed pELISA exhibited a good linear range of 0.31 ng/mL to 10 ng/mL with a reliable correlation coefficient (R2) at 0.9801. The regression equation could be represented by y = −0.198 ln(x) + 0.6226, where y is B/B0 and x is the FB1 concentration. The error bars were based on quadruplicate measurements. The IC50 of the obtained pELISA was achieved at 1.86 ng/mL (Figure S5), which is approximately 13-fold lower than that of HRP-based conventional ELISA (IC50 = 25 ng/mL). The detection limit (LOD) of the proposed pELISA was calculated as 0.31 ng/mL based on the concentration of IC10 value. This value is further comparable to other established immunoassays for FB1 detection (Table S2). The proposed pELISA in this work displayed quite excellent sensitivity in FB1 detection.

2.5. Selectivity of the Proposed Sensing System

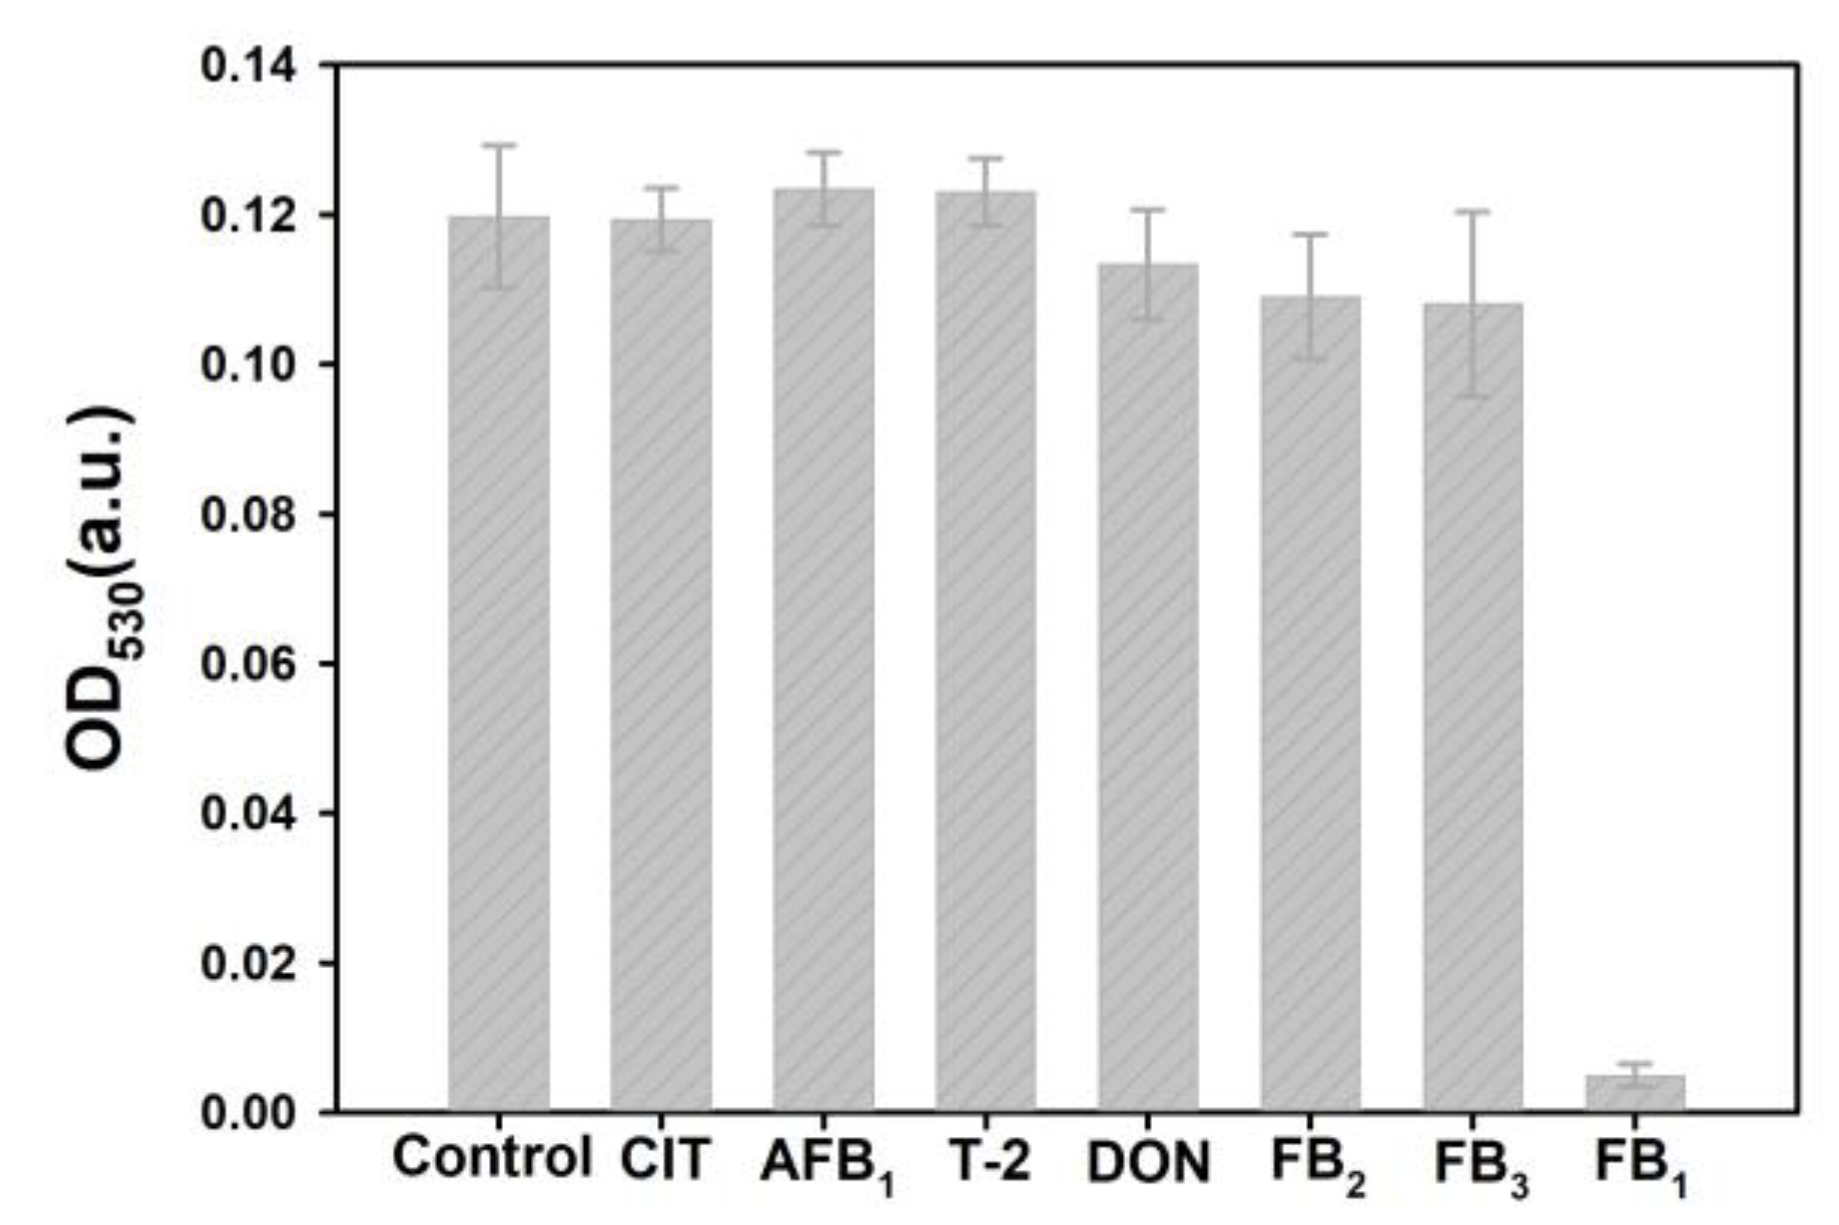
The selectivity of our developed pELISA was performed by analyzing FB1 (0.1 μg/mL) and other common mycotoxins, including CIT, AFB1, T-2, DON, FB2, and FB3 (1 μg/mL). Meanwhile, a negative control was conducted using PB buffer (pH 6.0, 0.01 M, containing 5% methanol). Figure 5 shows that the decreased OD530 value was only observed in the presence of FB1, and negligible changes (p > 0.05) were observed in other common mycotoxins and the control experiment. These results showed that the developed pELISA exhibits high selectivity for FB1 determination because of the specific recognition of FB1 and anti-FB1 mAbs.

2.6. Validation of pELISA on Maize Samples

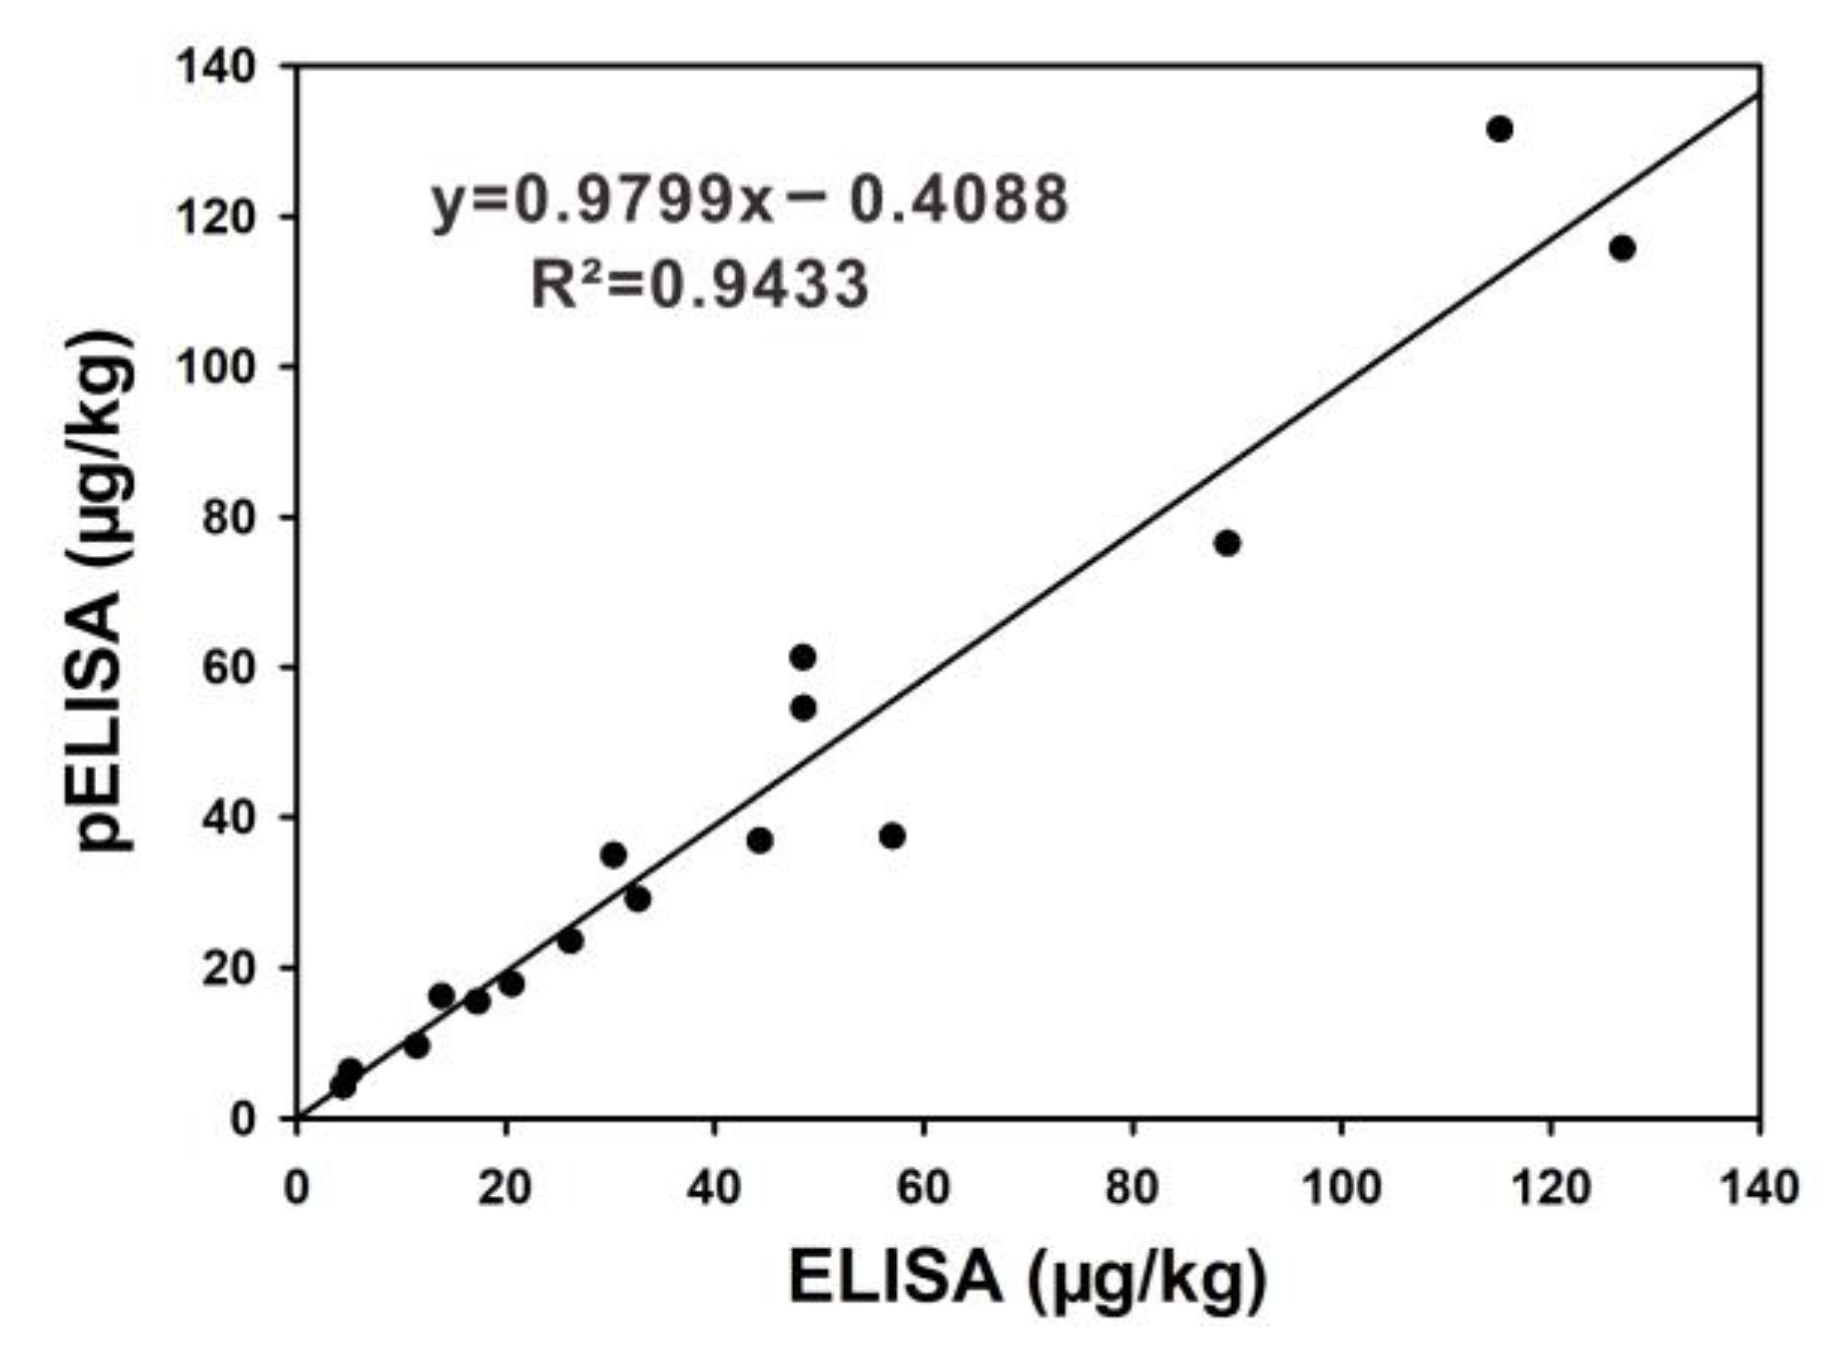
The accuracy and precision of the proposed pELISA for FB1 quantitative detection was evaluated through the addition and recovery analysis. The real maize substrates were spiked by different concentrations of FB1 (0.08 mg/kg, 0.15 mg/kg, 0.30 mg/kg, 1.20 mg/kg, and 2.40 mg/kg) and were analyzed through the proposed method. The results in Table 1 show that the average recoveries of the five spiked samples varied from 88.33% to 116.67% with a coefficient of variation (CV) ranging from 2.54% to 13.20%. These results indicate an acceptable accuracy and precision in the detection of FB1. Later, a comparison analysis was carried out through conventional ELISA to estimate the reliability of our proposed method. In the comparison analysis, 16 artificially contaminated FB1 maize samples were simultaneously determined by the proposed pELISA and conventional ELISA, results see Table S3. Figure 6 shows an excellent correlation between these two approaches (R2 = 0.9433), indicating that the proposed pELISA could be applied for reliable determination of FB1 in real maize products.

3. Conclusions

We successfully developed a pELISA for sensitive naked-eye detection of FB1 using GOx as HRP substitute and colloidal gold solution as a color signal output. GOx, which is low-cost and high catalytic efficiency, and catalyze the oxidization of glucose into H2O2 and gluconic acid. The resultant H2O2 then reduces Au3+ to Au0 on the surface of 5 nm AuNPs to induce an obvious solution color change from colorless to purple red. Under the optimum conditions, the visual cut-off value of our developed method for naked-eye detection of FB1 was 1.25 ng/mL, and the IC50 was as low as 1.86 ng/mL, which is about 13-fold lower than that of conventional ELISA. In addition, the proposed method displayed an acceptable precision and accuracy, as well as an excellent correlation with conventional HRP-based ELISA for FB1 detection. In brief, the developed pELISA showed a great potential for the sensitive naked-eye detection of mycotoxins or other small molecular chemicals in food safety monitoring. Furthermore, its high-throughput screening detection ability and naked eyes easy readout without advanced detection equipment is considerably suitable for point-of-care diagnostics in resource-constrained regions.

4. Materials and Methods

4.1. Regents

Sodium borohydride (NaBH4), HAuCl4·3H2O, trisodium citrate, maleic anhydride, protein G, bovine serum albumin (BSA), GOx, and glucose, FB1, fumonisin B2 (FB2), fumonisin B3 (FB3), citinin (CIT), deoxyivalenol (DON), aflatoxin B1 (AFB1) and Trichothecenes 2 toxins (T-2), 1-(3-Dimethylaminopropyl)-3-ethylcarbodiimide hydrochloride (EDC), 3, 3’, 5, 5’-Tetramethylbenzidine liquid system and H2O2 were purchased from Sigma-Aldrich Chemical (St. Louis, MO, USA). An H2O2 quantitative assay kit (water-compatible) was purchased from Sangon Biotech (Shanghai, China) (www.sangon.com). Anti-FB1 monoclonal antibody ascitic fluids (anti-FB1 mAb 6.5 mg/mL) were provided by Prof. Xu research group (Nanchang University, China). 96-well microplates (high binding, white) were obtained from Costar Inc. (Cambridge, MA, USA). Other reagents were of analytical grade were purchased from Sinopharm Chemical Corp (Shanghai, China). Aqueous solutions for the immunoassay experiments were prepared using Millipore water (Elix-3þ Milli-QA, Millipore, France).

4.2. Apparatus

All the absorption spectrums were recorded by Thermo Fisher 1510-03690 (Vantaa, Finland). The size of gold seeds was measured through transmission electron microscopy (JEM-2100HR, JEOL, Tokyo, Japan), and the average hydrodynamic diameter and monodispersity of the gold seeds were characterized by (Malvern Instruments Ltd. U.K, Malvern, UK).

4.3. The Synthesis of Gold Seeds

Gold seeds were synthesized according to a previous report with slight modifications [23]. In brief, 10 mL of trisodium citrate solution (0.5 mM) containing 0.5 mM of HAuCl4 solution was put into a washed conical flask while stirring constantly at room temperature for 2 min. Then, 0.6 mL NaBH4 solution (0.1 M, dissolved in ice water) was added to the solution while stirring vigorously for another 2 min. The reaction was immediately terminated by chilling the resulting solution in a mixture of ice water for 45 min. The resultant gold seed solution was stored at 4 °C until further use.

4.4. Preparation of FB1-Labeled GOx

FB1-labeled GOx conjugates (GOx@FB1) were prepared according to a carbodiimide method [27]. In brief, 135 μL of FB1 (1 mg/mL) solution was added to 1 mL GOx solution (1.5 mg/mL, and mole ratio of FB1:GOx is 20:1). Added with 50 μL freshly prepared EDC solution (7.2 mg/mL), the mixture was under constant stirring at room temperature for 2 h and then dialyzed in PBS (0.01 M, pH 6.2) at 4 °C for 72 h. The obtained GOx@FB1 complex was stored in 50% (w/v) glycerol solution at −20 °C until further use.

4.5. GOx Mediated Direct Competitive pELISA

The proposed pELISA method was conducted based on the H2O2 generated from the reaction between GOx and glucose, wherein the amount of H2O2 regulated the growth of gold seeds along with different color responses. In brief, the 96 well microplates were coated with 100 μL protein-G solution (20 μg/mL) at 4 °C overnight. The plates were washed thrice with phosphate buffer containing 0.05% Tween-20 (PBST, pH 7.4, 0.01 M) to remove unbound protein-G and blocked with 10 mg/mL of BSA solution at 37 °C for 1 h. After washing with PBST for three times, 100 μL of anti-FB1 ascitic fluids (2 μg/mL) was added into each plate well. The plates were then incubated at 37 °C for 1 h and were washed again for three times. About 50 μL of sample solution and 50 μL of GOx@FB1 (1.56 μg/mL) were added into each well at 37 °C for 1 h. After performing the same washing procedure, we added 100 μL of glucose (0.5 M) solution and incubated the plates at 37 °C for 1 h. Then, 100 μL of growth solution containing 0.4 mM HAuCl4 and 5 nM gold seeds was added into each well, and then the plates were kept for another 1 h at ambient temperature. The absorbance of each well at 530 nm was recorded using a microplate reader. The detailed operation of conventional HRP-based ELISA was described in the Supplementary Materials.
Notably, seven parameters including the concentrations of the coating antibody (anti-FB1 ascitic fluids) and the competitive antigen, the pH value and methanol concentration of sample solution, the concentration of glucose, the immunoreaction time and enzymatic reaction time were optimized. The concentrations of the coating antibody and the competitive antigen were optimized first under preset conditions, where sample solution was set as 0.01 M PBS (pH = 7, 0% methanol), the concentration of glucose was 1 M in ultra-pure water, the immunoreaction time and enzymatic reaction time were both 1 h. The other parameters were optimized successively under the above conditions with corrections made according to previous results.

4.6. Sample Preparation

The maize samples, which were confirmed to be free of FB1 through the LC-MS/MS method, were collected from the supermarket in Jiangxi and Shandong Provinces in China. To evaluate the accuracy and precision of the proposed method, different amounts of FB1 stock solution (200 µg/mL) were mixed with 1 g of well ground maize powder to make the FB1 final concentrations at 0.08 mg/kg, 0.15 mg/kg, 0.30 mg/kg, 1.20 mg/kg, and 2.40 mg/kg. In addition, 16 maize samples were artificially contaminated with FB1 concentrations in the range of 5.0 μg/kg–150 μg/kg for the reliability evaluation of the proposed method. The FB1-spiked maize samples were extracted according to a previous method with some modifications [28]. Briefly, 5 mL of PB buffer (0.01 M, pH 6.0, 10 mM NaCl, and 60% methanol) was added into 1 g of ground maize powder while vigorously shaking on a plate shaker for 20 min. The mixture was centrifuged at 6000 g for 10 min. The supernatant was further diluted to 12-fold for pELISA (reaching 5% methanol) and conventional ELISA analysis.

Supplementary Materials

The following are available online at https://www.mdpi.com/2072-6651/11/6/323/s1, Figure S1: Characterization of the sythesised 5 nm AuNPs with Uv-vis spectrum (a) and hydrodynamic diameter (b), Figure S2: The morphology of 5 nm AuNPs before (a) and after grown (b), Figure S3: The UV-vis spectrum of glucose oxidase (GOx), fumonisin B1 (FB1) and GOx@FB1, indicating that GOx has been successfully immobilized onto the FB1, Figure S4: The chessboard titration experiment and the photo taken is in accordance with the figures displayed in Table S1, Figure S5: The calibration curve of the conventional HRP based ELISA, Table S1: The selection for the working conditions of GOx@FB1 and anti-FB1 ascitic fluids based plasmonic enzyme-linked immunoassay (pELISA) using the checkerboard method, Table S2: Comparison of this work with some established immunoassays for FB1 detection, Table S3: Comparision of ELISA with pELISA analysis of fumonisin B1 in 16 artificially contaminated maize samples.

Author Contributions

Conceptualization, Y.X.; software, S.Z.; validation, methodology, L.Z.; Y.Z. conducted the conventional ELISA; writing-original draft preparation, S.Z.; writing-review and editing, Y.X., H.D., X.H. and K.W.; supervision, Y.X. and K.W.; funding acquisition, Y.X.

Funding

This research was funded by the National Key Research and Development Program of China (2018YFC1602505); the National Natural Science Foundation of China (31760485); Major Projects of Natural Science Foundation of Jiangxi Province (20161ACB20002); the Research Program of the State Key Laboratory of Food Science and Technology, Nanchang University (SKLF-ZZB-201716).

Conflicts of Interest

The authors declare no conflict of interest.

References

  1. Omurtag, G.Z. Fumonisins, trichothecenes and zearalenone in cereals. Int. J. Mol. Sci. 2008, 9, 2062–2090. [Google Scholar]
  2. Wan, L.Y.M.; Turner, P.C.; El-Nezami, H. Individual and combined cytotoxic effects of fusarium toxins (deoxynivalenol, nivalenol, zearalenone and fumonisins b1) on swine jejunal epithelial cells. Food Chem. Toxicol. 2013, 57, 276–283. [Google Scholar] [CrossRef] [PubMed]
  3. Di Nardo, F.; Anfossi, L.; Giovannoli, C.; Passini, C.; Goftman, V.; Goryacheva, I.; Baggiani, C. A fluorescent immunochromatographic strip test using quantum dots for fumonisins detection. Talanta 2016, 150, 463–468. [Google Scholar] [CrossRef] [PubMed]
  4. Esposito, F.; Fasano, E.; Scognamiglio, G.; Nardone, A.; Triassi, M.; Cirillo, T. Exposure assessment to fumonisins B1, B2 and B3 through consumption of gluten-free foodstuffs intended for people affected by celiac disease. Food Chem. Toxicol. 2016, 97, 395–401. [Google Scholar] [CrossRef] [PubMed]
  5. Li, C.; Mi, T.; Oliveri Conti, G.; Yu, Q.; Wen, K.; Shen, J.; Ferrante, M.; Wang, Z. Development of a screening fluorescence polarization immunoassay for the simultaneous detection of fumonisins B1 and B2 in maize. J. Agric. Food Chem. 2015, 63, 4940–4946. [Google Scholar] [CrossRef] [PubMed]
  6. Kaltner, F.; Rampl, C.; Rychlik, M.; Zimmermann, T.; Rohe, A. Development and validation of a cost-effective hplc-fld method for routine analysis of fumonisins B1 and B2 in corn and corn products. Food Anal. Methods 2017, 10, 1349–1358. [Google Scholar] [CrossRef]
  7. Arranz, I.; Baeyens, W.; Weken, G.; Saeger, S.D.; Peteghem, C.V. Hplc determination of fumonisin mycotoxins. Crit. Rev. Food Sci. Nutr. 2004, 44, 195–203. [Google Scholar] [CrossRef] [PubMed]
  8. Sforza, S.; Dall’Asta, C.; Marchelli, R. Recent advances in mycotoxin determination in food and feed by hyphenated chromatographic techniques/mass spectrometry. Mass Spectrom. Rev. 2006, 25, 54–76. [Google Scholar] [CrossRef] [PubMed]
  9. Silva, L.; Fernández-Franzón, M.; Font, G.; Pena, A.; Silveira, I.; Lino, C.; Mañes, J. Analysis of fumonisins in corn-based food by liquid chromatography with fluorescence and mass spectrometry detectors. Food Chem. 2009, 112, 1031–1037. [Google Scholar] [CrossRef] [Green Version]
  10. Li, J.; Duan, H.; Xu, P.; Huang, X.; Xiong, Y. Effect of different-sized spherical gold nanoparticles grown layer by layer on the sensitivity of an immunochromatographic assay. RSC Adv. 2016, 6, 26178. [Google Scholar] [CrossRef]
  11. Josephy, P.D.; Eling, T.; Mason, R.P. The horseradish peroxidase-catalyzed oxidation of 3,5,3’,5’-tetramethylbenzidine. Free radical and charge-transfer complex intermediates. J. Biol. Chem. 1982, 257, 3669–3675. [Google Scholar] [PubMed]
  12. Xiong, Y.; Pei, K.; Wu, Y.; Duan, H.; Lai, W.; Xiong, Y. Plasmonic ELISA based on enzyme-assisted etching of Au nanorods for the highly sensitive detection of aflatoxin B1 in corn samples. Sens. Actuators B Chem. 2018, 267, 320–327. [Google Scholar] [CrossRef]
  13. Liu, D.; Yang, J.; Wang, H.-F.; Wang, Z.; Huang, X.; Wang, Z.; Niu, G.; Hight Walker, A.; Chen, X. Glucose oxidase-catalyzed growth of gold nanoparticles enables quantitative detection of attomolar cancer biomarkers. Anal. Chem. 2014, 86, 5800–5806. [Google Scholar] [CrossRef] [PubMed]
  14. Bui, M.P.N.; Ahmed, S.; Abbas, A. Single-digit pathogen and attomolar detection with the naked eye using liposome-amplified plasmonic immunoassay. Nano Lett. 2015, 15, 6239–6246. [Google Scholar] [CrossRef] [PubMed]
  15. De La Rica, R.; Stevens, M.M. Plasmonic elisa for the ultrasensitive detection of disease biomarkers with the naked eye. Nat. Nanotechnol. 2012, 7, 821. [Google Scholar] [CrossRef] [PubMed]
  16. Guo, Y.; Wu, J.; Li, J.; Ju, H. A plasmonic colorimetric strategy for biosensing through enzyme guided growth of silver nanoparticles on gold nanostars. Biosens. Bioelectron. Chem. 2016, 78, 267–273. [Google Scholar] [CrossRef]
  17. Liang, Y.; Huang, X.; Chen, X.; Zhang, W.; Ping, G.; Xiong, Y. Plasmonic elisa for naked-eye detection of ochratoxin a based on the tyramine-H2O2 amplification system. Sens. Actuators B. 2018, 259, 162–169. [Google Scholar] [CrossRef]
  18. Peng, C.; Duan, X.; Khamba, G.W.; Xie, Z. Highly sensitive “signal on” plasmonic elisa for small molecules by the naked eye. Anal. Methods 2014, 6, 9616–9621. [Google Scholar] [CrossRef]
  19. Zhang, Z.; Chen, Z.; Wang, S.; Cheng, F.; Chen, L. Iodine-mediated etching of gold nanorods for plasmonic elisa based on colorimetric detection of alkaline phosphatase. ACS Appl. Mater. Interfaces 2015, 7, 27639. [Google Scholar] [CrossRef]
  20. Satija, J.; Punjabi, N.; Mishra, D.; Mukherji, S. Plasmonic-elisa: Expanding horizons. RSC Adv. 2016, 6, 85440–85456. [Google Scholar] [CrossRef]
  21. Cecchin, D.; De La Rica, R.; Bain, R.; Finnis, M.W.; Stevens, M.; Battaglia, G. Plasmonic elisa for the detection of gp120 at ultralow concentrations with the naked eye. Nanoscale 2014, 6, 9559–9562. [Google Scholar] [CrossRef] [PubMed]
  22. Rodríguez-Lorenzo, L.; De La Rica, R.; Álvarez-Puebla, R.A.; Liz-Marzán, L.M.; Stevens, M.M. Plasmonic nanosensors with inverse sensitivity by means of enzyme-guided crystal growth. Nat. Mater. 2012, 11, 604. [Google Scholar] [CrossRef] [PubMed]
  23. Höller, R.P.; Dulle, M.; Thomä, S.; Mayer, M.; Steiner, A.M.; Förster, S.; Fery, A.; Kuttner, C.; Chanana, M. Protein-assisted assembly of modular 3d plasmonic raspberry-like core/satellite nanoclusters: Correlation of structure and optical properties. ACS Nano 2016, 10, 5740–5750. [Google Scholar] [CrossRef]
  24. Zhan, S.; Huang, X.; Chen, R.; Li, J.; Xiong, Y. Novel fluorescent elisa for the sensitive detection of zearalenone based on H2O2-sensitive quantum dots for signal transduction. Talanta 2016, 158, 51–56. [Google Scholar] [CrossRef] [PubMed]
  25. Xiong, Y.; Pei, K.; Wu, Y.; Xiong, Y. Colorimetric elisa based on glucose oxidase-regulated the color of acid–base indicator for sensitive detection of aflatoxin B1 in corn samples. Food Control 2017, 78, 317–323. [Google Scholar] [CrossRef]
  26. Duan, H.; Chen, X.; Xu, W.; Fu, J.; Xiong, Y.; Wang, A. Quantum-dot submicrobead-based immunochromatographic assay for quantitative and sensitive detection of zearalenone. Talanta 2015, 132, 126–131. [Google Scholar] [CrossRef]
  27. Anderson, G.P.; Kowtha, V.A.; Taitt, C.R. Detection of fumonisin b1 and ochratoxin a in grain products using microsphere-based fluid array immunoassays. Toxins 2010, 2, 297–309. [Google Scholar] [CrossRef] [PubMed]
  28. Wang, S.; Quan, Y.; Lee, N.; Kennedy, I.R. Rapid determination of fumonisin b1 in food samples by enzyme-linked immunosorbent assay and colloidal gold immunoassay. J. Sci. Food Agric. 2006, 54, 2491–2495. [Google Scholar] [CrossRef] [PubMed]
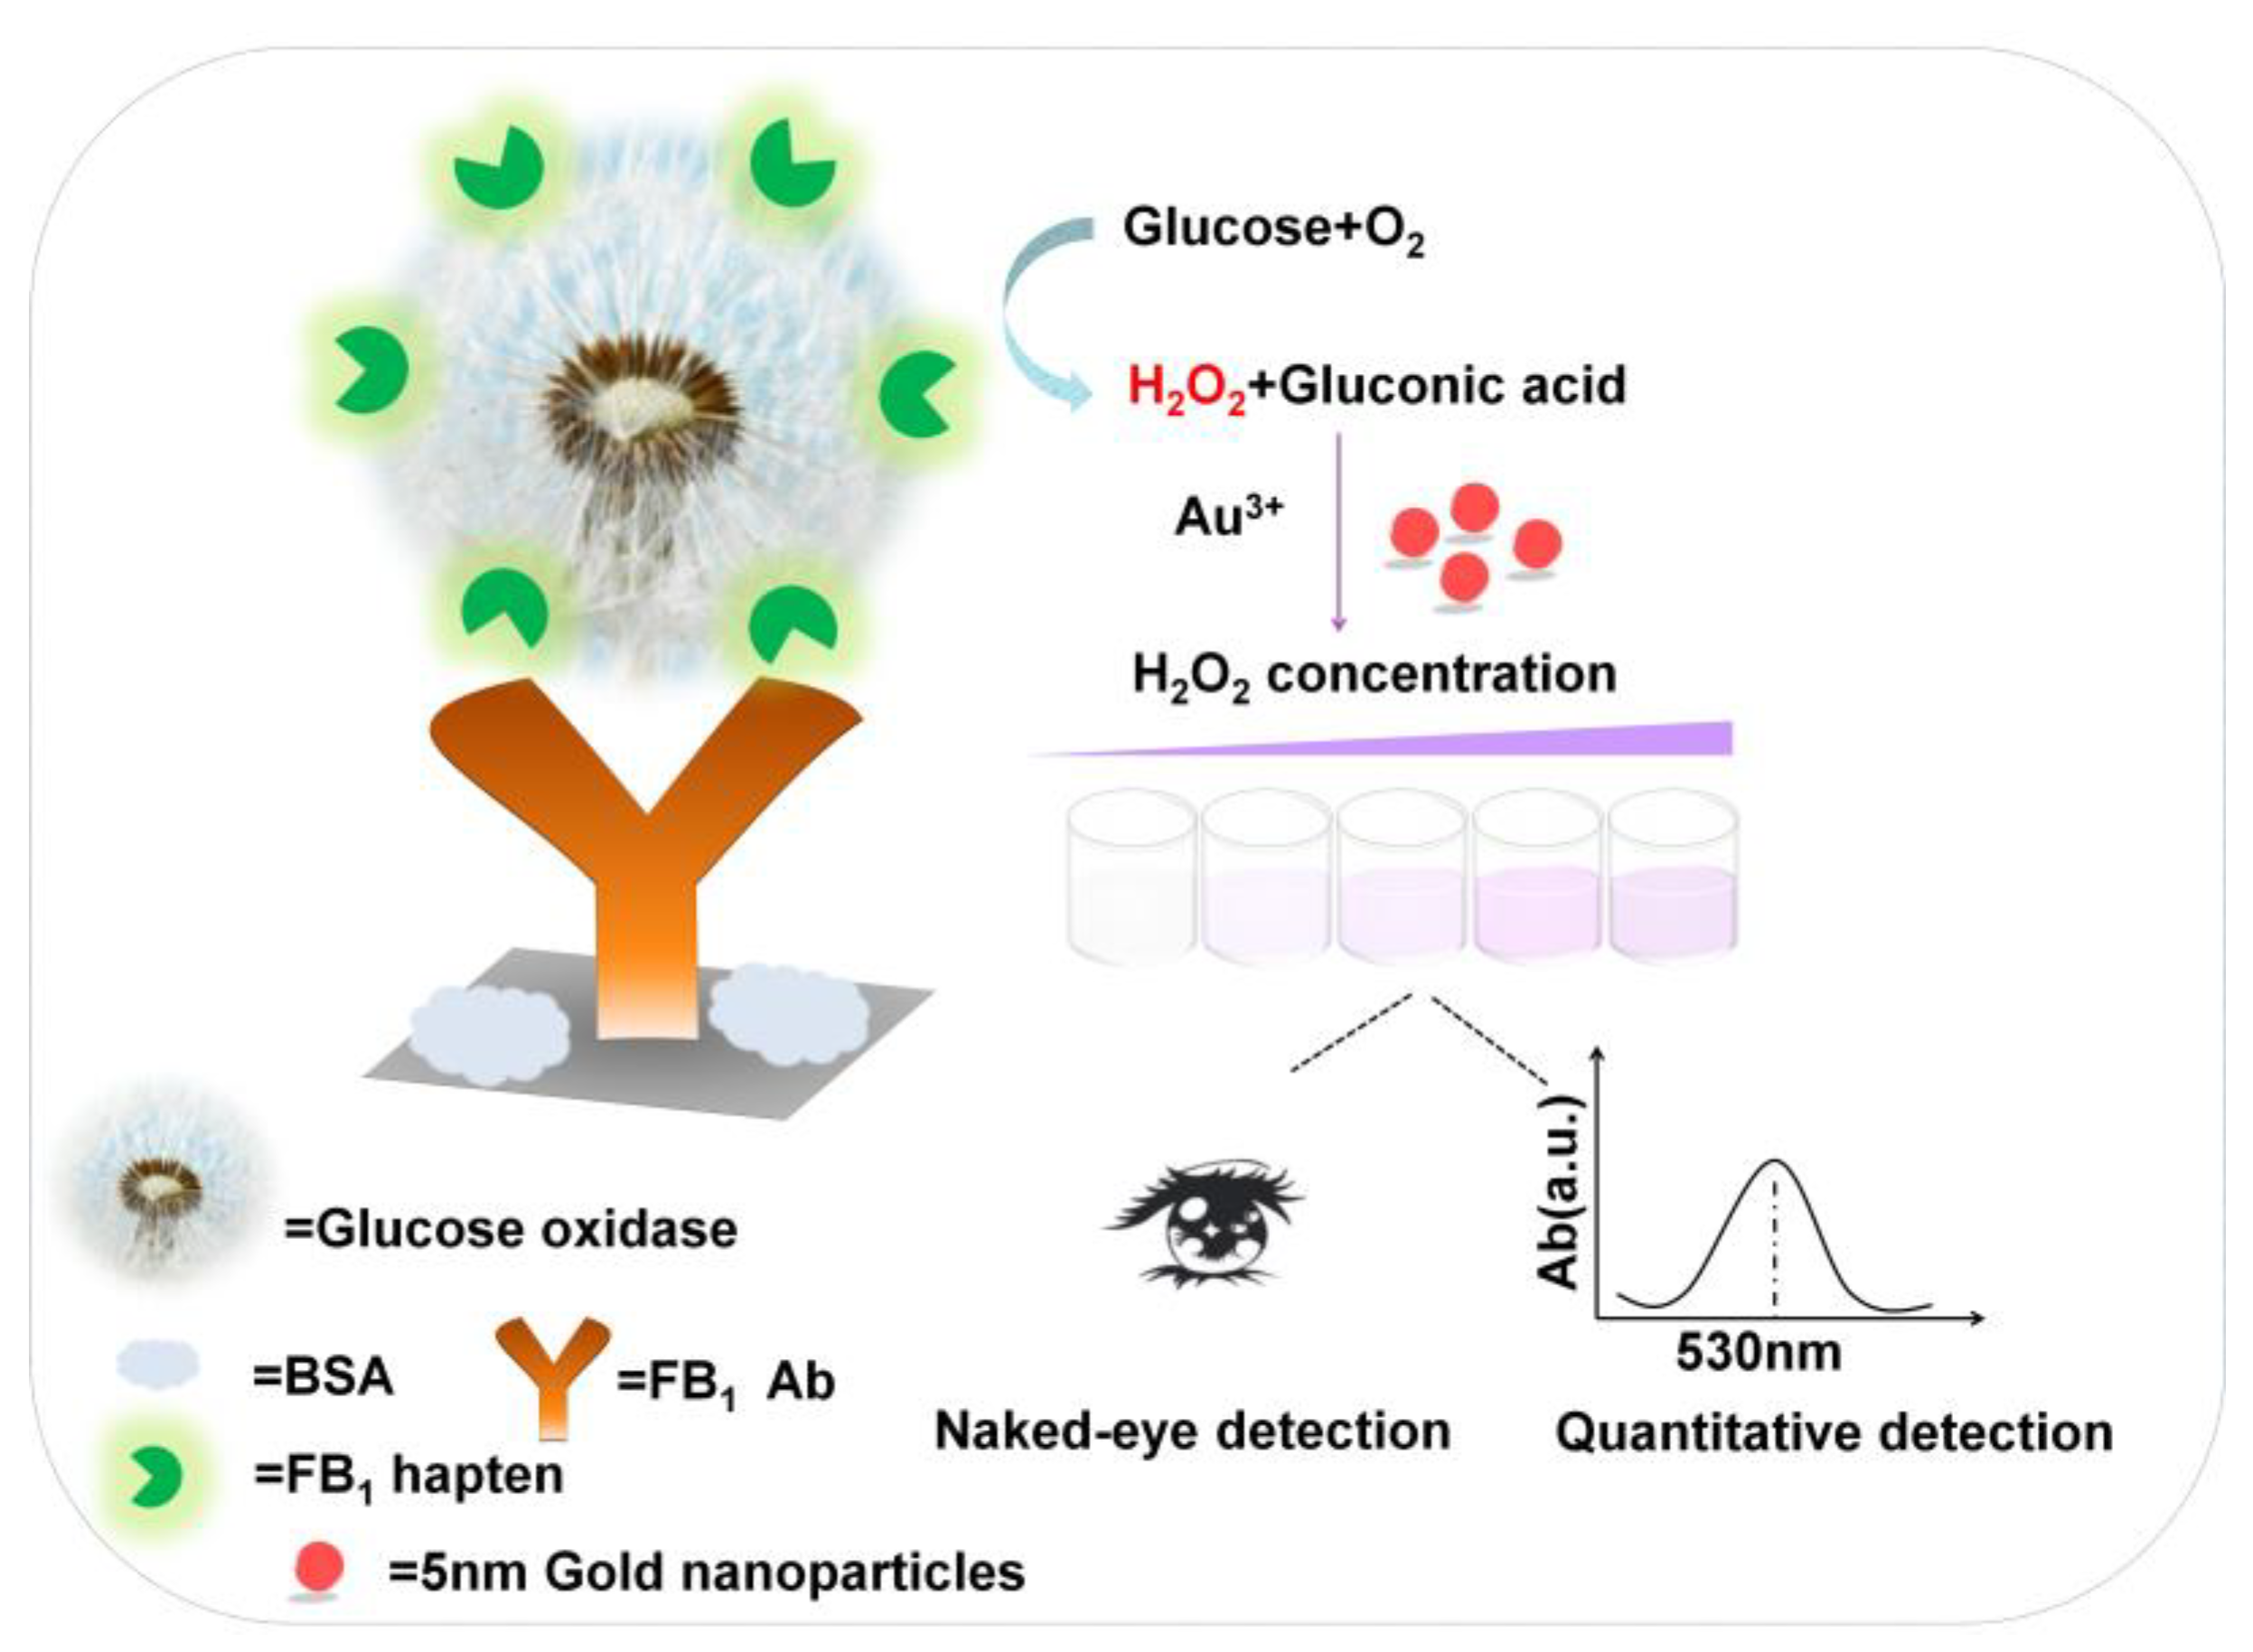
Figure 1. Schematic of Glucose oxidase (GOx) induced plasmonic enzyme-linked immunoassay (pELISA) for the detection of fumonisin B1 (FB1) in maize.
Toxins 11 00323 g001
Figure 2. (a) TEM image of 5 nm gold nanoparticles (AuNPs). (b) Generation of colored solution for the detection with naked eyes. Each group’s solutions were recorded with their UV-vis spectrum and the corresponding digital photos. (c) The hydration dynamic diameter of 5 nm AuNPs. (d) Verification of the reducing of 5 nm AuNPs in the presence of GOx; UV-vis spectrum and the corresponding color.
Toxins 11 00323 g002
Figure 3. Parameters optimized in pELISA. (a) pH values of sample extraction solvent (4.0–9.5); (b) extraction solvent; methanol (V/V, 0%~30%); (c) immunoreaction time (0–90 min); (d) Glucose concentration (0.05–2.0 M) as substrate of enzymatic reaction for H2O2 generation and (e) enzyme reaction time (15–120 min). The error bars indicate standard deviation of three measurements. (n = 3).
Toxins 11 00323 g003
Figure 4. (a) Digital photos taken of the immunoassays for detection of FB1 at the concentrations of 0–160 ng/mL (the one with red border was with the concentration of FB1 1.25 ng/mL, the visible cut-off limit by naked eyes); (b) Inhibition curve for FB1 as obtained by plotting the normalized signal B/B0 × 100% against the logarithm of FB1 concentration.
Toxins 11 00323 g004
Figure 5. The selectivity of pELISA. FB1 spiked concentration was 0.1 μg/mL; citinin (CIT), aflatoxin B1 (AFB1), T-2, deoxyivalenol (DON), FB2, and FB3 spiked concentrations were 1 μg/mL; negative control test was performed by adding the PBS solution containing 5% (v/v) methanol. The error bars indicate standard deviation of three measurements. (n = 3).
Toxins 11 00323 g005
Figure 6. Methodology comparison between the pELISA and horseradish peroxidase- (HRP)-ELISA.
Toxins 11 00323 g006
Table 1. Accuracy of the plasmonic enzyme-linked immunoassay (pELISA) in fumonisin B1 (FB1)-spiked samples.
Spiked FB1 (mg/kg)Average aRecovery (%)Standard DeviationCV (%)
2.402.2895.042.412.54
1.201.0688.3310.1611.85
0.300.35116.6714.8913.20
0.150.17113.338.156.89
0.080.08104.002.813.32
a Mean value of 5 replicates at each spiked concentration.