Is 3-Carboxy-4-methyl-5-propyl-2-furanpropionate (CMPF) a Clinically Relevant Uremic Toxin in Haemodialysis Patients?

 ,
, 
Abstract
1. Introduction
2. Results
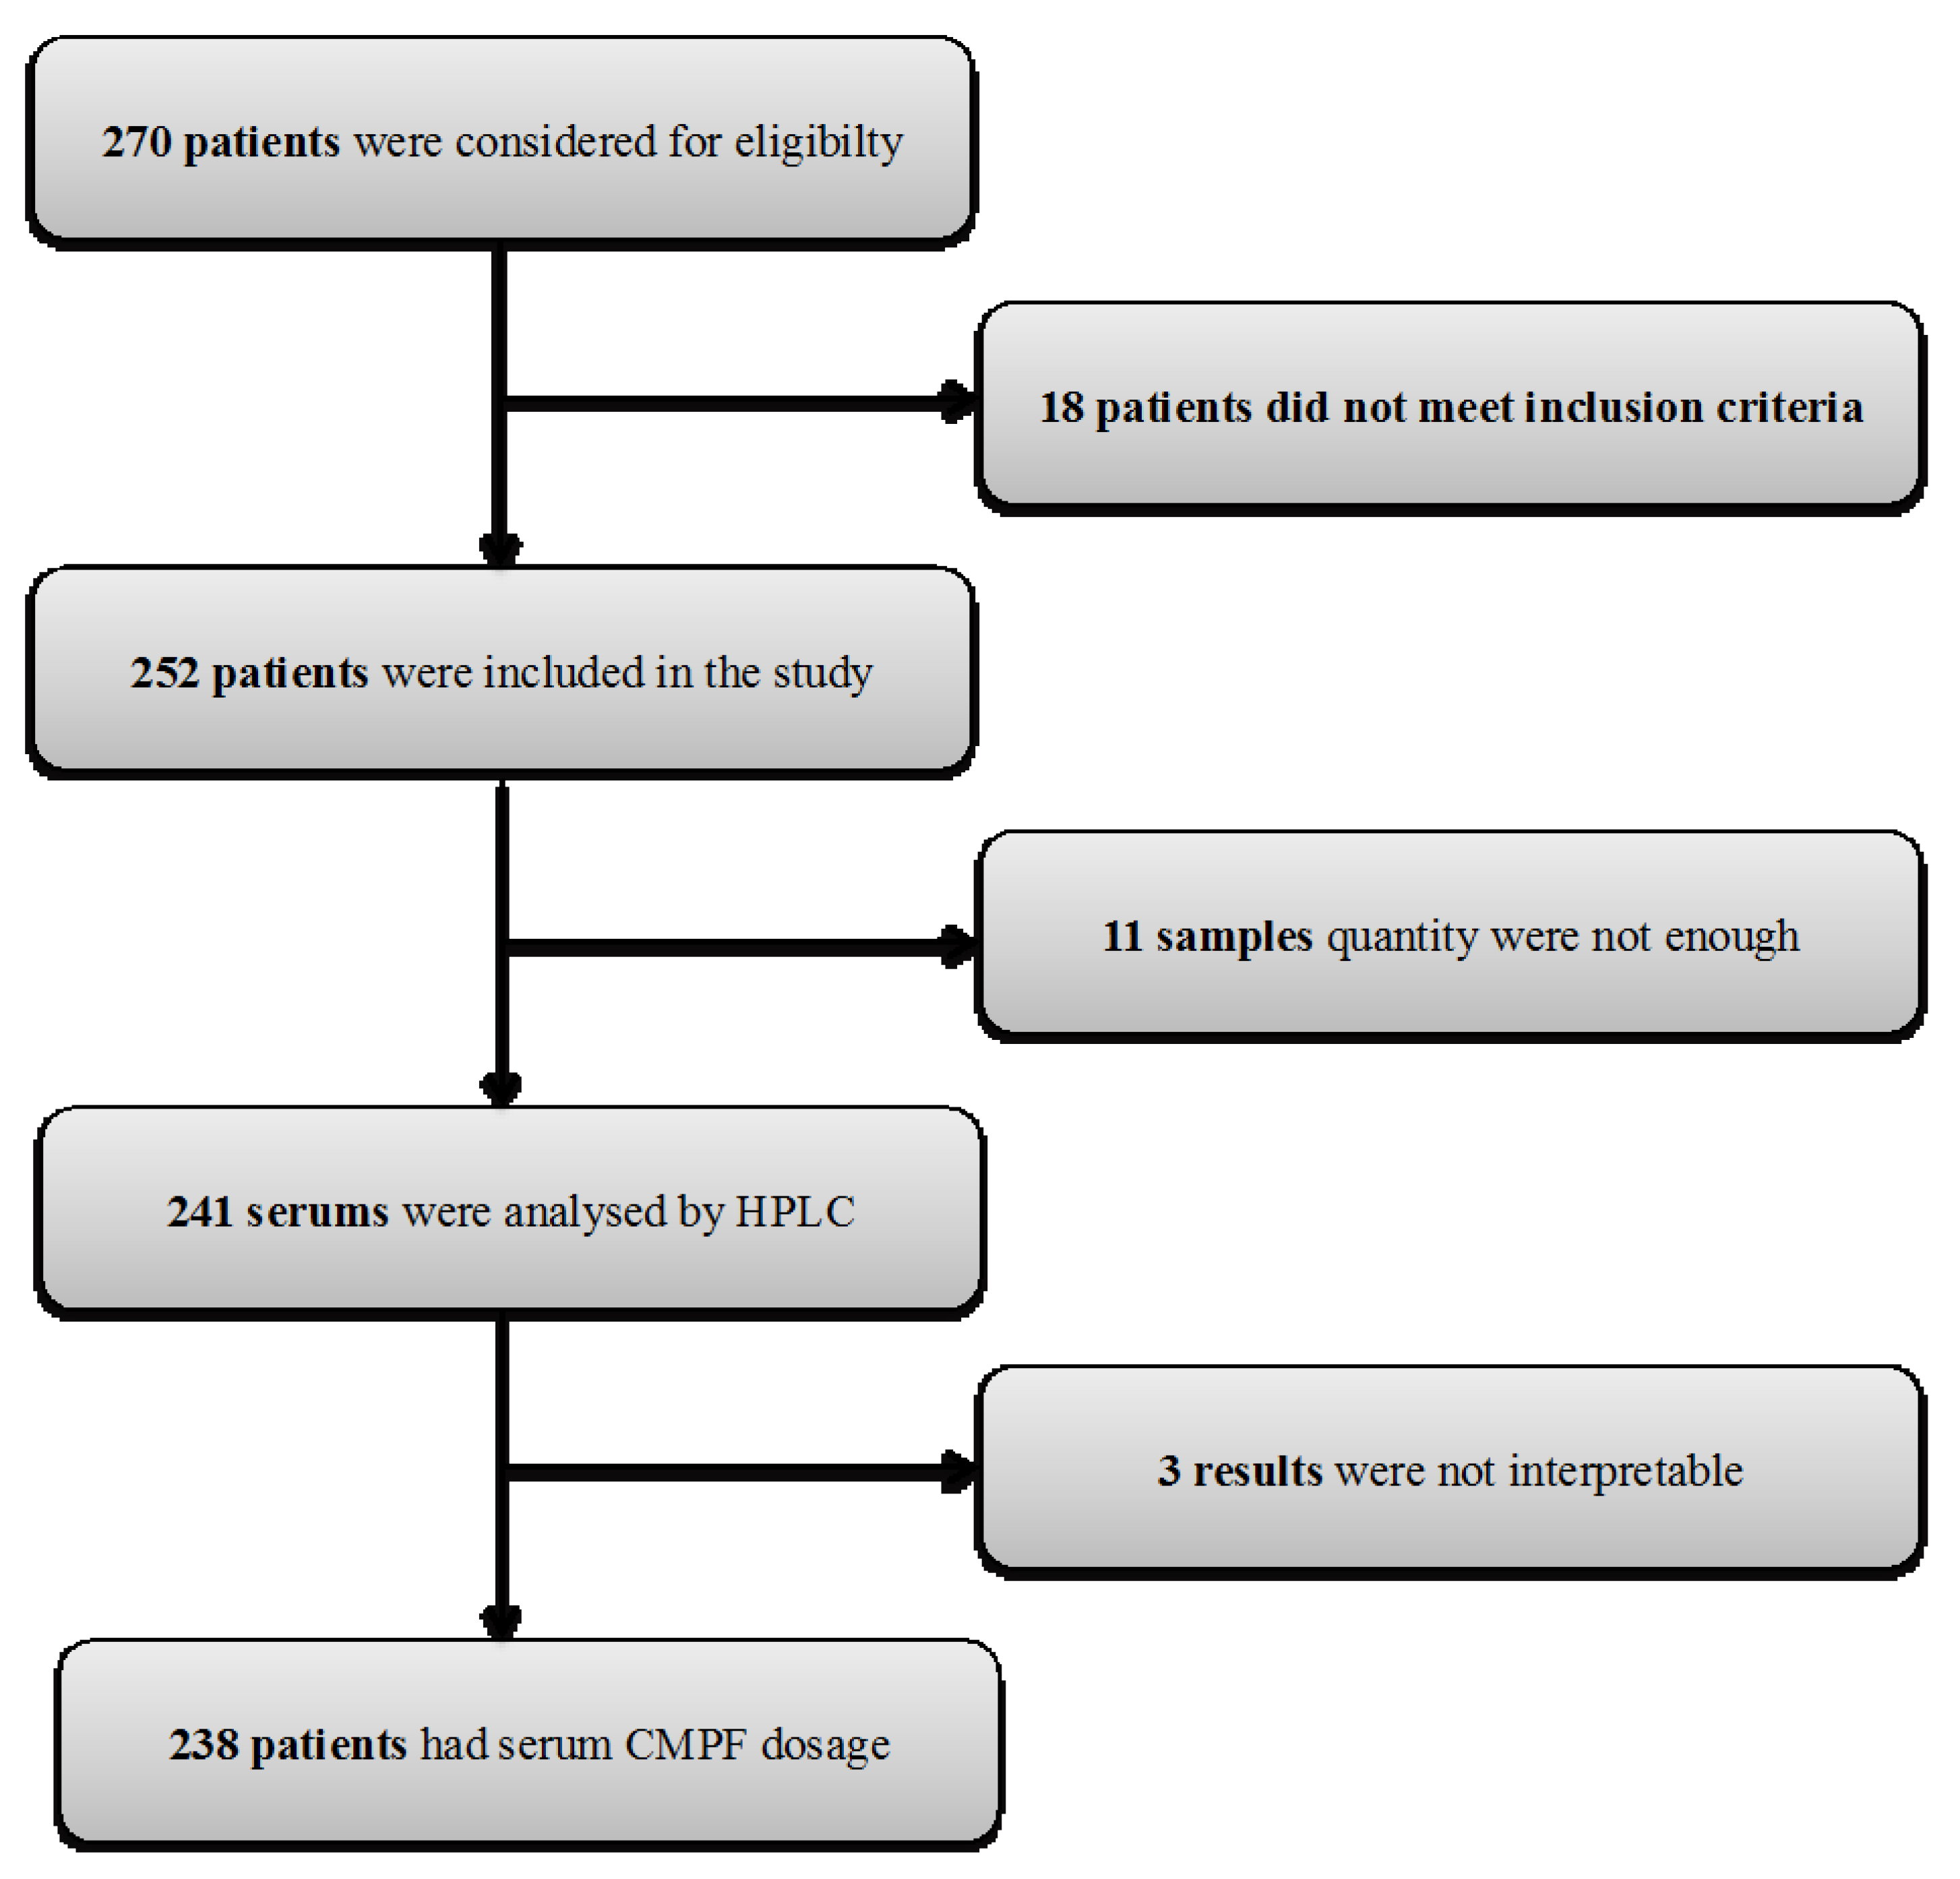
2.1. Participant Characteristics
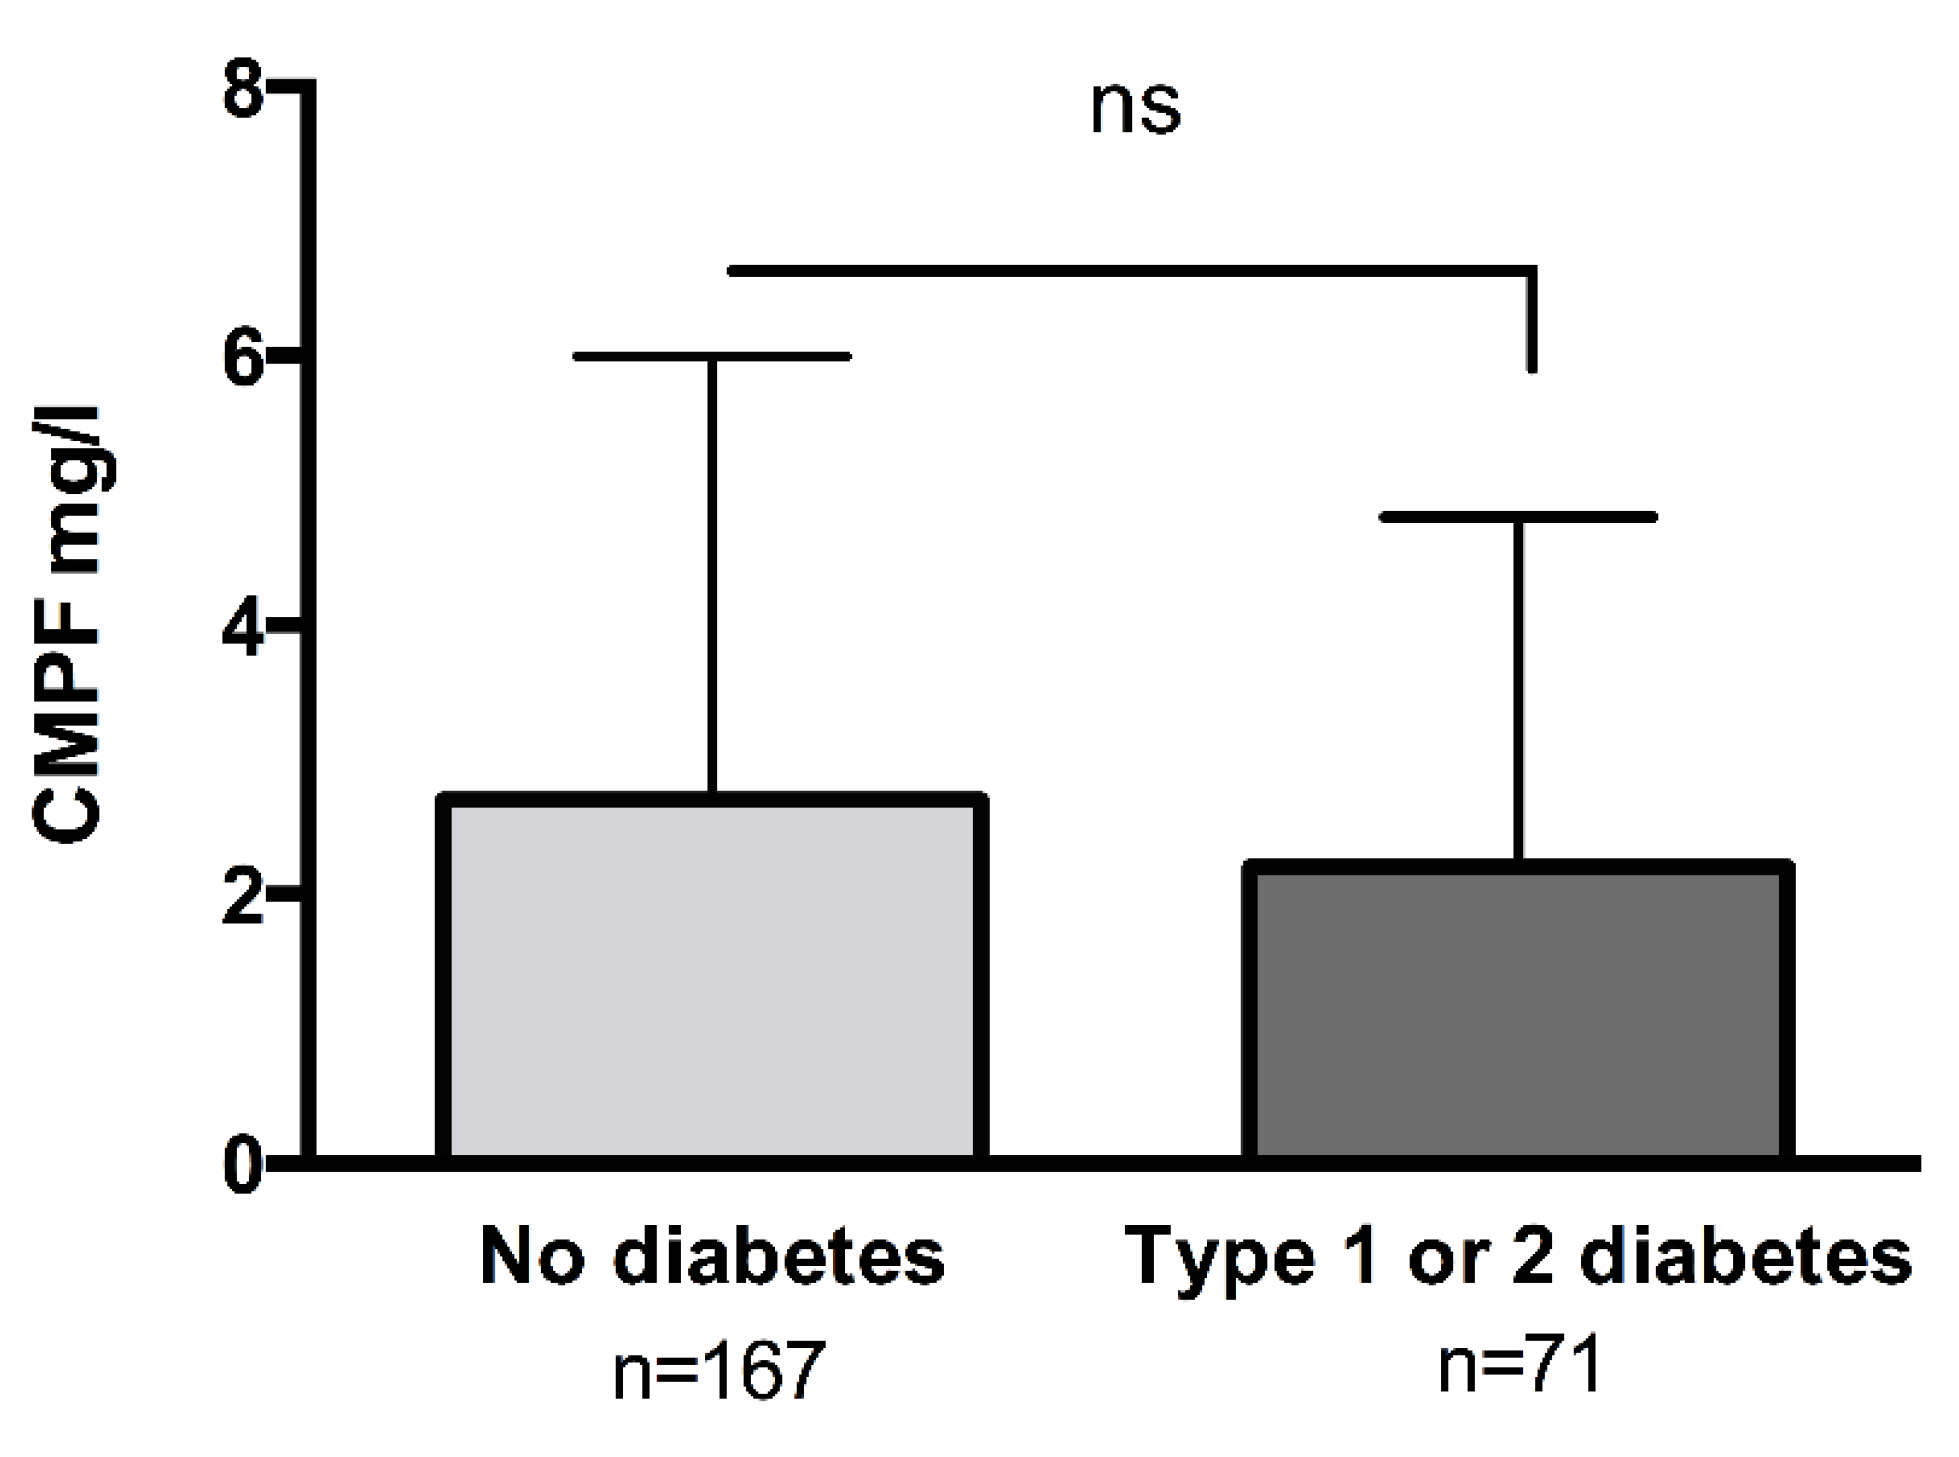
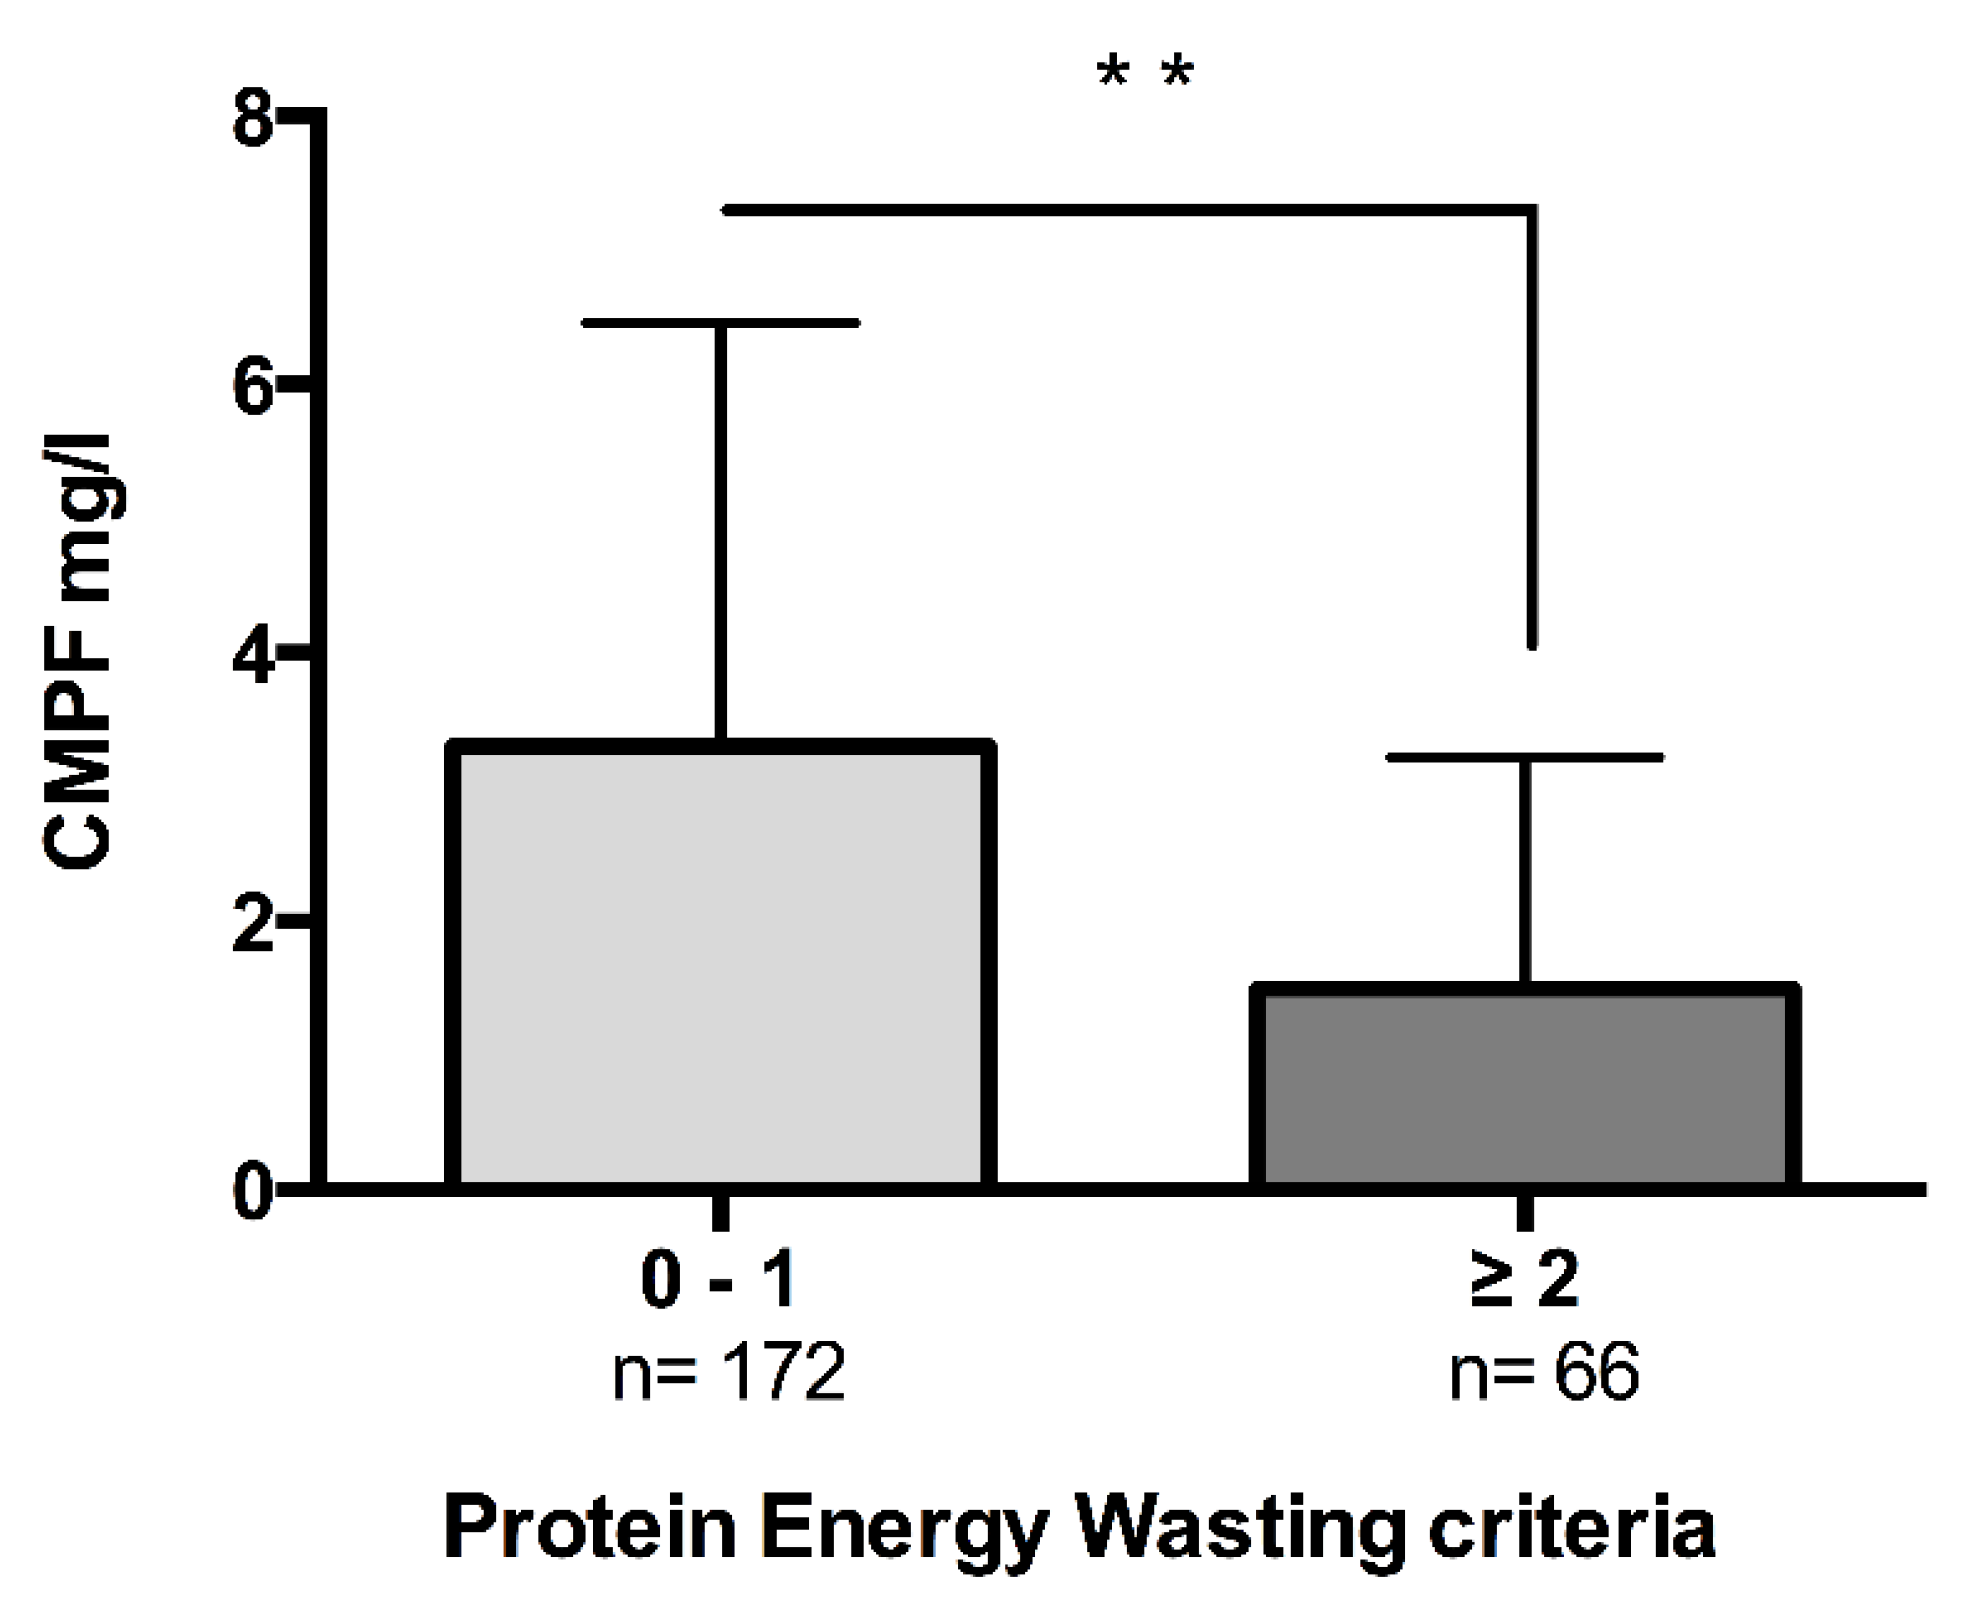
2.2. CMPF Is a Marker of Nutritional Status and Body Composition
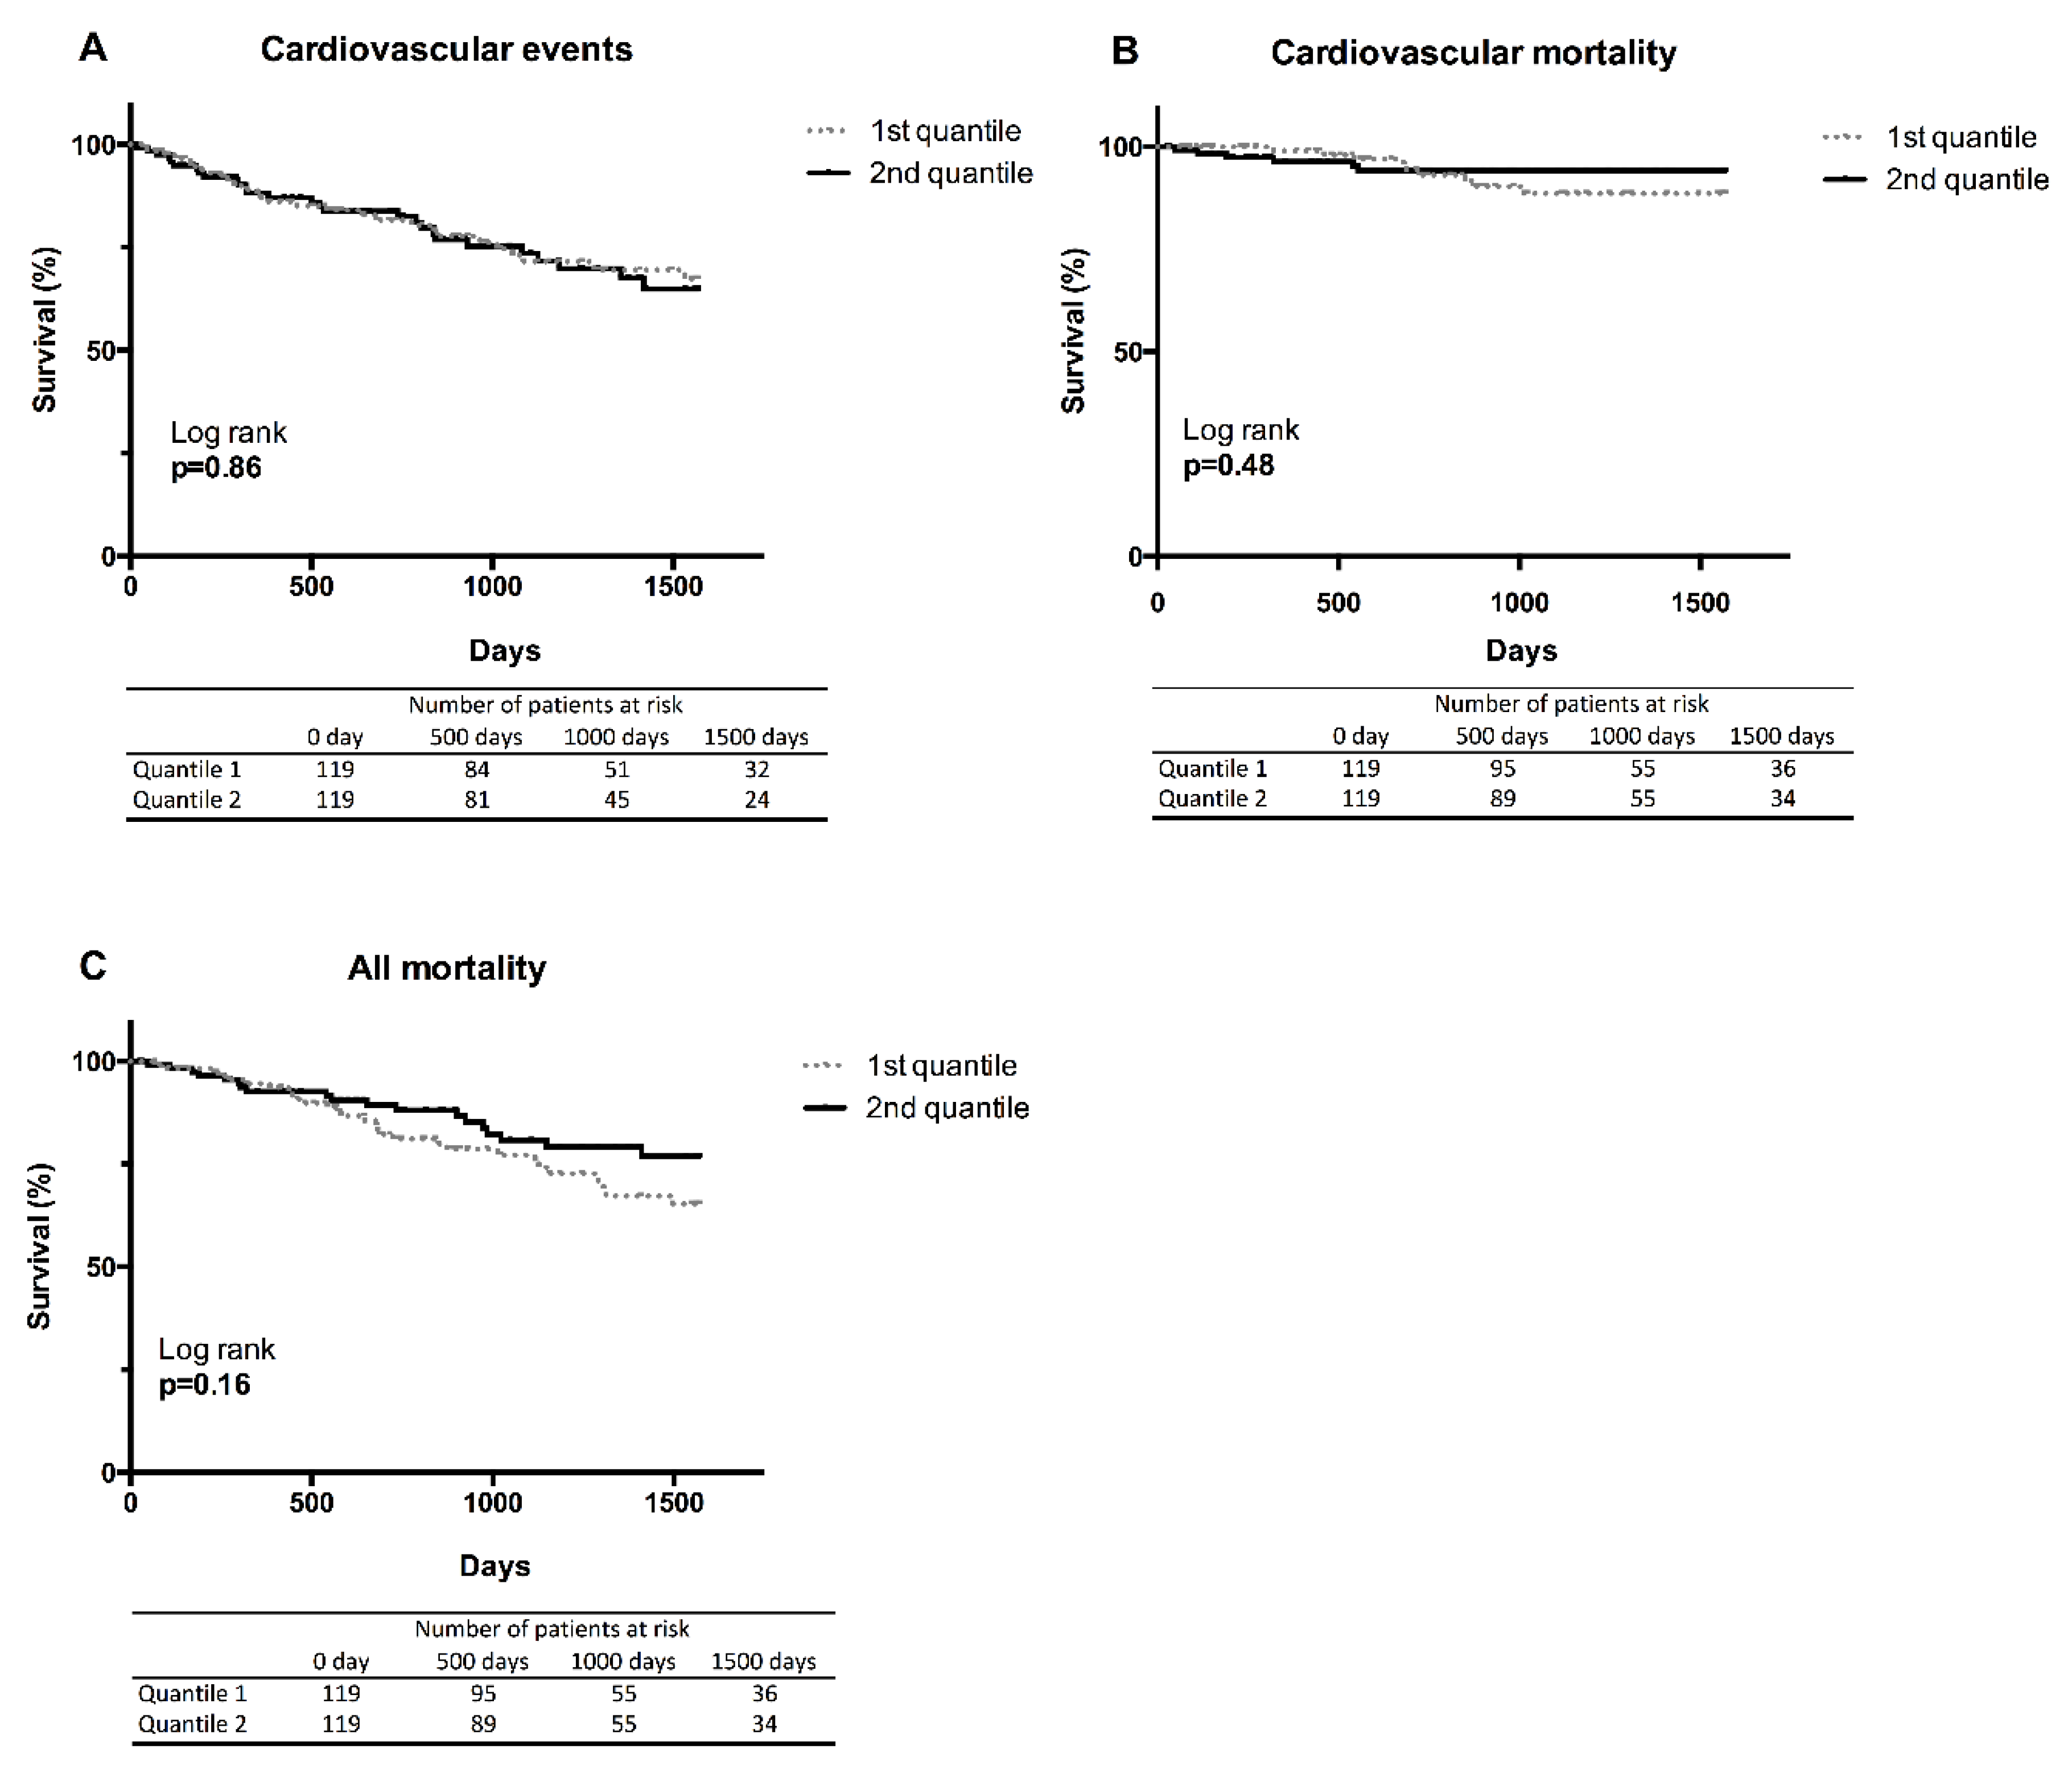
2.3. CMPF Was Not Correlated to Cardiovascular Events and Mortality
3. Discussion
4. Conclusions
5. Materials and Methods
5.1. Ethic Statement
5.2. Study Design, Population and Clinical Events
5.3. Anthropometric Evaluation and Nutritional Status
5.4. Laboratory Measurements
5.5. CMPF Assay
5.6. Statistical Analysis
Supplementary Materials
Author Contributions
Funding
Conflicts of Interest
Appendix A. Supplementary Material and Methods
CMPF Assay
Appendix A.1.1. Stock Solutions, Calibration Standards and Quality-Control (QC) Samples of CMPF
Appendix A.1.2. Serum Sample Preparation
Appendix A.1.3. Chromatography
Appendix A.1.4. Validation of HPLC Technique
References
- Vanholder, R.; Pletinck, A.; Schepers, E.; Glorieux, G. Biochemical and Clinical Impact of Organic Uremic Retention Solutes: A Comprehensive Update. Toxins 2018, 10, 33. [Google Scholar] [CrossRef] [PubMed]
- Han, H.; Zhu, J.; Zhu, Z.; Ni, J.; Du, R.; Dai, Y.; Chen, Y.; Wu, Z.; Lu, L.; Zhang, R. p-Cresyl sulfate aggravates cardiac dysfunction associated with chronic kidney disease by enhancing apoptosis of cardiomyocytes. J. Am. Heart Assoc. 2015, 4, e001852. [Google Scholar] [CrossRef] [PubMed]
- Wu, I.-W.; Hsu, K.-H.; Hsu, H.-J.; Lee, C.-C.; Sun, C.-Y.; Tsai, C.-J.; Wu, M.-S. Serum free p-cresyl sulfate levels predict cardiovascular and all-cause mortality in elderly hemodialysis patients—A prospective cohort study. Nephrol. Dial. Transplant. 2012, 27, 1169–1175. [Google Scholar] [CrossRef] [PubMed]
- Vanholder, R.; De Smet, R.; Glorieux, G.; Argilés, A.; Baurmeister, U.; Brunet, P.; Clark, W.; Cohen, G.; De Deyn, P.P.; Deppisch, R.; et al. European Uremic Toxin Work Group (EUTox) Review on uremic toxins: Classification, concentration, and interindividual variability. Kidney Int. 2003, 63, 1934–1943. [Google Scholar] [CrossRef] [PubMed]
- Vetter, W.; Wendlinger, C. Furan fatty acids—Valuable minor fatty acids in food. Lipid Technol. 2013, 25, 7–10. [Google Scholar] [CrossRef]
- Koppe, L.; Poitout, V. CMPF: A Biomarker for Type 2 Diabetes Mellitus Progression? Trends Endocrinol. Metab. 2016, 27, 439–440. [Google Scholar] [CrossRef] [PubMed]
- Xu, L.; Sinclair, A.J.; Faiza, M.; Li, D.; Han, X.; Yin, H.; Wang, Y. Furan fatty acids—Beneficial or harmful to health? Prog. Lipid Res. 2017, 68, 119–137. [Google Scholar] [CrossRef] [PubMed]
- Patel, P.S.; Sharp, S.J.; Luben, R.N.; Khaw, K.-T.; Bingham, S.A.; Wareham, N.J.; Forouhi, N.G. Association between type of dietary fish and seafood intake and the risk of incident type 2 diabetes: The European prospective investigation of cancer (EPIC)-Norfolk cohort study. Diabetes Care 2009, 32, 1857–1863. [Google Scholar] [CrossRef] [PubMed]
- Van Woudenbergh, G.J.; van Ballegooijen, A.J.; Kuijsten, A.; Sijbrands, E.J.G.; van Rooij, F.J.A.; Geleijnse, J.M.; Hofman, A.; Witteman, J.C.M.; Feskens, E.J.M. Eating fish and risk of type 2 diabetes: A population-based, prospective follow-up study. Diabetes Care 2009, 32, 2021–2026. [Google Scholar] [CrossRef] [PubMed]
- Hanhineva, K.; Lankinen, M.A.; Pedret, A.; Schwab, U.; Kolehmainen, M.; Paananen, J.; de Mello, V.; Sola, R.; Lehtonen, M.; Poutanen, K.; et al. Nontargeted Metabolite Profiling Discriminates Diet-Specific Biomarkers for Consumption of Whole Grains, Fatty Fish, and Bilberries in a Randomized Controlled Trial. J. Nutr. 2015, 145, 7–17. [Google Scholar] [CrossRef] [PubMed]
- Lankinen, M.A.; Hanhineva, K.; Kolehmainen, M.; Lehtonen, M.; Auriola, S.; Mykkänen, H.; Poutanen, K.; Schwab, U.; Uusitupa, M. CMPF does not associate with impaired glucose metabolism in individuals with features of metabolic syndrome. PLoS ONE 2015, 10, e0124379. [Google Scholar] [CrossRef] [PubMed]
- Prentice, K.J.; Luu, L.; Allister, E.M.; Liu, Y.; Jun, L.S.; Sloop, K.W.; Hardy, A.B.; Wei, L.; Jia, W.; Fantus, I.G.; et al. The Furan Fatty Acid Metabolite CMPF Is Elevated in Diabetes and Induces β Cell Dysfunction. Cell Metab. 2014, 19, 653–666. [Google Scholar] [CrossRef] [PubMed]
- Retnakaran, R.; Ye, C.; Kramer, C.K.; Connelly, P.W.; Hanley, A.J.; Sermer, M.; Zinman, B. Evaluation of Circulating Determinants of Beta-Cell Function in Women with and Without Gestational Diabetes. J. Clin. Endocrinol. Metab. 2016, 101, 2683–2691. [Google Scholar] [CrossRef] [PubMed]
- Miyamoto, Y.; Iwao, Y.; Mera, K.; Watanabe, H.; Kadowaki, D.; Ishima, Y.; Chuang, V.T.G.; Sato, K.; Otagiri, M.; Maruyama, T. A uremic toxin, 3-carboxy-4-methyl-5-propyl-2-furanpropionate induces cell damage to proximal tubular cells via the generation of a radical intermediate. Biochem. Pharmacol. 2012, 84, 1207–1214. [Google Scholar] [CrossRef] [PubMed]
- Niwa, T.; Asada, H.; Tsutsui, S.; Miyazaki, T. Efficient removal of albumin-bound furancarboxylic acid by protein-leaking hemodialysis. Am. J. Nephrol. 1995, 15, 463–467. [Google Scholar] [CrossRef] [PubMed]
- Everts, M.E.; Lim, C.F.; Moerings, E.P.; Docter, R.; Visser, T.J.; De Jong, M.; Krenning, E.P.; Hennemann, G. Effects of a furan fatty acid and indoxyl sulfate on thyroid hormone uptake in cultured anterior pituitary cells. Am. J. Physiol. 1995, 268, E974–E979. [Google Scholar] [CrossRef] [PubMed]
- Costigan, M.G.; Callaghan, C.A.; Lindup, W.E. Hypothesis: Is accumulation of a furan dicarboxylic acid (3-carboxy-4-methyl-5-propyl-2-furanpropanoic acid) related to the neurological abnormalities in patients with renal failure? Nephron 1996, 73, 169–173. [Google Scholar] [CrossRef] [PubMed]
- Wratten, M.L.; Galaris, D.; Tetta, C.; Sevanian, A. Evolution of oxidative stress and inflammation during hemodialysis and their contribution to cardiovascular disease. Antioxid. Redox Signal. 2002, 4, 935–944. [Google Scholar] [CrossRef] [PubMed]
- Boelaert, J.; Lynen, F.; Glorieux, G.; Eloot, S.; Landschoot, M.V.; Waterloos, M.-A.; Sandra, P.; Vanholder, R. A novel UPLC–MS–MS method for simultaneous determination of seven uremic retention toxins with cardiovascular relevance in chronic kidney disease patients. Anal. Bioanal. Chem. 2013, 405, 1937–1947. [Google Scholar] [CrossRef] [PubMed]
- Daugirdas, J.T.; Depner, T.A.; Inrig, J.; Mehrotra, R.; Rocco, M.V.; Suri, R.S.; Weiner, D.E.; Greer, N.; Ishani, A.; MacDonald, R.; et al. KDOQI Clinical Practice Guideline for Hemodialysis Adequacy: 2015 Update. Am. J. Kidney Dis. 2015, 66, 884–930. [Google Scholar] [CrossRef] [PubMed]
- Uremic Solutes Database. Available online: http://eutoxdb.odeesoft.com/index.php (accessed on 15 May 2003).
- Meert, N.; Schepers, E.; De Smet, R.; Argiles, A.; Cohen, G.; Deppisch, R.; Drüeke, T.; Massy, Z.; Spasovski, G.; Stegmayr, B.; et al. Inconsistency of reported uremic toxin concentrations. Artif. Organs 2007, 31, 600–611. [Google Scholar] [CrossRef] [PubMed]
- Itoh, Y.; Ezawa, A.; Kikuchi, K.; Tsuruta, Y.; Niwa, T. Protein-bound uremic toxins in hemodialysis patients measured by liquid chromatography/tandem mass spectrometry and their effects on endothelial ROS production. Anal. Bioanal. Chem. 2012, 403, 1841–1850. [Google Scholar] [CrossRef] [PubMed]
- Fagugli, R.M.; Smet, R.D.; Buoncristiani, U.; Lameire, N.; Vanholder, R. Behavior of non-protein-bound and protein-bound uremic solutes during daily hemodialysis. Am. J. Kidney Dis. 2002, 40, 339–347. [Google Scholar] [CrossRef] [PubMed]
- Mabuchi, H.; Nakahashi, H. Determination of 3-carboxy-4-methyl-5-propyl-2-furanpropanoic acid, a major endogenous ligand substance in uremic serum, by high-performance liquid chromatography with ultraviolet detection. J. Chromatogr. 1987, 415, 110–117. [Google Scholar] [CrossRef]
- Tsujimoto, M.; Hatozaki, D.; Shima, D.; Yokota, H.; Furukubo, T.; Izumi, S.; Yamakawa, T.; Minegaki, T.; Nishiguchi, K. Influence of serum in hemodialysis patients on the expression of intestinal and hepatic transporters for the excretion of pravastatin. Ther. Apher. Dial. 2012, 16, 580–587. [Google Scholar] [CrossRef] [PubMed]
- Lesaffer, G.; De Smet, R.; Lameire, N.; Dhondt, A.; Duym, P.; Vanholder, R. Intradialytic removal of protein-bound uraemic toxins: Role of solute characteristics and of dialyser membrane. Nephrol. Dial. Transplant. 2000, 15, 50–57. [Google Scholar] [CrossRef] [PubMed]
- Niwa, T.; Yazawa, T.; Kodama, T.; Uehara, Y.; Maeda, K.; Yamada, K. Efficient removal of albumin-bound furancarboxylic acid, an inhibitor of erythropoiesis, by continuous ambulatory peritoneal dialysis. Nephron 1990, 56, 241–245. [Google Scholar] [CrossRef] [PubMed]
- Niwa, T.; Kawagishi, I.; Ohya, N. Rapid assay for furancarboxylic acid accumulated in uremic serum using high-performance liquid chromatography and on-line mass spectrometry. Clin. Chim. Acta Int. J. Clin. Chem. 1994, 226, 89–94. [Google Scholar] [CrossRef]
- Sassa, T.; Matsuno, H.; Niwa, M.; Kozawa, O.; Takeda, N.; Niwa, T.; Kumada, T.; Uematsu, T. Measurement of furancarboxylic acid, a candidate for uremic toxin, in human serum, hair, and sweat, and analysis of pharmacological actions in vitro. Arch. Toxicol. 2000, 73, 649–654. [Google Scholar] [CrossRef] [PubMed]
- De Smet, R.; Dhondt, A.; Eloot, S.; Galli, F.; Waterloos, M.A.; Vanholder, R. Effect of the super-flux cellulose triacetate dialyser membrane on the removal of non-protein-bound and protein-bound uraemic solutes. Nephrol. Dial. Transplant. 2007, 22, 2006–2012. [Google Scholar] [CrossRef] [PubMed]
- Nishio, T.; Takamura, N.; Nishii, R.; Tokunaga, J.; Yoshimoto, M.; Kawai, K. Influences of haemodialysis on the binding sites of human serum albumin: Possibility of an efficacious administration plan using binding inhibition. Nephrol. Dial. Transplant. 2008, 23, 2304–2310. [Google Scholar] [CrossRef] [PubMed]
- Brandenburg, V.M.; Schlieper, G.; Heussen, N.; Holzmann, S.; Busch, B.; Evenepoel, P.; Vanholder, R.; Meijers, B.; Meert, N.; Fassbender, W.J.; et al. Serological cardiovascular and mortality risk predictors in dialysis patients receiving sevelamer: A prospective study. Nephrol. Dial. Transplant. 2010, 25, 2672–2679. [Google Scholar] [CrossRef] [PubMed]
- Eloot, S.; Van Biesen, W.; Glorieux, G.; Neirynck, N.; Dhondt, A.; Vanholder, R. Does the Adequacy Parameter Kt/Vurea Reflect Uremic Toxin Concentrations in Hemodialysis Patients? PLoS ONE 2013, 8. [Google Scholar] [CrossRef] [PubMed]
- Rroji, M.; Eloot, S.; Dhondt, A.; Van Biesen, W.; Glorieux, G.; Neirynck, N.; Vandennoortgate, N.; Liabeuf, S.; Massy, Z.; Vanholder, R. Association of advanced age with concentrations of uraemic toxins in CKD. J. Nephrol. 2016, 29, 81–91. [Google Scholar] [CrossRef] [PubMed]
- Prentice, K.J.; Wendell, S.G.; Liu, Y.; Eversley, J.A.; Salvatore, S.R.; Mohan, H.; Brandt, S.L.; Adams, A.C.; Serena Wang, X.; Wei, D.; et al. CMPF, a Metabolite Formed Upon Prescription Omega-3-Acid Ethyl Ester Supplementation, Prevents and Reverses Steatosis. EBioMedicine 2018, 27, 200–213. [Google Scholar] [CrossRef] [PubMed]
- Liu, Y.; Prentice, K.J.; Eversley, J.A.; Hu, C.; Batchuluun, B.; Leavey, K.; Hansen, J.B.; Wei, D.W.; Cox, B.; Dai, F.F.; et al. Rapid Elevation in CMPF May Act As a Tipping Point in Diabetes Development. Cell Rep. 2016, 14, 2889–2900. [Google Scholar] [CrossRef] [PubMed]
- Savolainen, O.; Lind, M.V.; Bergström, G.; Fagerberg, B.; Sandberg, A.-S.; Ross, A. Biomarkers of food intake and nutrient status are associated with glucose tolerance status and development of type 2 diabetes in older Swedish women. Am. J. Clin. Nutr. 2017, 106, 1302–1310. [Google Scholar] [CrossRef] [PubMed]
- Daugirdas, J.T.; Depner, T.A.; Greene, T.; Levin, N.W.; Chertow, G.M.; Rocco, M.V. Frequent Hemodialysis Network Trial Group Standard Kt/Vurea: A method of calculation that includes effects of fluid removal and residual kidney clearance. Kidney Int. 2010, 77, 637–644. [Google Scholar] [CrossRef] [PubMed]
- Deurenberg, P.; Weststrate, J.A.; Seidell, J.C. Body mass index as a measure of body fatness: Age- and sex-specific prediction formulas. Br. J. Nutr. 1991, 65, 105–114. [Google Scholar] [CrossRef] [PubMed]
- Kaysen, G.A.; Zhu, F.; Sarkar, S.; Heymsfield, S.B.; Wong, J.; Kaitwatcharachai, C.; Kuhlmann, M.K.; Levin, N.W. Estimation of total-body and limb muscle mass in hemodialysis patients by using multifrequency bioimpedance spectroscopy. Am. J. Clin. Nutr. 2005, 82, 988–995. [Google Scholar] [CrossRef] [PubMed]
- Sarkar, S.R.; Kuhlmann, M.K.; Khilnani, R.; Zhu, F.; Heymsfield, S.B.; Kaysen, G.A.; Levin, N.W. Assessment of body composition in long-term hemodialysis patients: Rationale and methodology. J. Ren. Nutr. 2005, 15, 152–158. [Google Scholar] [CrossRef] [PubMed]
- Chertow, G.M.; Lowrie, E.G.; Wilmore, D.W.; Gonzalez, J.; Lew, N.L.; Ling, J.; Leboff, M.S.; Gottlieb, M.N.; Huang, W.; Zebrowski, B. Nutritional assessment with bioelectrical impedance analysis in maintenance hemodialysis patients. J. Am. Soc. Nephrol. 1995, 6, 75–81. [Google Scholar] [PubMed]
- Donadio, C.; Consani, C.; Ardini, M.; Bernabini, G.; Caprio, F.; Grassi, G.; Lucchesi, A.; Nerucci, B. Estimate of body water compartments and of body composition in maintenance hemodialysis patients: Comparison of single and multifrequency bioimpedance analysis. J. Ren. Nutr. 2005, 15, 332–344. [Google Scholar] [CrossRef] [PubMed]
- Canaud, B.; Garred, L.J.; Argiles, A.; Flavier, J.L.; Bouloux, C.; Mion, C. Creatinine kinetic modelling: A simple and reliable tool for the assessment of protein nutritional status in haemodialysis patients. Nephrol. Dial. Transplant. 1995, 10, 1405–1410. [Google Scholar] [PubMed]


| Demographic and Clinical Characteristics | ||
|---|---|---|
| Age (years) | 64.0 | [47.2–75.6] |
| Gender M/F (%) | 148/90 (62/38%) | |
| Dialysis vintage (years) | 2.2 | [1.1–21.9] |
| BMI (kg/m2) | 25.2 | [22.6–28.4] |
| BF (%) | 37.8 | [31.1–44.3] |
| CI (mg/kg/day) | 19.7 | [17.7–21.9] |
| nPCR | 1.1 | [0.9–1.3] |
| spKt/V | 1.7 | [1.5–1.9] |
| Medical history of CV events (%) | 33% | |
| HTA (%) | 89% | |
| Type 2 Diabetes (%) | 29% | |
| Type 1 Diabetes (%) | 2% | |
| Dyslipidemia (%) | 55% | |
| Biological characteristics | ||
| Crpre (μmol/L) | 752 | [572–1872] |
| Urea (mmol/L) | 20 | [16–23] |
| CMPF (mg/L) | 2.55 | [1.00–5.23] |
| Haemoglobin (g/dL) | 11.3 | [10.5–12.2] |
| Ferritin (ng/mL) | 394 | [119–668] |
| Leukocytes (G/L) | 6.1 | [5.0–7.3] |
| Platelets (G/L) | 219 | [171–268] |
| Bicarbonate (mmol/L) | 21 | [19–23] |
| Phosphorus (mmol/L) | 1.4 | [1.2–1.8] |
| Calcaemia (mmol/L) | 2.2 | [2.1–2.4] |
| PTH (ng/L) | 234 | [106–504] |
| 25-OH Vitamin D3 (μg/L) | 32 | [25–40] |
| Total cholesterol (g/L) | 1.6 | [1.4–1.9] |
| LDL cholesterol (g/L) | 0.9 | [0.7–1.2] |
| HDL cholesterol (g/L) | 0.4 | [0.3–0.5] |
| Triglycerides (g/L) | 1.5 | [1.0–2.3] |
| HbA1c (%) | 5.6 | [5.6–3.4] |
| Albumin (g/L) | 39.3 | [36.3–41.4] |
| Prealbumin (g/L) | 0.33 | [0.28–0.39] |
| CRP (mg/L) | 5 | [2–12] |
| NT-proBNP (pg/mL) | 1967 | [822–4904] |
| Variable | rs | 95%CI | p-Value |
|---|---|---|---|
| Age (years) | −0.07 | [−0.20 to 0.06] | 0.28 |
| Dialysis vintage (years) | 0.16 | [0.03 to 0.29] | 0.01 |
| spKt/V | −0.09 | [0.22 to 0.04] | 0.18 |
| BMI (kg/m2) | 0.16 | [0.03 to 0.30] | 0.01 |
| BF (%) | 0.11 | [−0.02 to 0.24] | 0.10 |
| CI (mg/kg/day) | 0.16 | [0.03 to 0.29] | 0.01 |
| Haemoglobin (g/dL) | 0.24 | [−0.06 to 0.21] | 0.24 |
| Leukocytes (/mm3) | −0.13 | [−0.26 to −0.00] | 0.04 |
| Platelets (/mm3) | −0.10 | [−0.23 to 0.03] | 0.12 |
| Crpre (μmol/L) | 0.18 | [0.05 to 0.31] | 0.004 |
| Urea (mmol/L) | 0.09 | [−0.04 to 0.22] | 0.18 |
| Bicarbonate (mmol/L) | 0.05 | [−0.08 to 0.18] | 0.41 |
| Calcaemia (mmol/L) | −0.01 | [−0.14 to 0.12] | 0.91 |
| Phosphoremia | −0.03 | [−0.16 to 0.10] | 0.65 |
| Parathormon (ng/L) | 0.12 | [−0.02 to 0.25] | 0.09 |
| 25-OH Vitamin D3 (μg/L) | 0.12 | [−0.02 to 0.25] | 0.12 |
| CRP (mg/L) | 0.02 | [−0.11 to 0.16] | 0.74 |
| Glycaemia (g/L) | −0.08 | [−0.21 to 0.05] | 0.22 |
| HbA1c (%) | −0.01 | [−0.17 to 0.15] | 0.87 |
| Total cholesterol (g/L) | −0.01 | [−0.17 to 0.14] | 0.88 |
| LDL cholesterol (g/L) | −0.08 | [−0.24 to 0.08] | 0.31 |
| HDL cholesterol (g/L) | −0.09 | [−0.24 to 0.07] | 0.25 |
| Triglycerides (g/L) | 0.08 | [−0.08 to 0.23] | 0.33 |
| Albumin (g/L) | 0.20 | [0.07 to 0.32] | 0.003 |
| Pre-albumin (g/L) | 0.16 | [0.02 to 0.29] | 0.02 |
| nPCR (Garred) | −0.01 | [−0.15 to 0.13] | 0.89 |
| NT-proBNP (pg/mL) | −0.14 | [−0.27 to −0.00] | 0.04 |
| Dependent Variable: CMPF | |||
|---|---|---|---|
| Independent Variable | β Coefficient | Standard Error | p-Value |
| Albumin (g/L) | 0.232 | 0.191 | 0.23 |
| Prealbumin (g/L) | 0.003 | 0.008 | 0.73 |
| Crpre (μmol/L) | 0.003 | 0.003 | 0.33 |
| BMI (kg/m2) | 0.062 | 0.103 | 0.55 |
| Intercept | −8.442 | 7.163 | |
| Variable | rs | 95%CI | p-Value |
|---|---|---|---|
| BMI (kg/m2) | 0.43 | [0.20 to 0.62] | <0.001 |
| Lean tissue mass (LTM) (kg) | 0.29 | [0.046 to 0.50] | 0.02 |
| Lean tissue index (LTI) (kg/m2) | 0.36 | [0.12 to 0.56] | 0.003 |
| Adipose tissue mass (ATM) (kg) | 0.09 | [−0.33 to 0.17] | 0.49 |
| Fat tissue index (FTI) (kg/m2) | 0.10 | [−0.34 to 0.16] | 0.45 |
| Body cell mass (BCM) (kg) | 0.31 | [0.07 to 0.52] | 0.01 |
| Dependent Variable: CMPF | |||
|---|---|---|---|
| Independent Variable | β Coefficient | Standard Error | p-Value |
| BMI (kg/m2) | 0.025 | 3.206E−4 | 0.85 |
| Lean tissue index (LTI) (kg/m2) | 0.525 | 5.397 | 0.38 |
| Body cell mass (BCM) (kg) | −0.320 | 2.528 | 0.59 |
| Intercept | −9.394 |
| Study | HD Technique | PreHD Total CMPF (mg/L) | Patients | Detection Technique | ||
|---|---|---|---|---|---|---|
| 1987 | Mabuchi H. [25] | HD | 43.9 | ±9.1 | n = 13 | HPLC—UV detection 215 nm |
| 1990 | Niwa T. [28] | HD | 41.0 | ±18.3 | n = 23 | HPLC—UV detection 270 nm |
| 1994 | Niwa T. [29] | HD | 32.3 | ±13.2 | n = 20 | HPLC—UV detection 270 nm |
| 2000 | Lesaffer G. [27] | High Flux polysulphone HD | 19.7 | ±10.3 | n = 10 | HPLC—UV detection 254 nm |
| High Flux cellulose triacetate HD | 17.6 | ±7.7 | n = 10 | |||
| Low flux polysulphone HD | 17.1 | ±8.9 | n = 10 | |||
| 2000 | Sassa T. [30] | HD | 32.3 | ±2.7 | n = 17 | HPLC—UV detection 270 nm |
| 2002 | Fagugli M. R. [24] | Standard HD (SHD) | 3.7 | ±2.5 | n = 7 | HPLC—UV detection 254 nm |
| Daily HD (DHD) | 3.6 | ±2.0 | n = 7 | |||
| 2007 | De Smet R. [31] | Low Flux HD | 8.8 | ±5.0 | n = 11 | HPLC—UV detection 254 nm |
| Super Flux cellulose triacetate HD | 8.4 | ±3.6 | ||||
| 2008 | Nishio T. [32] | HD | 18.8 | ±5.8 | n = 14 | HPLC—UV detection 261 nm |
| 2010 | Brandenburg V. [33] | HD | 4.0 | ±2.9 | n = 41 | HPLC—UV detection 254 nm |
| 2012 | Itoh Y. [23] | HD | 21.1 | ±1.3 | n = 45 | LC/ESI-MS/MS |
| 2013 | Eloot S. [34] | HD | 3.8 [2.0–6.1] | n = 71 | HPLC—UV detection 254 nm | |
| 2016 | Rroji M. [35] | HD | 4.3 [2.3–7.7] | n = 126 | RP-HPLC—UVdetection254 nm | |
| 2018 | Luce M. | HD | 2.5 [1.0–5.2] | n = 238 | HPLC—UV detection 215 nm | |
© 2018 by the authors. Licensee MDPI, Basel, Switzerland. This article is an open access article distributed under the terms and conditions of the Creative Commons Attribution (CC BY) license (http://creativecommons.org/licenses/by/4.0/).
Share and Cite
Luce, M.; Bouchara, A.; Pastural, M.; Granjon, S.; Szelag, J.C.; Laville, M.; Arkouche, W.; Fouque, D.; Soulage, C.O.; Koppe, L. Is 3-Carboxy-4-methyl-5-propyl-2-furanpropionate (CMPF) a Clinically Relevant Uremic Toxin in Haemodialysis Patients? Toxins 2018, 10, 205. https://doi.org/10.3390/toxins10050205
Luce M, Bouchara A, Pastural M, Granjon S, Szelag JC, Laville M, Arkouche W, Fouque D, Soulage CO, Koppe L. Is 3-Carboxy-4-methyl-5-propyl-2-furanpropionate (CMPF) a Clinically Relevant Uremic Toxin in Haemodialysis Patients? Toxins. 2018; 10(5):205. https://doi.org/10.3390/toxins10050205
Chicago/Turabian StyleLuce, Mathilde, Anais Bouchara, Myriam Pastural, Samuel Granjon, Jean Christophe Szelag, Maurice Laville, Walid Arkouche, Denis Fouque, Christophe O. Soulage, and Laetitia Koppe. 2018. "Is 3-Carboxy-4-methyl-5-propyl-2-furanpropionate (CMPF) a Clinically Relevant Uremic Toxin in Haemodialysis Patients?" Toxins 10, no. 5: 205. https://doi.org/10.3390/toxins10050205
APA StyleLuce, M., Bouchara, A., Pastural, M., Granjon, S., Szelag, J. C., Laville, M., Arkouche, W., Fouque, D., Soulage, C. O., & Koppe, L. (2018). Is 3-Carboxy-4-methyl-5-propyl-2-furanpropionate (CMPF) a Clinically Relevant Uremic Toxin in Haemodialysis Patients? Toxins, 10(5), 205. https://doi.org/10.3390/toxins10050205