Modelled Cost-Effectiveness of a Package Size Cap and a Kilojoule Reduction Intervention to Reduce Energy Intake from Sugar-Sweetened Beverages in Australia

 , ,
, ,  , ,
, ,  ,
, 
Abstract
:1. Introduction
2. Materials and Methods
2.1. Overview
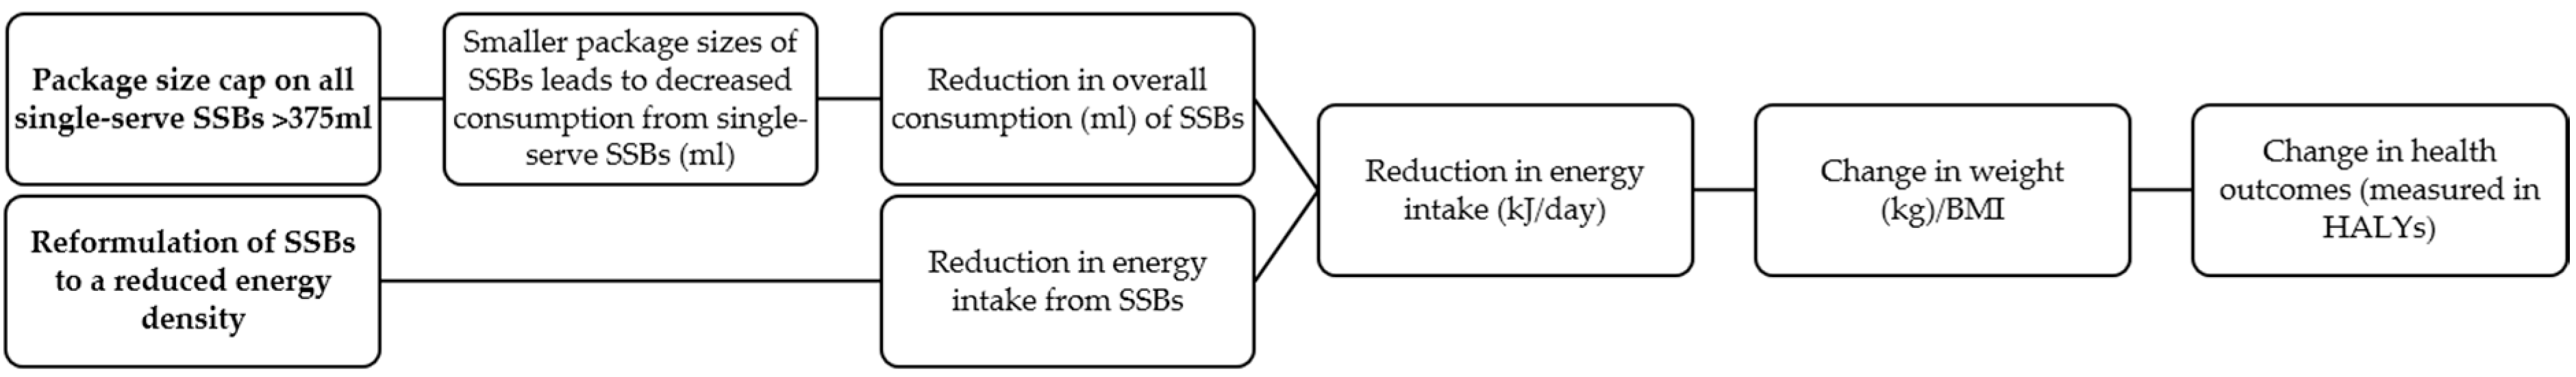
2.2. Specification of the Interventions
2.2.1. A Package Size Cap on all Packaged Single-Serve SSBs (Package Size Cap)
2.2.2. Reformulation of SSBs to a Reduced Energy Density (Energy Reduction)
2.3. Estimation of Effect Size
2.4. Package Size Cap Intervention
2.5. Energy Reduction Intervention
2.6. Intervention Costs
3. Modelling Cost-Effectiveness
Uncertainty Analysis
4. Results
4.1. Changes in Consumption, Energy Intake and Body Weight
4.2. Costs
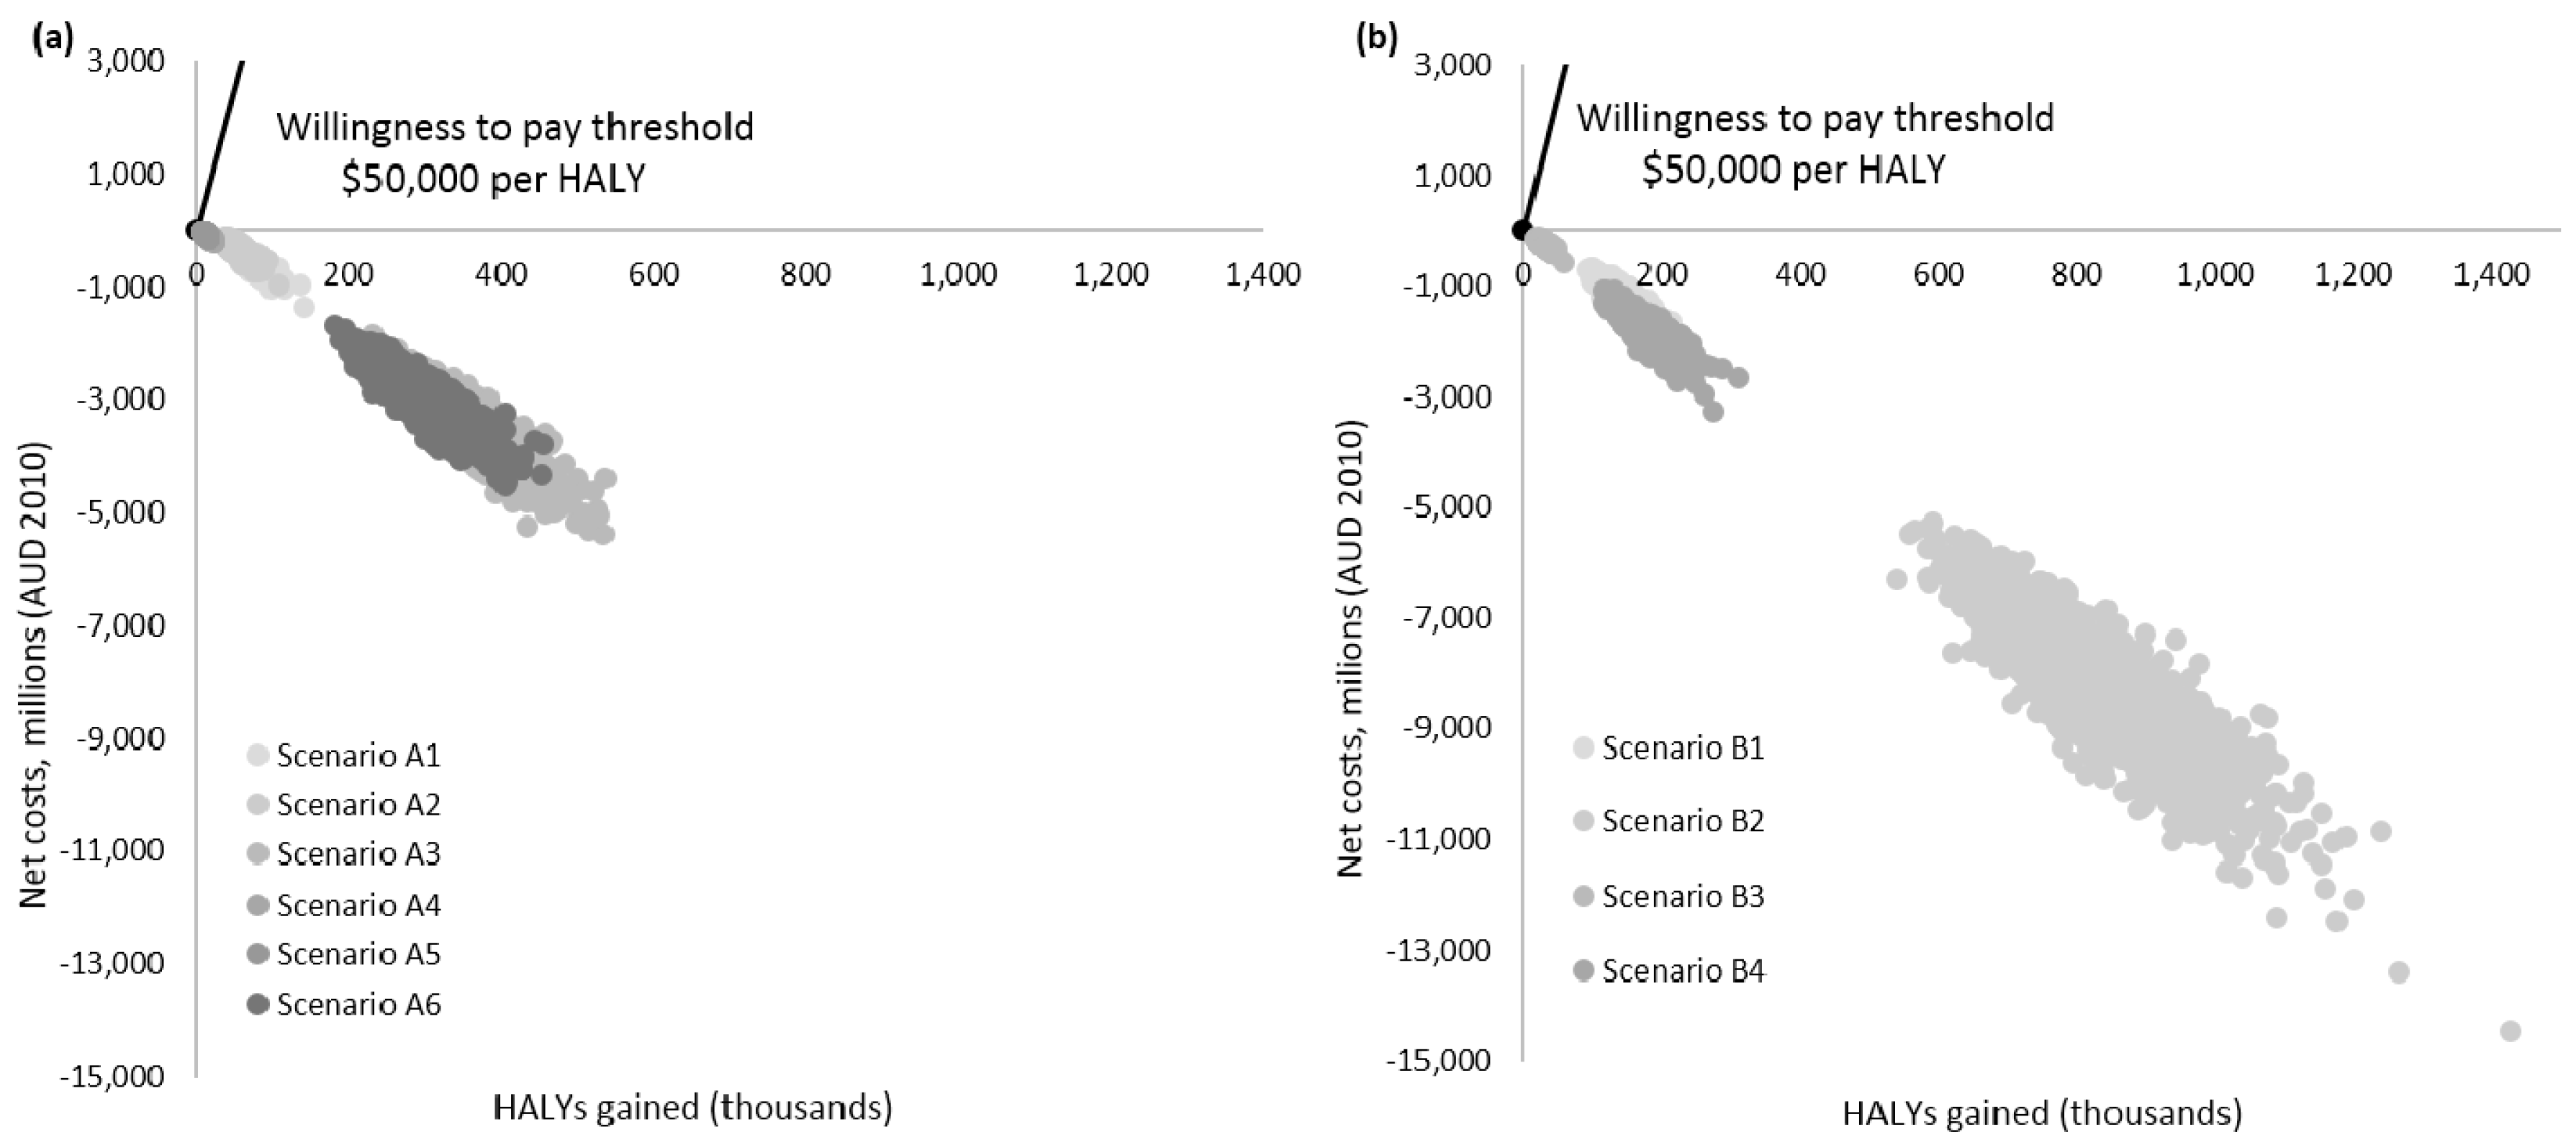
4.3. Cost-Effectiveness Results
5. Discussion
6. Conclusions
Supplementary Materials
Author Contributions
Conflicts of Interest
References
- Smiciklas-Wright, H.; Mitchell, D.C.; Mickle, S.J.; Goldman, J.D.; Cook, A. Foods commonly eaten in the United States, 1989–1991 and 1994–1996: Are portion sizes changing? J. Am. Diet. Assoc. 2003, 103, 41–47. [Google Scholar] [CrossRef] [PubMed]
- Young, L.R.; Nestle, M. The contribution of expanding portion sizes to the US obesity epidemic. Am. J. Public Health 2002, 92, 246–249. [Google Scholar] [CrossRef] [PubMed]
- Piernas, C.; Popkin, B.M. Food portion patterns and trends among US children and the relationship to total eating occasion size, 1977–2006. J. Nutr. 2011, 141, 1159–1164. [Google Scholar] [CrossRef] [PubMed]
- Nielsen, S.J.; Popkin, B.M. Patterns and trends in food portion sizes, 1977–1998. JAMA 2003, 289, 450–453. [Google Scholar] [CrossRef] [PubMed]
- Aerts, G.; Smits, T. The package size effect: How package size affects young children’s consumption of snacks differing in sweetness. Food Q. Preference 2017, 60, 72–80. [Google Scholar] [CrossRef]
- Hollands, G.J.; Shemilt, I.; Marteau, T.M.; Jebb, S.A.; Lewis, H.B.; Wei, Y.; Higgins, J.; Ogilvie, D. Portion, package or tableware size for changing selection and consumption of food, alcohol and tobacco. Cochrane Libr. 2015. [Google Scholar] [CrossRef]
- Poelman, M.P.; Eyles, H.; Dunford, E.; Schermel, A.; L’Abbe, M.R.; Neal, B.; Seidell, J.C.; Steenhuis, I.H.; Mhurchu, C.N. Package size and manufacturer-recommended serving size of sweet beverages: A cross-sectional study across four high-income countries. Public Health Nutr. 2016, 19, 1008–1016. [Google Scholar] [CrossRef] [PubMed]
- Livingstone, M.B.E.; Pourshahidi, L.K. Portion size and obesity. Adv. Nutr. Int. Rev. J. 2014, 5, 829–834. [Google Scholar] [CrossRef] [PubMed]
- Faulkner, G.; Pourshahidi, L.; Wallace, J.; Kerr, M.; McCrorie, T.; Livingstone, M. Serving size guidance for consumers: Is it effective? Proc. Nutr. Soc. 2012, 71, 610–621. [Google Scholar] [CrossRef] [PubMed]
- Diliberti, N.; Bordi, P.L.; Conklin, M.T.; Roe, L.S.; Rolls, B.J. Increased portion size leads to increased energy intake in a restaurant meal. Obes. Res. 2004, 12, 562–568. [Google Scholar] [CrossRef] [PubMed]
- Rolls, B.J.; Roe, L.S.; Meengs, J.S.; Wall, D.E. Increasing the portion size of a sandwich increases energy intake. J. Am. Diet. Assoc. 2004, 104, 367–372. [Google Scholar] [CrossRef] [PubMed]
- Wansink, B.; Kim, J. Bad popcorn in big buckets: Portion size can influence intake as much as taste. J. Nutr. Educ. Behav. 2005, 37, 242–245. [Google Scholar] [CrossRef]
- Matthiessen, J.; Fagt, S.; Biltoft-Jensen, A.; Beck, A.M.; Ovesen, L. Size makes a difference. Public Health Nutr. 2003, 6, 65–72. [Google Scholar] [CrossRef] [PubMed]
- Sacks, F.M.; Bray, G.A.; Carey, V.J.; Smith, S.R.; Ryan, D.H.; Anton, S.D.; McManus, K.; Champagne, C.M.; Bishop, L.M.; Laranjo, N. Comparison of weight-loss diets with different compositions of fat, protein, and carbohydrates. N. Engl. J. Med. 2009, 2009, 859–873. [Google Scholar] [CrossRef] [PubMed]
- Crino, M.; Sacks, G.; Wu, J.H.Y. A review of population-level actions targeting reductions in food portion sizes to address obesity and related non-communicable diseases. Curr. Nutr. Rep. 2016, 5, 323–332. [Google Scholar] [CrossRef]
- Ray, A. Bye-Bye Big Gulp-New York City′s Attempt to Limit the Sale of Soda. Stetson Law Rev. 2014, 44, 265. [Google Scholar]
- UK Department of Health. Public Health Responsibility Deal—Food Network: Calorie Reduction Pledge Development Tool. 2014. Available online: https://responsibilitydeal.dh.gov.uk/wp-content/uploads/2014/04/calorie-reduction-development-tool-final-v3.pdf (accessed on 26 February 2017).
- Australian Institute of Health and Welfare. Risk Factors, Diseases & Death: Overweight and Obesity. 2017. Available online: http://www.aihw.gov.au/overweight-and-obesity/ (accessed on 17 May 2017).
- Australian Bureau of Statistics. Australian Healthy Survey: Nutrition First Results—Food and Nutrients 2011–12; Australian Bureau of Statistics: Canberra, Australia, 2014.
- New South Wales. Government Premier′s Priorities: Tackling Childhood Obesity. Available online: https://www.nsw.gov.au/improving-nsw/premiers-priorities/tackling-childhood-obesity/ (accessed on 17 May 2017).
- Australian Department of Health. Healthy Food Partnership: About the Partnership. 2016. Available online: http://www.health.gov.au/internet/main/publishing.nsf/Content/about-the-partnership (accessed on 15 June 2017).
- Food Standards Australia New Zealand. Overview and Application of Food Labelling and Information Requirements: User Guide to Standard 1.2.1—Labelling and Other Information Requirements. 2011. Available online: http://www.foodstandards.gov.au/code/userguide/Documents/Guide%20to%20Standard%201.2.1%20-%20Labelling%20and%20Other%20Information%20Requirements.pdf (accessed on 15 April 2017).
- National Health and Medical Research Council. Australian Dietary Guidelines: Summary Eat for Health. 2013. Available online: https://www.eatforhealth.gov.au/sites/default/files/files/the_guidelines/n55a_australian_dietary_guidelines_summary_book.pdf (accessed on 25 April 2017).
- Leatherhead Food Research. Reformulation Guide for Small to Medium Sized Companies: Spotlight on Sugars. 2016. Available online: https://www.fdf.org.uk/corporate_pubs/Reformulation-Guide-Sugars-Aug2016.pdf (accessed on 20 June 2017).
- Australian Bureau of Statistics. Australian Health Survey 2011–12; Australian Health Survey: Canberra, Australia, 2015.
- Roberto, C.A.; Swinburn, B.; Hawkes, C.; Huang, T.T.K.; Costa, S.A.; Ashe, M.; Zwicker, L.; Cawley, J.H.; Brownell, K.D. Patchy progress on obesity prevention: Emerging examples, entrenched barriers, and new thinking. Lancet 2015, 385, 2400–2409. [Google Scholar] [CrossRef]
- Swinburn, B.; Sacks, G.; Vandevijvere, S.; Kumanyika, S.; Lobstein, T.; Neal, B.; Barquera, S.; Friel, S.; Hawkes, C.; Kelly, B.; et al. Informas, INFORMAS (International Network for Food and Obesity/non-communicable diseases Research, Monitoring and Action Support): Overview and key principles. Obes. Rev. 2013, 14, 1–12. [Google Scholar] [CrossRef] [PubMed]
- Swinburn, B.A.; Sacks, G.; Hall, K.D.; McPherson, K.; Finegood, D.T.; Moodie, M.L.; Gortmaker, S.L. The global obesity pandemic: Shaped by global drivers and local environments. Lancet 2011, 378, 804–814. [Google Scholar] [CrossRef]
- Sacks, G.; Veerman, J.L.; Moodie, M.; Swinburn, B. ‘Traffic-light’ nutrition labelling and ‘junk-food’ tax: A modelled comparison of cost-effectiveness for obesity prevention. Int. J. Obes. 2011, 35, 1001–1009. [Google Scholar] [CrossRef] [PubMed]
- PricewaterhouseCoopers. Health Star Rating System: Cost Benefit Analysis. 2014. Available online: http://www.gpv.org.au/uploads/cms/files/FoPL%20CBA%20Report%20-%20website%20FINAL%20(D14-1435002).pdf (accessed on 26 February 2017).
- Health Star Rating Advisory Committee. Two Years Progress Review Report on the Implementation of the Health Star Health Rating System (June 2014 to June 2016). 2017. Available online: http://healthstarrating.gov.au/internet/healthstarrating/publishing.nsf/Content/reviews (accessed on 8 May 2017).
- Vermeer, W.M.; Steenhuis, I.H.; Poelman, M. Small, medium, large or supersize? The development and evaluation of interventions targeted at portion size. Int. J. Obes. 2014, 38, S13–S18. [Google Scholar] [CrossRef] [PubMed]
- Wang, Y.C.; Vine, S.M. Caloric effect of a 16-ounce (473-mL) portion-size cap on sugar-sweetened beverages served in restaurants. Am. J. Clin. Nutr. 2013, 98, 430–435. [Google Scholar] [CrossRef] [PubMed]
- Zlatevska, N.; Dubelaar, C.; Holden, S.S. Sizing up the effect of portion size on consumption: a meta-analytic review. Journal of Marketing. 2014, 78, 140–154. [Google Scholar] [CrossRef]
- Williams, R.A.; Roe, L.S.; Rolls, B.J. Assessment of satiety depends on the energy density and portion size of the test meal. Obesity. 2014, 22, 318–324. [Google Scholar] [CrossRef] [PubMed]
- Lal, A.; Mantilla-Herrera, A.M.; Veerman, J.L.; Backholer, K.; Sacks, G.; Moodie, M.; Siahpush, M.; Carter, R.; Peeters, A. Equity and cost-effectiveness of a sugar sweetened beverage tax across socioeconomic groups. PLoS Med. 2017, 14, e1002326. [Google Scholar] [CrossRef] [PubMed]
- Neal, B.; Crino, M.; Dunford, E.; Gao, A.; Greenland, R.; Li, N.; Millis, A.; Mhurchu, C.N.; Pettigrew, S.; Sacks, G.; et al. Effects of different types of front-of-pack labelling on the healthiness of food purchases—A randomized controlled trial. Am. J. Clin. Nutr. 2017, in press. [Google Scholar]
- Australian New Zealand Clinical Trials Registry. The Effects of Four Front-of-Pack Labelling Schemes Compared to Standard Nutrition Information Panel, on Mean Nutrient Profiling Score of Food Purchases among the Adult Australian Consumers: A Randomized Trial. Available online: https://www.anzctr.org.au/Trial/Registration/TrialReview.aspx?id=366945&isReview=true (accessed on 23 June 2016).
- Dunford, E.; Trevena, H.; Goodsell, C.; Ng, K.H.; Webster, J.; Millis, A.; Goldstein, S.; Hugueniot, O.; Neal, B. FoodSwitch: A mobile phone app to enable consumers to make healthier food choices and crowdsourcing of national food composition data. JMIR mHealth uHealth 2014, 2, e37. [Google Scholar] [CrossRef] [PubMed]
- National Heart Foundation. Report on the Monitoring of the Implementation of the Health Star Rating System—Year 1. 2016. Available online: http://healthstarrating.gov.au/internet/healthstarrating/publishing.nsf/Content/474CBBEC911CFF01CA25803A007E7B2B/$File/Report%20on%20the%20monitoring%20of%20the%20HSR%20-%20Year%201.pdf (accessed on 19 April 2017).
- Ello-Martin, J.A.; Ledikwe, J.H.; Rolls, B.J. The influence of food portion size and energy density on energy intake: Implications for weight management. Am. J. Clin. Nutr. 2005, 82, 236S–241S. [Google Scholar] [PubMed]
- PricewaterhouseCoopers. Food Standards Australia New Zealand: Cost Schedule for Food Labelling Changes—Final Report. 2008. Available online: http://www.foodstandards.gov.au/publications/documents/Final%20report-%20FSANZ%20-%207%20March%202008%20(2).pdf (accessed on 20 April 2017).
- Hall, K.D.; Sacks, G.; Chandramohan, D.; Chow, C.C.; Wang, Y.C.; Gortmaker, S.L.; Swinburn, B.A. Quantification of the effect of energy imbalance on bodyweight. Lancet 2011, 378, 826–837. [Google Scholar] [CrossRef]
- Hall, K.D.; Butte, N.F.; Swinburn, B.A.; Chow, C.C. Dynamics of childhood growth and obesity: Development and validation of a quantitative mathematical model. Lancet Diabetes Endocrinol. 2013, 1, 97–105. [Google Scholar] [CrossRef]
- Ezzati, M.; Lopez, A.D.; Rodgers, A.; Murray, C.J. Comparative Quantification of Health Risks: Global and Regional Burden of Disease Attributable to Selected Major Risk Factors; World Health Organization: Geneva, Switzerland, 2004; pp. 1987–1997. [Google Scholar]
- Australian Institute of Health and Welfare. Health Expenditure Australia 2014–15. Health and Welfare Expenditure Series No. 57. Cat. No. HWE 67. 2016. Available online: http://www.aihw.gov.au/WorkArea/DownloadAsset.aspx?id=60129557188 (accessed on 26 February 2017).
- Brown, V.; Moodie, M.; Cobiac, L.; Mantilla Herrera, A.M.; Carter, R. Obesity-related health impacts of fuel excise taxation—An evidence review and cost-effectiveness study. BMC Public Health 2017, 17, 359. [Google Scholar] [CrossRef] [PubMed]
- EpiGear International Ersatz. Available online: http://www.epigear.com/index_files/ersatz.html (accessed on 10 March 2017).
- George, B.; Harris, A.; Mitchell, A. Cost-Effectiveness Analysis and the Consistency of Decision Making. PharmacoEconomics 2001, 19, 1103–1109. [Google Scholar] [CrossRef] [PubMed]
- Ananthapavan, J.; Sacks, G.; Moodie, M.; Carter, R. Economics of Obesity—Learning from the Past to Contribute to a Better Future. Int. J. Environ. Res. Public Health 2014, 11, 4007. [Google Scholar] [CrossRef] [PubMed]
- Vos, T.; Carter, R.; Barendregt, J.; Mihalopoulos, C.; Veerman, L.; Magnus, A.; Cobiac, L.; Bertram, M.; Wallace, A. Assessing Cost-Effectiveness in Prevention: ACE–Prevention September 2010 Final Report; University of Queensland: Brisbane, Australia, 2010. [Google Scholar]
- Veerman, J.L.; Sacks, G.; Antonopoulos, N.; Martin, J. The Impact of a Tax on Sugar-Sweetened Beverages on Health and Health Care Costs: A Modelling Study. PLoS ONE 2016, 11, e0151460. [Google Scholar] [CrossRef] [PubMed]
- Australian Department of Health. Healthy Food Partnership: Working Groups. 2016. Available online: http://www.health.gov.au/internet/main/publishing.nsf/Content/working-groups (accessed on 15 June 2017).
- Marcello, K. The New York City sugar-sweetened beverage portion cap rule: Lawfully regulating public enemy number one in the obesity epidemic. Conn. Law Rev. 2013, 46, 807. [Google Scholar]
- Neal, B.; Sacks, G.; Swinburn, B.; Vandevijvere, S.; Dunford, E.; Snowdon, W.; Webster, J.; Barquera, S.; Friel, S.; Hawkes, C. Monitoring the levels of important nutrients in the food supply. Obes. Rev. 2013, 14, 49–58. [Google Scholar] [CrossRef] [PubMed]
- Marteau, T.M.; Hollands, G.J.; Shemilt, I.; Jebb, S.A. Downsizing: Policy options to reduce portion sizes to help tackle obesity. BMJ 2015, 351, h5863. [Google Scholar] [CrossRef] [PubMed]


| Intervention: Package Size Cap on Single-Serve Sugar Sweetened Beverages (SSBs) | |
| Scenario A1 (base case) | Government imposes legislation banning the sale of single-serve, packaged SSBs greater than 375 mL. No compensatory eating |
| Scenario A2 | Government imposes legislation banning the sale of single-serve, packaged SSBs greater than 375 mL. 25% compensatory eating, for example, 25% of individuals continue to consume the same volume of SSB but in different formats (e.g., 3 × 200 mL) |
| Scenario A3 | Government imposes legislation banning the sale of single-serve, packaged SSBs greater than 375 mL. 10% of individuals substitute SSBs for equivalent single-serve portions (>375 mL) of sugar-free alternatives |
| Scenario A4 | Voluntary industry pledge to cease production of single-serve, packaged SSBs greater than 375 mL. No compensatory eating |
| Scenario A5 | Voluntary industry pledge to cease production of single-serve, packaged SSBs greater than 375 mL. 25% compensatory eating, for example, 25% of individuals continue to consume the same volume of SSB but in different formats (e.g., 3 × 200 mL) |
| Scenario A6 | Voluntary industry pledge to cease production of single-serve, packaged SSBs greater than 375 mL. 10% of individuals substitute SSBs for equivalent single-serve portions (>375 mL) of sugar-free alternatives |
| Intervention: Energy Reduction (Reformulation) of SSBs | |
| Scenario B1 (base case) | Government imposes legislation to reduce kJ/serve by 5% for all SSBs. No compensatory consumption |
| Scenario B2 | Government imposes legislation to reduce kJ/serve by 30% for all SSBs. No compensatory consumption |
| Scenario B3 | Voluntary industry pledge to reduce kJ/serve by 5% for all SSBs. No compensatory consumption |
| Scenario B4 | Voluntary industry pledge to reduce kJ/serve by 30% for all SSBs. No compensatory consumption |
| Parameter | Assumption | Rationale | Source |
|---|---|---|---|
| Government-implemented interventions | Government legislation and 100% adherence by food industry | The cost of legislation has been incorporated. Given that monitoring of non-compliance is relatively simple, it is assumed that there is 100% compliance by the food industry. | |
| Voluntary interventions | Assumed 20% adherence by food industry | Based on the Health Star Rating System Cost Benefit Analysis report | [30] |
| Latest estimates indicate 14.4% uptake rate of the voluntary Health Star Rating system in Australia | [31] | ||
| Consumption patterns | All age groups consume single-serve SSB unit sizes in the same proportion | Insufficient data to calculate differences in age and sex groups. | |
| Compensatory eating a—package size cap | Assumed 25% of individuals would still consume the same portion sizes (>375 mL) irrespective of the portion size cap Assumed 10% of individuals would swap to sugar-free alternatives in order to continue to consume the same portion sizes (>375 mL) | Consumer dietary recalls indicate that 27.3% of participants ate an additional snack outside of the workplace cafeteria where there was controlled portion restrictions | [32] |
| United States based modelling of the New York City ban on SSBs would affect 80% of consumer consumption behaviour | [33] | ||
| The 2011–2012 Australian Health Survey found that approximately 10% of individuals drink sugar-free (made with intense sweetener) beverages | [19] | ||
| No compensatory eating a—package size cap | Assumed that individuals that usually would consume >375 mL would move on to the next largest available portion size | Based on estimates in other modelling studies and interventions in controlled experimental settings | [32,33] |
| It is also assumed that individuals are unlikely to pay for multiple, smaller (<375 mL) single serve pack sizes of SSBs to compensate for their past consumption behaviour of >375 mL of SSBs | Single-serve portion sizes are typically consumed in the one setting | [34] | |
| No compensatory eating a—kilojoule reduction | Assumed individuals would not purchase multiple or increased volume of SSBs to compensate for kJ reduction | Research has indicated that it is unlikely people would consume more as the total volume remains the same | [35] |
| Costs—passing legislation | Assumed this cost would only occur once, in the first year of the intervention | [36] | |
| Costs—industry and NGO (marketing and promotion) | It is assumed these costs would only occur in the first 2 years during the “implementation phase” of the intervention | Once industry and NGO have completed the implementation of the new portion size, there is no further costs attributable to the intervention | [30] |
| Costs—government (promotion, education, enforcement and oversight/monitoring) | It is assumed that these costs will occur for the first 5 years of the intervention | Based on the Health Star Rating System Cost Benefit Analysis report | [30] |
| Kilojoule reduction | Assumed to be applied to all SSBs, not specific portion-sizes | If the food industry reformulated, they would reformulate the recipe for all portion sizes, it would be too costly and inconvenient to reformulate for a specific portion size only | |
| Kilojoule reduction—5% and 30% reduction targets | Assumed that these are reasonable and achievable targets for food industry to meet | Reductions in 5% and 30% of energy density across SSB have been self-reported by food manufacturers as a part of the Public Health Responsibility Deal’s Calorie Reduction Pledge | [17] |
| It is assumed that reduction in sugar content will be how food industry would meet this target | |||
| Sugar-free SSB alternatives | Assumed to have 0 kJ | No other macronutrients are present in SSBs that would contribute to energy density (kJ content) |
| Cost Description | Intended Payer of Cost | Values (AUD Million) | Distribution c | Sources and Assumptions |
|---|---|---|---|---|
| Cost of implementing new legislation a | Government | 1.0 (95% CI: 0.9–1.2) | Gamma | Most likely value based upon estimates by [36]. Assumed that this cost would only occur once. |
| Costs of administering, enforcing, promoting, educating, monitoring and overseeing the implementation of either the package size cap or energy reduction interventions b | Government | 12.3 (range: ±50%) | Pert | Estimate based on projected cost of implementing “Health Star Rating” front of pack labelling in Australia [30,42]. |
| Costs of labelling and packaging changes (design, materials, proofing), labour, ingredients, overhead and implementation costs (technical, scientific, executive, administrative) b | Food industry | 36.9 (range: ±50%) | Pert | Estimate based on projected cost of implementing “Health Star Rating” front of pack labelling in Australia [30,42]. |
| Costs of advocating, marketing and promoting either the package size cap or energy reduction interventions b | Non-government organisations | 5.5 (range: ±50%) | Pert | Estimate based on projected cost of implementing “Health Star Rating” front of pack labelling in Australia [30,42]. |
| Average Energy Intake (Baseline) (kJ/Day/person) | Average Consumption from SSBs before Intervention (kJ/Day/person) | Average Consumption from SSBs after Intervention (kJ/Day/Person) | Estimated Change in Energy in Response to Intervention (kJ/Day/Person) | Average Body Weight (kg) (Baseline) | Average Change in Weight in Response to Intervention (kg) | Average Change in BMI in Response to Intervention (kg/m2) | ||||||
|---|---|---|---|---|---|---|---|---|---|---|---|---|
| Package Size Intervention (Base Case) | Energy Reduction Intervention (Base Case) | Package Size Intervention (Base Case) | Energy Reduction Intervention (Base Case) | Package Size Intervention (Base Case) | Energy Reduction Intervention (Base Case) | Package Size Intervention (Base Case) | Energy Reduction Intervention (Base Case) | |||||
| Aged 2–12 | Male | 8140.3 | 466.6 | 454.7 | 443.2 | −11.9 | −23.3 | 38.5 | −0.06 | −0.12 | −0.04 | −0.07 |
| Female | 7137.4 | 426.9 | 416.1 | 405.6 | −10.9 | −21.4 | 38.4 | −0.06 | −0.12 | −0.04 | −0.08 | |
| Aged 13–19 | Male | 10,771.7 | 687.0 | 669.5 | 659.0 | −17.5 | −29.0 | 90.4 | −0.15 | −0.24 | −0.05 | −0.08 |
| Female | 8260.6 | 600.8 | 585.5 | 570.7 | −15.3 | −30.0 | 77.6 | −0.15 | −0.29 | −0.05 | −0.11 | |
| Aged ≥ 20 | Male | 10,308.0 | 684.8 | 667.3 | 650.5 | −17.5 | −34.4 | 103.1 | −0.17 | −0.34 | −0.06 | −0.11 |
| Female | 7841.2 | 557.6 | 543.4 | 529.7 | −14.2 | −27.9 | 78.4 | −0.14 | −0.28 | −0.05 | −0.11 | |
| Total population | 8664.8 | 564.4 | 550.0 | 536.8 | −14.4 | −27.6 | 71.1 | −0.12 | −0.23 | −0.05 | −0.10 | |
| Package Size Cap Intervention | Energy Reduction Intervention | |||||||||
|---|---|---|---|---|---|---|---|---|---|---|
| Scenario A1 (Base Case) | Scenario A2 | Scenario A3 | Scenario A4 | Scenario A5 | Scenario A6 | Scenario B1 (Base Case) | Scenario B2 | Scenario B3 | Scenario B4 | |
| Average HALYs gained (95% UI) | 73,883 (57,038; 96,264) | 55,581 (42,240; 72,671) | 348,236 (267,567; 455,788) | 14,781 (11,260; 19,170) | 11,043 (8389; 14,670) | 289,045 (220,900; 379,533) | 144,621 (109,050; 189,848) | 822,835 (641,097; 1,050,183) | 28,981 (21,884; 37,976) | 173,410 (131,057; 226,732) |
| Total intervention costs (AUD; 95% UI) | 209.7 M (147.7; 272.9) | 209.7 M (147.7; 272.9) | 209.7 M (147.7; 272.9) | 44.5 M (31.4; 57.5) | 44.5 M (31.4; 57.5) | 44.5 M (31.4; 57.5) | 209.7 M (147.7; 272.9) | 209.7 M (147.7; 272.9) | 44.5 M (31.4; 57.5) | 44.5 M (31.4; 57.5) |
| Total cost-offsets (AUD; 95% UI) b | −750.9 M (−991.4; −555.7) | −556.6 M (−762.3; −422.1) | −3.5B (−4.8; −2.6) | −150.5 M (−201.3; −111.9) | −112.9 M (−151.2; −84.3) | −2.9B (−3.9; −2.2) | −1.5 B (−1.9; −1.1) | −8.3 B (−10.8; −6.4) | −295.0 M (−390.8; −217.3) | −1.8 B (−2.4; −1.3) |
| Net costs (AUD; 95% UI) b | −540.9 M (−792.5; −340.9) | −356.9 M (−564.2; −194.8) | −3.3B (−4.5; −2.4) | −106.1 M (−159.8; −66.0) | −68.4 M (−108.3; −36.2) | −2.8B (−3.8; −2.2) | −1.3 B (−1.7 B; −868.8 M) | −8.1 B (−10.6; −6.2) | −250.6 M (−346.8; −217.3) | −1.7 B (−2.3; 1.3) |
© 2017 by the authors. Licensee MDPI, Basel, Switzerland. This article is an open access article distributed under the terms and conditions of the Creative Commons Attribution (CC BY) license (http://creativecommons.org/licenses/by/4.0/).
Share and Cite
Crino, M.; Herrera, A.M.M.; Ananthapavan, J.; Wu, J.H.Y.; Neal, B.; Lee, Y.Y.; Zheng, M.; Lal, A.; Sacks, G. Modelled Cost-Effectiveness of a Package Size Cap and a Kilojoule Reduction Intervention to Reduce Energy Intake from Sugar-Sweetened Beverages in Australia. Nutrients 2017, 9, 983. https://doi.org/10.3390/nu9090983
Crino M, Herrera AMM, Ananthapavan J, Wu JHY, Neal B, Lee YY, Zheng M, Lal A, Sacks G. Modelled Cost-Effectiveness of a Package Size Cap and a Kilojoule Reduction Intervention to Reduce Energy Intake from Sugar-Sweetened Beverages in Australia. Nutrients. 2017; 9(9):983. https://doi.org/10.3390/nu9090983
Chicago/Turabian StyleCrino, Michelle, Ana Maria Mantilla Herrera, Jaithri Ananthapavan, Jason H. Y. Wu, Bruce Neal, Yong Yi Lee, Miaobing Zheng, Anita Lal, and Gary Sacks. 2017. "Modelled Cost-Effectiveness of a Package Size Cap and a Kilojoule Reduction Intervention to Reduce Energy Intake from Sugar-Sweetened Beverages in Australia" Nutrients 9, no. 9: 983. https://doi.org/10.3390/nu9090983
APA StyleCrino, M., Herrera, A. M. M., Ananthapavan, J., Wu, J. H. Y., Neal, B., Lee, Y. Y., Zheng, M., Lal, A., & Sacks, G. (2017). Modelled Cost-Effectiveness of a Package Size Cap and a Kilojoule Reduction Intervention to Reduce Energy Intake from Sugar-Sweetened Beverages in Australia. Nutrients, 9(9), 983. https://doi.org/10.3390/nu9090983