What Is Nutritious Snack Food? A Comparison of Expert and Layperson Assessments


Abstract
1. Introduction
2. Material and Methods
2.1. Snack Selection
2.2. Survey and Data Collection
2.3. Expert Participant Survey
2.4. Lay Participant Survey
2.5. Nutrient Profile Models
2.6. Data Analysis
3. Results
3.1. Participant Characteristics
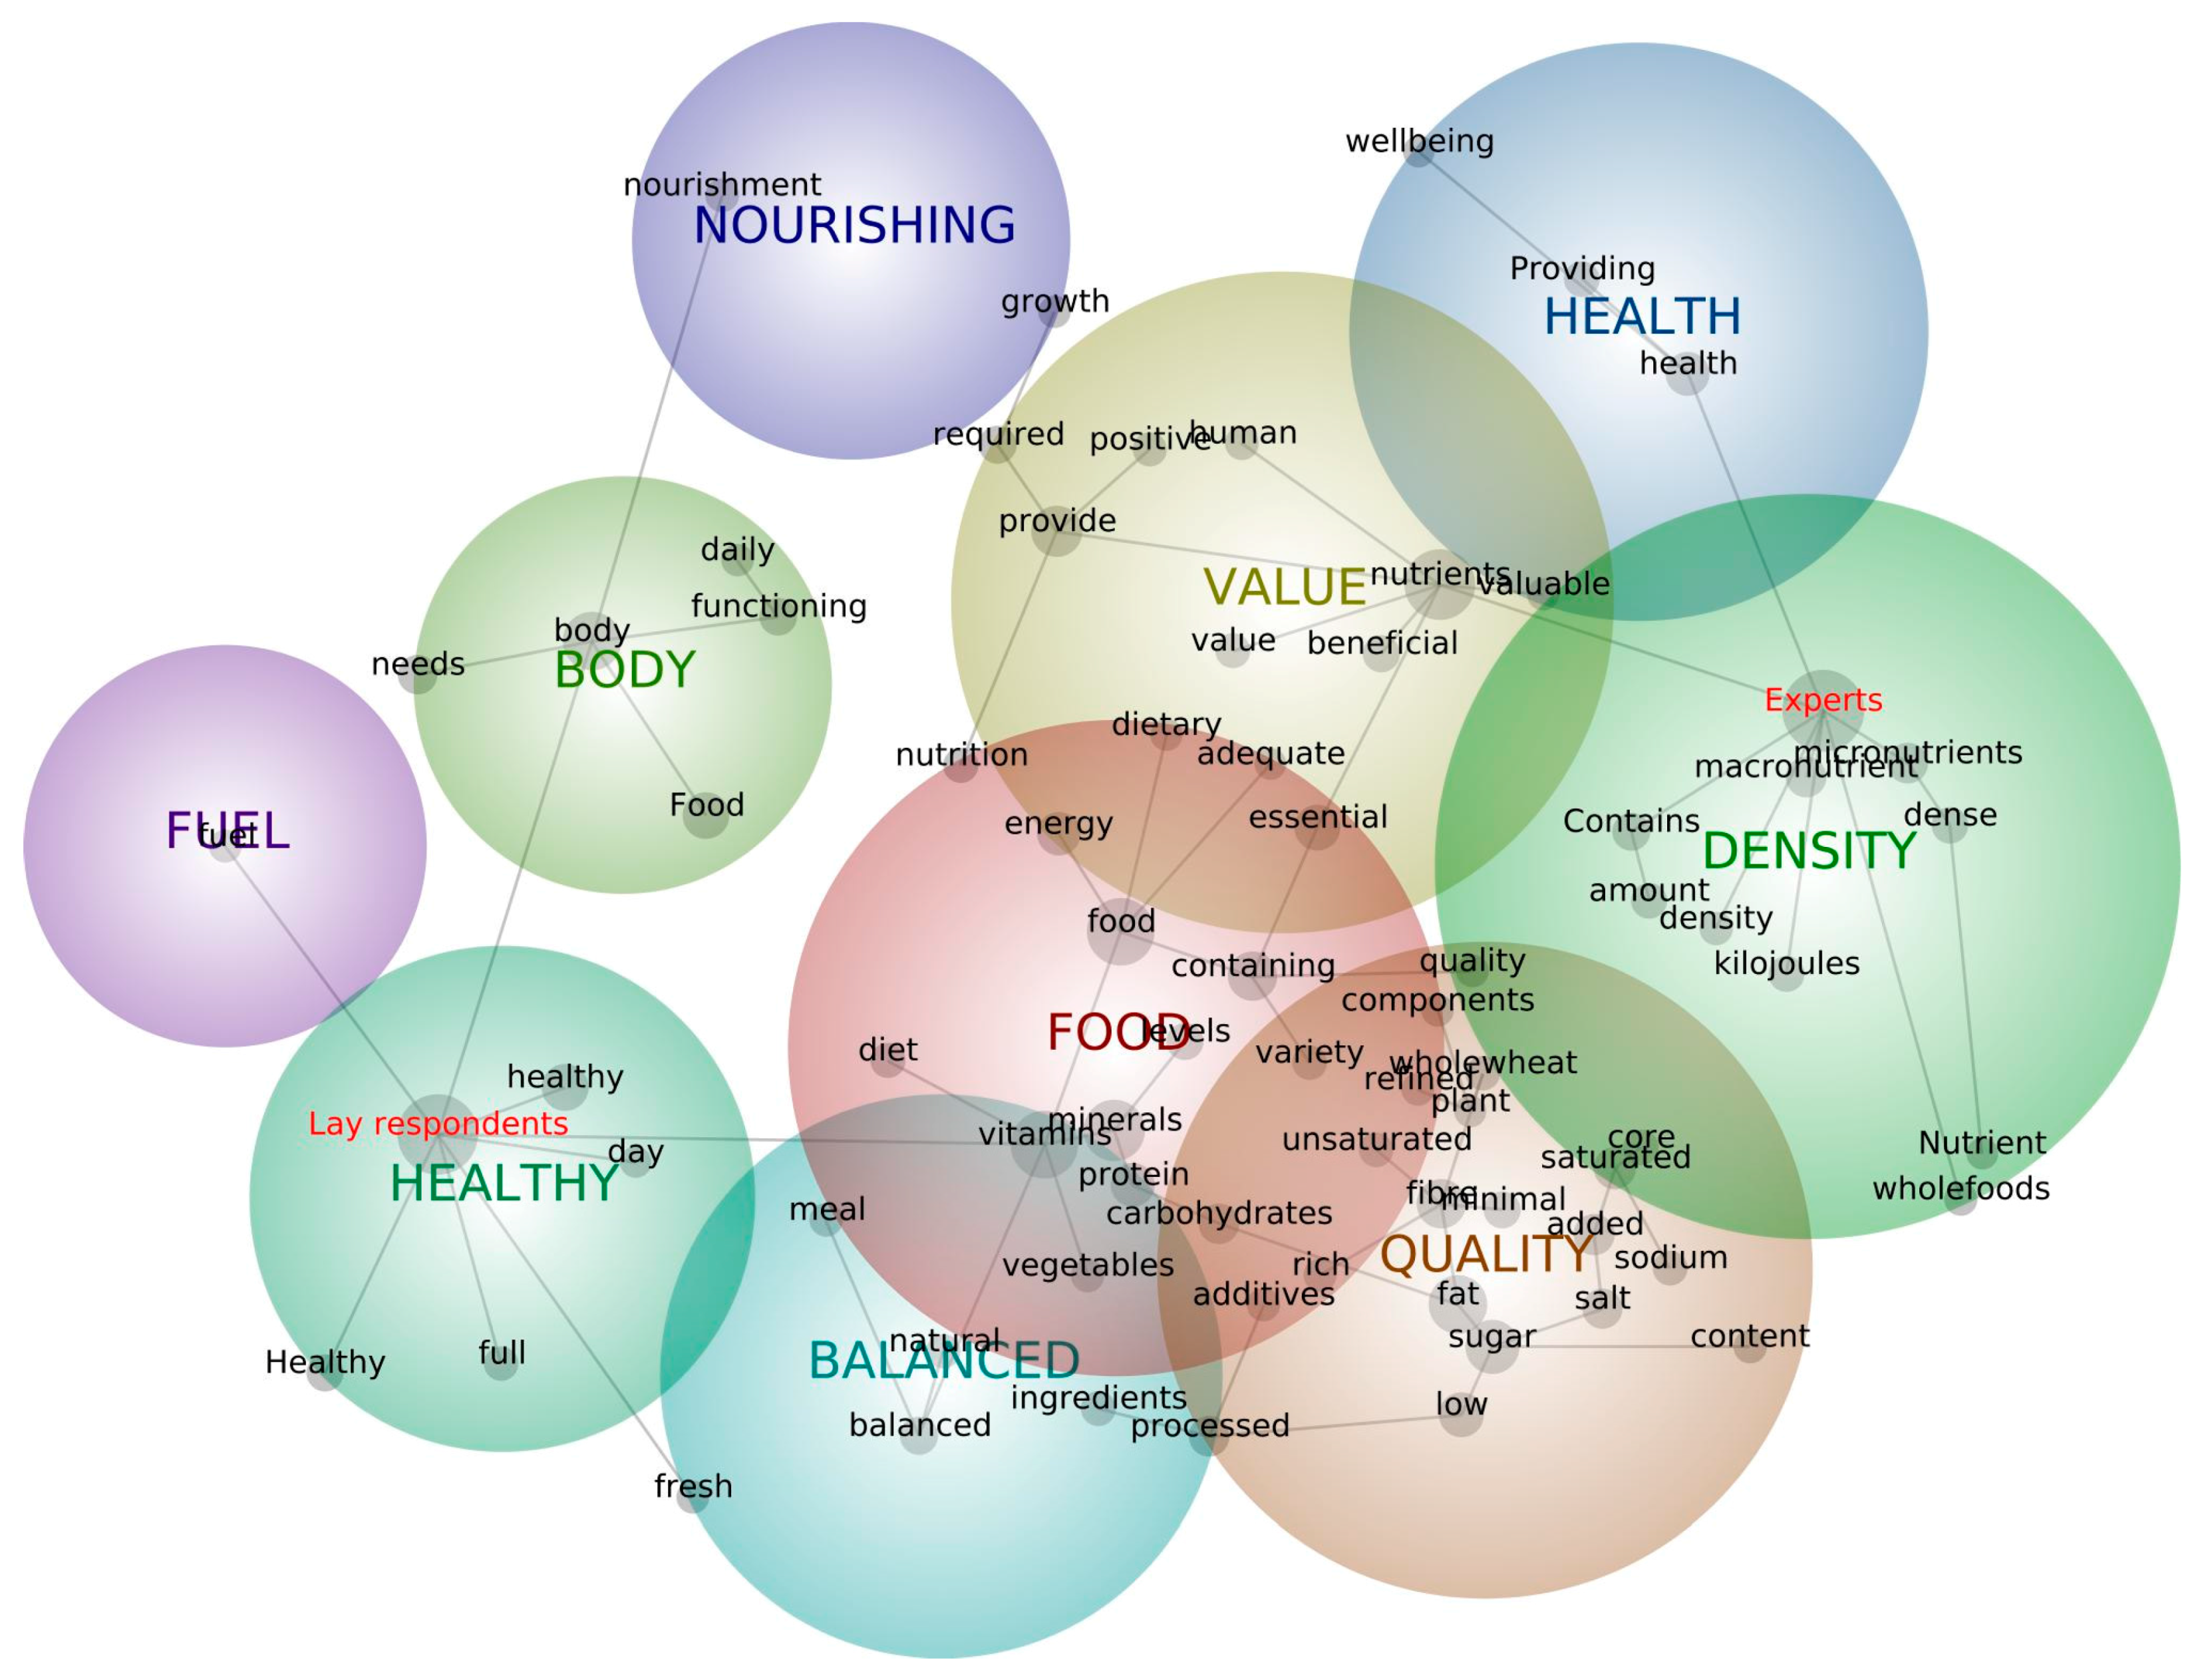
3.2. Definition of “Nutritious”
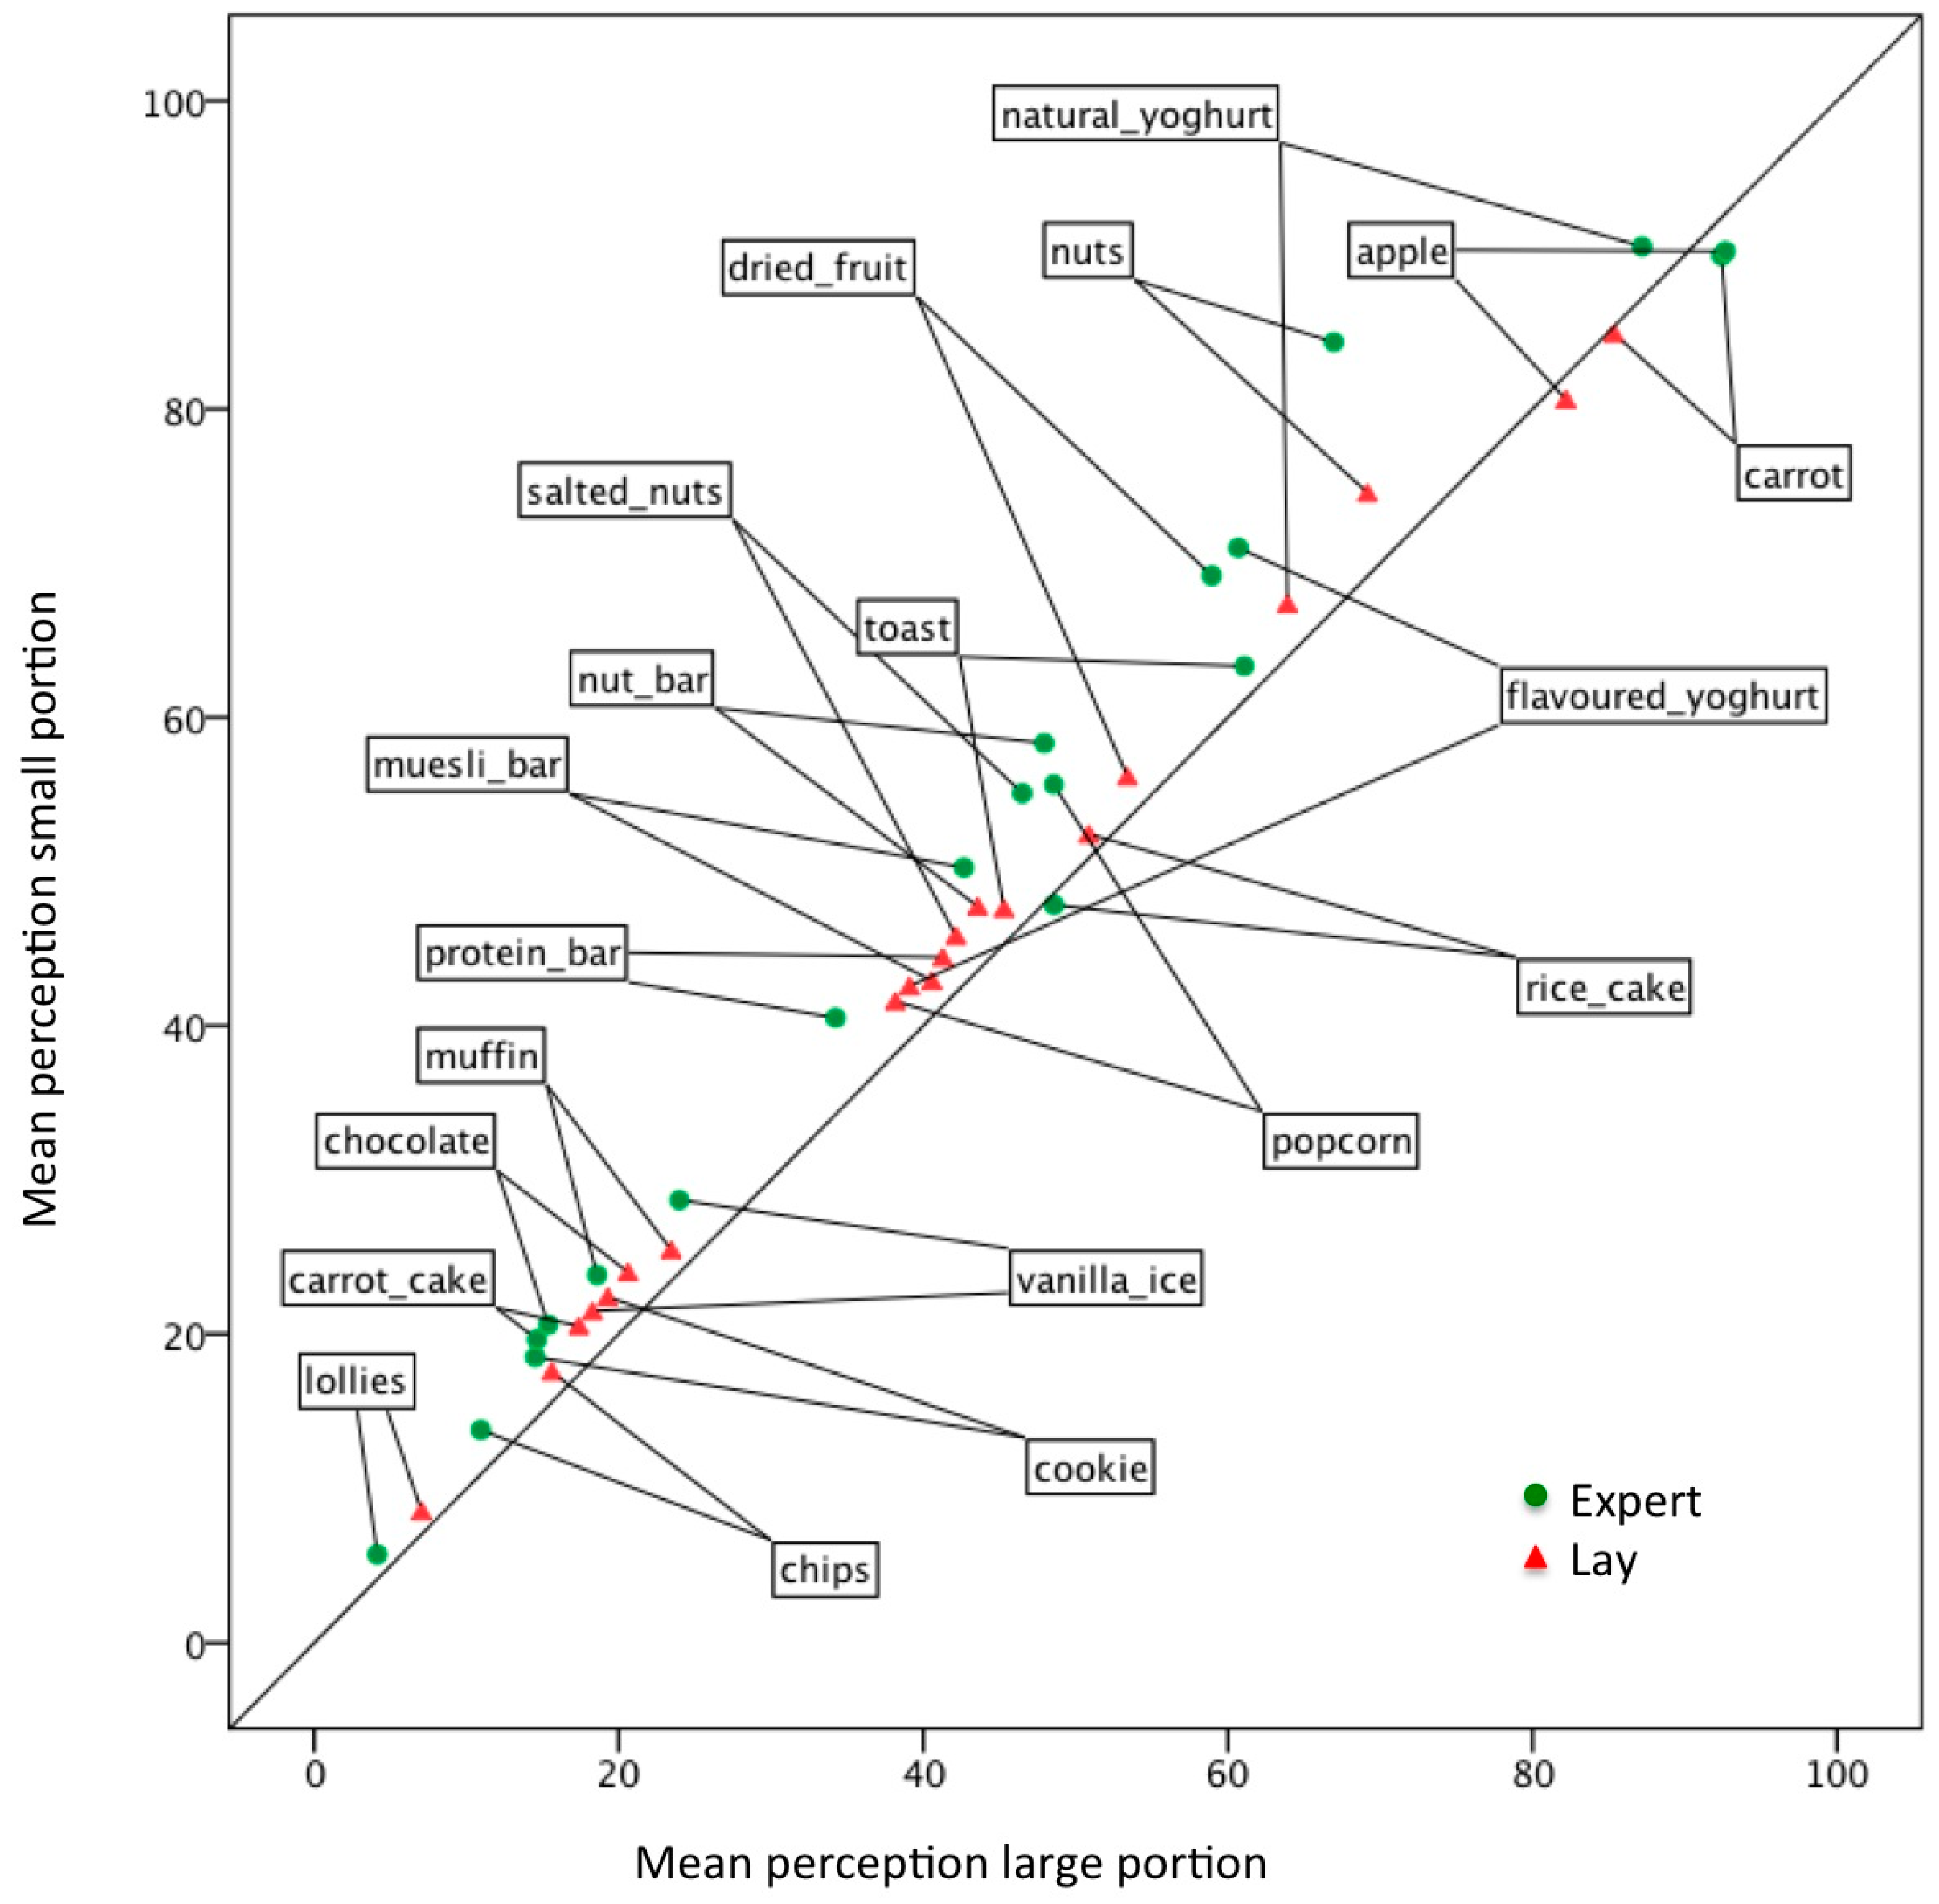
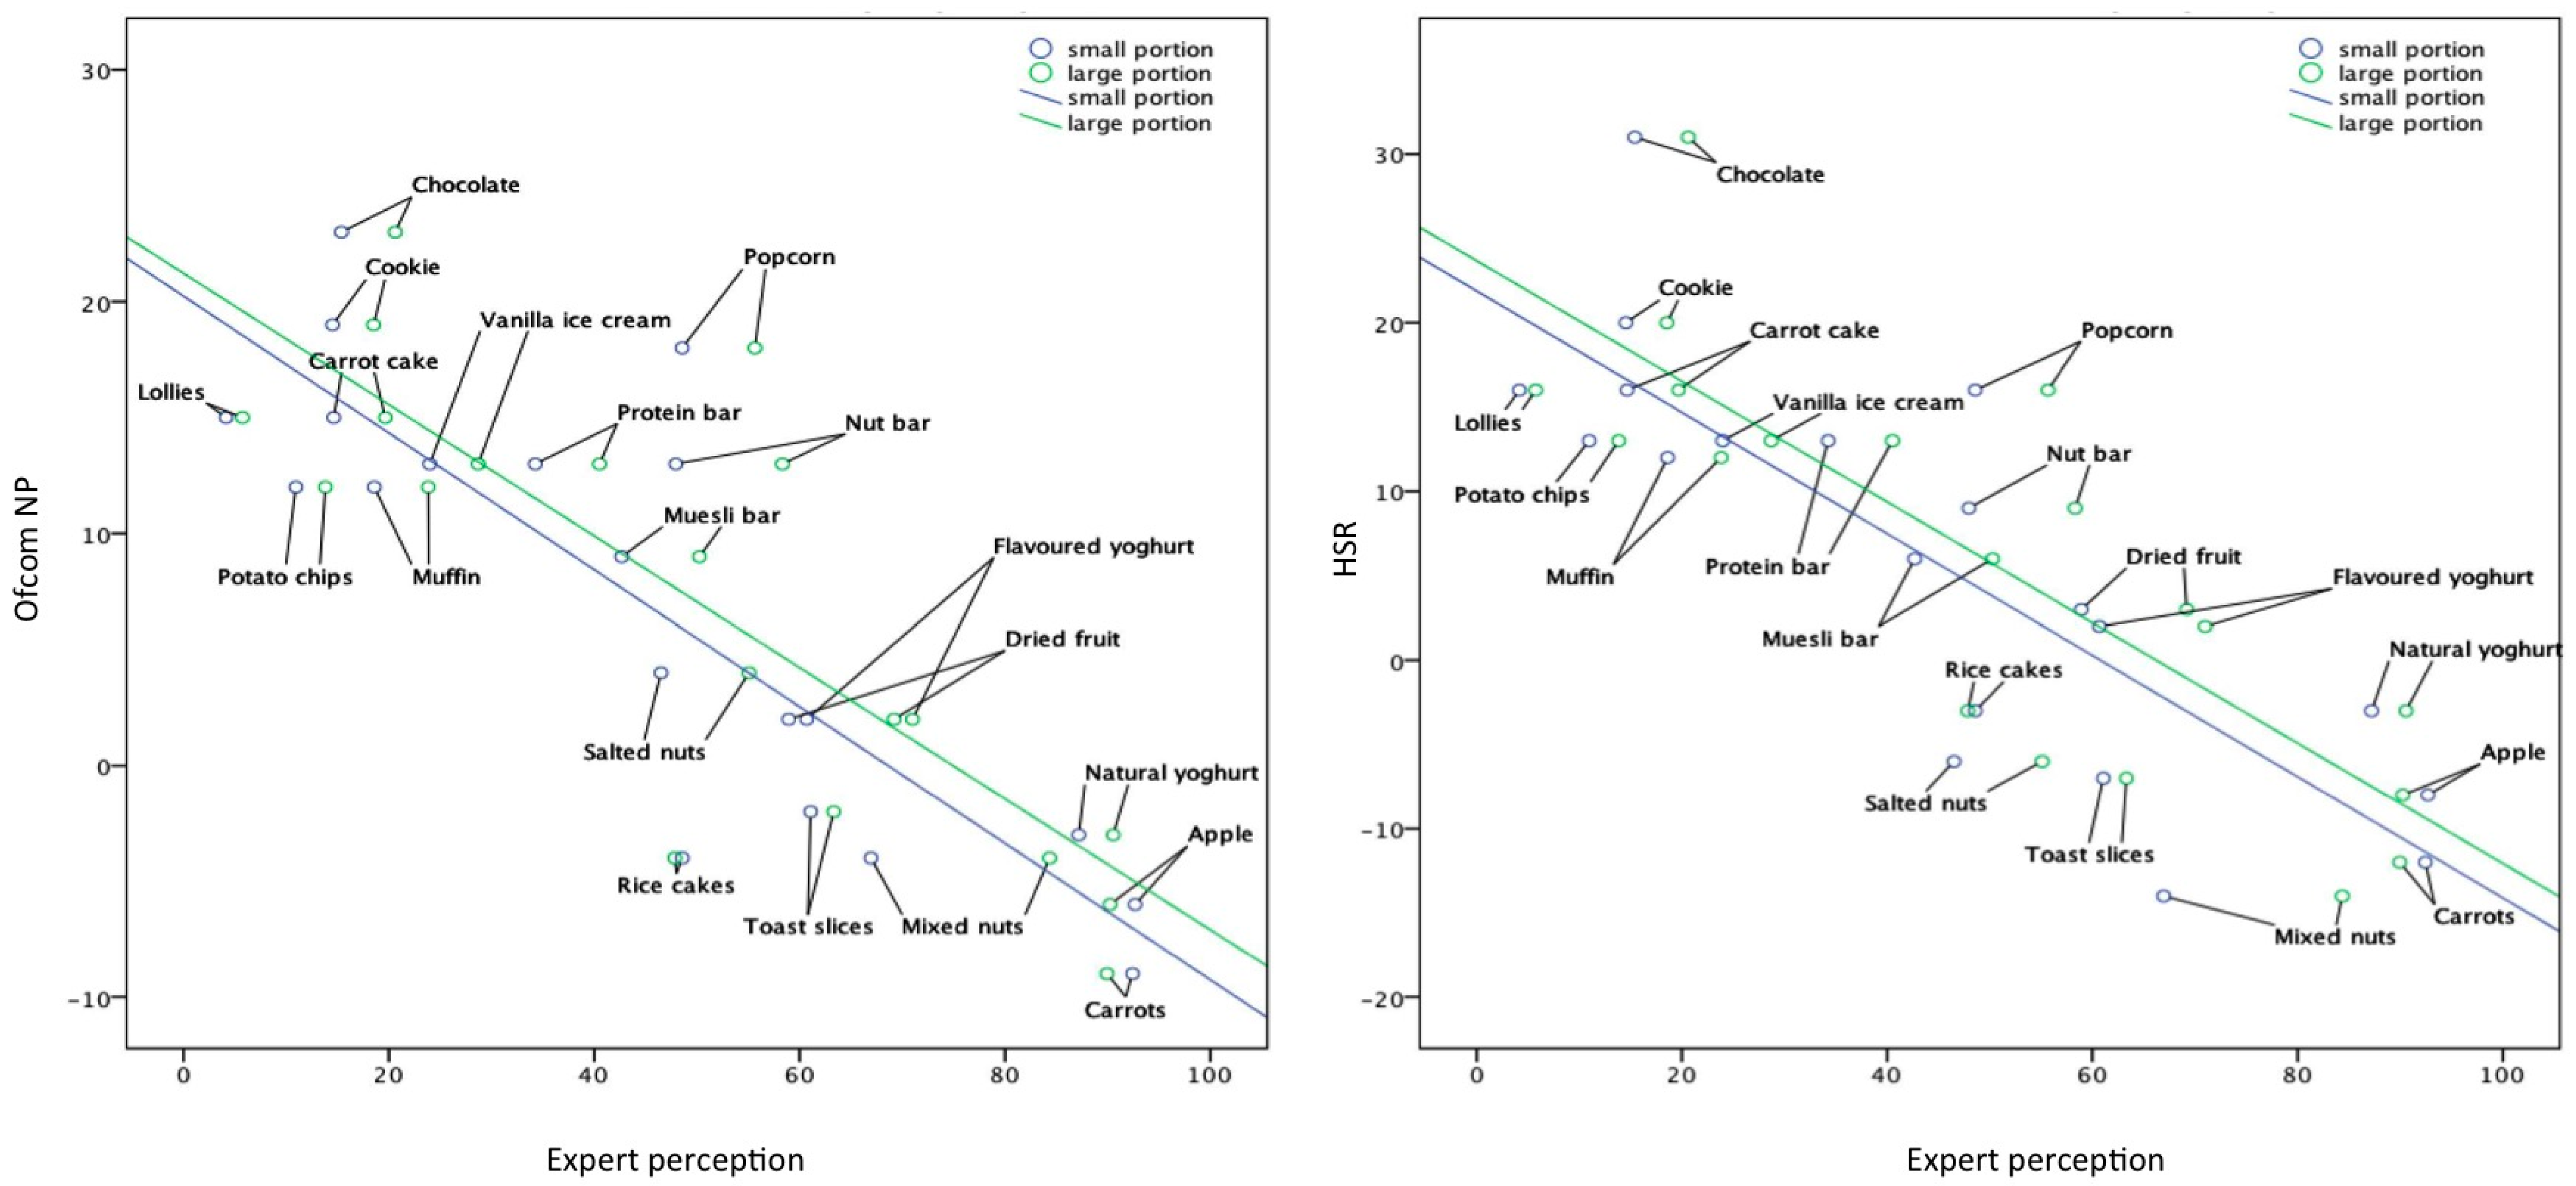
3.3. Evaluation of the Nutritiousness of Snacks
4. Discussion
5. Conclusions
Acknowledgments
Financial Support
Author Contributions
Conflicts of Interest
Appendix A

| Snack | AUSNUT Food ID | Small Portion (g) | Large Portion (g) | Energy (kJ/100 g) | Saturated Fat (g/100 g) | Total Sugar (g/100 g) | Sodium (mg/100 g) | Fruit, Vegetable and Nuts (%) | Fiber (g/100 g) | Protein (g/100 g) | HSR | Health Stars | Ofcom NP Score | Ofcom Category |
|---|---|---|---|---|---|---|---|---|---|---|---|---|---|---|
| Carrot | 13A11671 | 80 | 160 | 133 | 0 | 5 | 38 | 100 | 4 | 0.8 | −12 | ★★★★★ | −9 | healthy |
| Apple | 06D10559 | 90 | 180 | 239 | 0 | 11.9 | 1 | 100 | 2.3 | 0.3 | −8 | ★★★★✧ | −6 | healthy |
| Rice cake | 02C10116 | 25 | 50 | 1683 | 0.62 | 0.3 | 118 | 0 | 4.4 | 8.6 | −3 | ★★★★ | −4 | healthy |
| Mixed nuts | 11B10240 | 40 | 80 | 2642 | 4.03 | 3.9 | 4 | 100 | 7.6 | 19 | −14 | ★★★★★ | −4 | healthy |
| Natural yoghurt | 09C20042 | 120 | 240 | 241 | 0.19 | 5.9 | 84 | 0 | 0 | 6.6 | −3 | ★★★★★ | −3 | healthy |
| Toast slice | 02B10754 | 25 | 50 | 1247 | 0.79 | 2.3 | 520 | 0 | 7.4 | 13.2 | −7 | ★★★★✧ | −2 | healthy |
| Dried fruit | 06E10091 | 30 | 60 | 1247 | 0.08 | 68.5 | 78 | 100 | 5.6 | 2 | 3 | ★★★ | 2 | healthy |
| Flavoured yoghurt | 09C10095 | 120 | 240 | 401 | 2 | 11.6 | 60 | 20 | 0.1 | 4.7 | 2 | ★★★ | 2 | healthy |
| Peanuts (roasted, salted) | 11B10201 | 30 | 60 | 2667 | 9.18 | 4.4 | 335 | 100 | 6.2 | 25.1 | −6 | ★★★★ | 4 | less healthy |
| Muesli bar | 12C10415 | 25 | 50 | 1713 | 3.42 | 23.6 | 128 | 20 | 7.7 | 6.3 | 6 | ★★★ | 9 | less healthy |
| Muffin | 02E10477 | 90 | 180 | 1516 | 1.84 | 25.9 | 343 | 10 | 1.4 | 4.8 | 12 | ★★ | 12 | less healthy |
| Potato chips | 10D10155 | 25 | 50 | 2233 | 6.8 | 2.2 | 415 | 0 | 3.5 | 4.7 | 13 | ★★ | 12 | less healthy |
| Nut bar | 12C10531 | 30 | 60 | 2248 | 10.57 | 20.7 | 21 | 70 | 8.4 | 15.7 | 9 | ★★✧ | 13 | less healthy |
| Protein bar | 02C20379 | 30 | 60 | 1811 | 6.97 | 9 | 203 | 0 | 1.4 | 34.2 | 13 | ★★ | 13 | less healthy |
| Ice cream | 09D10212 | 40 | 80 | 788 | 7.16 | 18.4 | 48 | 0 | 0 | 3.7 | 13 | ★★ | 13 | less healthy |
| Lollies | 12C10423 | 50 | 100 | 1350 | 0 | 50.6 | 110 | 0 | 0 | 5.3 | 16 | ★✧ | 15 | less healthy |
| Carrot cake | 02E10440 | 100 | 200 | 1582 | 4.02 | 30 | 336 | 10 | 1.5 | 4.3 | 16 | ★✧ | 15 | less healthy |
| Popcorn | 10D10135 | 20 | 40 | 2115 | 12.6 | 0.6 | 645 | 0 | 8.5 | 9.1 | 16 | ★✧ | 18 | less healthy |
| Chocolate biscuits | 02C20284 | 25 | 50 | 1841 | 8.38 | 23.9 | 308 | 0 | 1.9 | 6.2 | 20 | ★✧ | 19 | less healthy |
| Chocolate | 12C10407 | 20 | 40 | 2206 | 18.76 | 54.6 | 68 | 0 | 2.3 | 7.6 | 31 | ✧ | 23 | less healthy |

References
- Wirt, A.; Collins, C.E. Diet quality—What is it and does it matter? Public Health Nutr. 2009, 12, 2473–2492. [Google Scholar] [CrossRef] [PubMed]
- Schwingshackl, L.; Hoffmann, G. Diet quality as assessed by the healthy eating index, the alternate healthy eating index, the dietary approaches to stop hypertension score, and health outcomes: A systematic review and meta-analysis of cohort studies. J. Acad. Nutr. Diet. 2015, 115, 780.e5–800.e5. [Google Scholar] [CrossRef] [PubMed]
- Potter, J.; Brown, L.; Williams, R.L.; Byles, J.; Collins, C.E. Diet quality and cancer outcomes in adults: A systematic review of epidemiological studies. Int. J. Mol. Sci. 2016, 17, 1052. [Google Scholar] [CrossRef] [PubMed]
- Wansink, B. Mindless Eating: Why We Eat More than We Think; Bantam: New York, NY, USA, 2007. [Google Scholar]
- Rozin, P.; Ashmore, M.; Markwith, M. Lay american conceptions of nutrition: Dose insensitivity, categorical thinking, contagion, and the monotonic mind. Health Psychol. 1996, 15, 438–447. [Google Scholar] [CrossRef] [PubMed]
- Grunert, K.G.; Scholderer, J.; Rogeaux, M. Determinants of consumer understanding of health claims. Appetite 2011, 56, 269–277. [Google Scholar] [CrossRef] [PubMed]
- Lahteenmaki, L. Claiming health in food products. Food Qual. Prefer. 2013, 27, 196–201. [Google Scholar] [CrossRef]
- Hieke, S.; Kuljanic, N.; Wills, J.M.; Pravst, I.; Kaur, A.; Raats, M.M.; van Trijp, H.C.; Verbeke, W.; Grunert, K.G. The role of health-related claims and health-related symbols in consumer behaviour: Design and conceptual framework of the clymbol project and initial results. Nutr. Bull. 2015, 40, 66–72. [Google Scholar] [CrossRef] [PubMed]
- Klepacz, N.A.; Nash, R.A.; Egan, M.B.; Hodgkins, C.E.; Raats, M.M. When is an image a health claim? A false-recollection method to detect implicit inferences about products’ health benefits. Health Psychol. 2016, 35, 898–907. [Google Scholar] [CrossRef] [PubMed]
- FDA. Guidance for Industry: A Food Labering Guide. Available online: http://www.fda.gov/Food/GuidanceRegulation/GuidanceDocumentsRegulatoryInformation/LabelingNutrition/ucm064908.htm (accessed on 7 November 2016).
- CNN. ‘Natural’ and Other Food Labels That Sound Legitimate But May not Be. Available online: http://edition.cnn.com/2015/05/18/health/natural-food-labels/ (accessed on 7 November 2016).
- Drewnowski, A. Concept of a nutritious food: Toward a nutrient density score. Am. J. Clin. Nutr. 2005, 82, 721–732. [Google Scholar] [PubMed]
- Hughes, C.; Wellard, L.; Lin, J.; Suen, K.L.; Chapman, K. Regulating health claims on food labels using nutrient profiling: What will the proposed standard mean in the australian supermarket? Public Health Nutr. 2013, 16, 2154–2161. [Google Scholar] [CrossRef] [PubMed]
- Kelly, B.; Hattersley, L.; King, L.; Flood, V. Smoke and mirrors: Nutrition content claims used to market unhealthy food. Nutr. Diet. 2009, 66, 62–64. [Google Scholar]
- Williams, P.; Yeatman, H.; Ridges, L.; Houston, A.; Rafferty, J.; Ridges, A.; Roesler, L.; Sobierajski, M.; Spratt, B. Nutrition function, health and related claims on packaged australian food products—Prevalence and compliance with regulations. Asia Pac. J. Clin. Nutr. 2006, 15, 10–20. [Google Scholar] [PubMed]
- Nicklas, T.A.; Drewnowski, A.; O’Neil, C.E. The nutrient density approach to healthy eating: Challenges and opportunities. Public Health Nutr. 2014, 17, 2626–2636. [Google Scholar] [CrossRef] [PubMed]
- Rayner, M.; Scarborough, P.; Lobstein, T. The UK Ofcom Nutrient Profiling Model. Defining ‘Healthy’ and ‘Unhealthy’ Foods and Drinks for TV Advertising to Children; University of Oxford: Oxford, UK, 2009. [Google Scholar]
- Commonwealth of Australia. The Health Star Rating. Available online: http://healthstarrating.gov.au/internet/healthstarrating/publishing.nsf/content/home (accessed on 29 December 2016).
- Scarborough, P.; Boxer, A.; Rayner, M.; Stockley, L. Testing nutrient profile models using data from a survey of nutrition professionals. Public Health Nutr. 2007, 10, 337–345. [Google Scholar] [CrossRef] [PubMed]
- Scarborough, P.; Rayner, M.; Stockley, L. Developing nutrient profile models: A systematic approach. Public Health Nutr. 2007, 10, 330–336. [Google Scholar] [CrossRef] [PubMed]
- Martin, J.M.; Beshears, J.; Milkman, K.L.; Bazerman, M.H.; Sutherland, L.A. Modeling expert opinions on food healthfulness: A nutrition metric. J. Am. Diet. Assoc. 2009, 109, 1088–1091. [Google Scholar] [CrossRef] [PubMed]
- Azais-Braesco, V.; Goffi, C.; Labouze, E. Nutrient profiling: Comparison and critical analysis of existing systems. Public Health Nutr. 2006, 9, 613–622. [Google Scholar] [CrossRef] [PubMed]
- Worsley, A. Nutrition knowledge and food consumption: Can nutrition knowledge change food behaviour? Asia Pac. J. Clin. Nutr. 2002, 11, S579–S585. [Google Scholar] [CrossRef] [PubMed]
- Rizk, M.T.; Treat, T.A. Perceptions of food healthiness among free-living women. Appetite 2015, 95, 390–398. [Google Scholar] [CrossRef] [PubMed]
- Bucher, T.; Müller, B.; Siegrist, M. What is healthy food? Objective nutrient profile scores and subjective lay evaluations in comparison. Appetite 2015, 95, 408–414. [Google Scholar] [CrossRef] [PubMed]
- Bucher, T.; Siegrist, M. Children’s and parents’ health perception of different soft drinks. Br. J. Nutr. 2015, 113, 526–535. [Google Scholar] [CrossRef] [PubMed]
- Bucher, T.; Collins, C.; Diem, S.; Siegrist, M. Adolescents’ perception of the healthiness of snacks. Food Qual. Prefer. 2016, 50, 94–101. [Google Scholar] [CrossRef]
- Piernas, C.; Popkin, B.M. Snacking increased among U.S. Adults between 1977 and 2006. J. Nutr. 2010, 140, 325–332. [Google Scholar] [CrossRef] [PubMed]
- Kant, A.K.; Graubard, B.I. 40-year trends in meal and snack eating behaviors of american adults. J. Acad. Nutr. Diet. 2015, 115, 50–63. [Google Scholar] [CrossRef] [PubMed]
- McCabe, M. Aussies Go Bananas for Bananas. Available online: http://www.nielsen.com/au/en/insights/news/2014/aussies-go-bananas-for-bananas.html (accessed on 28 November 2016).
- Australian Bureau of Statistics. Australian Health Survey: Updated Results, 2011–2012. Available online: http://www.abs.gov.au/ausstats/abs@.nsf/Lookup/C549D4433F6B74D7CA257B8200179569 (accessed on 22 January 2017).
- Dietitians Association of Australia (DAA). Dietitians Association of Australia. Available online: http://daa.asn.au/ (accessed on 19 December 2016).
- Motteli, S.; Barbey, J.; Keller, C.; Bucher, T.; Siegrist, M. Measuring practical knowledge about balanced meals: Development and validation of the brief pkb-7 scale. Eur. J. Clin. Nutr. 2016, 70, 505–510. [Google Scholar] [CrossRef] [PubMed]
- Mötteli, S.; Barbey, J.; Keller, C.; Bucher, T.; Siegrist, M. Development and validation of a brief instrument to measure knowledge about the energy content of meals. J. Nutr. Educ. Behav. 2017, 49, 257.e1–263.e1. [Google Scholar] [CrossRef] [PubMed]
- Arambepola, C.; Scarborough, P.; Rayner, M. Validating a nutrient profile model. Public Health Nutr. 2008, 11, 371–378. [Google Scholar] [CrossRef] [PubMed]
- Bell, E.; Seidel, B.M. The evidence-policy divide: A ‘critical computational linguistics’ approach to the language of 18 health agency ceos from 9 countries. BMC Public Health 2012, 12, 932. [Google Scholar] [CrossRef] [PubMed]
- Hartmann, C.; Keller, C.; Siegrist, M. Compensatory beliefs, nutrition knowledge and eating styles of users and non-users of meal replacement products. Appetite 2016, 105, 775–781. [Google Scholar] [CrossRef] [PubMed]
- De Vlieger, N.M.; Collins, C.; Bucher, T. What is a nutritious snack? Level of processing and macronutrient content influences young adults’ perceptions. Appetite 2017, 114, 55–63. [Google Scholar] [CrossRef] [PubMed]
- Bucher, T.; Rollo, M.E.; Smith, S.P.; Dean, M.; Brown, H.; Sun, M.; Collins, C. Position paper on the need for portion-size education and a standardised unit of measurement. Health Promot. J. Austr. 2016. [Google Scholar] [CrossRef] [PubMed]


| Expert (n = 206) | Lay (n = 269) | |||||
|---|---|---|---|---|---|---|
| Word | Frequency (n) | % | Word | Frequency (n) | % | |
| 1 | nutrient | 115 | 55.6 | body | 100 | 37.0 |
| 2 | provide | 73 | 35.3 | healthy | 96 | 35.6 |
| 3 | fat | 49 | 23.7 | nutrient | 73 | 27.0 |
| 4 | contain | 49 | 23.7 | vitamin | 73 | 27.0 |
| 5 | health | 48 | 23.2 | good | 62 | 23.0 |
| 6 | vitamin | 46 | 22.2 | mineral | 53 | 19.6 |
| 7 | mineral | 43 | 20.8 | provide | 43 | 15.9 |
| 8 | micronutrient | 38 | 18.4 | fat | 36 | 13.3 |
| 9 | fibre | 38 | 18.4 | contain | 36 | 13.3 |
| 10 | good | 36 | 17.4 | sugar | 29 | 10.7 |
| 11 | sugar | 36 | 17.4 | energy | 25 | 9.3 |
| 12 | body | 35 | 16.9 | full | 23 | 8.5 |
| 13 | macronutrient | 34 | 16.4 | protein | 23 | 8.5 |
| 14 | essential | 29 | 14.0 | health | 22 | 8.1 |
| 15 | sodium/salt | 29 | 14.0 | need | 22 | 8.1 |
| 16 | energy | 27 | 13.0 | essential | 21 | 7.8 |
| 17 | healthy | 26 | 12.6 | processed | 19 | 7.0 |
| 18 | dense | 25 | 12.1 | function | 18 | 6.7 |
| 19 | saturated | 23 | 11.1 | fibre | 17 | 6.3 |
| 20 | added | 22 | 10.6 | fresh | 15 | 5.6 |
| 21 | kilojoule | 17 | 8.2 | ingredient | 14 | 5.2 |
| 22 | amount | 15 | 7.2 | beneficial | 14 | 5.2 |
| 23 | protein | 15 | 7.2 | require | 14 | 5.2 |
| 24 | beneficial | 14 | 6.8 | diet | 13 | 4.8 |
| 25 | food group | 13 | 6.3 | fuel | 13 | 4.8 |
| HSR Score | Ofcom NP | Expert Evaluation | Lay Evaluation | ||||
|---|---|---|---|---|---|---|---|
| Small Portion | Large Portion | Small Portion | Large Portion | ||||
| HSR score | 1 | 0.955 ** | −0.847 ** | −0.805 ** | −0.854 ** | −0.843 ** | |
| Ofcom NP | 0.955 ** | 1 | −0.824 ** | −0.759 ** | −0.824 ** | −0.812 ** | |
| Expert evaluation | small portion | −0.847 ** | −0.824 ** | 1 | 0.974 ** | 0.923 ** | 0.916 ** |
| large portion | −0.805 ** | −0.759 ** | 0.974 ** | 1 | 0.893 ** | 0.892 ** | |
| Lay evaluation | small portion | −0.854 ** | −0.824 ** | 0.923 ** | 0.893 ** | 1 | 0.998 ** |
| large portion | −0.843 ** | −0.812 ** | 0.916 ** | 0.892 ** | 0.998 ** | 1 | |
| Snack | Portion Size (g) | Expert Perception | Lay Participant Perception | Difference between | HSR | Ofcom NP | ||
|---|---|---|---|---|---|---|---|---|
| Mean | SD | Mean | SD | Evaluations | ||||
| Carrots | 160 | 92.0 | 14.5 | 85.0 | 16.3 | 7.0 * | −12 | −9 |
| 80 | 89.4 | 17.4 | 84.3 | 18.3 | 5.1 * | |||
| Apple | 180 | 92.2 | 11.4 | 81.6 | 15.3 | 10.6 * | −8 | −6 |
| 90 | 89.8 | 13.8 | 80.0 | 17.1 | 9.7 * | |||
| Rice cakes | 50 | 48.3 | 22.2 | 50.6 | 22.0 | −2.3 | −3 | −4 |
| 25 | 47.4 | 23.2 | 51.8 | 24.2 | −4.5 | |||
| Mixed nuts | 80 | 67.3 | 21.4 | 69.0 | 19.1 | −1.7 | −14 | −4 |
| 40 | 84.3 | 14.7 | 74.5 | 16.9 | 9.8 * | |||
| Natural yoghurt | 240 | 86.9 | 13.4 | 63.6 | 20.7 | 23.3 * | −3 | −3 |
| 120 | 90.1 | 10.6 | 67.0 | 20.4 | 23.0 * | |||
| Toast slices | 50 | 60.2 | 20.0 | 45.8 | 20.4 | 14.4 * | −7 | −2 |
| 25 | 62.4 | 20.5 | 47.8 | 22.1 | 14.6 * | |||
| Dried fruit | 60 | 59.5 | 19.4 | 54.8 | 22.6 | 4.8 | 3 | 2 |
| 30 | 69.4 | 18.8 | 57.0 | 22.4 | 12.5 * | |||
| Flavoured yoghurt | 240 | 60.3 | 19.2 | 40.3 | 20.7 | 20.0 * | 2 | 2 |
| 120 | 70.6 | 17.6 | 43.7 | 20.4 | 26.9 * | |||
| Salted nuts | 50 | 46.9 | 19.5 | 43.0 | 20.6 | 3.9 | −6 | 4 |
| 30 | 55.3 | 19.9 | 46.6 | 20.7 | 8.7 * | |||
| Muesli bar | 50 | 43.2 | 19.5 | 41.8 | 20.4 | 1.4 | 6 | 9 |
| 25 | 50.7 | 20.7 | 44.0 | 20.4 | 6.7 * | |||
| Muffin | 180 | 18.7 | 15.1 | 24.1 | 18.0 | −5.4 * | 12 | 12 |
| 90 | 23.9 | 16.6 | 25.9 | 17.7 | −1.9 | |||
| Potato chips | 50 | 11.1 | 13.5 | 16.3 | 15.3 | −5.2 * | 13 | 12 |
| 25 | 14.1 | 14.0 | 18.1 | 16.4 | −4.0 | |||
| Nut bar | 60 | 48.5 | 20.3 | 44.8 | 20.6 | 3.6 | 9 | 13 |
| 30 | 58.7 | 20.4 | 48.7 | 20.0 | 10.0 * | |||
| Protein bar | 60 | 34.5 | 21.1 | 42.2 | 20.6 | −7.7 * | 13 | 13 |
| 30 | 40.5 | 23.1 | 45.3 | 21.1 | −4.8 | |||
| Vanilla ice cream | 80 | 24.1 | 18.9 | 19.1 | 15.7 | 5.1 * | 13 | 13 |
| 40 | 28.9 | 20.7 | 22.3 | 17.4 | 6.6 * | |||
| Lollies | 100 | 4.3 | 7.8 | 7.5 | 11.4 | −3.2 * | 16 | 15 |
| 50 | 6.1 | 10.3 | 8.5 | 12.1 | −2.4 | |||
| Carrot cake | 200 | 14.7 | 14.8 | 17.4 | 16.4 | −2.8 | 16 | 15 |
| 100 | 19.7 | 15.5 | 20.5 | 15.5 | −0.8 | |||
| Popcorn | 40 | 49.0 | 20.0 | 38.6 | 20.9 | 10.3 * | 16 | 18 |
| 20 | 55.6 | 21.3 | 42.0 | 23.0 | 13.6 * | |||
| Cookie | 50 | 14.9 | 13.4 | 19.9 | 14.8 | −5.0 * | 20 | 19 |
| 25 | 18.8 | 15.8 | 22.9 | 16.9 | −4.1 | |||
| Chocolate | 40 | 15.7 | 14.6 | 21.6 | 17.8 | −5.9 * | 31 | 23 |
| 20 | 21.1 | 17.8 | 24.7 | 18.4 | −3.6 | |||
© 2017 by the authors. Licensee MDPI, Basel, Switzerland. This article is an open access article distributed under the terms and conditions of the Creative Commons Attribution (CC BY) license (http://creativecommons.org/licenses/by/4.0/).
Share and Cite
Bucher, T.; Hartmann, C.; Rollo, M.E.; Collins, C.E. What Is Nutritious Snack Food? A Comparison of Expert and Layperson Assessments. Nutrients 2017, 9, 874. https://doi.org/10.3390/nu9080874
Bucher T, Hartmann C, Rollo ME, Collins CE. What Is Nutritious Snack Food? A Comparison of Expert and Layperson Assessments. Nutrients. 2017; 9(8):874. https://doi.org/10.3390/nu9080874
Chicago/Turabian StyleBucher, Tamara, Christina Hartmann, Megan E. Rollo, and Clare E. Collins. 2017. "What Is Nutritious Snack Food? A Comparison of Expert and Layperson Assessments" Nutrients 9, no. 8: 874. https://doi.org/10.3390/nu9080874
APA StyleBucher, T., Hartmann, C., Rollo, M. E., & Collins, C. E. (2017). What Is Nutritious Snack Food? A Comparison of Expert and Layperson Assessments. Nutrients, 9(8), 874. https://doi.org/10.3390/nu9080874