Abstract
Nutrition, especially wheat consumption, is a major factor involved in the onset of type 1 diabetes (T1D) and other autoimmune diseases such as celiac. While modern wheat cultivars possess similar gliadin proteins associated with the onset of celiac disease and T1D, alternative dietary wheat sources from Israeli landraces and native ancestral species may be lacking the epitopes linked with T1D, potentially reducing the incidence of T1D. The Non-Obese Diabetic (NOD) mouse model was used to monitor the effects of dietary wheat sources on the onset and development of T1D. The effects of modern wheat flour were compared with those from either T. aestivum, T. turgidum spp. dicoccoides, or T. turgidum spp. dicoccum landraces or a non-wheat diet. Animals which received wheat from local landraces or ancestral species such as emmer displayed a lower incidence of T1D and related complications compared to animals fed a modern wheat variety. This study is the first report of the diabetogenic properties of various dietary wheat sources and suggests that alternative dietary wheat sources may lack T1D linked epitopes, thus reducing the incidence of T1D.
1. Introduction
The incidence of Type 1 Diabetes (T1D), an autoimmune disease causing damage to the pancreatic beta cells, has doubled in the last decade [1]. The development of T1D involves a complex interaction between a person’s genetic background and environmental factors such as nutrition [2]. A significant increase of T1D in Sweden was associated with radical changes of food habits including increased consumption of pasta, white bread, meat, cheese, low-fat milk, exotic fruits, soda, and wheat-based snacks [3]. Adverse health effects of cereal proteins [2,4,5], cow’s milk proteins [6,7], and low vitamin D [4,7] on the onset of T1D have been demonstrated. Worldwide, wheat is the main staple food after maize and rice, and it is not surprising that a number of studies have suggested dietary wheat to be diabetogenic in humans [4]. The diabetogenic effects of wheat have also been demonstrated in Non-Obese Diabetic (NOD) mice [2,8,9]. Furthermore, an association between wheat gluten and celiac disease, and co-occurrence of both celiac disease and T1D have been documented [4,10,11,12,13,14]. People with celiac disease are at risk for diabetes [11,12,13,14,15,16,17,18,19,20].
Wheat contains several types of storage proteins such as gliadins and glutenins known as gluten, as well as globulins, triticins, and enzymes [21]. It is still unclear whether wheat gluten or other wheat storage proteins are responsible for the increased onset of T1D. Gluten-containing wheat stimulated the onset of T1D both in humans and NOD mice [2,4,22,23], but the opposite picture was observed with a diet enriched with purified gluten which protected NOD mice from T1D development [24]. Both in vivo and in vitro studies have demonstrated a direct effect of gluten on the immune system and on pancreatic beta cells [4].
All of the above-mentioned studies were performed using wheat from modern cultivars, which were developed in pursuit of agriculturally desirable traits associated with increased yield and uniformity of grain ripening. Unintentionally, modern wheat may have also been bred to increase the incidence of celiac and related diseases by including auto-immune epitopes [11]. However, not all wheat sources are genetically identical. There is a heterogeneity in the content of storage proteins for different wheat cultivars [21,25] and landraces [26]. In fact, the level of the celiac-related Glia-a9 epitope was much higher in modern wheat varieties than in the ancient landraces [21,25].
Unlike modern wheat cultivars, which possess little genetic variability, especially in storage proteins, local Israeli wheat landraces are very heterogeneous [27]. Importantly, many of the ancestral species of wheat are also found in Israel including Emmer (Triticum diococcoides)—the “Mother of Wheat”. Although lacking some of the agriculturally desirable traits of modern T. aestivum cultivars, emmer possesses a wealth of genetic variations, which could easily be transferred to the modern wheat. Some attempts have been made previously to incorporate the disease and drought resistance qualities of the emmer and native wheat forms into the modern varieties [28,29], but to the best of our knowledge the potentially non-diabetogenic properties of the native Israeli wheat landraces have not been studied.
With this in mind, we have collected Israeli landraces of wheat from the Israel Gene Bank (ARO), and the Germplasm Bank of the Institute for Cereal Crops Improvement (ICCI) at Tel Aviv University including accessions of Emmer, T. turgidum ssp. dicoccoides, originating from various locations in Israel as well as local landraces of T. aestivum. The types of wheat selected were: a modern bread wheat cultivar (T. aestivum) as a control, and landraces of T. aestivum, T. turgidum ssp. dicoccoides and dicoccum. The chosen wheat cultivars were tested on the NOD mouse model to estimate the effects of various dietary wheat sources on the onset of T1D in these animals. The aim of this study was to identify a low diabetogenic diet in which ‘standard’ wheat proteins were replaced with alternatives from native Israeli wheat landraces. Our hypothesis was that alternative dietary wheat sources, lacking the epitopes linked with T1D, may reduce the incidence of T1D.
2. Materials and Methods
2.1. Animals
NOD female mice, aged six weeks, were imported from Jackson Laboratories (USA) and cared for according to the guidelines set forth by the Ben-Gurion University of the Negev Animal Care and Use Committee. Food and water were supplied ad libitum.
2.2. Wheat Varieties
Most of the wheat varieties used in this work were grown on a sandy soil in a screen house at the Agricultural Research Organization—Volcani Center in Bet Dagan, Israel. Seeds of landraces of T. aestivum, T. turgidum ssp. dicoccoides, and T. turgidum ssp. dicoccum obtained from the Israel Gene Bank were sown in mid-November after incorporation of nitrogen (in the form of urea pellets) into the soil. Plants subsisted mostly on rainwater, with supplemental irrigation as needed from overhead sprinklers. Seeds were harvested during the last week of May and the first two weeks of June, depending on the ripening of each variety. Some of the emmer wheat flour was ground using seeds that were bulk-stored under controlled conditions at the Institute for Cereal Crops Improvement at the University of Tel Aviv. Conventional bread wheat grains (Triticum aestivum) were obtained from a commercial flour mill. Harvested seeds were analyzed for nutritional content and were milled to produce the diets for the animal study.
2.3. Diets
Experimental diets (Table 1) were based on a standard diet known to be diabetogenic in NOD mice consisting of 8.4% meat hydrolysate, 6.5% soybean protein, 1% milk protein, 3.2% corn starch, 2.5% wheat, and 1% oat proteins [2]. For preparing the low diabetogenic diet, wheat protein was replaced with an alternative protein source so that the total protein content stayed unchanged. For other diets, standard wheat proteins were replaced with wheat proteins from T. aestivum, T. turgidum spp. dicoccoides, or T. turgidum spp. dicoccum landraces. All tested diets had similar nutritional content (Table S1) including fat, protein, minerals, and amino acids.

Table 1.
Composition of the tested diets.
2.4. Experimental Design
After four weeks of adaptation, animals were randomly divided into five groups (diets) of 10 animals (five per cage), with food supplied ad libitum. Initial parameters including weight, body length and fasting glucose levels were measured. The mice were inspected for diabetes daily using test strips for rapid determination of glucose in urine (Machenery-Nagel, Duren, Germany). In addition, glucose blood testing was performed approximately every two weeks during the experiment. Mice were considered diabetic if they had a urine glucose value above 150 mg/dL and a fasting blood glucose level of over 130 mg/dL [30]. The experimental diets lasted for 72 days, after which blood insulin, glucose, and cholesterol levels were measured after overnight fasting. In addition, IFN-γ and IL-10 levels were measured [28] using ELISA kits (Wuhan EIAab Science, Wuhan, China) according to the manufacturer’s instructions. Standard curves were generated for each plate to determine sample concentration. Absorbance was determined using SpectraMax Paradigm multi-mode detection platform (Molecular Devices, Sunnyvale, CA, USA) and data were analyzed using GraphPad Prism software (version 6; GraphPad Software, La Jolla, CA, USA).
2.5. Statistical Analysis
Data were analyzed using IBM SPSS Statistics software. The differences in five diet groups for all four parameters were tested using one-way ANOVA with α-level of 1%. Box plots by groups were constructed in order to represent visually the analysis of results. Kaplan Meier survival analysis was performed.
3. Results
In the framework of this study, five diets were prepared: (1) a low diabetogenic (non-wheat) diet; (2) a standard diabetogenic wheat bread containing diet; (3) a T. aestivum landrace diet; (4) a T. turgidum ssp. dicoccoides landrace diet; and (5) a T. turgidum spp. dicoccum landrace diet (Table 1and Table S1). The overall mortality for all of the groups was very low with a cumulative probability of survival (Kaplan-Meier) of 0.975. Although all mice consumed approximately equal amounts of food regardless of diet (results not shown), gains in body mass and length were influenced by the diet (p < 0.001) (Results not shown). Consumption of the standard diabetogenic wheat bread containing Diet 2 led to the highest body mass followed by Diets 3 and 4. At the end of the experiment, NOD mice on Diet 2 were significantly heavier (12.07 ± 1.96 g) than animals on Diet 4 (8.4 ± 1.91 g), and Diet 5 (7.02 ± 0.48 g). Mean body mass (9.97 ± 1.69 g) of animals on Diet 1 was intermediate. Animals on Diets 3–5 had significantly longer bodies (15–20%) than animals that received either a non-wheat diet, or the standard bread wheat containing diet (results not shown).
The onset of diabetes was observed only in animals on Diets 1 and 2 (Figure 1). The incidence of diabetes (Figure 1a) in mice was determined according to the following criteria: elevated urine (>150 mg/dL; Figure 1b) and fasting blood glucose levels (>130 mg/dL; Figure 1c).
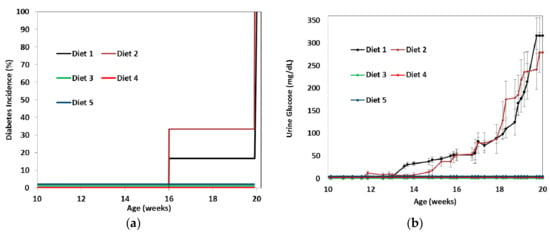
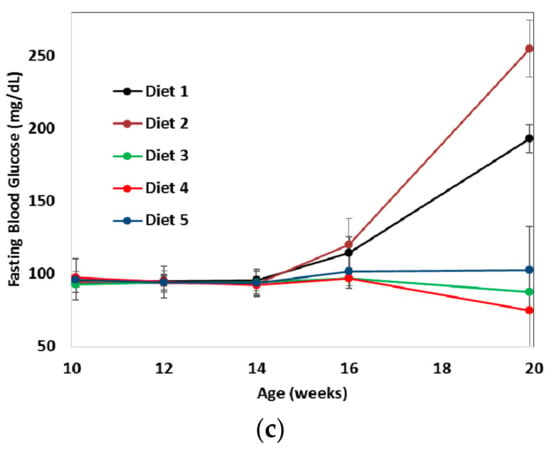
Figure 1.
Onset of diabetes. Six week old female NOD mice received one of five different wheat diets for 14 weeks. The incidence of diabetes (a) was determined based on urine glucose (b) and fasting blood glucose levels (c). Data expressed in (b) and (c) represent the mean ± SE and (a) is the percentage of mice with elevated urine (>150 mg/dL) and fasting blood glucose levels (>130 mg/dL). Diets given: (1) low diabetogenic (non-wheat), (2) standard diabetogenic wheat bread, (3) T. aestivum landrace, (4) T. turgidum ssp. dicoccoides landrace, and (5) T. turgidum spp. dicoccum landrace.
For the first six weeks of the study, there was no difference in fasting blood glucose levels between the animals on different diets (Figure 1c). By day 72, when the mice were 20 weeks old, there was already a significant difference in the glucose blood levels between the diet groups (p < 0.001). Glucose in urine was not detectable in animals on Diets 3, 4 and 5, even at the end of the experiment, while animals on Diets 1 and 2 had significantly elevated glucose in urine (Figure 1b and Figure 2).
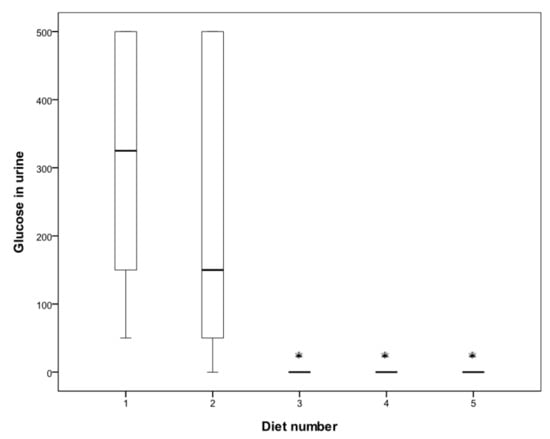
Figure 2.
Glucose levels (mg/dL) in urine after 72 days. Diets given: (1) low diabetogenic (non-wheat), (2) standard diabetogenic wheat bread, (3) T. aestivum landrace, (4) T. turgidum ssp. dicoccoides landrace, and (5) T. turgidum spp. dicoccum landrace.
After 72 days, fasting blood glucose levels increased in animals fed Diets 1 (193.2 ± 21.9 mg/dL) and 2 (255.0 ± 24.5 mg/day), compared to animals fed Diets 3 (87.4 ± 13.45 mg/day), 4 (74.6 ± 16.3 mg/day), and 5 (102.7 ± 21.2 mg/day) (Figure 3). The highest cholesterol level was observed for animals fed Diet 2 (Figure 3). With regard to the insulin level (measured in blood after overnight fasting), NOD mice on Diets 1 and 2 had the lowest insulin values (Figure 4), and differences between Diets 1 and 2 and Diets 3–5 were significant (p < 0.001). The fasting blood glucose:insulin ratios were over 10 times greater in Diet 2 than in Diets 3–4 and 6 times greater than in Diet 5.
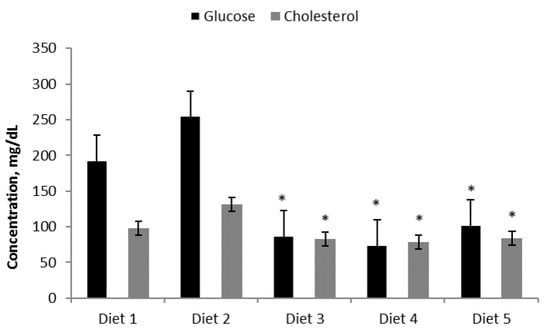
Figure 3.
Fasting blood glucose (mg/dL) and cholesterol (mg/dL) levels after 72 days. Diets given: (1) low diabetogenic (non-wheat), (2) standard diabetogenic wheat bread, (3) T. aestivum landrace, (4) T. turgidum ssp. dicoccoides landrace, and (5) T. turgidum spp. dicoccum landrace. Results are presented as means ± standard errors. Differences between Diets 1 and 2 and Diets 3–5 were significant (p < 0.001).
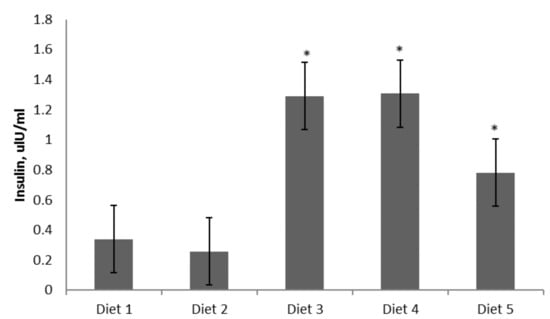
Figure 4.
Fasting blood insulin (uIU/mL) levels after 72 days. Diets given: (1) low diabetogenic (non-wheat), (2) standard diabetogenic wheat bread, (3) T. aestivum landrace, (4) T. turgidum ssp. dicoccoides landrace, and (5) T. turgidum spp. dicoccum landrace. Results are presented as means ± standard errors. Differences between Diets 1 and 2 and Diets 3–5 were significant (p < 0.001).
Increased levels of the anti-inflammatory cytokine, IL-10, were observed in animals fed Diets 3–5 (p < 0.01 vs. control) (Figure 5), with the highest levels present in animals fed Diet 4. In contrast, levels of the pro-inflammatory cytokine, IFN-γ, were significantly reduced in Diets 3–5 (p < 0.001 vs. control) (Figure 6) with their IL-10:IFN-γ ratios 7, 15, and 4 times greater than Diets 1 and 2.
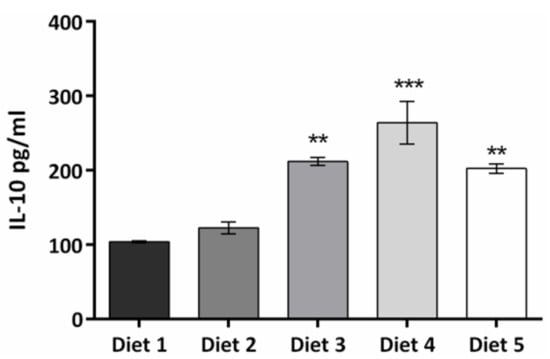
Figure 5.
Anti-inflammatory cytokine IL-10 levels (pg/mL) from blood collected on day 72. Results are presented as means ± standard errors. Differences between Diets 1 and 2 and Diets 3–5 were significant (p < 0.01).
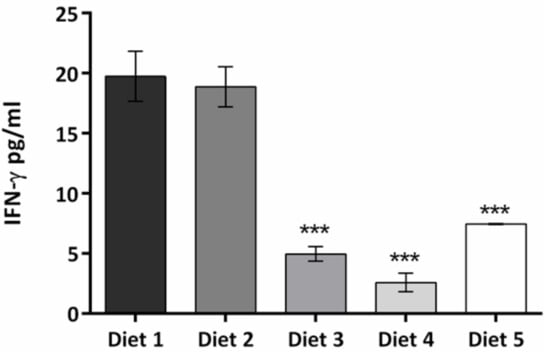
Figure 6.
Pro-inflammatory cytokine IFN-γ levels (pg/mL) from blood collected on day 72. Results are presented as means ± standard errors. Differences between Diets 1 and 2 and Diets 3–5 were significant (p < 0.001).
4. Discussion
This study is the first report of the diabetogenic properties of various ancestral dietary wheat sources. While in general wheat consumption has been linked to T1D [2,4,22,23], to the best of our knowledge there has never been an analysis of the effect of specific varieties of wheat on diabetogenesis. The NOD model mice are expected to develop T1D within 8–12 weeks after exposure to the standard diet [30]. Remarkably, animals on Diets 3, 4, and 5 did not have T1D for at least 72 days after initiation of the experiment. Diets based on the wheat progenitors T. turdigum spp. dicoccoides and dicoccum (Diets 4 and 5, respectively) were less diabetogenic than the modern conventional T. aestivum wheat cultivar (Diet 2). Surprisingly, a diet based on a landrace of T. aestivum (Diet 3), presumably of older lineage than the modern variety, was also less diabetogenic than the modern T. aestivum. Interestingly, reduced diabetogenicity correlated with reduced levels of IFN-γ, a proinflammatory cytokine involved in the autoimmune pathogenesis of T1D [31] as well increased levels of IL-10, an anti-inflammatory cytokine potentially implicated in hindering T1D development [32]. Somewhat unexpectedly, the non-wheat diet (Diet 1) displayed significant diabetogenic activity. Although this observation seems to contradict prior work, it is possible that the maize prolamins may also possess diabetogenic activity [33]. Overall, our results support the hypothesis that alternative dietary wheat sources may lack T1D linked epitopes, thus reducing the incidence of T1D.
Wheat flour contains a complex mixture of several types of storage proteins such as gliadins, glutenins, globulins, and triticins, [21]. Among them, the α-gliadins possess the most celiac-related toxic epitopes [21]. However, there may be other wheat proteins involved in the onset of T1D. For example, a wheat globulin protein Glb1 was identified as a diabetic related autoantigen using serum from diabetic BioBreeding rats [34]. Antibodies to this protein were also found in the serum of diabetic patients [35]. The proteins from the less diabetogenic wheat sources (T. aestivum landrace, T. turgidum spp. dicoccoides, or T. turgidum spp. dicoccum) have yet to be analyzed in order to unravel the mechanisms standing behind their reduced diabetogenicity. Future studies should address differences in expression of proteins capable of inducing autoimmune responses such as Glb1. Full characterization of the total protein makeup of various wheat sources will facilitate linking diabetogenic activity to specific proteins. This will aid in developing new less harmful wheat varieties which could greatly benefit public health, potentially reducing the incidence of diabetes and related complications.
Supplementary Materials
The following is available online at www.mdpi.com/ 2072-6643/9/5/482/s1, Table S1: Nutritional content of the tested diets.
Acknowledgments
This work was funded by the Israeli Ministry of Health (Grant # 3-00000-9645) and the Israeli Ministry of Science, Technology, and Space.
Author Contributions
J.G. and S.B.-S. oversaw all stages of this work. L.Y. led the animal study and was assisted by A.B. and B.K., J.D.K. and Y.P were responsible for wheat cultivation and experimental diet preparation. M.A.B. and T.R. performed the data analysis.
Conflicts of Interest
The authors declare no conflict of interest.
References
- Shalitin, S.; Peter Chase, H. Diabetes technology and treatments in the pediatric age group. Int. J. Clin. Pract. 2011, 65 (Suppl. 170), 76–82. [Google Scholar] [CrossRef] [PubMed]
- Funda, D.; Kaas, A.; Bock, T.; Tlaskalová-Hogenová, H.; Buschard, K. Gluten-free diet prevents diabetes in NOD mice. Diabetes Metab. Res. Rev. 1999, 15, 323–327. [Google Scholar] [CrossRef]
- Landin-Olsson, M.; Hillman, M.; Erlanson-Albertsson, C. Is type 1 diabetes a food-induced disease? Med. Hypotheses 2013, 81 (Suppl. 2), 338–342. [Google Scholar] [CrossRef] [PubMed]
- Antvorskov, J.C.; Josefsen, K.; Engkilde, K.; Funda, D.P.; Buschard, K. Dietary gluten and the development of type 1 diabetes. Diabetologia 2014, 57 (Suppl. 9), 1770–1780. [Google Scholar] [CrossRef] [PubMed]
- Nielsen, D.S.; Krych, L.; Buschaard, K.; Hansen, C.H.; Hansen, A.K. Beyond genetics. Influence of dietary factors and gut microbiota on type 1 diabetes. FEBS Lett. 2014, 588, 4234–4243. [Google Scholar] [CrossRef] [PubMed]
- Elliott, R.B.; Harris, D.P.; Hill, J.P.; Bibby, N.J.; Wasmuth, H.E. Type 1 (insulin-dependent) diabetes mellitus and cow milk: Casein variant consumption. Diabetologia 1999, 42, 292–296. [Google Scholar] [CrossRef] [PubMed]
- Merriman, T.R. Type 1 diabetes, the A1 milk hypothesis and vitamin D deficiency. Diabetes Res. Clin. Prac. 2009, 83, 149–156. [Google Scholar] [CrossRef] [PubMed]
- Schmid, S.; Koczwara, K.; Schwinghammer, S.; Lampasona, V.; Ziegler, A.G.; Bonifacio, E. Delayed exposure to wheat and barley proteins reduces diabetes incidence in non-obese diabetic mice. Clin. Immunol. 2004, 111, 108–118. [Google Scholar] [CrossRef] [PubMed]
- Maurano, F.; Mazzarella, G.; Luongo, D.; Stefanile, R.; D’Arienzo, R.; Rossi, M.; Troncone, R. Small intestinal enteropathy in nonobese diabetic mice fed a diet containing wheat. Diabetologia 2005, 48, 931–937. [Google Scholar] [CrossRef] [PubMed]
- Wolta, U.; Tovoli, F.; Caio, G. Clinical and immunological features of celiac disease in patients with type 1 diabetes mellitus. Expert Rev. Gastroenterol. Hepatol. 2011, 5 (Suppl. 4), 479–487. [Google Scholar]
- Adlercreutz, E.H.; Wingren, C.J.; Vincente, R.P.; Merlo, J.; Agardh, D. Perinatal risk factors increase the risk of being affected by both type 1 diabetes and coeliacdisease. Acta Paediatr. 2015, 104 (Suppl. 2), 178–184. [Google Scholar] [CrossRef] [PubMed]
- Mollazadegan, K.; Sanders, D.S.; Ludvigsson, J.; Ludvigsson, J.F. Long-term coeliac disease influences risk of death in patients with type 1 diabetes. J. Intern. Med. 2013, 274 (Suppl. 3), 273–280. [Google Scholar] [CrossRef] [PubMed]
- Scaramuzza, A.E.; Mantegazza, C.; Bosetti, A.; Zuccotti, G.V. Type 1 diabetes and celiac disease: The effects of gluten free diet on metabolic control. World J. Diabetes 2013, 4 (Suppl. 4), 130–134. [Google Scholar] [CrossRef] [PubMed]
- Salgin, B.; Meissner, T.; Beyer, P.; Haberland, H.; Borkenstein, M.; Fussenegger, J.; Holl, R.W. Lipoatrophy is associated with an increased risk of Hashimoto’s thyroiditis and coeliac disease in female patients with type 1 diabetes. Horm. Res. Paediatr. 2013, 79 (Suppl. 6), 368–372. [Google Scholar] [CrossRef] [PubMed]
- Mahmud, F.H.; Murray, J.A.; Kudva, Y.C.; Zinsmeister, A.R.; Dierkhising, R.A.; Lahr, B.D.; Van Dyke, C.T. Celiac disease in type 1 diabetes mellitus in a North American community: Prevalence, serologic screening, and clinical features. Mayo Clin. Proc. 2005, 80 (Suppl. 11), 1429–1435. [Google Scholar] [CrossRef] [PubMed]
- Ludvigsson, J.F.; Ludvigsson, J.; Ekbom, A.; Montgomery, S.M. Celiac disease and risk of subsequent type 1 diabetes: A general population cohort study of children and adolescents. Diabetes Care 2006, 29 (Suppl. 11), 2483–2488. [Google Scholar] [CrossRef] [PubMed]
- Goh, C.; Banerjee, K. Prevalence of coeliac disease in children and adolescents with type 1 diabetes mellitus in a clinic based population. Postgrad. Med. J. 2007, 83 (Suppl. 976), 132–136. [Google Scholar] [CrossRef] [PubMed]
- Simmons, J.H.; Klingensmith, G.J.; McFann, K.; Rewers, M.; Taylor, J.; Emery, L.M.; Hoffenberg, E.J. Impact of celiac autoimmunity on children with type 1 diabetes. J. Pediatr. 2007, 150 (Suppl. 5), 461–466. [Google Scholar] [CrossRef] [PubMed]
- Pham-Short, A.; Donaghue, K.C.; Ambler, G.; Chan, A.K.; Craig, M.E. Coeliac disease in Type 1 diabetes from 1990 to 2009: Higher incidence in young children afterlonger diabetes duration. Diabet. Med. 2012, 29 (Suppl. 9), 286–289. [Google Scholar] [CrossRef] [PubMed]
- Levy-Shraga, Y.; Lerner-Geva, L.; Boyko, V.; Graph-Barel, C.; Mazor-Aronovitch, K.; Modan-Moses, D.; Pinhas-Hamiel, O. Type 1 diabetes in pre-school children—Long-term metabolic control, associated autoimmunity and complications. Diabet. Med. 2012, 29 (Suppl. 10), 1291–1296. [Google Scholar] [CrossRef] [PubMed]
- Van den Broeck, H.; de Jong, H.C.; Salentijn, E.M.; Dekking, L.; Bosch, D.; Hamer, R.J.; Smulders, M.J. Presence of celiac disease epitopes in modern and old hexaploid wheat varieties: Wheat breeding may have contributed to increased prevalence of celiac disease. Theor. Appl. Genet. 2010, 121 (Suppl. 8), 1527–1539. [Google Scholar] [CrossRef] [PubMed]
- Ziegler, A.G.; Schmid, S.; Huber, D.; Hummel, M.; Bonifacio, E. Early infant feeding and risk of developing type 1 diabetes-associated autoantibodies. JAMA 2003, 290, 1721–1728. [Google Scholar] [CrossRef] [PubMed]
- Norris, J.M.; Barriga, K.; Klingensmith, G.; Hoffman, M.; Eisenbarth, G.S.; Erlich, H.A.; Rewers, M. Timing of initial cereal exposure in infancy and exposure in infancy and risk of islet autoimmunity. JAMA 2003, 290, 1713–1720. [Google Scholar] [CrossRef] [PubMed]
- Funda, D.; Kaas, A.; Tlaskalova-Hogenova, H.; Buschard, K. Gluten-free but also gluten-enriched (gluten+) diet prevent diabetes in NOD mice; the gluten enigma in type 1 diabetes. Diabetes Metab. Res. Rev. 2008, 24, 59–63. [Google Scholar] [CrossRef] [PubMed]
- Van den Broeck, H.; Hongbing, C.; Lacaze, X.; Dusautoir, J.C.; Gilissen, L.; Smulders, M.; Van Der Meer, I. In search of tetraploid wheat accessions reduced in celiac disease-related gluten epitopes. Mol. Biosyst. 2010, 6 (Suppl. 11), 2206–2213. [Google Scholar] [CrossRef] [PubMed]
- Wieser, H. Chemistry of gluten proteins. Food Microbiol. 2007, 24 (Suppl. 2), 115–119. [Google Scholar] [CrossRef] [PubMed]
- Poliarkova, H.; Blum, A. Land-races of wheat from the Northen Negev in Israel. Euphitica 1983, 32, 257–271. [Google Scholar] [CrossRef]
- Fedak, G. Alien Introgressions from wild Triticum species, T. monococcum, T. urartu, T. turgidum, T. dicoccum, T. dicoccoides, T. carthlicum, T. araraticum, T. timopheevii, and T. miguschovae. In Alien Introgression in Wheat; Springer: Cham, Switzerland, 2015; pp. 191–219. [Google Scholar]
- Peng, J.H.; Fahima, T.; Röder, M.S.; Li, Y.C.; Dahan, A.; Grama, A.; Ronin, Y.I.; Korol, A.B.; Nevo, E. Microsatellite tagging of the stripe-rust resistance gene YrH52 derived from wild emmer wheat, Triticum dicoccoides, and suggestive negative crossover interference on chromosome 1B. Theor. Appl. Genet. 1999, 98, 862–872. [Google Scholar] [CrossRef]
- King, A.J. The use of animal models in diabetes research. Br. J. Pharm. 2012, 166, 877–894. [Google Scholar] [CrossRef] [PubMed]
- Yi, Z.; Li, L.; Garland, A.; He, Q.; Wang, H.; Katz, J.D.; Tisch, R.; Wang, B. IFN-γ receptor deficiency prevents diabetes induction by diabetogenic CD4+, but not CD8+, T cells. Eur. J. Immunol. 2012, 42, 2010–2018. [Google Scholar] [CrossRef] [PubMed]
- Russell, M.A.; Morgan, N.G. The impact of anti-inflammatory cytokines on the pancreatic β-cell. Islets 2014, 6, e950547. [Google Scholar] [CrossRef] [PubMed]
- Ortiz-Sanchez, J.P.; Cabrera-Chavez, F.; Calderon de la Barca, A.M.C. Maize Prolamins could induce a gluten-like cellular immune response in some celiac disease patients. Nutrients 2013, 5, 4174–4183. [Google Scholar] [CrossRef] [PubMed]
- MacFarlane, A.J.; Burghardt, K.M.; Kelly, J.; Simell, T.; Simell, O.; Altosaar, I.; Scott, F.W. A type 1 diabetes-related protein from wheat (Triticum aestivum). cDNA clone of a wheat storage globulin, Glb1, linked to islet damage. J. Biol. Chem. 2003, 278 (Suppl. 1), 54–63. [Google Scholar] [CrossRef] [PubMed]
- Loit, E.; Melnyk, C.W.; MacFarlane, A.J.; Scott, F.W.; Altosaar, I. Identification of three wheat globulin genes by screening a Triticum aestivum BAC genomic library with cDNA from a diabetes-associated globulin. BMC Plant Biol. 2009, 9, 93. [Google Scholar] [CrossRef] [PubMed]
© 2017 by the authors. Licensee MDPI, Basel, Switzerland. This article is an open access article distributed under the terms and conditions of the Creative Commons Attribution (CC BY) license (http://creativecommons.org/licenses/by/4.0/).