Nutritional Status Predicts 10-Year Mortality in Patients with End-Stage Renal Disease on Hemodialysis


Abstract
:1. Introduction
2. Materials and Methods
2.1. Patient Population
2.2. Follow-Up and End Points
2.3. Anthropometric Measures
2.4. Laboratory Evaluation
2.5. Malnutrition Inflammation Score (MIS)
2.6. Dietary Assessment
2.7. Statistical Methods
3. Results
3.1. Comparisons between Survivor and Non-Survivor Patients
3.2. Cox Proportional Hazards Analysis of Mortality
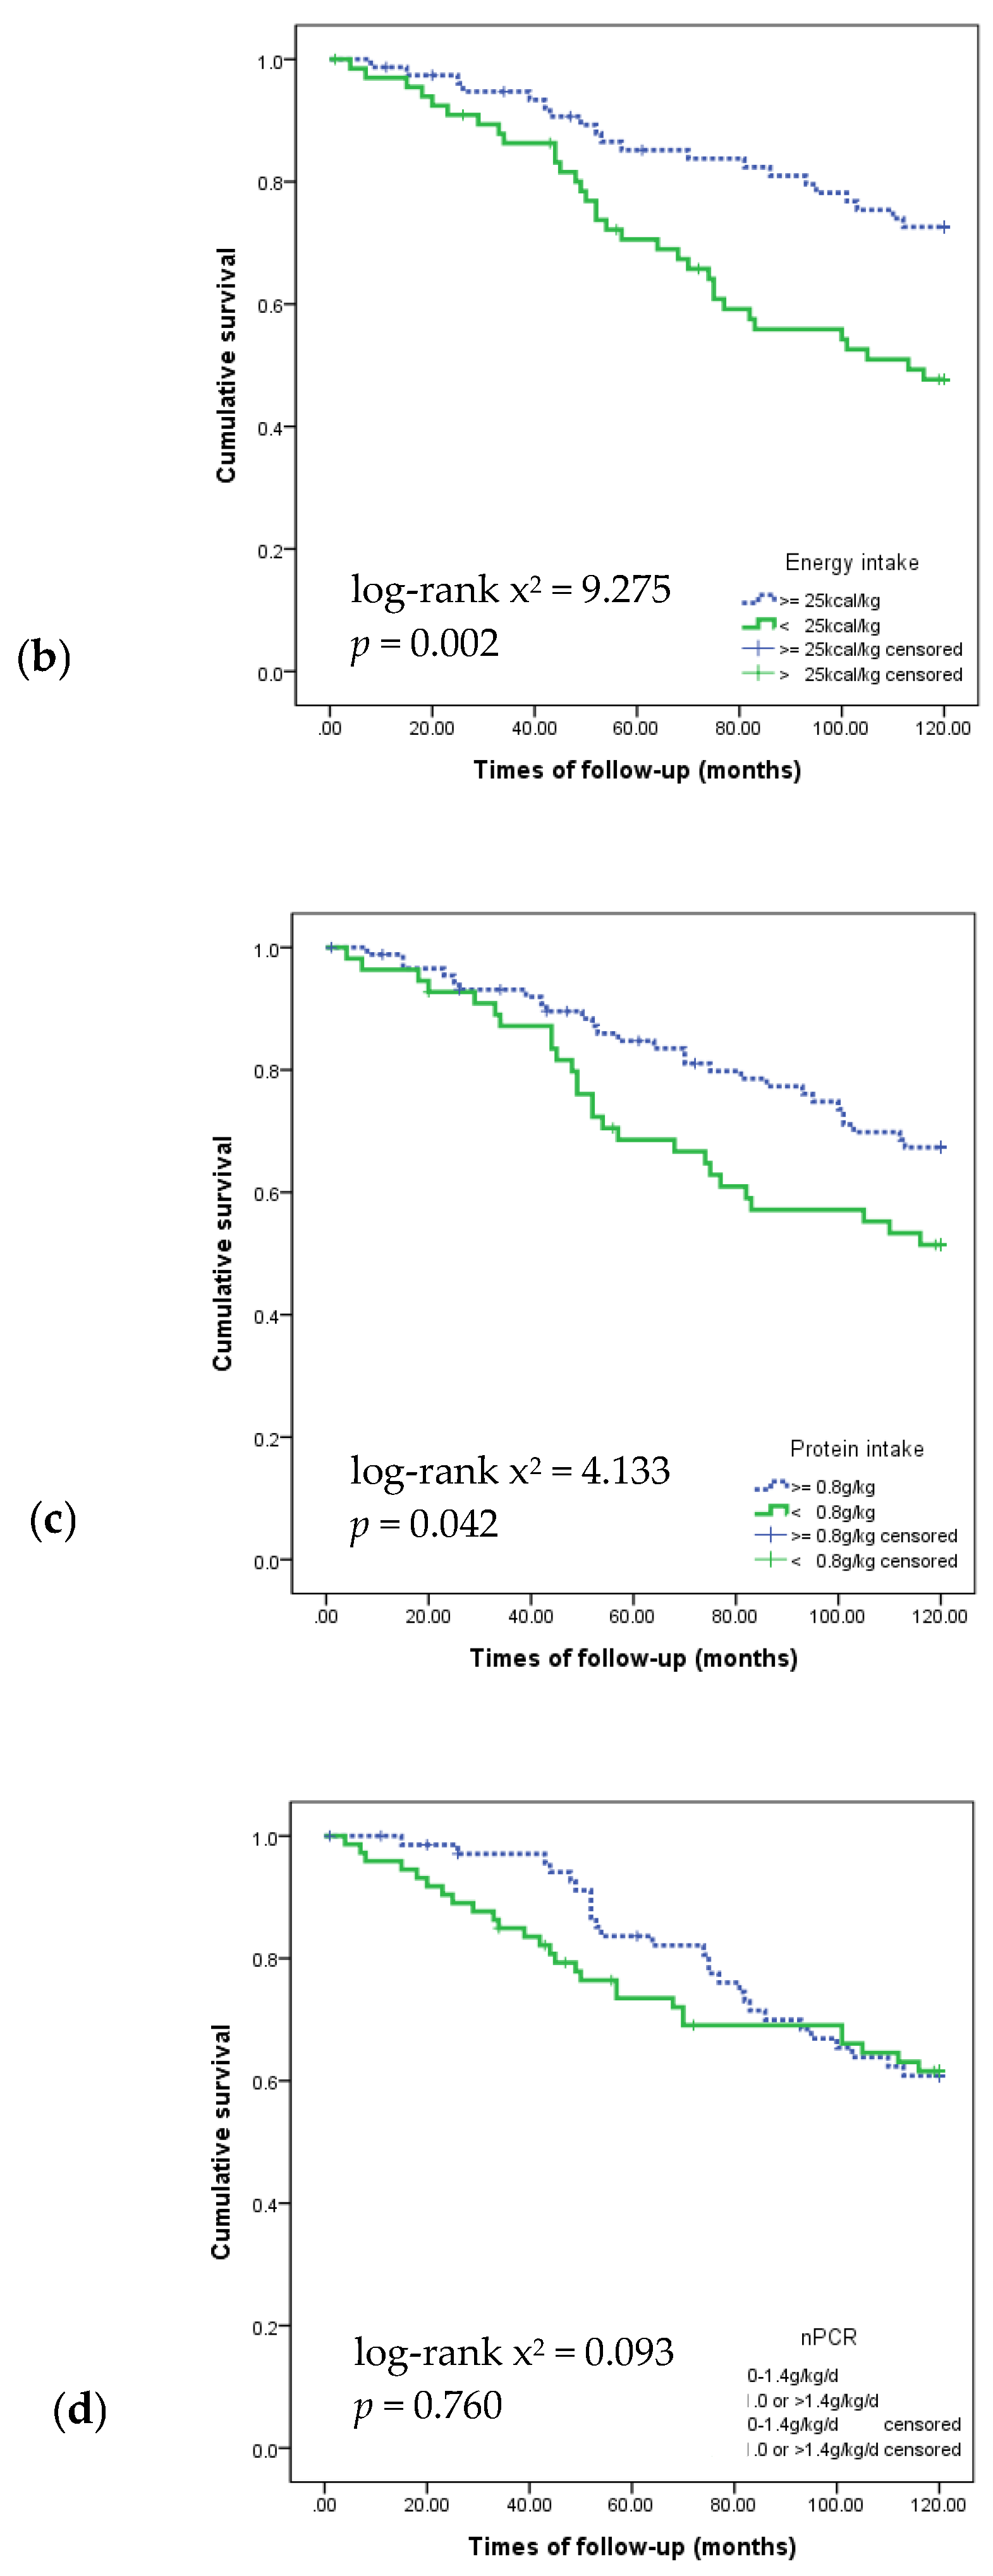
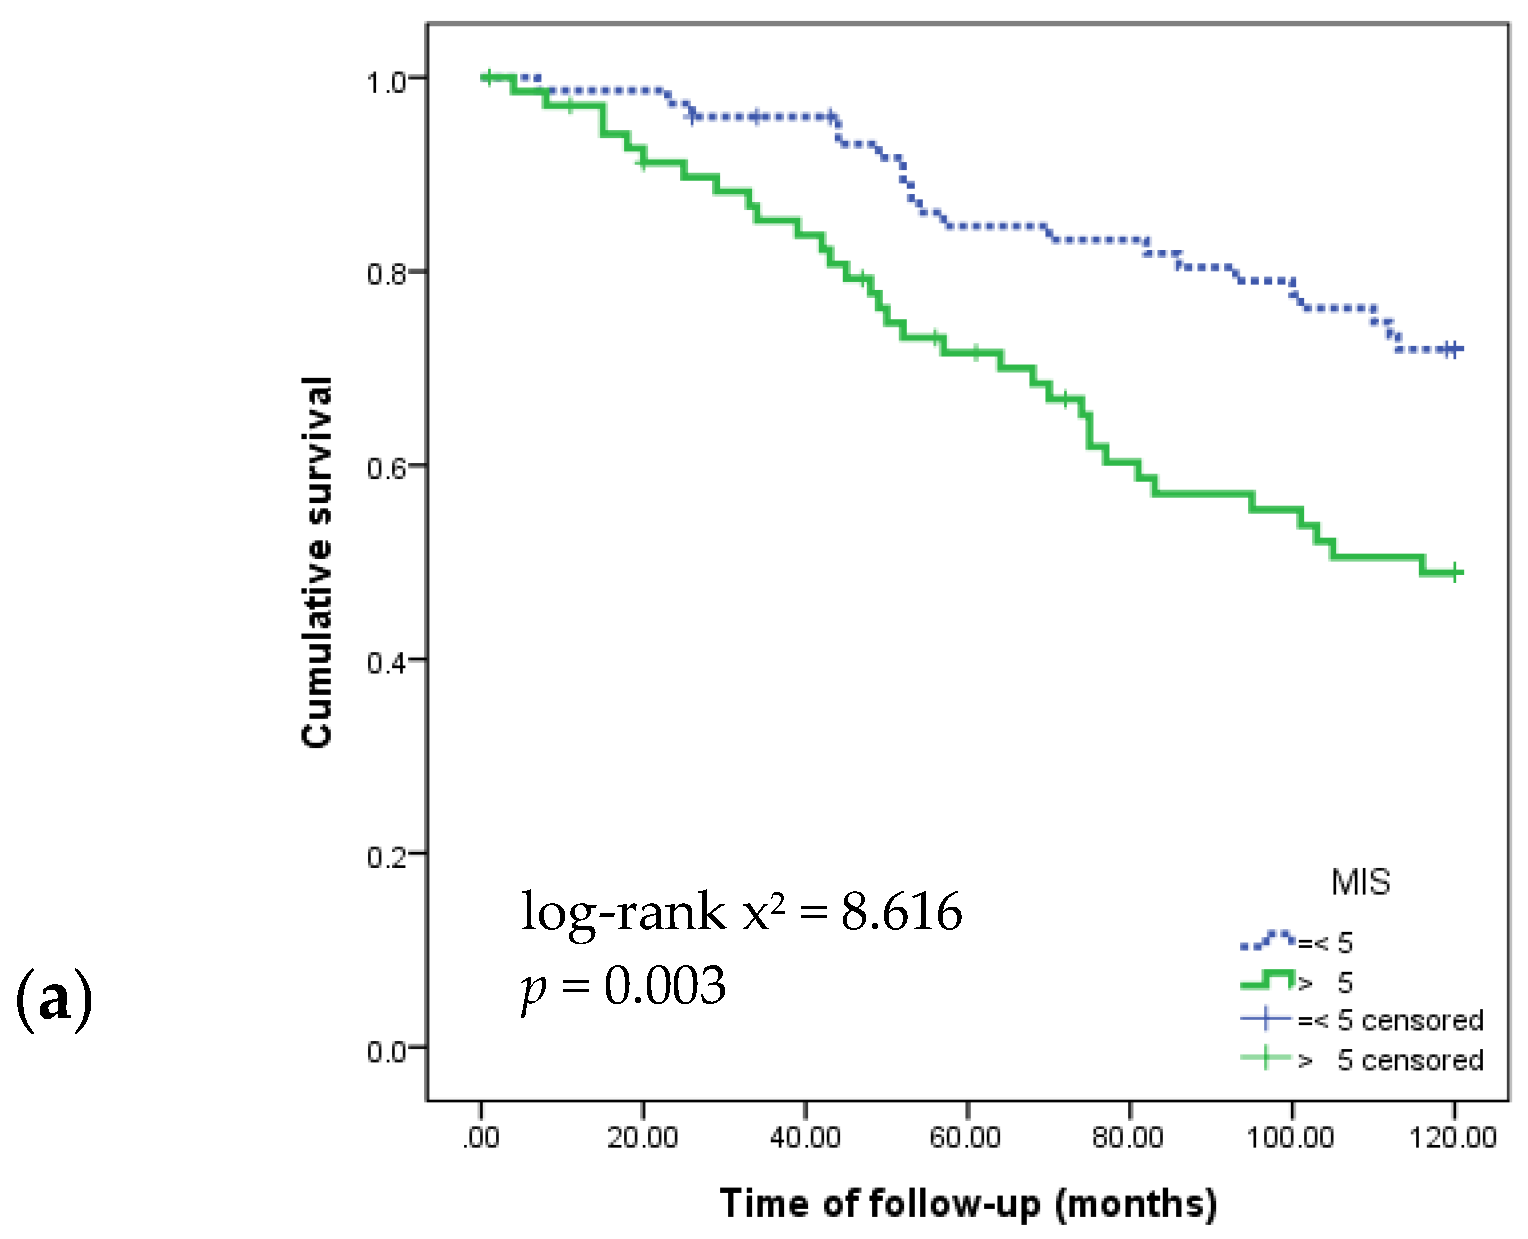
3.3. Kaplan–Meier Survival Curves Showing 120-Month Survival According to Nutritional Markers
4. Discussion
5. Conclusions
Acknowledgments
Author Contributions
Conflicts of Interest
References
- De Mutsert, R.; Grootendorst, D.C.; Axelsson, J.; Boeschoten, E.W.; Krediet, R.T.; Dekker, F.W. Excess mortality due to interaction between protein-energy wasting, inflammation and cardiovascular disease in chronic dialysis patients. Nephrol. Dial. Transplant. 2008, 23, 2957–2964. [Google Scholar] [CrossRef] [PubMed]
- Carrero, J.J.; Stenvinkel, P.; Cuppari, L.; Ikizler, T.A.; Kalantar-Zadeh, K.; Kaysen, G.; Mitch, W.E.; Price, S.R.; Wanner, C.; Wang, A.Y.; et al. Etiology of the protein-energy wasting syndrome in chronic kidney disease: A consensus statement from the international society of renal nutrition and metabolism (ISRNM). J. Ren. Nutr. 2013, 23, 77–90. [Google Scholar] [CrossRef] [PubMed]
- Khan, I.H.; Catto, G.R.; Edward, N.; Fleming, L.W.; Henderson, I.S.; MacLeod, A.M. Influence of coexisting disease on survival on renal-replacement therapy. Lancet 1993, 341, 415–418. [Google Scholar] [CrossRef]
- Qureshi, A.R.; Alvestrand, A.; Danielsson, A.; Divino-Filho, J.C.; Gutierrez, A.; Lindholm, B.; Bergstrom, J. Factors predicting malnutrition in hemodialysis patients: A cross-sectional study. Kidney Int. 1998, 53, 773–782. [Google Scholar] [CrossRef] [PubMed]
- Aparicio, M.; Cano, N.; Chauveau, P.; Azar, R.; Canaud, B.; Flory, A.; Laville, M.; Leverve, X. Nutritional status of haemodialysis patients: A french national cooperative study. French study group for nutrition in dialysis. Nephrol. Dial. Transplant. 1999, 14, 1679–1686. [Google Scholar] [CrossRef] [PubMed]
- Herselman, M.; Moosa, M.R.; Kotze, T.J.; Kritzinger, M.; Wuister, S.; Mostert, D. Protein-energy malnutrition as a risk factor for increased morbidity in long-term hemodialysis patients. J. Ren. Nutr. 2000, 10, 7–15. [Google Scholar] [CrossRef]
- Kalantar-Zadeh, K.; Block, G.; McAllister, C.J.; Humphreys, M.H.; Kopple, J.D. Appetite and inflammation, nutrition, anemia, and clinical outcome in hemodialysis patients. Am. J. Clin. Nutr. 2004, 80, 299–307. [Google Scholar] [PubMed]
- Perez Vogt, B.; Costa Teixeira Caramori, J. Are nutritional composed scoring systems and protein-energy wasting score associated with mortality in maintenance hemodialysis patients? J. Ren. Nutr. 2016, 26, 183–189. [Google Scholar] [CrossRef] [PubMed]
- Clinical practice guidelines for nutrition in chronic renal failure. K/doqi, national kidney foundation. Am. J. Kidney Dis. 2000, 35 (Suppl. 2), S1–S140.
- Fouque, D.; Kalantar-Zadeh, K.; Kopple, J.; Cano, N.; Chauveau, P.; Cuppari, L.; Franch, H.; Guarnieri, G.; Ikizler, T.A.; Kaysen, G.; et al. A proposed nomenclature and diagnostic criteria for protein-energy wasting in acute and chronic kidney disease. Kidney Int. 2008, 73, 391–398. [Google Scholar] [CrossRef] [PubMed]
- Riella, M.C. Nutritional evaluation of patients receiving dialysis for the management of protein-energy wasting: What is old and what is new? J. Ren. Nutr. 2013, 23, 195–198. [Google Scholar] [CrossRef] [PubMed]
- De Roij van Zuijdewijn, C.L.; Ter Wee, P.M.; Chapdelaine, I.; Bots, M.L.; Blankestijn, P.J.; van den Dorpel, M.A.; Nube, M.J.; Grooteman, M.P. A comparison of 8 nutrition-related tests to predict mortality in hemodialysis patients. J. Ren. Nutr. 2015, 25, 412–419. [Google Scholar] [CrossRef] [PubMed]
- Kopple, J.D. Pathophysiology of protein-energy wasting in chronic renal failure. J. Nutr. 1999, 129, 247S–251S. [Google Scholar] [PubMed]
- Schoenfeld, P.Y.; Henry, R.R.; Laird, N.M.; Roxe, D.M. Assessment of nutritional status of the national cooperative dialysis study population. Kidney Int. Suppl. 1983, 13, S80–S88. [Google Scholar]
- Lorenzo, V.; de Bonis, E.; Rufino, M.; Hernandez, D.; Rebollo, S.G.; Rodriguez, A.P.; Torres, A. Caloric rather than protein deficiency predominates in stable chronic haemodialysis patients. Nephrol. Dial. Transplant. 1995, 10, 1885–1889. [Google Scholar] [PubMed]
- Dwyer, J.T.; Cunniff, P.J.; Maroni, B.J.; Kopple, J.D.; Burrowes, J.D.; Powers, S.N.; Cockram, D.B.; Chumlea, W.C.; Kusek, J.W.; Makoff, R.; et al. The hemodialysis pilot study: Nutrition program and participant characteristics at baseline. The hemo study group. J. Ren. Nutr. 1998, 8, 11–20. [Google Scholar] [CrossRef]
- Kalantar-Zadeh, K.; Cano, N.J.; Budde, K.; Chazot, C.; Kovesdy, C.P.; Mak, R.H.; Mehrotra, R.; Raj, D.S.; Sehgal, A.R.; Stenvinkel, P.; et al. Diets and enteral supplements for improving outcomes in chronic kidney disease. Nat. Rev. Nephrol. 2011, 7, 369–384. [Google Scholar] [CrossRef] [PubMed]
- Lacson, E., Jr.; Wang, W.; Zebrowski, B.; Wingard, R.; Hakim, R.M. Outcomes associated with intradialytic oral nutritional supplements in patients undergoing maintenance hemodialysis: A quality improvement report. Am. J. Kidney Dis. 2012, 60, 591–600. [Google Scholar] [CrossRef] [PubMed]
- Cheu, C.; Pearson, J.; Dahlerus, C.; Lantz, B.; Chowdhury, T.; Sauer, P.F.; Farrell, R.E.; Port, F.K.; Ramirez, S.P. Association between oral nutritional supplementation and clinical outcomes among patients with ESRD. Clin. J. Am. Soc. Nephrol. 2013, 8, 100–107. [Google Scholar] [CrossRef] [PubMed]
- Caglar, K.; Fedje, L.; Dimmitt, R.; Hakim, R.M.; Shyr, Y.; Ikizler, T.A. Therapeutic effects of oral nutritional supplementation during hemodialysis. Kidney Int. 2002, 62, 1054–1059. [Google Scholar] [CrossRef] [PubMed]
- Kalantar-Zadeh, K.; Braglia, A.; Chow, J.; Kwon, O.; Kuwae, N.; Colman, S.; Cockram, D.B.; Kopple, J.D. An anti-inflammatory and antioxidant nutritional supplement for hypoalbuminemic hemodialysis patients: A pilot/feasibility study. J. Ren. Nutr. 2005, 15, 318–331. [Google Scholar] [CrossRef] [PubMed]
- Kopple, J.D.; Berg, R.; Houser, H.; Steinman, T.I.; Teschan, P. Nutritional status of patients with different levels of chronic renal insufficiency. Modification of diet in renal disease (MDRD) study group. Kidney Int. Suppl. 1989, 27, S184–S194. [Google Scholar] [PubMed]
- Morais, A.A.; Silva, M.A.; Faintuch, J.; Vidigal, E.J.; Costa, R.A.; Lyrio, D.C.; Trindade, C.R.; Pitanga, K.K. Correlation of nutritional status and food intake in hemodialysis patients. Clinics (Sao Paulo) 2005, 60, 185–192. [Google Scholar] [CrossRef] [PubMed]
- Segall, L.; Mardare, N.G.; Ungureanu, S.; Busuioc, M.; Nistor, I.; Enache, R.; Marian, S.; Covic, A. Nutritional status evaluation and survival in haemodialysis patients in one centre from romania. Nephrol. Dial. Transplant. 2009, 24, 2536–2540. [Google Scholar] [CrossRef] [PubMed]
- Beberashvili, I.; Azar, A.; Sinuani, I.; Kadoshi, H.; Shapiro, G.; Feldman, L.; Averbukh, Z.; Weissgarten, J. Comparison analysis of nutritional scores for serial monitoring of nutritional status in hemodialysis patients. Clin. J. Am. Soc. Nephrol. 2013, 8, 443–451. [Google Scholar] [CrossRef] [PubMed]
- Kara, E.; Sahutoglu, T.; Ahbap, E.; Sakaci, T.; Koc, Y.; Basturk, T.; Sevinc, M.; Akgol, C.; Unsal, A. The predictive value of malnutrition—Inflammation score on 1-year mortality in Turkish maintenance hemodialysis patients. Clin. Nephrol. 2016, 86, 94–99. [Google Scholar] [CrossRef] [PubMed]
- Antunes, A.A.; Delatim Vannini, F.; de Arruda Silveira, L.V.; Martin, L.C.; Barretti, P.; Caramori, J.C. Influence of protein intake and muscle mass on survival in chronic dialysis patients. Ren. Fail. 2010, 32, 1055–1059. [Google Scholar] [CrossRef] [PubMed]
- Araujo, I.C.; Kamimura, M.A.; Draibe, S.A.; Canziani, M.E.; Manfredi, S.R.; Avesani, C.M.; Sesso, R.; Cuppari, L. Nutritional parameters and mortality in incident hemodialysis patients. J. Ren. Nutr. 2006, 16, 27–35. [Google Scholar] [CrossRef] [PubMed]
- Davies, S.J.; Russell, L.; Bryan, J.; Phillips, L.; Russell, G.I. Comorbidity, urea kinetics, and appetite in continuous ambulatory peritoneal dialysis patients: Their interrelationship and prediction of survival. Am. J. Kidney Dis. 1995, 26, 353–361. [Google Scholar] [CrossRef]
- Charlson, M.E.; Pompei, P.; Ales, K.L.; MacKenzie, C.R. A new method of classifying prognostic comorbidity in longitudinal studies: Development and validation. J. Chronic Dis. 1987, 40, 373–383. [Google Scholar] [CrossRef]
- Williams, A.J.; McArley, A. Body composition, treatment time, and outcome in hemodialysis patients. J. Ren. Nutr. 1999, 9, 157–162. [Google Scholar] [CrossRef]
- Chumlea, W.C. Anthropometric and body composition assessment in dialysis patients. Semin. Dial. 2004, 17, 466–470. [Google Scholar] [CrossRef] [PubMed]
- Depner, T.A.; Daugirdas, J.T. Equations for normalized protein catabolic rate based on two-point modeling of hemodialysis urea kinetics. J. Am. Soc. Nephrol. 1996, 7, 780–785. [Google Scholar] [PubMed]
- Daugirdas, J.T. Second generation logarithmic estimates of single-pool variable volume Kt/v: An analysis of error. J. Am. Soc. Nephrol. 1993, 4, 1205–1213. [Google Scholar] [PubMed]
- Kalantar-Zadeh, K.; Kopple, J.D.; Block, G.; Humphreys, M.H. A malnutrition-inflammation score is correlated with morbidity and mortality in maintenance hemodialysis patients. Am. J. Kidney Dis. 2001, 38, 1251–1263. [Google Scholar] [CrossRef] [PubMed]
- Enia, G.; Sicuso, C.; Alati, G.; Zoccali, C. Subjective global assessment of nutrition in dialysis patients. Nephrol. Dial. Transplant. 1993, 8, 1094–1098. [Google Scholar] [PubMed]
- Bross, R.; Noori, N.; Kovesdy, C.P.; Murali, S.B.; Benner, D.; Block, G.; Kopple, J.D.; Kalantar-Zadeh, K. Dietary assessment of individuals with chronic kidney disease. Semin. Dial. 2010, 23, 359–364. [Google Scholar] [CrossRef] [PubMed]
- Shinaberger, C.S.; Kilpatrick, R.D.; Regidor, D.L.; McAllister, C.J.; Greenland, S.; Kopple, J.D.; Kalantar-Zadeh, K. Longitudinal associations between dietary protein intake and survival in hemodialysis patients. Am. J. Kidney Dis. 2006, 48, 37–49. [Google Scholar] [CrossRef] [PubMed]
- Kalantar-Zadeh, K.; Kopple, J.D.; Humphreys, M.H.; Block, G. Comparing outcome predictability of markers of malnutrition-inflammation complex syndrome in haemodialysis patients. Nephrol. Dial. Transplant. 2004, 19, 1507–1519. [Google Scholar] [CrossRef] [PubMed]
- Ho, L.C.; Wang, H.H.; Peng, Y.S.; Chiang, C.K.; Huang, J.W.; Hung, K.Y.; Hu, F.C.; Wu, K.D. Clinical utility of malnutrition-inflammation score in maintenance hemodialysis patients: Focus on identifying the best cut-off point. Am. J. Nephrol. 2008, 28, 840–846. [Google Scholar] [CrossRef] [PubMed]
- Slomowitz, L.A.; Monteon, F.J.; Grosvenor, M.; Laidlaw, S.A.; Kopple, J.D. Effect of energy intake on nutritional status in maintenance hemodialysis patients. Kidney Int. 1989, 35, 704–711. [Google Scholar] [CrossRef] [PubMed]
- Toigo, G.; Aparicio, M.; Attman, P.O.; Cano, N.; Cianciaruso, B.; Engel, B.; Fouque, D.; Heidland, A.; Teplan, V.; Wanner, C. Expert working group report on nutrition in adult patients with renal insufficiency (part 2 of 2). Clin. Nutr. 2000, 19, 281–291. [Google Scholar] [CrossRef] [PubMed]
- Beddhu, S.; Ramkumar, N.; Pappas, L.M. Normalization of protein intake by body weight and the associations of protein intake with nutritional status and survival. J. Ren. Nutr. 2005, 15, 387–397. [Google Scholar] [CrossRef] [PubMed]
- Canaud, B.; Leblanc, M.; Garred, L.J.; Bosc, J.Y.; Argiles, A.; Mion, C. Protein catabolic rate over lean body mass ratio: A more rational approach to normalize the protein catabolic rate in dialysis patients. Am. J. Kidney Dis. 1997, 30, 672–679. [Google Scholar] [CrossRef]
- Stegeman, C.A.; Huisman, R.M.; de Rouw, B.; Joostema, A.; de Jong, P.E. Determination of protein catabolic rate in patients on chronic intermittent hemodialysis: Urea output measurements compared with dietary protein intake and with calculation of urea generation rate. Am. J. Kidney Dis. 1995, 25, 887–895. [Google Scholar] [CrossRef]
- Stenvinkel, P.; Heimburger, O.; Paultre, F.; Diczfalusy, U.; Wang, T.; Berglund, L.; Jogestrand, T. Strong association between malnutrition, inflammation, and atherosclerosis in chronic renal failure. Kidney Int. 1999, 55, 1899–1911. [Google Scholar] [CrossRef] [PubMed]
- Bossola, M.; Muscaritoli, M.; Tazza, L.; Panocchia, N.; Liberatori, M.; Giungi, S.; Tortorelli, A.; Rossi Fanelli, F.; Luciani, G. Variables associated with reduced dietary intake in hemodialysis patients. J. Ren. Nutr. 2005, 15, 244–252. [Google Scholar] [CrossRef] [PubMed]
- Stosovic, M.; Stanojevic, M.; Simic-Ogrizovic, S.; Jovanovic, D.; Djukanovic, L. The predictive value of anthropometric parameters on mortality in haemodialysis patients. Nephrol. Dial. Transplant. 2011, 26, 1367–1374. [Google Scholar] [CrossRef] [PubMed]
- Kondrup, J.; Allison, S.P.; Elia, M.; Vellas, B.; Plauth, M. Espen guidelines for nutrition screening 2002. Clin. Nutr. 2003, 22, 415–421. [Google Scholar] [CrossRef]
- Kaysen, G.A.; Rathore, V.; Shearer, G.C.; Depner, T.A. Mechanisms of hypoalbuminemia in hemodialysis patients. Kidney Int. 1995, 48, 510–516. [Google Scholar] [CrossRef] [PubMed]
- Woodrow, G.; Oldroyd, B.; Smith, M.A.; Turney, J.H. Measurement of body composition in chronic renal failure: Comparison of skinfold anthropometry and bioelectrical impedance with dual energy X-ray absorptiometry. Eur. J. Clin. Nutr. 1996, 50, 295–301. [Google Scholar] [PubMed]


| Variable | Total (n = 144) | Survivor (n = 91) | Non-Survivor (n = 53) | p-Value |
|---|---|---|---|---|
| Male, n (%) | 77 (53.5) | 41 (45.1) | 36 (67.9) | 0.010 |
| Age (years) | 57.9 ± 12.5 | 53.5 ± 12.2 | 65.3 ± 9.1 | <0.001 |
| Cause of ESRD, n (%) | 0.043 | |||
| Hypertension | 36 (25.0) | 21 (23.1) | 15 (28.3) | |
| Diabetes mellitus | 67 (46.5) | 36 (39.6) | 31 (58.5) | |
| Glomerular nephritis | 13 (9.1) | 12 (13.2) | 1 (1.9) | |
| Polycystic kidney disease | 3 (2.1) | 3 (3.3) | 0 (0.0) | |
| Unknown | 25 (17.4) | 19 (20.9) | 6 (11.3) | |
| Years of dialysis | 4.26 ± 4.00 | 3.97 ± 3.88 | 4.83 ± 4.20 | 0.260 |
| Kt/V | 1.70 ± 0.39 | 1.75 ± 0.45 | 1.60 ± 0.23 | 0.041 |
| Comorbidity, n (%) | ||||
| Coronary artery disease | 28 (19.4) | 11 (12.1) | 17 (32.1) | 0.006 |
| Congestive heart failure | 19 (13.2) | 8 (8.8) | 11 (20.8) | 0.071 |
| Peripheral vascular disease | 2 (1.4) | 1 (1.1) | 1 (1.9) | 0.602 |
| Cerebral vascular disease | 14 (9.7) | 7 (7.9) | 7 (13.5) | 0.382 |
| Chronic pulmonary disease | 2 (1.4) | 2 (2.2) | 0 (0.0) | 0.532 |
| Connective tissue disorder | 6 (4.2) | 4 (4.4) | 2 (3.8) | 1.000 |
| Peptic ulcer disease | 20 (13.9) | 9 (9.9) | 11 (20.8) | 0.083 |
| Liver disease | 12 (8.3) | 6 (6.6) | 6 (11.3) | 0.725 |
| Diabetes mellitus | 74 (51.3) | 42 (46.2) | 32 (60.5) | 0.051 |
| Hemiplegia | 2 (1.4) | 1 (1.1) | 1 (1.9) | 1.000 |
| Charlson comorbidity index | 4.72 ± 2.07 | 4.06 ± 1.74 | 5.85 ± 2.11 | <0.001 |
| Cause of death | ||||
| Cardiovascular cause | 3 (5.7) | |||
| Sudden cardiac death | 13 (24.5) | |||
| Cerebrovascular disease | 4 (7.5) | |||
| Infection | 13 (24.5) | |||
| Malignancy | 2 (3.8) | |||
| Suicide or other | 1 (1.9) | |||
| Unknown | 17 (32.1) |
| Variable | Male | Female | ||||||
|---|---|---|---|---|---|---|---|---|
| Total (n = 77) | Survivor (n = 41) | Non-Survivor (n = 36) | p-Value | Total (n = 67) | Survivor (n = 50) | Non-Survivor (n = 17) | p-Value | |
| BMI (kg/m2) | 22.1 ± 2.6 | 22.3 ± 2.6 | 21.7 ± 2.6 | 0.329 | 21.1 ± 3.4 | 20.8 ± 3.3 | 21.9 ± 3.4 | 0.225 |
| TSF (mm) | 7.8 ± 3.5 | 7.8 ± 3.5 | 7.8 ± 3.4 | 0.916 | 12.3 ± 6.2 | 12.2 ± 6.2 | 12.4 ± 6.5 | 0.904 |
| MAMC (cm) | 26.3 ± 2.2 | 26.8 ± 2.1 | 25.7 ± 2.1 | 0.027 | 23.6 ± 1.9 | 23.5 ± 2.2 | 23.7 ± 1.3 | 0.759 |
| PBF (%) | 20.0 ± 7.5 | 18.7 ± 8.3 | 21.6 ± 6.1 | 0.090 | 26.6 ± 10.3 | 26.1 ± 9.9 | 28.2 ± 9.9 | 0.461 |
| TBFI (kg/m2) | 4.8 ± 1.9 | 4.8 ± 2.2 | 4.9 ± 1.6 | 0.852 | 5.9 ± 3.0 | 5.7 ± 2.9 | 6.3 ± 3.4 | 0.498 |
| MMI (kg/m2) | 9.5 ± 1.5 | 9.7 ± 1.8 | 9.2 ± 1.1 | 0.159 | 8.1 ± 0.9 | 8.1 ± 0.9 | 8.0 ± 1.0 | 0.705 |
| Variable | Total (n = 144) | Survivor (n = 91) | Non-Survivor (n = 53) | p-Value |
|---|---|---|---|---|
| MIS | 5.5 ± 2.3 | 5.2 ± 2.3 | 6.1 ± 2.1 | 0.039 |
| nPCR (g/kg/day) | 1.07 ± 0.23 | 1.10 ± 0.24 | 1.01 ± 0.21 | 0.048 |
| Hemoglobin (g/dL) | 10.8 ± 1.1 | 10.7 ± 1.0 | 10.9 ± 1.2 | 0.271 |
| Albumin (g/dL) | 3.47 ± 0.28 | 3.50 ± 0.28 | 3.41 ± 0.28 | 0.080 |
| Prealbumin (mg/dL) | 29.5 ± 5.5 | 30.1 ± 5.1 | 28.4 ± 5.9 | 0.083 |
| Creatinine (mg/dL) | 10.8 ± 2.9 | 11.2 ± 2.9 | 10.3 ± 2.6 | 0.057 |
| Urea nitrogen (mg/dL) | 72.7 ± 20.7 | 73.7 ± 21.3 | 71.1 ± 19.5 | 0.456 |
| Calcium (mg/dL) | 9.1 ± 0.6 | 9.2 ± 0.6 | 9.0 ± 0.5 | 0.042 |
| Phosphorous (mg/dL) | 4.91 ± 1.67 | 5.07 ± 1.80 | 4.64 ± 1.40 | 0.136 |
| C-reactive protein (μg/dL) | 0.27 ± 0.50 | 0.25 ± 0.50 | 0.31 ± 0.50 | 0.511 |
| Zinc (μg/dL) | 77.2 ± 14.7 | 76.6 ± 15.1 | 76.6 ± 14.2 | 0.689 |
| Iron (μg/dL) | 73.7 ± 37.4 | 74.1 ± 36.7 | 72.9 ± 38.9 | 0.863 |
| TIBC (μg/dL) | 189.4 ± 29.9 | 189.2 ± 26.2 | 189.7 ± 35.9 | 0.924 |
| Ferritin (ng/mL) | 635.1 ± 425.1 | 590.3 ± 415.4 | 711.2 ± 434.9 | 0.101 |
| Variable | Total (n = 144) | Survivor (n = 91) | Non-Survivor (n = 53) | p-Value |
|---|---|---|---|---|
| Energy (kcal/kg/day) | 25.8 ± 5.4 | 26.7 ± 5.8 | 24.3 ± 4.2 | 0.009 |
| Protein (g/kg/day) | 0.88 ± 0.23 | 0.91 ± 0.21 | 0.82 ± 0.24 | 0.020 |
| Protein (g/1000 kcal) | 34.0 ± 5.8 | 34.2 ± 5.7 | 33.7 ± 6.0 | 0.593 |
| Energy intake/energy requirement (%) | 75.9 ± 15.8 | 77.5 ± 16.3 | 73.5 ± 14.6 | 0.116 |
| Protein intake/protein requirement (%) | 72.5 ± 20.6 | 75.3 ± 20.1 | 67.9 ± 20.7 | 0.037 |
| Carbohydrate (%) | 60.3 ± 7.0 | 60.8 ± 7.1 | 59.4 ± 6.5 | 0.237 |
| Protein (%) | 13.7 ± 2.4 | 13.7 ± 2.4 | 13.5 ± 2.4 | 0.452 |
| Fat (%) | 25.9 ± 5.1 | 25.4 ± 5.4 | 26.7 ± 4.2 | 0.127 |
| Predictor Variable | Hazard Ratio (95% CI) | p-Value | |
|---|---|---|---|
| Non-nutritional | Age | 1.080 (1.048,1.112) | <0.001 |
| Male | 1.977 (1.110,3.522) | 0.021 | |
| Years of dialysis | 1.041 (0.976,1.110) | 0.225 | |
| Diabetes mellitus | 1.814 (1.046,3.147) | 0.034 | |
| CCI | 1.335 (1.203,1.481) | <0.001 | |
| Kt/v | 0.395 (0.160,0.974) | 0.044 | |
| Nutritional | MIS (>5 vs. ≤5) | 2.249 (1.289, 3.924) | 0.004 |
| BMI (<23 vs. ≥23 kg/m2) | 1.031 (0.579, 1.836) | 0.917 | |
| nPCR (<1.0 or >1.4. vs. 1–1.4 g/kg/day) | 1.087 (0.634, 1.864) | 0.760 | |
| Albumin (<3.8 vs. ≥3.8 g/dL) | 2.167 (0.782, 6.044) | 0.137 | |
| Energy intake (<25 vs. ≥25 kcal/kg) | 2.314 (1.326, 4.038) | 0.003 | |
| Protein intake (<0.8 vs. ≥0.8 g/kg) | 1.735 (1.012, 2.975) | 0.045 | |
| Predictor Variable | Hazard Ratio (95% CI) | p-Value | |
|---|---|---|---|
| Model 1 | MIS > 5 | 2.146 (1.173, 3.928) | 0.013 |
| Energy intake <25 kcal/kg | 1.860 (1.018, 3.399) | 0.044 | |
| Model 2 | MIS > 5 | 2.290 (1.240, 4.229) | 0.008 |
| Protein intake (<0.8 g/kg) | 1.345 (0.769, 2.353) | 0.299 |
© 2017 by the authors. Licensee MDPI, Basel, Switzerland. This article is an open access article distributed under the terms and conditions of the Creative Commons Attribution (CC BY) license (http://creativecommons.org/licenses/by/4.0/).
Share and Cite
Kang, S.S.; Chang, J.W.; Park, Y. Nutritional Status Predicts 10-Year Mortality in Patients with End-Stage Renal Disease on Hemodialysis. Nutrients 2017, 9, 399. https://doi.org/10.3390/nu9040399
Kang SS, Chang JW, Park Y. Nutritional Status Predicts 10-Year Mortality in Patients with End-Stage Renal Disease on Hemodialysis. Nutrients. 2017; 9(4):399. https://doi.org/10.3390/nu9040399
Chicago/Turabian StyleKang, Shin Sook, Jai Won Chang, and Yongsoon Park. 2017. "Nutritional Status Predicts 10-Year Mortality in Patients with End-Stage Renal Disease on Hemodialysis" Nutrients 9, no. 4: 399. https://doi.org/10.3390/nu9040399
APA StyleKang, S. S., Chang, J. W., & Park, Y. (2017). Nutritional Status Predicts 10-Year Mortality in Patients with End-Stage Renal Disease on Hemodialysis. Nutrients, 9(4), 399. https://doi.org/10.3390/nu9040399