Abstract
The mobile Food Record (mFR) is an image-based dietary assessment method for mobile devices. The study primary aim was to test the accuracy of the mFR by comparing reported energy intake (rEI) to total energy expenditure (TEE) using the doubly labeled water (DLW) method. Usability of the mFR was assessed by questionnaires before and after the study. Participants were 45 community dwelling men and women, 21–65 years. They were provided pack-out meals and snacks and encouraged to supplement with usual foods and beverages not provided. After being dosed with DLW, participants were instructed to record all eating occasions over a 7.5 days period using the mFR. Three trained analysts estimated rEI from the images sent to a secure server. rEI and TEE correlated significantly (Spearman correlation coefficient of 0.58, p < 0.0001). The mean percentage of underreporting below the lower 95% confidence interval of the ratio of rEI to TEE was 12% for men (standard deviation (SD) ± 11%) and 10% for women (SD ± 10%). The results demonstrate the accuracy of the mFR is comparable to traditional dietary records and other image-based methods. No systematic biases could be found. The mFR was received well by the participants and usability was rated as easy.
1. Introduction
Dietary data provide some of the most valuable insights into the occurrence of disease and subsequent approaches for mounting intervention programs for prevention. Due to the high daily and individual variance of diet, the accurate assessment of dietary intake is more challenging than the measurement of many other environmental exposures. Thus, dietary assessment methods need to continue to evolve to address these challenges [1,2,3]. The rapid uptake of mobile devices by the public offers a suitable platform for dietary assessment [4]. Two branches using images captured by mobile devices to estimate dietary intakes have evolved: image-based and image-assisted methods [5]. While image-assisted methods take images as a reference to adjust participants’ statements made in a 24-h dietary recall or recorded in a dietary record, the image-based methods use the captured images as the primary record of dietary intake [5]. A review of 13 studies that evaluated 10 image-assisted methods among adults aged 18 to 70 years indicated images enhance self-report made using traditional assessment methods by revealing unreported foods and misreporting of portion sizes [6]. Image-based methods integrating either smartphone cameras [7,8] or wearable cameras [9] have potential to provide valid estimates of energy intakes [6]. However, for both image-assisted and image-based methods underreporting can still occur if users miss taking an image or the images are not of sufficient quality [6]. Controlled feeding studies where true intake is known are ideal for validating short-term dietary assessment methods [10]. However, these methods are not practical for capturing intake for longer periods. Thus, biomarkers allow for testing in the community using established reference methods [11]. Doubly labeled water (DLW) which measures total energy expenditure (TEE) can translate to reported energy intake (rEI) under circumstances of energy balance, i.e., no significant weight loss or gain [12] and has been shown to provide an accurate measure under community dwelling conditions [13,14]. To date, there have been few validation studies conducted with either image-assisted or image-based methods [7,9,11]. In all of these studies, the sample size was small and detailed participant usability data was not included.
The mobile food record (mFR), an application designed specifically for assessment of dietary intake, uses the camera of a mobile device to capture food intake and to estimate energy and nutrient intake. After testing the mFR under controlled conditions to ascertain the theoretical functioning [3,4,15,16,17], the Food in Focus study examined the accuracy and usability of the mFR under community dwelling conditions among an adult study sample. The purpose of this study was to evaluate the accuracy of the mFR application as a tool for collecting rEI and its usability under real-life conditions among a diverse sample of healthy men and women aged between 21 and 65 years by using DLW as a recovery biomarker for TEE. The primary aim was to examine whether the dietary estimates for energy generated from 7 days of using the mFR would significantly (p < 0.05) correlate with TEE measured over the corresponding 7 days using DLW. A secondary aim was to determine whether the mean reporting of energy intake from 7 days of using the mFR compared to TEE measured over the corresponding 7 days using DLW would be 90% or greater.
2. Materials and Methods
2.1. Study Participants
Adults aged between 21 and 65 years residing in a Midwest rural county were recruited using flyers posted at community establishments, such as grocery stores, churches, and libraries. In addition, free media inserts to newspapers, church bulletins, and other publications were used. The county includes a large Land Grant university, thus recruitment methods outside the campus area were used to minimize recruitment of highly educated volunteers. Excluded were those who did not meet the age range, who practiced any extreme forms of exercise such as marathon training, and who travelled frequently outside the Midwest region (weekly or bi-monthly basis). An additional exclusion criterion was not having wireless internet access at home. The study methods described here were approved by the Purdue University Biomedical Institutional Review Board, West Lafayette, Indiana, USA on 03/11/2010 as protocol number 0707005629 and informed consent was obtained from all participants.
2.2. Study Design
The participants attended three visits, with a seven days study period between the second and third visit (Figure 1). At the first visit, the consent forms were confirmed. The participants completed questionnaires for characteristics, medical conditions and medications. Trained staff conducted measures of height, weight and bioelectrical impedance using standardized protocols. Participants were shown the menu of foods to be provided. Staff instructed the participants on the fasting conditions for the second visit. Upon completion of the first visit, participants were compensated $10 US.
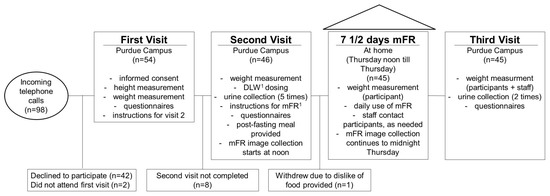
Figure 1.
Study schedule and participant flow of the Food in Focus study. 1 Abbreviations: DLW, doubly labeled water; mFR, mobile food record.
On the second visit, staff weighed the participants. After baseline urine samples were collected, participants drank a mixture containing 1.8 g/kg total body water of 10% H218O and 0.12 g/kg total body water of 99% 2H2O. Postdose urine samples were collected 4.5 and 6 h later, after urine voids were discarded at 1.5 and 3 h. During this time, the participants completed two physical activity questionnaires [18,19] and the Three Factor Eating Questionnaire [20]. After completing the questionnaires, each participant was provided with an iPhone 3GS with the mFR application preinstalled and a fiducial marker [21] (e.g., a checkerboard pattern of known shape, size, and color). The staff asked each participant about his/her usual eating times and accordingly installed three recording reminders. Participants were instructed to capture images prior to consuming any food using the “Before” button and to use the “After” button to capture the end of an eating occasion whether everything was eaten or not. After practicing with the mFR using plastic food replicas, a questionnaire capturing their initial opinions on the usability of the mFR was completed [3,15]. The participants were asked to weigh themselves each day during the remaining 7.5 days of the study using a LifeSource Pro-Fit Precision scale which was provided along with instructions for weighing themselves at home. A Daily Weight Record Booklet and a Things to Remember sheet were provided. After the 8 h fasting period for the DLW dosing, a complimentary meal was provided around 12 noon, which presented an opportunity to theoretically and practically train the participants in recording their eating occasions with the mFR. From this point forward, the participants captured images of every eating occasion up to the midnight prior to the visit 8 days later, resulting in a total of 7.5 days of capturing images with the mFR. Time stamps on the images and final confirmation with the participants allowed a sufficient level of accuracy for confirming this length of use.
Food pack-outs for the remainder of day one and the next two days of the study were distributed. Beyond the foods, the pack-outs included plates, clear glasses and a grey placemat. In the evening of the second total food provision day, the participant returned all uneaten foods from the previous days and picked up the foods for the next three days. The same procedure took place for returning the foods followed by picking up foods for the next two days. The uneaten foods of the last two days were returned on the final third visit. The returned portions were weighed and recorded for each participant. Providing known foods and amounts supported the objective of being able to identify the foods consumed and their amounts as further described in the sections below.
The participants were instructed to eat the foods as they normally would, e.g., they did not have to eat all the foods which were provided, they could eat dinner food items for breakfast. Furthermore, the participants were encouraged to supplement the provided foods with other foods and take images of these foods and beverages as well. For the completion of the second visit, participants received $20 US.
The study staff monitored the incoming images online and texted or emailed the participants, as needed, to make suggestions for improving image quality or if time gaps occurred between images. To monitor time gaps, a program running on the server would generate messages for the staff regarding the receipt of images using the study participant’s usual eating patterns to inform content of the message. The format of the message was “The server has not detected any activity from user #### over the last ## hours”. For each of the seven full study days, the participants received $10 US. At the third visit, the participants were weighed; the two final urine samples collected and two questionnaires assessing the usability of the mFR completed. For this last visit, the participants received $45 US.
2.3. Estimating Energy Content for the Food Pack-Outs
The 61 beverages, foods, and condiments provided in the pack-outs were selected to represent usual food items as informed by frequently consumed foods from the National Health and Nutrition Examination Survey (NHANES) (Table A1). The foods were distributed to fit the participants’ energy needs. The estimated energy requirement (EER) for each individual was estimated using the recommendations of the Institute of Medicine, Food and Nutrition Board for adults ages 19 years and older [22]. All items were pre-weighed and the pack-outs were prepared for energy levels of 2000, 2500, 3000, and 3500 kcal/day. Once the EER was computed, the pack-out just above an individual’s EER was assigned, e.g., a person with a 2300 EER would receive the 2500 pack-out. One participant had an EER above 3500 kcal, thus this pack-out was supplemented with additional foods.
2.4. Description of the mFR
The mFR is an application for mobile devices to capture foods and beverages. The application is based on one of the technology assisted dietary assessment (TADA) protocols [4,21,23]. Crucial for the image analysis is the inclusion of the fiducial marker (FM) in the image [4,24,25]. The dimensions and color markings of the FM are known and used as a reference for the spatial and color calibration of the camera. The FM enables the identification of the foods and beverages as well as the portion-size estimation [25]. The image analysis depends on the angle from which the image is taken. On the screen, two interchangeable color borders, i.e., red or green, signal the user the angle to take the image (Figure 2). The accepted images get automatically uploaded to a central server when connectivity is available. The methods for the automatic food segmentation and identification have been described previously [24]. After the automated identification, the images are returned to the user for review and confirmation. Using the mFR application, the user is prompted to confirm or change the food identification displayed by labeled pins on the food items (Figure 3a). The system presents the user four Suggested Foods, beyond these the user is free to search for other foods in the Complete Food List (Figure 3b). Once confirmed the image with the confirmed pins is automatically sent to the server and disappears from the application. Participants were recommended to complete this process at the end of each day.
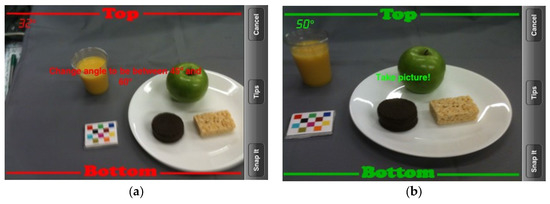
Figure 2.
Image capturing with interchangeable color border indicating the correct angle. (a) The incorrect angle displays as red and (b) the correct angle displays as green.
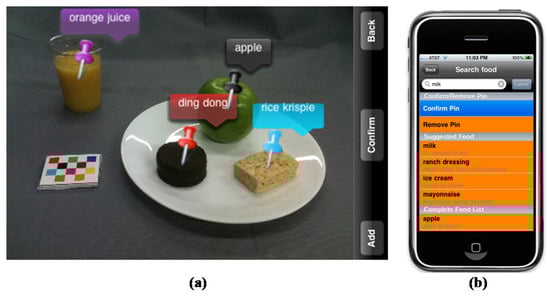
Figure 3.
(a) This stylized image shows the review and confirmation process. Foods are identified with colored pins with matching colored labels; (b) When a pin is touched, the application displays the “confirm/remove pin” screen. For each food, four suggested foods are listed with the first food being the food that the classifier assessed as being the most likely food match. If the exact food is not listed in the top 4, the user can access the “complete food list”.
In general, community dwelling studies comparing dietary intake with DLW do not provide food pack-outs [26,27,28]. This represented a unique component of the study which was testing the automatic identification of foods and amounts. The engineering process of automatically identifying foods and their amounts from images is referred to as the “automated classifier”. Prior to enrolling participants in the Food in Focus study, the automated classifier was trained on the foods and beverages provided in the pack-outs. The images from the study participants informed the automated classifier under community dwelling conditions. The results and progress of this aspect of the study are published elsewhere [21,23,24].
2.5. Total Energy Expenditure
TEE was assessed using DLW as described by DeLany et al. [29]. The rate of CO2 production was calculated [30], and TEE was derived by multiplying by the energy equivalent of a respiratory quotient of 0.86.
2.6. Energy Intake
For this analysis, all before and after images taken by the participants were reviewed by three trained analysts, identifying and estimating all food items in the images according to a standardized protocol which included information about the pack-out menus and confirmation of foods and beverages not provided in the pack-outs. In the case of lacking consensus an adjudicator identified the food code and portion size. Based on these food codes and portion sizes, the reported energy intake (rEI) was estimated using the United States Department of Agriculture (USDA) Food and Nutrient Database for Dietary Studies (FNDDS) version 3.0.
The difference between the distributed and returned food portions was used to estimate the presumed energy intake (pEI) referencing to the energy intake derived solely from the provided foods. All energy data were normally distributed (Kolmogorov-Smirnov test, TEE = 0.121; rEI = 0.179; pEi = 0.106), therefore no transformation was needed. Energy intakes, as mean kcal/day, were compared by sex and method (TEE, rEI, pEI), using a paired t-test. The correlation of TEE and rEI was assessed by the Spearman correlation coefficient.
2.7. Identification/Quantifying of Misreporting
For the identification of misreporters the methods of Black and Cole were used [31]. In the case of accurate reporting the ratio of rEI to TEE was assumed to be 1. rEI values falling above or below the 95% confidence intervals (CI) of the ratio indicated under- or overreporting, respectively. The formula for calculating the 95% CI provided by Black and Cole was used [31]. For the within-subject coefficient of variation for TEE, needed for the calculation of the 95% CI, the value of 1.8% from the OPEN-study was used [32]. The number of under- and overreporters was determined by sex, body mass index (BMI) category, age category, rEI, and TEE. Additionally, Bland–Altman analysis was performed to determine systematic bias introduced by the amount of energy intake [33].
2.8. Statistical Methods
All statistical analyses were performed with IBM® Corporation Released 2015. IBM SPSS Statistics for Windows, Version 23.0. Armonk, NY, USA: IBM® Corporation. Descriptive statistics, such as means, standard deviations (SD) and percentages, stratified by sex were computed for the study sample characteristics. Answers to the questionnaires on usability [3,4,17], assessed before and after using the mFR, were analyzed as counts and percentages and Wilcoxon Signed Ranks test was used for the comparison of the answers before and after the study period. At the final visit, participants were asked an open question about length of time willing to use the mFR in days, weeks, or months. Responses were a single length of time or a span of time, in which case the shortest span of time was used. Overweight and obesity were categorized using the guidelines published by the National Institutes of Health [34].
3. Results
3.1. Characteristics of the Study Sample
From the 98 individuals screened for eligibility by telephone, 54 individuals completed the first visit and 46 the second visit. The reasons for non-participation and discontinuing after the first visit was the time commitment for the dosing of the DLW (n = 8) or not liking the foods provided at the second visit (n = 1) (Figure 1). Therefore, data were collected from 45 adults (15 men, 30 women) between 21 and 63 years of age (Table 1). The mean BMI was 26 kg/m2 (SD = 6) and the mean age was 33 years (SD = 12). The participants were predominantly (73%) non-Hispanic White (Table 1) and were predominantly considered active [35]. Among all participants, the mean weight measured by staff on the first day using the mFR did not significantly differ from the weight measured by staff on the last day of the study (paired t-test, p = 0.694; mean difference −0.06 kg). The percent mean weight change was −0.01% for the total sample (results not shown), with +0.3% for men and −0.2% for women. Forty participants provided images for 7.5 days. One participant sent images for 2.5 days, one participant 5.5 days, two participants 6.5 and, one participant for 7.0 days of the study. The mean was 7.3 days (SD = 0.8).

Table 1.
Characteristics of the Food in Focus study sample (n = 45).
3.2. Energy Intake
Mean values were 2932 kcal/day for TEE and 2353 kcal/day for rEI with a resulting difference of 579 kcal/day (Figure 4). Stratified by sex, the difference between TEE and rEI was greater for men (852 kcal/day) and smaller for women (444 kcal/day). The difference between rEI and pEI was 20 kcal/day among all participants, i.e., 58 kcal/day among men and 1 kcal/day among women (Figure 4). A paired t-test showed a significant difference between the mean daily TEE and rEI (p < 0.0001; mean difference 580 kcal). Median TEE measured by DLW was 2846 kcal and median rEI was 2255 kcal. The Spearman coefficient indicated a moderate statistically significant correlation of 0.58 (p < 0.0001).
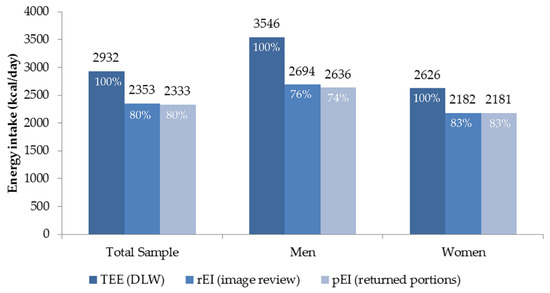
Figure 4.
Comparison of mean total energy expenditure (TEE) based on doubly labeled water (DLW), reported energy intake (rEI) using images from the mobile food record, and presumed energy intake (pEI) based on returned preweighed servings of food over 7 ½ days by total sample (n = 45) and sex (men = 15 and women = 30).
In the images of foods consumed and not provided in the pack-outs, the primary items were sugar sweetened beverages, coffee, tea, and alcohol. A list of the foods recorded and enumerated in the images that were not in the pack-outs is presented in Table A2.
3.3. Energy Misreporting
All participants with values of the ratio rEI:TEE within the 95% CI (0.8–1.2) were classified as accurate reporters, participants with rEI:TEE values below or above the 95% CI as underreporters or overreporters, respectively (Table 2). Accurate reporters comprised 44% of the sample and 2% were overreporters. Across the entire sample, 53% of the participants were classified as underreporters, and the mean underreporting was 563 kcal per day less than TEE measured by DLW. Underreporters showed a mean difference of 1000 kcal/day between rEI (2138 kcal/day) and TEE (3138 kcal/day). The mean difference for accurate reporters was 158 kcal between rEI (2515 kcal/day) and TEE (2673 kcal/day). Men were more likely to be classified as underreporters than women, 73% and 43%, respectively. No clear trend in rEI:TEE emerged either for age or BMI. A larger non-statistically significant proportion of obese participants underreported (60%) than reported accurately (30%) (Table 2).
Table 2.
Levels of reporting accuracy by participants’ characteristics.
The mean percentage of underreporting was 12% for men (SD ± 11%) and 10% for women (SD ± 10%). The Bland–Altman plot does not indicate a systematic bias with an increasing energy intake level (kcal) (Figure 5). The reporting accuracy was consistent over all energy intake levels.
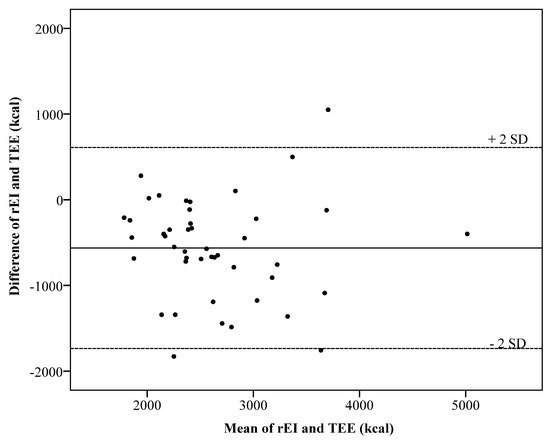
Figure 5.
Bland–Altman plots showing the difference in kcal between the total energy expenditure (TEE) measured using double labeled water (DLW) and reported energy intake (rEI). (SD, standard deviation).
The horizontal axis represents the mean of rEI and TEE in kcal. The vertical axis represents the difference between rEI and TEE in kcal. The solid line represents the mean difference of −563 kcal. The two dashed lines represent the limits of agreement, defined as the mean difference plus and minus 2 times the standard deviation of the difference.
3.4. Usability
Perceptions of using the mFR were assessed before and after the 7.5 study days (Table 3). The majority, 71%, agreed or strongly agreed to the statement: ‘Remembering to take an image before meals would be easy’ before the start of the study. After the week of using the mFR, the agreement rate rose to 100% (p < 0.0001). A similar pattern was observed for the statement on remembering to take the images after meals, with 71% agreeing or strongly agreeing before the study and 76% (p = 0.646) after the study. For remembering to take images of snacks, the agreement before the study was 38% and 47% for images before and after eating, respectively. After the study, the agreement climbed to 80% (p < 0.0001) for before images and 64% (p = 0.065) for after images (Table 3). The perception of being easy to carry a credit card sized fiducial marker remained the same 91% to 93% (p = 0.827), whereas the proportion of individuals thinking the use of the fiducial marker was easy increased from 87% to 96% (p = 0.670).
Table 3.
Perception of usability of the mobile food record (mFR) before and after 7.5 days of recording among adults (n = 45).
Responses to questions completed after using the mFR for 7.5 days are summarized in Table 4. The majority of the responses were positive about the experience of using active image capture of foods eaten, e.g., 84% agreed being comfortable using the application and 96% were confident that the information collected by the TADA iPhone application would only be seen by researchers and not used against the participant.
Table 4.
Responses from adults (n = 45) completing the usability questionnaire after using the mobile food record (mFR) application for 7.5 days.
In an open-ended question, the participants were asked what they liked the most about the mFR. Examples of frequent responses are the mFR is easy to use, labeling of the foods was fun or enjoyable, and it helped them to keep track of what they ate or to restrict their food intake. This latter response was consistent with the response to the question, “Did using the TADA iPhone application make you behave differently than if you didn’t have the TADA iPhone application?” with 69% saying yes. When asked what they liked the least about the mFR, often mentioned was the labeling of foods as too time consuming or the accuracy of the automatically set labels as too low. A number of participants found the connection to the server too slow or it took too long for them to get the images back for reviewing. The set up for an eating occasion using the placemat etc. was too cumbersome or too hard to remember. Many admitted when they were either in a hurry, in a public place or snacking, these situations made them think about not taking an image.
When asked how long they would be willing to use the mFR in days, weeks, or months, all participants indicated a time period within the range of 3 days (n = 1) to 6 months (n = 1). For the number of days, the range was 3–90 days and the mode was 30 days (n = 20). The number of weeks ranged from 0 (n = 1) to 30 (n = 1) with the mode being 4 weeks (n = 19). For months of use, the most frequent response was 1 month (n = 20).
4. Discussion
The dietary estimates for energy generated from 7.5 days of using the mFR were significantly (Spearman correlation coefficient of 0.58, p < 0.0001) correlated with TEE measured over the same time period using DLW. The mean rEI:TEE ratio was 81% for the total sample (men 76%; women 84%), resulting in a mean underreporting among men of 24% among men and 16% among women.
Three prior studies compared TEE to rEI using traditional 7 days dietary records among ideal study samples. McClung et al. [36] studied active young military men (n = 24) and women (n = 2) with a mean age of 23 years. The participants used a Personal Digital Assistant to enter real-time dietary intake. The rEI:TEE ratio among this sample of active military duty adults was 0.92. In another study, 838 women were screened for psychosocial and health issues and motivation [37]. After screening, 22 women with a mean age of 30 years met the eligibility criteria to participate in the study of 7 days of dietary records and DLW dosing. Data were available for analysis from 20 members of the motivated sample of women. The resulting rEI:TEE ratio among this group was 0.94. For the third study, ten dietitians were recruited to complete 7 days of dietary records for comparison to DLW [27]. The average age of this sample of women was 36 years. For comparison, non-dietitian women with a mean age of 33 years were recruited. This non-dietitian group had a rEI:TEE ratio of 0.81. The rEI for the dietitians was not significantly different from TEE; whereas the results for the non-dietitians were significantly different. These authors hypothesized that the dietitian’s professional experience with food likely contributed to the energy intakes not being significantly lower than the energy expenditure. In comparison to the results from the selective individuals in these studies [27,36,37], the rEI:TEE ratio of 0.84 for women in the Food in Focus study suggests a relatively high accuracy.
Using recruitment methods similar to the Food in Focus study, Barnard et al. [28] recruited men and women between 22–59 years with a BMI of 19 to 33 kg/m2. The final sample was smaller, i.e., 7 women and 7 men; otherwise the participants’ characteristics aligned closely to the Food in Focus study. The results of Barnard et al. [28] were similar to the Food in Focus study with regard to no significant relationship between traditional 7 days dietary records and misreporting and BMI. The rEI:TEE for the participants in the Barnard et al. [28] was 0.74 for men compared to 0.76 for men in the Food in Focus study. For women, this same comparison is 0.54 compared to 0.84 in the Food in Focus study. In the Barnard et al. study, higher misreporting was associated with a higher number of dinner foods, younger age, a wider range of foods, and being female. The better results from the Food in Focus study could be due to the lower recording burden associated with the mFR as only one image is needed to capture one food or many foods at any one eating occasion. Unlike Barnard et al. findings, no association with age was found in the Food in Focus study and research would suggest that younger individuals are more likely to embrace using mobile telephones over hand writing [17]. Further, in the case of using the mFR, women recorded more accurately than men; the opposite of results of Barnard et al.
Trabulsi and Schoeller (2001) analysed the reporting accuracy in 30 studies with at least 10 participants comparing TEE to rEI using dietary records [38]. Five studies in this review, involved collection of dietary records over 7 days [39,40,41,42,43]. The level of misreporting ranged from a high of 37% among obese men [40] to a low of 18% among normal weight women [42]. These results would support the mFR as a more accurate method. Of these 5 studies, only one study [43] reported a correlation coefficient result (r = 0.46, <0.01) which was lower than the Spearman correlation coefficient in the Food in Focus study.
Several validation studies of image-assisted methods have been published [5]. Using a DLW protocol, Pettitt et al. [9] found underreporting of 34% when using a micro-camera worn on the ear to assist a 2 days dietary record among 6 study volunteers. The use of the data secured through the micro-camera reduced the underreporting to a mean of 30%. The participants reported not being comfortable wearing the device in public and that it would affect their activities. These reactions contrast sharply to the positive usability and level of comfort responses received for the mFR in the current study where acceptability was high, with 73% of participants willing to participate in another study using the mFR. The SenseCam (Microsoft Research, Redmond, WA, USA) can be used to take images automatically during eating occasions to assist with reporting for a 24-h dietary recall [11]. After complementing the interview results with the captured images, the underreporting was reduced to 9% for the 20 men and 7% for 20 women completing the study. Of interest, participants using the SenseCam did not have the same levels of discomfort expressed by participants using micro-camera described above. The Nutricam Dietary Assessment Method (NuDAM) is an image-based dietary record that also uses voice recording and follow-up telephone calls for detail confirmation. Ten adults with type 2 diabetes participated in a protocol comparing the results of NuDAM to a traditional dietary record and TEE assessed with DLW. The results from NuDAM were equivalent to the written dietary record. Each showed underreporting of 24% among the 6 men and 4 women completing the protocol [7]. NuDAM includes a series of activities that are complex for the user. Given that the system is being designed for individuals diagnosed with diabetes, the effort involved is likely seen as less burdensome, as the individuals preferred NuDAM over the written dietary record. Whereas many of the Food in Focus participants liked confirming the pins on the images in the mFR application, which is similar to one of the steps in NuDAM, other Food in Focus participants wanted this to go faster. The mFR uses as few steps as possible in order to maintain cooperation, which appears to be reflected in the high proportion of participants completing recording for 7.5 days.
In the Food in Focus study, men were more likely to be underreporters than women. Previous studies have not found a consistent pattern of sex influencing underreporting [32,44]. An association of underreporting and overweight was reported by earlier studies using 24-h dietary recalls [13,32,44], these results could not be replicated in this study, which implies that no bias of reporting associated with BMI is introduced by the mFR. Also contrary to previous studies, no systematic bias regarding underreporting and energy intake levels could be seen in the Food in Focus data [32,44]. However, replication in a large sample is necessary to confirm the assumption made on the lack of a systematic reporting bias. The provided menu of the present study may have affected the eating behavior and especially the energy intake of the participants. However, there is no reason to suspect that the accuracy of the mFR would be significantly different if no foods would have been provided. Previous studies have indicated daily biases in food consumption throughout the week. Haines et al. found that from Friday until Sunday, adults aged between 19 and 50 years increased their energy intake about 115 kcal/day [45]. Future analysis aiming to find the sufficient number of recording days for accurate habitual intake estimation should take differences in energy intake throughout the week into account.
Errors on the individual level could be introduced by the DLW method itself. A validation study stated accuracy of 1.3% ± 8.9% SD between TEE measured by DLW and a metabolic chamber, but on the individual level the errors ranged from −17.7% to +12.5% [46]. Moreover, due to the study design, the computation of TEE was based on a mean of 8.5 days, whereas rEI was estimated using individual numbers of recording days. To be able to distinguish between underreporting and true undereating, TEE and weight change should be taken into account. Due to the study duration of 7.5 days, the weekly within-subject variation in weight change might introduce more random error than actual weight change induced by a reduction of body mass [32].
Misreporting of dietary intake with food records is well recognized [47]. Participants in the current study may have misreported by not taking images of some additional food or beverages. Reactivity bias may occur when an individual changes their behavior due to awareness of being measured. A common finding of food records is an increased awareness of diet and behavior changes amongst the participants [48,49], which cannot be ruled out in the current study. In response to an open question on what the participants liked the most about the mFR, 13% mentioned that it helped them to keep track of what they ate or to restrict their food intake. To the question whether the mFR made them behave differently, 69% answered yes. Despite these comments, no large weight changes were observed. However, over longer term, these changes in behavior should be prospectively explored, taking weight change into account and using qualitative questionnaires on the details of behavior change.
Preferences for image-based methods over traditional dietary assessment methods were captured in previous studies [50,51,52]. Using the mFR was considered to be easy by 82% and only 4% stated that the mFR was not enjoyable to use. 73% stated that they would be willing to use the mFR for more than 7 days, with 60% stating a time period ranging between 1 to 6 months. On the question what they liked the least about the mFR, 27% mentioned the labeling of foods as too time consuming or the accuracy of the automatically set labels as too low. 18% found the connection to the server too slow or that it took too long to get the image for reviewing back. Improving non-technology based methods has been challenging in the past. In contrast, the technology concerns expressed by the mFR users, i.e., better connectivity speed for image transfer, faster devices to speed up labeling of foods; have been addressed through the continuous progress made to advance technology. Concurrently, the feedback received from the participants has also been addressed through improved programming. Most of the concerns expressed by participants have been addressed or can be addressed as part of the evidence based process [4]. Unlike systems used in the past, using flexible applications have distinct advantages as issues found during use can be immediately addressed and this level of adaptive response will only continue as systems advance.
For automated identification, capturing the color and texture characteristics of foods is essential. The colored fiducial marker with its standardized size and features plays a crucial role in the automation. Consistent with past studies [3,4], individuals found the fiducial marker easy to use and even identified it as fun.
Unresolved is when and how the underreporting (under picture taking) took place and which foods were missed. The foods supplied met the study participants’ energy needs. The energy difference of the provided foods from the returned foods matched almost exactly the energy content of the foods and beverages assessed in the images. Despite this observation, the foods and beverages in the images included multiple foods that were not supplied by the study. The majority of the foods not provided and visible in the images were energy rich foods, e.g., alcohol, sugar sweetened beverages (Table A2). Consumption of these items on top of the provided food would be consistent with energy intakes being higher than energy balance. Only one individual was above the expected TEE level. The foods included in the images and not provided are often considered socially unacceptable; as such their inclusion in the images would be unexpected. As an explanation, the possibility exists that the study participants may have shared food with friends/family or, consistent with previous studies, participants did not capture all of the food eaten. And since the food was eaten, it could not be returned. As noted by Hebert [53], future studies need to explore responses using different assessment methods and attempt to assess psychological predispositions influencing motivation, expectation, and self-efficacy.
Strengths of this study include DLW as the reference method to validate rEI, the image review process by three trained analysts as well as the combination of qualitative and quantitative methods. Limitations include the small sample size which restricts the analysis of subgroups and therefore the detailed exploration of possible participant related biases introduced by the mFR. The provided menus may have altered usual eating habits of the participants and could have incented participants to eat more. However, this study serves as validation of rEI measures and justifies the implementation of a study recruiting a larger sample.
5. Conclusions
This study amongst 45 community dwelling adults aged between 21 and 65 years assessed the validity of the mFR compared to TEE measured by DLW. The results of lower underreporting demonstrate the accuracy of the mFR when compared to traditional food records and other image-based food records. No systematic biases regarding reporting could be found. This places the mFR in a superior position to other assessment methods. The mFR was well received by the participants and usability was rated as easy, unlike more traditional methods. Some modifications regarding the food labeling and the review process would be helpful to make recording more manageable throughout daily routines.
In the future, the mFR needs to be tested in a larger sample without a provided menu over an extended time period. Such a study would allow confirmation of weight and behavior changes. Furthermore, the analysis of different subgroups would provide more insight on possible participant related reporting biases.
Acknowledgments
This research was supported by NIH, NCI, 1U01CA130784-01; NIH, NIDDK, 1R01-DK073711-01A1, 2R56DK073711-04.
Author Contributions
C.J.B., D.A.K., E.J.D. conceived and designed the study; C.J.B., D.A.K. conducted the human studies component; E.J.C., F.Z., M.B., Z.A. were responsible for the technology used; J.P.D. led the doubly labeled water protocols; C.J.B., M.S., Y.B.S. analyzed the data; M.S., C.J.B., D.A.K. wrote the paper: All authors reviewed, edited, and approved the manuscript.
Conflicts of Interest
The authors declare no conflict of interest. The founding sponsors had no role in the design of the study; in the collection, analyses, or interpretation of data; in the writing of the manuscript, and in the decision to publish the results.
Appendix A
Table A1.
List of 61 beverages/foods/condiments provided to Food in Focus participants.
| Bread, Bagel, Plain | Fruit, Orange, Clementine | Pretzels |
| Bread, English Muffin | Fruit, Orange, Navel | Pudding, Chocolate |
| Bread, Texas Toast | Fruit, Pear, Bartlett, fresh | Rice Krispie Treat |
| Bread, Whole Wheat | Fruit, Strawberries, fresh | Sandwich, Ham and Cheese |
| Cereal, Wheaties | Fruit, Watermelon | Sandwich, Turkey Wrap |
| Cheese, Cream, Plain, condiment pkt | Granola Bar | Sausage, Turkey |
| Cheese, Mozzarella Sticks | Ice Cream, Vanilla Sandwich | Snickers Bar |
| Cookies, Chocolate Chip | Jelly, Strawberry, condiment pkt | Soup, Chicken Noodle |
| Cookies, Snicker Doodle | Juice, Orange | Syrup, Maple, condiment pkt |
| Crackers, Goldfish | Lasagna, Lean Cuisine | Turkey Tettrazini, Stouffer’s |
| Crackers, Saltines | Lemonade | Veg, Broccoli w/cheese sauce |
| Ding Dong, Chocolate Cake Roll | Margarine, condiment pkt | Veg, Carrots, baby |
| Dip, Ranch Dressing, condiment pkt | Mayonnaise, condiment pkt | Veg, Celery, sticks |
| Doritos Chips | Meatloaf, Stouffer’s | Veg, Mixed/Lettuce Salad |
| Dressing, Fat Free Italian, condiment pkt | Milk | Veg, Peas |
| Dressing, Ranch, condiment pkt | Muffins, Mini | Veg, Potatoes, steamed |
| Frozen Fruit Bar | Mustard, condiment pkt | Veg, Tomatoes, Grape |
| Fruit, Apple, red | Pancakes | Yogurt, Mixed Berry |
| Fruit, Banana | Peanut Butter, condiment pkt | Yogurt, Strawberry |
| Fruit, Cocktail | Pizza, Stouffer’s French Bread | |
| Fruit, Grapes | Potato Chips |
Table A2.
List of beverages and foods not provided in Food in Focus pack-outs and appeared in eating occasion images.
| Beer | Margarita |
|---|---|
| Coffee | Marshmallow |
| Coffee latte (unsweetened) | Mellow Yellow/Mountain Dew/Orange Soda |
| Coke Zero/Diet Coke | Powerade |
| Coke/Pepsi | Red Wine |
| Diet Mountain Dew | Reese’s Cup |
| Dr. Pepper | Sprite/7-Up |
| Fruit punch | Tea (sweetened or flavored) |
| Gatorade | Tea (unsweetened) |
| Ginger Ale | Tortilla chips, Tostitos tortilla chips |
| Hawaiian Punch/Cran-Apple Juice/Hi-C | Water |
| Lemonade, Minute Maid Lemonade |
References
- Kirkpatrick, S.I.; Subar, A.F.; Douglass, D.; Zimmerman, T.P.; Thompson, F.E.; Kahle, L.L.; George, S.M.; Dodd, K.W.; Potischman, N. Performance of the Automated Self-Administered 24-h recall relative to a measure of true intakes and to an interviewer-administered 24-h recall. Am. J. Clin. Nutr. 2014, 100, 233–240. [Google Scholar] [CrossRef] [PubMed]
- Martin, C.K.; Correa, J.B.; Han, H.; Allen, H.R.; Rood, J.C.; Champagne, C.M.; Gunturk, B.K.; Bray, G.A. Validity of the remote food photography method (RFPM) for estimating energy and nutrient intake in near real-time. Obesity 2012, 20, 891–899. [Google Scholar] [CrossRef] [PubMed]
- Daugherty, B.L.; Schap, T.E.; Ettienne-Gittens, R.; Zhu, F.M.; Bosch, M.; Delp, E.J.; Ebert, D.S.; Kerr, D.A.; Boushey, C.J. Novel technologies for assessing dietary intake: Evaluating the usability of a mobile telephone food record among adults and adolescents. J. Med. Int. Res. 2012, 14, e58. [Google Scholar] [CrossRef] [PubMed]
- Six, B.L.; Schap, T.E.; Zhu, F.M.; Mariappan, A.; Bosch, M.; Delp, E.J.; Ebert, D.S.; Kerr, D.A.; Boushey, C.J. Evidence-based development of a mobile telephone food record. J. Am. Diet. Assoc. 2010, 110, 74–79. [Google Scholar] [CrossRef] [PubMed]
- Boushey, C.J.; Spoden, M.; Zhu, F.M.; Delp, E.J.; Kerr, D.A. New mobile methods for dietary assessment: Review of image-assisted and image-based dietary assessment methods. Proc. Nutr. Soc. 2016, 12, 1–12. [Google Scholar] [CrossRef] [PubMed]
- Gemming, L.; Utter, J.; Mhurchu, C.N. Image-Assisted Dietary Assessment: A Systematic Review of the Evidence. J. Acad. Nutr. Diet. 2014, 115, 64–77. [Google Scholar] [CrossRef] [PubMed]
- Rollo, M.E.; Ash, S.; Lyons-Wall, P.; Russell, A.W. Evaluation of a mobile phone image-based dietary assessment method in adults with type 2 diabetes. Nutrients 2015, 7, 4897–4910. [Google Scholar] [CrossRef] [PubMed]
- Casperson, S.L.; Sieling, J.; Moon, J.; Johnson, L.A.; Roemmich, J.N.; Whigham, L. A Mobile Phone Food Record App to Digitally Capture Dietary Intake for Adolescents in a Free-Living Environment: Usability Study. JMIR mHealth uHealth 2015, 3, e30. [Google Scholar] [CrossRef] [PubMed]
- Pettitt, C.; Liu, J.; Kwasnicki, R.M.; Yang, G.Z.; Preston, T.; Frost, G. A pilot study to determine whether using a lightweight, wearable micro-camera improves dietary assessment accuracy and offers information on macronutrients and eating rate. Br. J. Nutr. 2016, 115, 160–167. [Google Scholar] [CrossRef] [PubMed]
- Kirkpatrick, S.I.; Potischman, N.; Dodd, K.W.; Douglass, D.; Zimmerman, T.P.; Kahle, L.L.; Thompson, F.E.; George, S.M.; Subar, A.F. The use of digital images in 24-hour recalls may lead to less misestimation of portion size compared with traditional interviewer-administered recalls. J. Nut. 2016, 146, 2567–2573. [Google Scholar] [CrossRef] [PubMed]
- Gemming, L.; Rush, E.; Maddison, R.; Doherty, A.; Gant, N.; Utter, J.; Ni Mhurchu, C. Wearable cameras can reduce dietary under-reporting: Doubly labelled water validation of a camera-assisted 24 h recall. Br. J. Nutr. 2015, 113, 284–291. [Google Scholar] [CrossRef] [PubMed]
- DeLany, J.P. Energy Requirement Methodology. In Nutrition in the Prevention and Treatment of Disease; Coulston, A.M., Boushey, C.J., Ferruzzi, M., Eds.; Academic Press: Cambridge, MA, USA, 2013; pp. 81–95. [Google Scholar]
- Livingstone, M.B.E.; Black, A.E. Markers of the validity of reported energy intake. J. Nutr. 2003, 133, 895S–920S. [Google Scholar] [PubMed]
- Schoeller, D.A. Recent advances from application of doubly labeled water to measurement of human energy expenditure. J. Nutr. 1999, 129, 1765–1768. [Google Scholar] [PubMed]
- Six, B.L.; Mariappan, A.; Schap, T.E.; Kerr, D.A.; Delp, E.J.; Ebert, D.S.; Boushey, C.J. Evaluation of adolescents’ ability to use a mobile telephone food record. J. Am. Diet. Assoc. 2008, 109, A78. [Google Scholar] [CrossRef]
- Aflague, T.F.; Boushey, C.J.; Guerrero, R.T.; Ahmad, Z.; Kerr, D.A.; Delp, E.J. Feasibility and Use of the Mobile Food Record for Capturing Eating Occasions among Children Ages 3–10 Years in Guam. Nutrients 2015, 7, 4403–4415. [Google Scholar] [CrossRef] [PubMed]
- Boushey, C.J.; Harray, A.J.; Kerr, D.A.; Schap, T.E.; Paterson, S.; Aflague, T.; Bosch, R.M.; Ahmad, Z.; Delp, E.J. How Willing Are Adolescents to Record Their Dietary Intake? The Mobile Food Record. JMIR mHealth uHealth 2015, 3, e47. [Google Scholar] [CrossRef] [PubMed]
- Godin, G.; Shephard, R.J. A simple method to assess exercise behavior in the community. Can. J. Appl. Sport Sci. 1985, 10, 141–146. [Google Scholar] [PubMed]
- Ekelund, U.; Sepp, H.; Brage, S.; Becker, W.; Jakes, R.; Hennings, M.; Wareham, N.J. Criterion-related validity of the last 7-day, short form of the International Physical Activity Questionnaire in Swedish adults. Public Health Nutr. 2006, 9, 258–265. [Google Scholar] [CrossRef] [PubMed]
- Stunkard, A.J.; Messick, S. The three-factor eating questionnaire to measure dietary restraint, disinhibition and hunger. J. Psychosom. Res. 1985, 29, 71–83. [Google Scholar] [CrossRef]
- Ahmad, Z.; Bosch, M.; Khanna, N.; Kerr, D.A.; Boushey, C.J.; Zhu, F.; Delp, E.J. A Mobile Food Record For Integrated Dietary Assessment. In Proceedings of the 2nd International Workshop on Multimedia Assisted Dietary Management, Amsterdam, The Netherlands, 15–19 October 2016; pp. 53–62.
- Institute of Medicine Food and Nutrition Board. Dietary Reference Intakes for Energy, Carbohydrate, Fiber, Fat, Fatty Acids, Cholesterol, Protein, and Amino Acids (Macronutrients); The National Academies Press: Washington, WA, USA, 2005. [Google Scholar]
- Zhu, F.; Bosch, M.; Khanna, N.; Boushey, C.J.; Delp, E.J. Multiple hypotheses image segmentation and classification with application to dietary assessment. IEEE J. Biomed. Health Inform. 2015, 19, 377–388. [Google Scholar] [CrossRef] [PubMed]
- Zhu, F.; Bosch, M.; Woo, I.; Kim, S.; Boushey, C.J.; Ebert, D.S.; Delp, E.J. The use of mobile devices in aiding dietary assessment and evaluation. IEEE J. Sel. Top. Signal Process. 2010, 4, 756–766. [Google Scholar] [PubMed]
- Xu, C.; Zhu, F.; Khanna, N.; Boushey, C.J.; Delp, E.J. Image enhancement and quality measures for dietary assessment using mobile devices. In Proceedings of the IS&T/SPIE Conference on Computational Imagin X 8296, San Francisco, CA, USA, 22–26 January 2012.
- Hebert, J.R.; Ebbeling, C.B.; Matthews, C.E.; Hurley, T.G.; Ma, Y.; Druker, S.; Clemow, L. Systematic errors in middle-aged women’s estimates of energy intake: Comparing three self-report measures to total energy expenditure from doubly labeled water. Ann. Epidemiol. 2002, 12, 577–586. [Google Scholar] [CrossRef]
- Champagne, C.M.; Bray, G.A.; Kurtz, A.A.; Monteiro, J.B.; Tucker, E.; Volaufova, J.; Delany, J.P. Energy intake and energy expenditure: A controlled study comparing dietitians and non-dietitians. J. Am. Diet. Assoc. 2002, 102, 1428–1432. [Google Scholar] [CrossRef]
- Barnard, J.A.; Tapsell, L.C.; Davies, P.S.W.; Storlien, L.H. Relationship of high energy expenditure and variation in dietary intake with reporting accuracy of 7 days food records and diet histories in a group of healthy adult volunteers. Eur. J. Clin. Nutr. 2002, 56, 358–367. [Google Scholar] [CrossRef] [PubMed]
- DeLany, J.P.; Kelly, D.E.; Hames, K.C.; Jakicic, J.M.; Goodpaster, B.H. High energy expenditure masks low physical activity in obesity. Int. J. Obes. 2013, 37, 1006–1011. [Google Scholar] [CrossRef] [PubMed]
- Racette, S.B.; Schoeller, D.A.; Luke, A.H.; Shay, K.; Hnilicka, J.; Kushner, R.F. Relative dilution spaces of 2H- and 18O-labeled water in humans. Am. J. Physiol. 1994, 267, E585–E590. [Google Scholar] [PubMed]
- Black, A.E.; Cole, T.J. Biased over- or under-reporting is characteristic of individuals whether over time or by different assessment methods. J. Am. Diet. Assoc. 2001, 101, 70–80. [Google Scholar] [CrossRef]
- Subar, A.F.; Kipnis, V.; Troiano, R.; Midthune, D.; Schoeller, D.A.; Bingham, S.; Sharbaugh, C.O.; Trabulsi, J.; Runswick, S.; Ballard-Barbash, R.; et al. Using intake biomarkers to evaluate the extent of dietary misreporting in a large sample of adults: The OPEN Study. Am. J. Epidemiol. 2003, 158, 1–13. [Google Scholar] [CrossRef] [PubMed]
- Bland, J.M.; Altman, D.G. Statistical methods for assessing agreement between two methods of clinical measurement. Lancet 1986, 1, 307–310. [Google Scholar] [CrossRef]
- National Heart Lung and Blood Institute. Clinical Guidelines on the Identification, Evaluation, and Treatment of Overweight and Obesity in Adults. Available online: www.nhlbi.nih.gov/files/docs/guidelines/ob_gdlns.pdf (accessed on 19 March 2017).
- Amireault, S.; Godin, G. The Godin-Shephard Leisure-Time Physical Activity Questionnaire: Validity evidence supporting its use for classifying healhty adults into active and insufficiently active categories. Percept. Mot. Skills 2015, 120, 1–19. [Google Scholar] [CrossRef] [PubMed]
- McClung, H.L.; Sigrist, L.D.; Smith, T.J.; Karl, J.P.; Rood, J.C.; Young, A.J.; Bathalon, G.P. Monitoring energy intake: A hand-held personal digital assistant provides accuracy comparable to written records. J. Am. Diet. Assoc. 2009, 109, 1241–1245. [Google Scholar] [CrossRef] [PubMed]
- Blanton, C.A.; Moshfegh, A.J.; Baer, D.J.; Kretsch, M.J. The USDA automated multiple-pass method accurately estimates group total energy and nutrient intake. J. Nutr. 2006, 136, 2594–2599. [Google Scholar] [PubMed]
- Trabulsi, J.; Schoeller, D.A. Evaluation of dietary assessment instruments against doubly labeled water, a biomarker of habitual energy intake. Am. J. Physiol. Endocrinol. Metab. 2001, 281, E891–E899. [Google Scholar] [PubMed]
- Prentice, A.M.; Black, A.E.; Coward, W.A.; Davies, H.L.; Goldberg, G.R.; Nurgatroyd, P.R.; Ashford, J.; Sawyer, M.; Whitehead, R.G. High levels of energy expenditure in obese women. Br. Med. J. 1986, 292, 983–987. [Google Scholar] [CrossRef]
- Goris, A.H.; Westerterp-Plantenga, M.S.; Westerterp, K.R. Undereating and underrecording of habitual food intake in obese men: Selective underreporting of fat intake. Am. J. Clin. Nutr. 2000, 71, 130–134. [Google Scholar] [PubMed]
- Livingstone, M.B.; Prentice, A.M.; Strain, J.J.; Coward, W.A.; Ceesay, S.M.; Strain, J.J.; McKenna, P.G.; Nevin, G.B.; Barker, M.E.; Hickey, R.J. Accuracy of weighed dietary records in studies of diet and health. BMJ 1990, 300, 708–712. [Google Scholar] [CrossRef] [PubMed]
- Seale, J.L.; Rumpler, W.V. Comparison of energy expenditure measurements by diet records, energy intake balance, doubly labeled water and room calorimetry. Eur. J. Clin. Nutr. 1997, 51, 856–863. [Google Scholar] [CrossRef] [PubMed]
- Martin, L.J.; Su, W.; Jones, P.J.; Lockwood, G.A.; Tritchler, D.L.; Boyd, N.F. Comparison of energy intakes determined by food records and doubly labeled water in women participating in a dietary-intervention trial. Am. J. Clin. Nutr. 1996, 63, 483–490. [Google Scholar] [PubMed]
- Moshfegh, A.J.; Rhodes, D.G.; Baer, D.J.; Murayi, T.; Clemens, J.C.; Rumpler, W.V.; Paul, D.R.; Sebastian, R.S.; Kuczynski, K.J.; Ingwersen, L.A.; et al. The US Department of Agriculture Automated Multiple-Pass Method reduces bias in the collection of energy intakes. Am. J. Clin. Nutr. 2008, 88, 324–332. [Google Scholar] [PubMed]
- Haines, P.S.; Hama, M.Y.; Guilkey, D.K.; Popkin, B.M. Weekend eating in the United States is linked with greater energy, fat, and alcohol intake. Obes. Res. 2003, 11, 845–849. [Google Scholar] [CrossRef] [PubMed]
- De Jonge, L.; DeLany, J.P.; Nguyen, T.; Howard, J.; Hadley, E.C.; Redman, L.M.; Ravussin, E. Validation study of energy expenditure and intake during calorie restriction using doubly labeled water and changes in body composition. Am. J. Clin. Nutr. 2007, 85, 73–79. [Google Scholar] [PubMed]
- Subar, A.F.; Freedman, L.S.; Tooze, J.A.; Kirkpatrick, S.I.; Boushey, C.; Neuhouser, M.L.; Thompson, F.E.; Potischman, N.; Guenther, P.M.; Tarasuk, V.; et al. Addressing current criticism regarding the value of self-report dietary data. J. Nutr. 2015, 145, 2639–2645. [Google Scholar] [CrossRef] [PubMed]
- Rebro, S.M.; Patterson, R.E.; Kristal, A.R.; Cheney, C.L. The effect of keeping food records on eating patterns. J. Am. Diet. Assoc. 1998, 98, 1163–1165. [Google Scholar] [CrossRef]
- Vuckovic, N.; Ritenbaugh, C.; Taren, D.L.; Tobar, M. A qualitative study of participants’ experiences with dietary assessment. J. Am. Diet. Assoc. 2000, 100, 1023–1028. [Google Scholar] [CrossRef]
- Kikunaga, S.; Tin, T.; Ishibashi, G.; Wang, D.H.; Kira, S. The application of a handheld personal digital assistant with camera and mobile phone card (Wellnavi) to the general population in a dietary survey. J. Nutr. Sci. Vitaminol. 2007, 53, 109–116. [Google Scholar] [CrossRef] [PubMed]
- Wang, D.H.; Kogashiwa, M.; Ohta, S.; Kira, S. Validity and reliability of a dietary assessment method: The application of a digital camera with a mobile phone card attachment. J. Nutr. Sci. Vitaminol. 2002, 48, 498–504. [Google Scholar] [CrossRef] [PubMed]
- Wang, D.H.; Kogashiwa, M.; Kira, S. Development of a new instrument for evaluating individuals’ dietary intakes. J. Am. Diet. Assoc. 2006, 106, 1588–1593. [Google Scholar] [CrossRef] [PubMed]
- Hebert, J.R. Social desirability trait: Biaser or driver of self-reported dietary intake. Am. J. Clin. Nutr. 2016, 116, 1895–1898. [Google Scholar] [CrossRef] [PubMed]
© 2017 by the authors. Licensee MDPI, Basel, Switzerland. This article is an open access article distributed under the terms and conditions of the Creative Commons Attribution (CC BY) license ( http://creativecommons.org/licenses/by/4.0/).