Article

Assessment of Intakes and Patterns of Cooked Oatmeal Consumption in the U.S. Using Data from the National Health and Nutrition Examination Surveys

1
Intertek Scientific & Regulatory Consultancy, Mississauga, ON L5N 2X7, Canada
2
Quaker Oats Center of Excellence, PepsiCo R&D Nutrition Sciences, Barrington, IL 60010, USA
*
Author to whom correspondence should be addressed.
Nutrients 2016, 8(8), 503; https://doi.org/10.3390/nu8080503
Submission received: 21 June 2016 / Revised: 5 August 2016 / Accepted: 10 August 2016 / Published: 17 August 2016

Abstract

:
The objective of the present study was to characterize the consumption of cooked oatmeal in the United States (U.S.) and to determine whether oatmeal consumption is associated with body mass index (BMI). To estimate current intakes of cooked oatmeal in the various age and gender population groups, we used dietary intake data from Day 1 of the U.S. 2009–2010 and 2011–2012 National Health and Nutrition Examination Surveys (NHANES). We also used dietary intake data from Day 1 of the U.S. 2003–2012 NHANES to assess associations between intakes of cooked oatmeal (in g/kg body weight) and NHANES cycle (2003–2004, 2005–2006, 2007–2008, 2009–2010, 2011–2012), age category (3–11 years, 12–18 years, 19–44 years, 45 years+), gender, and BMI classification (underweight, normal weight, overweight, or obese), using a multiple linear regression model. A consumer of oatmeal was defined as any individual who reported the consumption of any amount of oatmeal on Day 1 of the survey. Approximately 6% of the total population consumed oatmeal, with an average intake of 238 g/day of cooked oatmeal among consumers. The greatest prevalence of oatmeal consumption was in infants (14.3%) and older female adults (11.1%). Amongst oatmeal consumers, underweight, normal weight, and overweight individuals consumed significantly more oatmeal than obese individuals. Oatmeal was consumed almost exclusively at breakfast and, among consumers, contributed an average of 54.3% of the energy consumed at breakfast across all age groups examined. The association between oatmeal consumption and BMI is interesting and requires confirmation in future clinical studies.

Graphical Abstract

1. Introduction

Oatmeal is a common whole-grain cereal that is rich in β-glucan, a soluble fiber that has multiple functional and bioactive properties. The consumption of oat β-glucan has been associated with reductions in low-density lipoprotein (LDL)-cholesterol [1,2] and postprandial glucose and insulin levels [3], as well as improvements in subjective measures of appetite [4]. In a study of children aged 2–18 years who had participated in the 2001–2010 United States (U.S.) National Health and Nutrition Examination Surveys (NHANES), those who were oatmeal consumers had better overall diet quality and reduced risks of central adiposity and obesity compared with children who were non-consumers of oatmeal [5]. Likewise, in a study of adults aged 19 years or older who had participated in the 2001–2010 U.S. NHANES, those who were oatmeal consumers had better overall diet quality and lower body weights, waist circumferences, and body mass indices (BMIs) compared with adults who were non-consumers of oatmeal [6]. Therefore, promoting oatmeal consumption may help improve health, and understanding patterns of oatmeal consumption in the U.S. according to age, gender, and BMI can help target those individuals who may benefit from the incorporation of oatmeal into the diet.
In addition to increasing the dietary fiber content of the diet and improving satiety, the consumption of oatmeal may result in a reduction in the energy density of the overall diet which, in turn, may be useful in the management of body weight. The Institute of Medicine (IOM) has established adequate intake (AI) levels for dietary fiber for the various age and gender groups. Accordingly, the recommended intakes for dietary fiber are 19 to 25 g/day for children ages 1–8 years, 26–38 g/day for children and adolescents aged 9–18 years, and 21–38 g/day for adults aged 19 years or older [7]. Despite these recommendations, the consumption of dietary fiber is notably low in the U.S. Based on data from the 2001–2010 NHANES, McGill et al. [8] reported that the mean intakes of dietary fiber were 13.2, 16.1, and 16.1 g/day in children and adolescents aged 4–18 years, adults aged 19–50 years, and adults 51 years of age and older, respectively. These intakes are approximately half of the intakes that are recommended by the IOM and that are endorsed in the 2015 Dietary Guidelines for Americans [9].
In an analysis of the 2009–2010 NHANES data, it was demonstrated that whole-grain cereal was the greatest contributor to dietary fiber intake among individuals with the highest intake of whole grains and that individuals who consumed at least three ounces of whole grains per day were approximately 60–75 times more likely to be in the top tertile of fiber consumption [10]. Therefore, encouraging the consumption of whole-grain cereals may help individuals reach an adequate daily intake of dietary fiber [7].
In the present study, intakes of cooked oatmeal using Day 1 of the 2009–2010 and 2011–2012 NHANES were analyzed to investigate trends in the consumption of cooked oatmeal according to age, gender, and BMI. In addition, a longitudinal analysis was performed by comparing trends in oatmeal consumption, using data from the previous five NHANES cycles (2003–2004, 2005–2006, 2007–2008, 2009–2010, and 2011–2012). Cooked oatmeal is expected to induce a greater viscosity in the upper gastrointestinal system than other oat-based products; thus, the intake of cooked oatmeal, in particular, was of interest, and not the intake of oats used in other applications, such as in muffins, breakfast bars, granola, etc.

2. Materials and Methods

2.1. Survey Description

Cooked oatmeal consumption patterns were analyzed using the 2009–2010 and 2011–2012 NHANES, which are continuous, cross-sectional, population-based surveys that include data on the nutritional and health status of the U.S. population using a representative, multistage, probability sampling design. Detailed descriptions of survey methods and sampling design have been previously described [11]. In brief, NHANES is conducted by the National Center for Health Statistics (NCHS), and participants complete questionnaires that assess dietary behaviors, health history, socioeconomic status, and other demographic information. The NCHS Research Ethics Review Board reviewed and approved all study protocols for NHANES. For the 2009–2010 NHANES, 13,272 individuals were screened, of whom 10,537 (79.4%) were interviewed and 10,253 (77.3%) were examined. For the 2011–2012 NHANES, 13,431 individuals were selected, of whom 9756 (72.6%) were interviewed and 9338 (69.5%) were examined.

2.2. Dietary Assessment

Dietary intake data were collected via 24-h dietary recalls administered on two non-consecutive days (termed Day 1 and Day 2). Day 1 data were collected in person, and Day 2 data were collected by telephone 3–10 days later on a different day of the week. Dietary recall required participants to describe details of all foods and beverages consumed over the previous 24 h, including the time of consumption, the name of the eating occasion (i.e., breakfast, lunch, dinner, snack, or infant feeding), detailed food descriptions, and the amounts of foods consumed. For survey participants younger than six years of age, interviews were conducted with a proxy (who was generally the person most knowledgeable about the survey participant’s intake). For children aged 6–8 years, interviews were conducted with a proxy and with the child present to assist in reporting intake information. For children 9–11 years of age, interviews were conducted with the child and the assistance of an adult familiar with the child’s intake. Participants 12 years of age or older reported their own dietary intakes. Dietary interviewers conducted interviews in English and Spanish, with translators used to conduct interviews in languages other than English and Spanish.
NHANES food codes representative of the consumption of cooked oatmeal were included in the assessment of dietary intakes (Table 1). As can be seen from Table 1, each food code was representative of the intake of cooked (reconstituted) oatmeal, except for code 57804000 (oatmeal cereal, baby food, dry, instant), code 57806100 (oatmeal cereal with bananas, baby food, dry, instant), and code 57806200 (oatmeal cereal with fruit, baby food, dry, instant, toddler). For these three food codes, the amount of cooked (reconstituted) oatmeal that would have been consumed, based on the amount of dry oatmeal that was reported, was estimated by adding 110 mL of water to every 15 g of dry oatmeal (i.e., the conversion factor applied to the dry oatmeal was 8.3). All of the oatmeal intakes presented herein are of cooked (reconstituted) oatmeal; intakes of oats used in other applications, such as in muffins, breakfast bars, granola, etc., were not considered. The oatmeal intakes presented herein are based only on intake data reported on Day 1 of the survey. Thus, a consumer of cooked oatmeal was defined as any individual who reported the consumption of any amount of cooked oatmeal on Day 1 of the survey. In an individual identified as a consumer of cooked oatmeal, the total intake of cooked oatmeal was defined as the total amount of cooked oatmeal that was consumed on Day 1 of the survey, irrespective of the eating occasion. Intakes of cooked oatmeal at each eating occasion (i.e., breakfast, lunch, dinner, snack, infant feeding) also were examined and are presented.
The intakes of oatmeal, including the prevalence of consumption and the mean, 90th percentile, and range of consumption (in grams, kcal, and as a proportion of energy consumed), among respondents identified as consumers of oatmeal are presented for each population group (i.e., all youths (0–18 years), infants (0–2 years), children (3–11 years), male teens (12–18 years), female teens (12–18 years), all adults (19 years+), male adults (19–44 years), female adults (19–44 years), male adults (45 years+), female adults (45 years+), and the total population (all ages)). Appropriate sample weights were applied in all of the analyses.
The distribution of oatmeal consumers by age (ungrouped) was examined. In addition, the top five foods that were most frequently consumed at breakfast when oatmeal also was consumed at breakfast were identified. As a comparison, the top five foods that were most frequently consumed at breakfast in individuals who were not consumers of cooked oatmeal also were examined.

2.3. Prevalence of Oatmeal Consumption—A Longitudinal Assessment

The prevalence of oatmeal consumption for each population group (i.e., infants (0–2 years), children (3–11 years), male teens (12–18 years), female teens (12–18 years), male adults (19–44 years), female adults (19–44 years), male adults (45 years+), female adults (45 years+), and the total population (all ages)) was assessed for five NHANES cycles (2003–2004, 2005–2006, 2007–2008, 2009–2010, and 2011–2012). Trends were examined visually, and NHANES cycle was included as an independent variable in the multiple linear regression model (described in Section 2.4).

2.4. Assessment of the Associations of Independent Variables and Oatmeal Intake

A multiple linear regression model was used to examine the association between oatmeal consumption (total from all eating occasions combined, relative to body weight (in g/kg body weight)) and four main variables, namely (i) NHANES cycle (2003–2004, 2005–2006, 2007–2008, 2009–2010, 2011–2012); (ii) age category (3–11 years, 12–18 years, 19–44 years, 45 years+); (iii) gender; and (iv) BMI classification (underweight, normal weight, overweight, or obese). The BMI of each individual three years of age or older who was identified as an oatmeal consumer was classified using the guidelines of the U.S. Centers for Disease Control and Prevention (CDC) [12]. Adults (19 years+) were classified as either underweight (BMI < 18.5 kg/m2), normal weight (BMI 18.5–24.9 kg/m2), overweight (BMI 25–29.9 kg/m2), or obese (BMI ≥ 30 kg/m2). For children 3–18 years, BMI classifications were based on the CDC classifications for age and gender percentiles [13]. It should be noted that, according to the CDC classifications, the categorization as underweight, normal weight, overweight or obese starts from age three years; hence, the multiple linear regression assessment was restricted to individuals aged three years and older.

2.5. Statistical Analysis

Statistical analyses were conducted using SAS software (version 9.4, SAS Institute Inc., Cary, NC, USA) and SUDAAN software (version 11.0.1, Research Triangle Institute, Research Triangle Park, Durham, NC, USA). For the multiple linear regression, proc regress in SUDAAN was used. Statistical significance was defined as an alpha level of p < 0.05.

3. Results

3.1. Prevalence of Cooked Oatmeal Consumption

The total intakes of cooked oatmeal (in g/day) from all eating occasions (i.e., breakfast, lunch, dinner, snack, and infant feeding) are summarized in Table 2. Of youths aged 0–18 years, the greatest prevalence of oatmeal consumption occurred in infants aged 0–2 years, of whom 14.3% were reported to have consumed oatmeal on Day 1 of the 2-day NHANES (2009–2012). Of adults aged 19 years or older, the greatest prevalence of oatmeal consumption occurred in female adults aged 45 years or older, of whom 11.1% reported the consumption of oatmeal on Day 1 of the two-day NHANES (2009–2012). Among all youths (0–18 years), all adults (19 years of age or older), and the total population, the prevalence of oatmeal consumption on Day 1 of the two-day NHANES (2009–2012) was 4.6%, 6.5%, and 6.0%, respectively. The corresponding mean intakes of cooked oatmeal from all eating occasions, combined, were 182, 251, and 238 g/day, respectively (Table 2) (for reference, one cup of cooked oatmeal is approximately 234 g).
The distribution of individuals reporting the consumption of oatmeal according to age approximated a U- or J-shaped pattern, with a high proportion of oatmeal consumers in the infant (0–2 years) and older adult (45 years or older) age groups and lower proportions of oatmeal consumers in the children, teenagers, and younger adult age groups, respectively (Figure 1). It should be noted that individuals aged 80 years or older are top-coded at 80 years of age, and so their intakes are captured as intakes at 80 years of age.

3.2. Oatmeal Consumption According to Eating Occasion

The number of consumers who reported the consumption of cooked oatmeal at the various eating occasions (i.e., breakfast, lunch, dinner, snack, or infant feeding), as well as the associated intakes (in g/day) of cooked oatmeal, are summarized in Table 3. For all age and gender groups, oatmeal was consumed predominantly at breakfast. Of youths aged 0–18 years, the greatest prevalence of oatmeal consumption at breakfast occurred in infants aged 0–2 years, of whom 9.6% were reported to have consumed oatmeal at breakfast on Day 1 of the two-day NHANES (2009–2012). Of adults aged 19 years or older, the greatest prevalence of oatmeal consumption at breakfast occurred in female adults aged 45 years or older, of whom 10.3% reported the consumption of cooked oatmeal at breakfast on Day 1 of the two-day NHANES (2009–2012). Among all youths (0–18 years), all adults (19 years of age or older), and the total population, the prevalence of oatmeal consumption at breakfast on Day 1 of the two-day NHANES (2009–2012) was 3.7%, 5.8%, and 5.3%, respectively. The corresponding mean intakes of cooked oatmeal at breakfast were 185, 243, and 232 g/day, respectively (for reference, one cup of cooked oatmeal is approximately 234 g). For the lunch, dinner, and snack eating occasions, the prevalence of oatmeal consumption ranged from 0% to 0.5% of individuals surveyed for all age and gender groups, except for infants, for whom 0.8%, 1.3%, and 1.2% of those surveyed were reported to have consumed oatmeal at lunch, dinner, or as a snack, respectively. Also, 3.0% of the infants surveyed were reported to have consumed oatmeal at an “infant feeding” occasion that was not characterized as breakfast, lunch, dinner, or snack.

3.3. Intake of Energy from Cooked Oatmeal at Breakfast

Given that oatmeal was found to be consumed predominantly at breakfast, the intake of energy from oatmeal, as well as the contribution of oatmeal to the total intake of energy consumed at breakfast were assessed (Table 4). Male teens aged 12–18 years and male adults aged 19–44 years were found to have the greatest mean intakes of energy at breakfast from oatmeal, at 266.1 and 267.1 kcal, respectively. Among all youths (0–18 years), all adults (19 years of age or older), and the total population, the intake of energy from the consumption of oatmeal at breakfast on Day 1 of the two-day NHANES (2009–2012) was 162.9, 200.3, and 193.7 kcal, respectively. The contribution of oatmeal to the intake of energy at breakfast ranged from 44.2% to 74.0% at the mean; however, for some individuals in all age groups (except female teens), oatmeal contributed to 100% of the total intake of energy at breakfast on Day 1 of the two-day NHANES.

3.4. Food Choices at Breakfast of Oatmeal Consumers and Non-Consumers

In Table 5, the foods that were co-consumed with oatmeal in individuals for whom oatmeal contributed only to a portion of the energy intake consumed at breakfast are presented. In individuals 18 years and younger, milk/yoghurt was generally the food that was the most frequently consumed with oatmeal at breakfast, followed by fruit juices and fruits. In adults 19 years and older, sugars and sweets were the most commonly consumed foods with oatmeal at breakfast, followed by coffee or tea, fruits, and milk/yoghurt.
In Table 6, the foods that were most frequently consumed at breakfast in individuals who did not consume cooked oatmeal at breakfast are presented. In individuals 18 years and younger, milk/yoghurt was the food that was consumed most frequently, followed by non-oatmeal cereals, and fruit juices. In adults 19 years and older, the most commonly consumed foods were coffee and tea, followed by milk/yoghurt, sugars and sweets, yeast breads, rolls, quick breads, and non-oatmeal cereals.

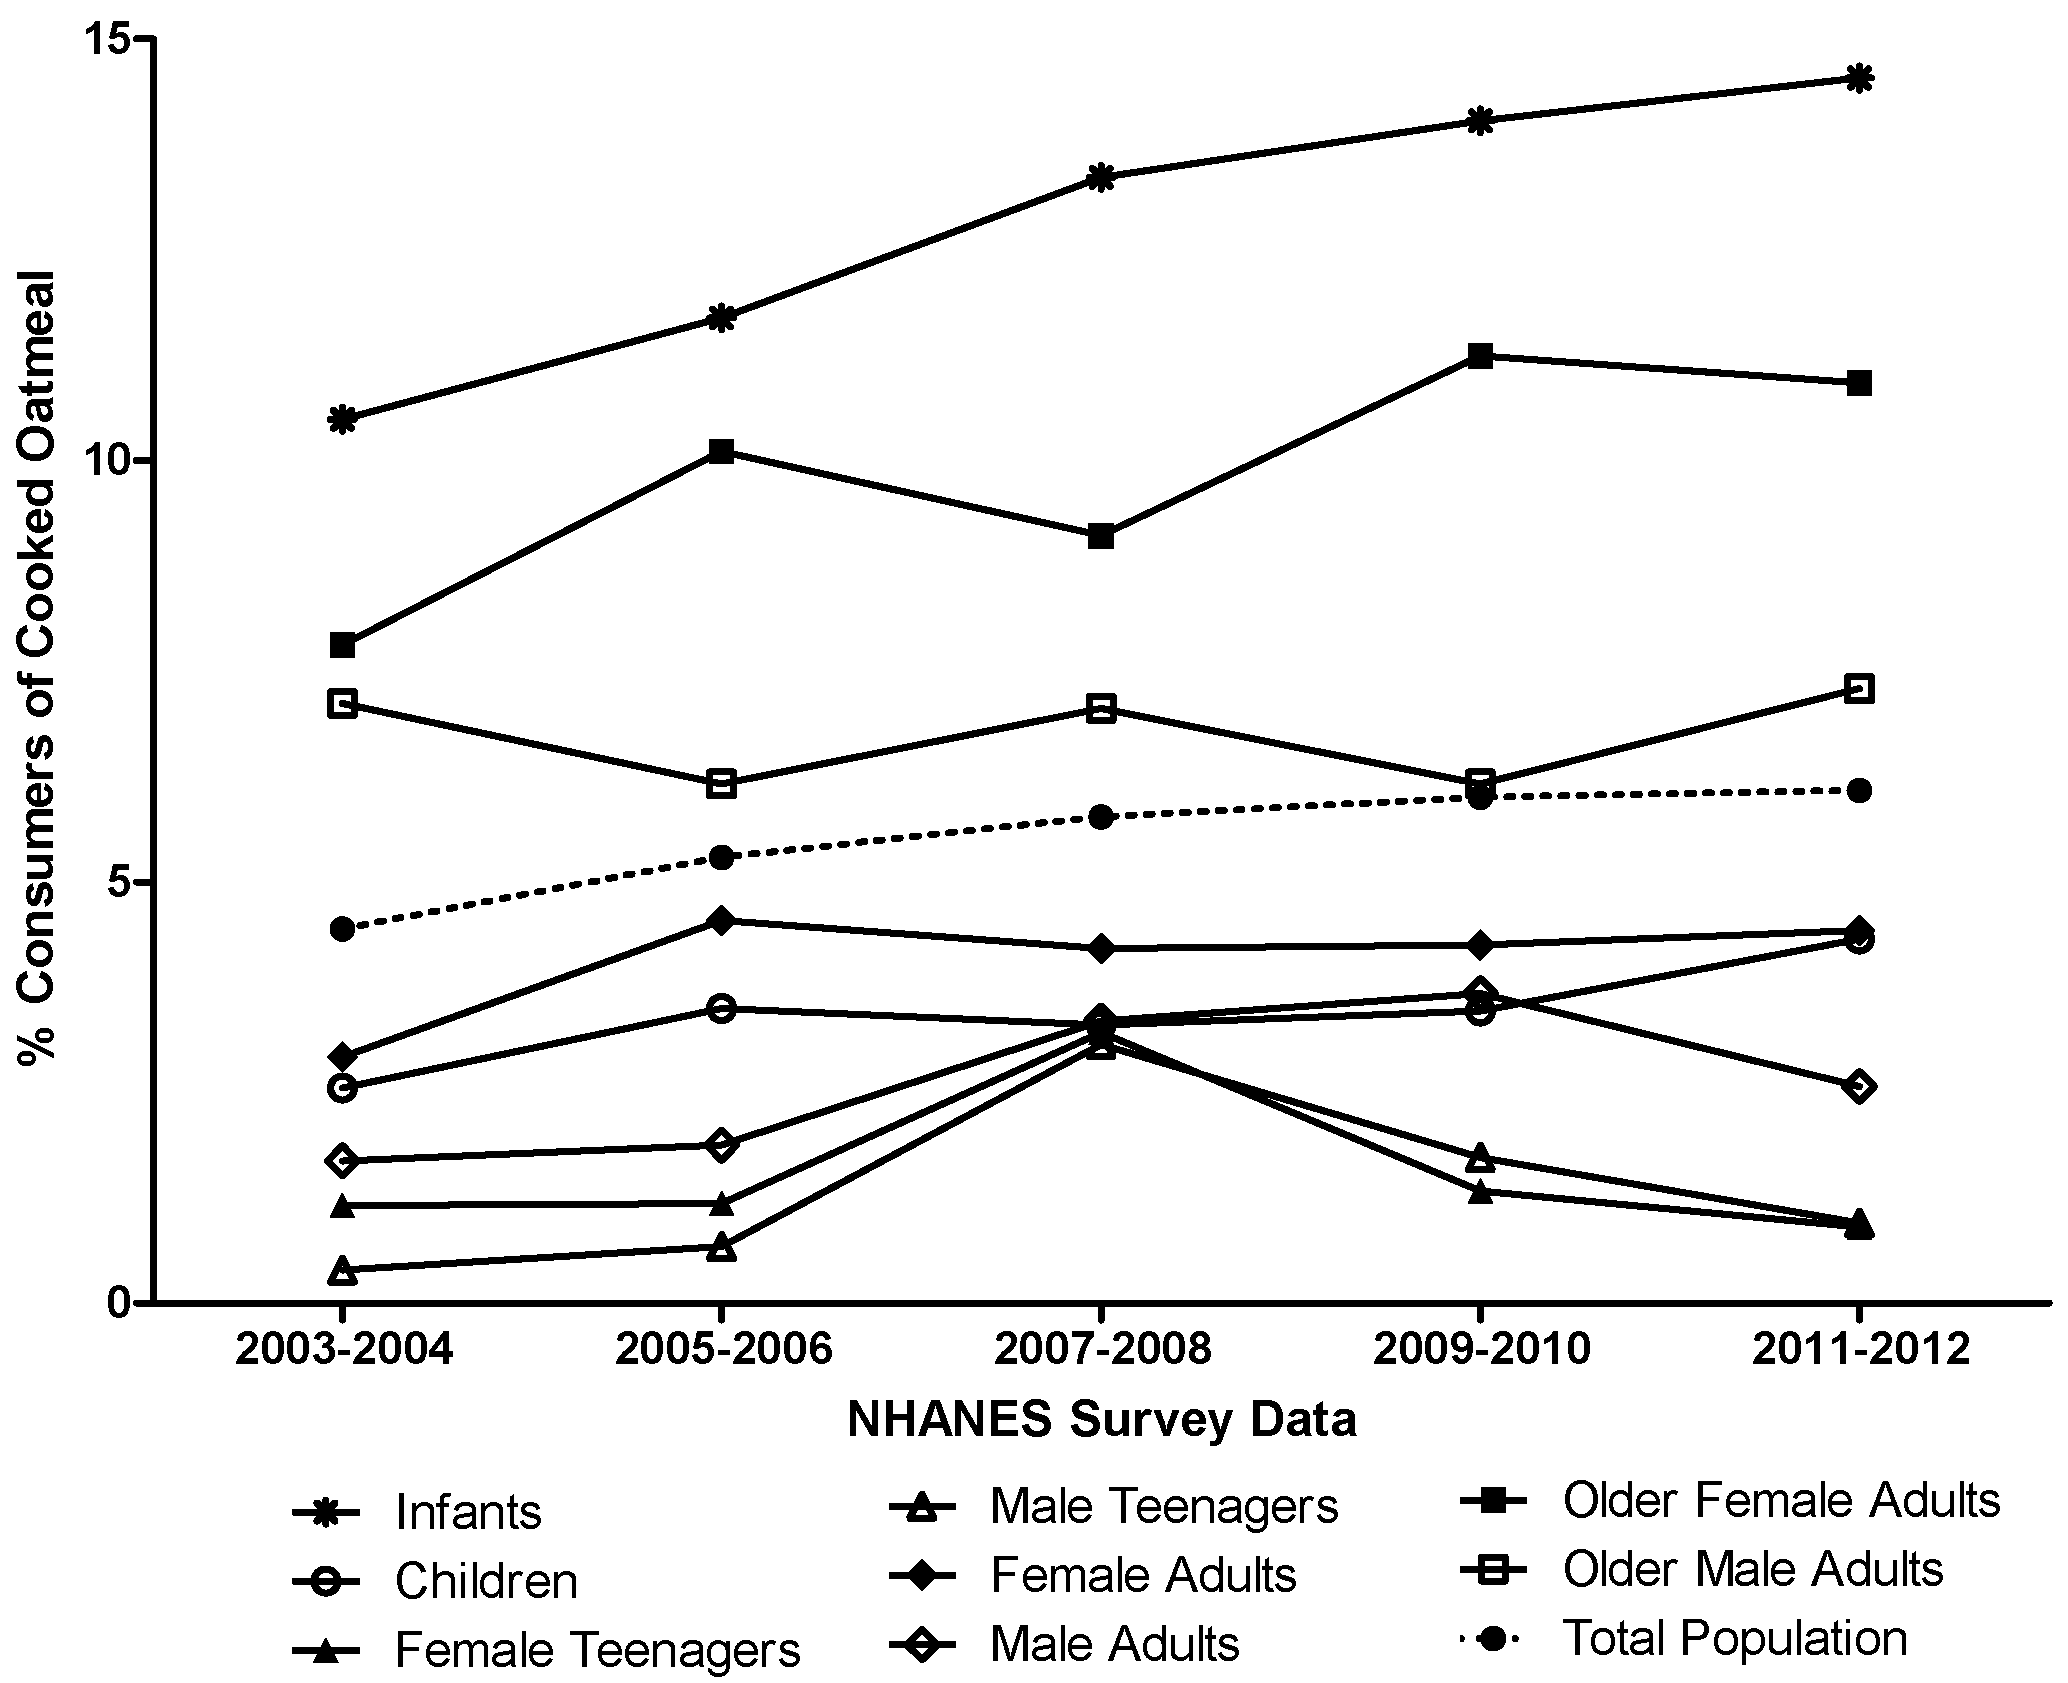
3.5. Longitudinal Assessment of Oatmeal Intake

Among the total population, the percentage of oatmeal consumers remained fairly stable from 2003 to 2012 (Figure 2); in contrast, the percentage of oatmeal consumers increased over time in infants and older female adults and was always greater in these population groups than in the total population (Figure 2). The association between oatmeal consumption (total intake on Day 1, expressed relative to body weight (i.e., g/kg body weight)) in oatmeal consumers and several different variables (namely, age category, gender, NHANES cycle, and BMI category) was assessed using a linear regression model (Table 7). It should be noted that infants were removed from this assessment, given that reference data for the classification of individuals as underweight, normal weight, overweight, or obese are available only for individuals three years of age or older. With regards to gender, males consumed more oatmeal than did females, with the difference nearly approaching statistical significance (p = 0.06). With regards to BMI status, underweight, normal weight, and overweight individuals consumed significantly more oatmeal than did obese individuals. With regards to age, children, teenagers, and young adults consumed significantly more oatmeal than did older adults. The NHANES cycle was not associated with oatmeal intakes. With the inclusion of all of these variables in the model, 39% of the variability in oatmeal consumption was explained.

4. Discussion

Oatmeal contains the soluble fiber β-glucan, which has physiological and bioactive properties that may help in improving blood lipid levels, postprandial insulin, and glucose responses, and subjective measures of satiety. Therefore, understanding the current trends of oatmeal consumption in the U.S. may help in the development of targeted interventions to increase consumption among particular age, gender, and BMI groups. We analyzed data from the 2009–2010 and 2011–2012 NHANES to better understand the consumption of cooked oatmeal in the U.S. Limitations to our study include the cross-sectional design of NHANES, which limits our ability to establish a causal relationship between independent variables and oatmeal intake, and the small sample sizes in some of our groups. Additionally, we assessed oatmeal intakes based on one 24-h recall, which may not reflect the typical dietary patterns of the participants. Furthermore, food intake was self-reported by the participants or their caretakers, who may have under- or over-reported food consumption. Nevertheless, the NHANES is based on a nationally representative random sample of the U.S. population and includes numerous variables, which are key strengths of the survey.
Overall, we found a low prevalence of oatmeal consumption (6.0% of the total population surveyed consumed cooked oatmeal on Day 1 of the survey, Table 2), especially in children, teens, and young adults (19–44 years). Moreover, only 5.3% of the individuals surveyed included cooked oatmeal in their breakfast meal. In our study, oatmeal accounted for approximately 54.3% of the total energy intake at breakfast, indicating that most respondents consumed other food items along with oatmeal for their breakfast meal. The foods that were most commonly co-consumed with oatmeal were milk/yoghurt, fruit juice, and fruit in children and sugars/sweets, coffee/tea, fruits, and milk/yoghurt in adults. In individuals who were not oatmeal consumers, the most commonly consumed foods at breakfast were milk/yoghurt, cereals, fruit juices, and yeast breads/rolls/quick breads in children and coffee/tea, milk/yoghurt, sugars/sweets, and yeast breads/rolls/quick breads in adults. Interestingly, in both adult consumers and non-consumers of oatmeal, the most commonly consumed foods included coffee/tea, milk/yoghurt, and sugars/sweets. Thus, it is likely that sugars/sweets and milk were used in the preparation of coffee/tea in both adult groups. Non-oatmeal cereals and yeast breads/rolls/quick breads were amongst the top five most commonly consumed foods at breakfast in youth and adult non-consumers of oatmeal. Interestingly, fruits were one of the top five foods consumed by adult and youth oatmeal consumers; however, in non-oatmeal consumers, fruits were not one of the top five most commonly consumed foods at breakfast, neither in children nor in adults (fruits ranked as the eighth and ninth most commonly consumed foods in children and adults, respectively). This observation seems consistent with the findings that in children aged 2–18 and adults aged 19 years or older who participated in NHANES (2001–2010), cooked oatmeal consumption was associated with better diet quality [5,6].
In a multiple linear regression analysis, oatmeal consumption (intakes on Day 1 of the survey, standardized according to body weight) amongst oatmeal consumers was found to be significantly greater in underweight, normal weight, and overweight individuals compared to obese individuals. Based on data from 2001–2010 NHANES, it was reported that children aged 2–18 years and adults aged 19 years or older who consumed oatmeal had more favorable body weights/compositions than individuals who did not consume oatmeal [5,6]. In another analysis of NHANES data (1999–2004), it was noted that breakfast consumption was associated with a lower BMI in adult women but not adult men [14,15], and that consumption of ready-to-eat or cooked cereal was associated with a lower BMI and waist circumferences in both genders [16].
Previous studies indicate that increasing the consumption of cereals, including oatmeal, is associated with favorable effects on BMI. In a systematic review of 14 studies, cereal consumption at breakfast was associated with a small but significant decrease in BMI in children and adolescents [17]. In another systematic review investigating breakfast cereal consumption in adults, there was grade B evidence that regular breakfast cereal consumption is associated with a lower BMI and reduced risk for overweight and obesity [18].
Our results indicate that the prevalence of oatmeal consumption at an eating occasion other than breakfast is very low. Other than in infants, the prevalence of consumption of oatmeal at lunch, dinner, or as a snack was 0.5% or less. In several studies, it has been suggested that the consumption of cereals at a meal other than breakfast may be useful for weight management. Mattes [19] demonstrated that when cereal was consumed at breakfast and at either lunch or dinner, there was a greater loss in body weight than when individuals were not given any dietary recommendations to replace meals with cereals. Similarly, Waller et al. [20] reported improved weight loss in individuals who consumed cereal with low-fat milk as a late evening snack compared to controls who were not given any dietary recommendations on what to consume for their late-night snack.
Consumption of oatmeal may help with feeling less hungry, as oatmeal consumption reduced subjective measures of appetite more than a ready-to-eat breakfast cereal in a randomized cross-over trial [21] and consumption of oat β-glucan increased levels of the hunger-suppressing hormone cholecystokinin and decreased subsequent meal intake [3]. These effects are likely to be due, in part, to the high viscosity of β-glucan, which leads to decreased hunger and increased fullness, perhaps by prolonging the transit time and absorption rate of nutrients [22]. Further research should investigate whether there is any causal relationship between oatmeal consumption and BMI or other indicators of health status among children and adults, to validate the favorable associations noted in our study, other cross-sectional studies, and in clinical studies of other cereals. In addition, it is important to determine whether the viscosity the cereal induces in the upper gastrointestinal system is an important determinant of its potential efficacy. In our analysis, we looked only at the intakes of cooked oatmeal, and cooked oatmeal is expected to induce a greater viscosity in the upper gastrointestinal system than other oat-based products, such as cookies, muffins, granola, and muesli.

5. Conclusions

Based on dietary intake data from Day 1 of the 2011–2012 U.S. NHANES, approximately 6% of the total population consumed oatmeal, with an average intake of 238 g/day of cooked oatmeal among consumers. Oatmeal was consumed almost exclusively at breakfast and, among consumers, contributed an average of 54.3% of the energy consumed at breakfast across all age groups examined. Based on dietary intake data from Day 1 of the 2003–2012 NHANES, BMI status was significantly associated with oatmeal consumption among oatmeal consumers, such that underweight, normal weight, and overweight individuals consumed significantly more oatmeal than obese individuals. The association between oatmeal consumption and BMI is interesting, and is consistent with clinical studies in which the consumption of oatmeal was found to induce improvements in subjective measures of satiety. Future clinical studies are needed to determine the effects of regular oatmeal consumption on body weight.

Acknowledgments

Judy Vowles is thanked for her assistance with the formatting of the manuscript. Judith Hill is thanked for her assistance in preparing the list of references.

Author Contributions

K.M.V. and Y.C. conceived the assessments that were undertaken; S.F. conducted the statistical analyses; K.M.V. wrote the manuscript; Y.C. and M.O. provided critical input on the manuscript.

Conflicts of Interest

PepsiCo, Inc. provided funding for the work. Y.C. and M.O. are employees of PepsiCo, Inc., which manufactures oatmeal products under the brand name Quaker Oats®. The views expressed in this article are those of the authors and do not necessarily reflect the opinion or policies of PepsiCo, Inc. K.M.V. and S.F. are employees of Intertek Scientific & Regulatory Consultancy, and have provided consulting services to PepsiCo Inc.

References

  1. Zhang, J.; Li, L.; Song, P.; Wang, C.; Man, Q.; Meng, L.; Cai, J.; Kurilich, A. Randomized controlled trial of oatmeal consumption versus noodle consumption on blood lipids of urban Chinese adults with hypercholesterolemia. Nutr. J. 2012. [Google Scholar] [CrossRef] [PubMed]
  2. Maki, K.C.; Beiseigel, J.M.; Jonnalagadda, S.S.; Gugger, C.K.; Reeves, M.S.; Farmer, M.V.; Kaden, V.N.; Rains, T.M. Whole-grain ready-to-eat oat cereal, as part of a dietary program for weight loss, reduces low-density lipoprotein cholesterol in adults with overweight and obesity more than a dietary program including low-fiber control foods. J. Am. Diet. Assoc. 2010, 110, 205–214. [Google Scholar] [CrossRef] [PubMed]
  3. Beck, E.J.; Tosh, S.M.; Batterham, M.J.; Tapsell, L.C.; Huang, X.F. Oat beta-glucan increases postprandial cholecystokinin levels, decreases insulin response and extends subjective satiety in overweight subjects. Mol. Nutr. Food Res. 2009, 53, 1343–1351. [Google Scholar] [CrossRef] [PubMed]
  4. Rebello, C.J.; Chu, Y.F.; Johnson, W.D.; Martin, C.K.; Han, H.; Bordenave, N.; Shi, Y.; O’Shea, M.; Greenway, F.L. The role of meal viscosity and oat β-glucan characteristics in human appetite control: A randomized crossover trial. Nutr. J. 2014. [Google Scholar] [CrossRef] [PubMed]
  5. O’Neil, C.E.; Nicklas, T.A.; Fulgoni, V.L.; DiRienzo, M.A. Cooked oatmeal consumption is associated with better diet quality, better nutrient intakes, and reduced risk for central adiposity and obesity in children 2–18 years: NHANES 2001–2010. Food Nutr. Res. 2015. [Google Scholar] [CrossRef] [PubMed]
  6. Fulgoni, V.L.; Chu, Y.; O’Shea, M.; Slavin, J.L.; DiRienzo, M.A. Oatmeal consumption is associated with better diet quality and lower body mass index in adults: The National Health and Nutrition Examination Survey (NHANES), 2001–2010. Nutr. Res. 2015, 35, 1052–1059. [Google Scholar] [CrossRef] [PubMed]
  7. Food and Nutrition Board; Institute of Medicine. Dietary, functional and total fiber. In Dietary Reference Intakes for Energy, Carbohydrates, Fiber, Fat, Fatty Acids, Cholesterol, Protein, and Amino Acids; National Academies Press: Washington, DC, USA, 2005. [Google Scholar]
  8. McGill, C.R.; Fulgoni, V.L., III; Devareddy, L. Ten-year trends in fiber and whole grain intakes and food sources for the United States population: National Health and Nutrition Examination Survey 2001–2010. Nutrients 2015, 7, 1119–1130. [Google Scholar] [CrossRef] [PubMed]
  9. Departments of Health and Human Services (DHHS) and Agriculture (USDA). Scientific Report of the 2015 Dietary Guidelines Advisory Committee. Available online: https://health.gov/dietaryguidelines/2015-scientific-report/pdfs/scientific-report-of-the-2015-dietary-guidelines-advisory-committee.pdf (accessed on 15 August 2016).
  10. Reicks, M.; Jonnalagadda, S.; Albertson, A.M.; Joshi, N. Total dietary fiber intakes in the US population are related to whole grain consumption: Results from the National Health and Nutrition Examination Survey 2009 to 2010. Nutr. Res. 2014, 34, 226–234. [Google Scholar] [CrossRef] [PubMed]
  11. Centers for Disease Control and Prevention (CDCP); National Center for Health Statistics (NCHS). National Health and Nutrition Examination Survey (NHANES): 2009–2010. Available online: http://www.cdc.gov/nchs/nhanes/nhanes2009-2010/generaldoc_f.htm (accessed on 15 August 2016).
  12. Centers for Disease Control and Prevention (CDCP); National Center for Health Statistics (NCHS). About BMI for Adults. Available online: https://www.cdc.gov/healthyweight/assessing/bmi/adult_bmi/index.html (accessed on 15 August 2016).
  13. Centers for Disease Control and Prevention (CDCP); National Center for Health Statistics (NCHS). CDC Growth Charts. Available online: http://www.cdc.gov/growthcharts/cdc_charts.htm (accessed on 15 August 2016).
  14. Kant, A.K.; Andon, M.B.; Angelopoulos, T.J.; Rippe, J.M. Association of breakfast energy density with diet quality and body mass index in American adults: National Health and Nutrition Examination Surveys, 1999–2004. Am. J. Clin. Nutr. 2008, 88, 1396–1404. [Google Scholar] [PubMed]
  15. Song, W.O.; Chun, O.K.; Obayashi, S.; Cho, S.; Chung, C.E. Is consumption of breakfast associated with body mass index in US adults? J. Am. Diet. Assoc. 2005, 105, 1373–1382. [Google Scholar] [CrossRef] [PubMed]
  16. O’Neil, C.E.; Nicklas, T.A.; Fulgoni, V.L., III. Nutrient intake, diet quality, and weight/adiposity parameters in breakfast patterns compared with no breakfast in adults: National Health and Nutrition Examination Survey 2001–2008. J. Acad. Nutr. Diet. 2014, 114, S27–S43. [Google Scholar] [CrossRef] [PubMed]
  17. De la Hunty, A.; Gibson, S.; Ashwell, M. Does regular breakfast cereal consumption help children and adolescents stay slimmer? A systematic review and meta-analysis. Obes. Facts 2013, 6, 70–85. [Google Scholar] [CrossRef] [PubMed]
  18. Williams, P.G. The benefits of breakfast cereal consumption: A systematic review of the evidence base. Adv. Nutr. 2014, 5, 636S–673S. [Google Scholar] [CrossRef] [PubMed]
  19. Mattes, R.D. Ready-to-eat cereal used as a meal replacement promotes weight loss in humans. J. Am. Coll. Nutr. 2002, 21, 570–577. [Google Scholar] [CrossRef] [PubMed]
  20. Waller, S.M.; Vander Wal, J.S.; Klurfeld, D.M.; McBurney, M.I.; Cho, S.; Bijlani, S.; Dhurandhar, N.V. Evening ready-to-eat cereal consumption contributes to weight management. J. Am. Coll. Nutr. 2004, 23, 316–321. [Google Scholar] [CrossRef] [PubMed]
  21. Rebello, C.J.; Johnson, W.D.; Martin, C.K.; Xie, W.; O’Shea, M.; Kurilich, A.; Bordenave, N.; Andler, S.; van Klinken, B.J.W.; Chu, Y.-F.; et al. Acute effect of oatmeal on subjective measures of appetite and satiety compared to a ready-to-eat breakfast cereal: A randomized crossover trial. J. Am. Coll. Nutr. 2013, 32, 272–279. [Google Scholar] [CrossRef] [PubMed]
  22. Maljaars, P.W.; Peters, H.P.; Mela, D.J.; Masclee, A.A. Iieal brake: A sensible food target for appetite control. A review. Physiol. Behav. 2008, 95, 271–281. [Google Scholar] [CrossRef] [PubMed]
Figure 1. Distribution of consumers of cooked oatmeal according to the proportion of consumers within each age group. Percentage (%) of total number of respondents within an age year who were identified as consumers of cooked oatmeal within the 2009–2012 NHANES. A respondent was considered a consumer of cooked oatmeal if they consumed any of the foods represented by the food codes listed in Table 1 on Day 1 of the survey. It should be noted that individuals aged 80 years or older are top coded at 80 years of age.
Nutrients 08 00503 g001
Figure 2. Percent of each population group identified as consumers of cooked oatmeal. Percentage of respondents identified as consumers of cooked oatmeal within the 2003–2004, 2005–2006, 2007–2008, 2009–2010, and 2011–2012 cycles of the NHANES. A respondent was considered a consumer of cooked oatmeal if they consumed any of the foods represented by the food codes listed in Table 1 on Day 1 of the survey.
Nutrients 08 00503 g002
Table 1. Food codes representative of cooked oatmeal within the 2003–2012 NHANES databases.
Food CodeDescription
56202960Oatmeal, cooked, NS as to regular, quick or instant; NS as to fat added in cooking
56202970Oatmeal, cooked, quick (1 or 3 min), NS as to fat added in cooking
56202980Oatmeal, cooked, regular, NS as to fat added in cooking
56203000Oatmeal, cooked, NS as to regular, quick or instant, fat not added in cooking
56203010Oatmeal, cooked, regular, fat not added in cooking
56203020Oatmeal, cooked, quick (1 or 3 min), fat not added in cooking
56203030Oatmeal, cooked, instant, fat not added in cooking
56203040Oatmeal, cooked, NS as to regular, quick, or instant, fat added in cooking
56203050Oatmeal, cooked, regular, fat added in cooking
56203060Oatmeal, cooked, quick (1 or 3 min), fat added in cooking
56203070Oatmeal, cooked, instant, fat added in cooking
56203080Oatmeal, cooked, instant, NS as to fat added in cooking
56203110Oatmeal with maple flavor, cooked
56203200Oatmeal with fruit, cooked
56203210Oatmeal, NS as to regular, quick, or instant, made with milk, fat not added in cooking
56203211 aOatmeal, cooked, regular, made with milk, fat not added in cooking
56203212 aOatmeal, cooked, quick (1 or 3 min), made with milk, fat not added in cooking
56203213 aOatmeal, cooked, instant, made with milk, fat not added in cooking
56203220Oatmeal, NS as to regular, quick, or instant, made with milk, fat added in cooking
56203221 aOatmeal, cooked, regular, made with milk, fat added in cooking
56203222 aOatmeal, cooked, quick (1 or 3 min), made with milk, fat added in cooking
56203223 aOatmeal, cooked, instant, made with milk, fat added in cooking
56203230Oatmeal, NS as to regular, quick, or instant, made with milk, NS as to fat added in cooking
56203231 aOatmeal, cooked, regular, made with milk, NS as to fat added in cooking
56203232 aOatmeal, cooked, quick (1 or 3 min), made with milk, NS as to fat added in cooking
56203233 aOatmeal, cooked, instant, made with milk, NS as to fat added in cooking
56203540Oatmeal, made with milk and sugar, Puerto Rican style
56203600Oatmeal, multigrain, cooked, NS as to fat added in cooking
56203610Oatmeal, multigrain, cooked, fat not added in cooking
56203620Oatmeal, multigrain, cooked, fat added in cooking
57804000 bOatmeal cereal, baby food, dry, instant
57806100 bOatmeal cereal with bananas, baby food, dry, instant
57806200 bOatmeal cereal with fruit, baby food, dry, instant, toddler
57823000Oatmeal with applesauce and bananas, baby food, jarred
67304500Prunes with oatmeal, baby food, strained
Abbreviations: NHANES = National Health and Nutrition Examination Survey; NS = not specified; a Food codes were newly added to the 2009 to 2012 NHANES; b Dry oatmeal is cooked by adding 110 mL of water to every 15 g of dry oatmeal. Thus, the conversion factor applied to the dry oatmeal was 8.3.
Table 2. Total intakes of cooked oatmeal from all eating occasions among consumers of cooked oatmeal (data from Day 1 of the 2009–2012 NHANES).
Population Group (Years of Age)Number of Individuals SurveyedConsumers of Cooked Oatmeal
% ConsumersNumber of ConsumersIntake of Cooked Oatmeal (g/Day)
Mean90th PercentileMinMax
All Youths (0–18)74074.64121823303844
Infants (0–2)186314.32641482853844
Children (3–11)34303.912220741320673
Female Teens (12–18)10231.11418833020673
Male Teens (12–18)10911.312326376160520
All Adults (19+)10,8666.570825142451404
Female Adults (19–44)24804.39726242451404
Male Adults (19–44)23823.167316489132936
Female Adults (45+)303711.132821930710792
Male Adults (45+)29676.7216277424291024
Total Population (all)18,2736.0112023842431404
Table 3. Prevalence of consumption and intakes of cooked oatmeal at each eating occasion (data from Day 1 of the 2009–2012 NHANES).
Population Group (Years of Age)Consumers of Cooked Oatmeal
BreakfastLunchDinnerSnack
Number of Consumers (%) bMean Intake (g)Number of Consumers (%) bMean Intake (g)Number of Consumers (%) bMean Intake (g)Number of Consumers (%) bMean Intake (g)
All Youths (0 to 18)298 (3.7)18521 (0.2)14430 (0.3)10935 (0.3)150
 Infants (0 to 2) a168 (9.6)14816 (0.8)9923 (1.3)10526 (1.2)98
 Children (3 to 11)109 (3.7)2043 (0.1)2306 (0.1)1227 (0.1)184
 Female Teens (12 to 18)12 (1.0)1901 (0.1)1761 (0)1760 (0)0
 Male Teens (12 to 18)9 (1.1)3121 (0)4950 (0)02 (0.2)379
All Adults (19+)632 (5.8)24331 (0.3)28827 (0.1)32932 (0.3)286
 Female Adults (19 to 44)84 (3.9)2474 (0.2)2614 (0.1)3319 (0.3)316
 Male Adults (19 to 44)55 (2.3)3023 (0.2)3005 (0.2)3905 (0.5)362
 Female Adults (45+)296 (10.3)21514 (0.4)26112 (0.2)27011 (0.2)196
 Male Adults (45+)197 (6.0)27310 (0.4)3306 (0.1)4137 (0.4)224
Total Population (all)930 (5.3)23252 (0.3)26157 (0.2)24167 (0.3)256
a It should be noted that there were 64 infants (3.0% of infants surveyed) for whom the eating occasion was defined as “infant feeding”; b Values in parentheses indicate the percentage of individuals surveyed who consumed oatmeal at the specific eating occasion on Day 1 of the NHANES (2009–2012). The total number of individuals surveyed in each age and gender group can be found in Table 2.
Table 4. The contribution of cooked oatmeal to the total intake of energy at breakfast in consumers of cooked oatmeal (data from Day 1 of the 2009–2012 NHANES).
Population Group (Years of Age)Consumers of Cooked Oatmeal
Energy Intake at Breakfast (kcal)Contribution of Cooked Oatmeal to the Intake of Energy at Breakfast (%)
Mean90th PercentileMinMaxMean90th PercentileMinMax
All Youths (0 to 18)162.93151.071954.41000.4100
 Infants (0 to 2)117.22221.045053.71000.4100
 Children (3 to 11)189.034217.071953.91004.9100
 Female Teens (12 to 18)192.230063.057644.277.113.677.1
 Male Teens (12 to 18)266.1300153.047674.090.623.9100
All Adults (19+)200.33223.084354.396.41.8100
 Female Adults (19 to 44)223.43893.066264.010011.6100
 Male Adults (19 to 44)267.145396.062359.298.811.6100
 Female Adults (45+)174.528718.065752.390.51.8100
 Male Adults (45+)211.832831.084350.695.34.3100
Total Population (all)193.7322184354.396.40.4100
Table 5. Foods co-consumed with cooked oatmeal at breakfast (data from Day 1 of the 2009–2012 NHANES).
Population Group (Years of Age)Total Number of Oatmeal Breakfast Eating Occasions aTop Five Foods Most Frequently Consumed with Oatmeal at Breakfast b,c
FoodFrequency of Consumption
All Youths (0 to 18)310Milk and yoghurt210
Fruit juices90
Fruits86
Water, noncarbonated74
Sugar and sweets73
All Adults (19+)669Sugars and sweets412
Coffee and tea355
Fruits323
Milk and yoghurt323
Yeast breads, rolls, quick breads165
Total Population (all)979Milk and yoghurt533
Sugars and sweets485
Fruits409
Coffee and tea361
Fruit juices235
a The total number of oatmeal breakfast eating occasions may be slightly larger than the total number of breakfast oatmeal consumers listed in Table 3 if a respondent reported more than one oatmeal eating occasion as breakfast on Day 1 of the 2009–2012 NHANES; b It should be noted that the number of breakfast eating occasions during which only cooked oatmeal was consumed was 24 for all youths (0–18 years), 13 for infants (0–2 years), nine for children (3–11 years), zero for female teens (12–18 years), two for male teens (12–18 years), 35 for all adults (19 years+), 12 for female adults (19–44 years), five for male adults (19–44 years), 11 for female adults (45 years+), seven for male adults (45 years+), and 59 for the total population; c The number of occurrences of other foods co-consumed with cooked oatmeal at breakfast was tallied.
Table 6. Foods most commonly consumed at breakfast in non-consumers of oatmeal (data from Day 1 of the 2009–2012 NHANES).
Population Group (Years of Age)Total Number of Breakfast Eating OccasionsTop Five Foods Most Frequently Consumed in Non-Consumers of Oatmeal
FoodFrequency of Consumption
All Youths (0 to 18)5700Milk and yoghurt4107
Cereals (other than oatmeal)2483
Fruit juices1651
Yeast breads, rolls, quick breads1388
Sugar and sweets1032
All Adults (19+)8257Coffee and tea4636
Milk and yoghurt3796
Sugars and sweets3625
Yeast breads, rolls, quick breads3438
Cereals (other than oatmeal)2243
Total Population (all)14,229Milk and yoghurt7903
Coffee and tea4863
Yeast breads, rolls, quick breads4826
Cereals (other than oatmeal)4726
Sugars and sweets4657
Table 7. Multiple linear regression analysis of the consumption of cooked oatmeal.
Independent Variables aΒ (SE) bp-Value
NHANES Cycle0.01 (0.03)0.83
Age3–11 years5.35 (0.38)<0.0001
12–18 years1.19 (0.37)0.002
19–44 years0.36 (0.16)0.03
45 years+------
GenderMale0.28 (0.14)0.06
Female------
BMIUnderweight3.01 (0.55)<0.0001
Normal weight1.30 (0.13)<0.0001
Overweight0.51 (0.12)0.0001
Obese------
a For age, age 45 years+ was used as the reference; for sex, female was used as the reference; for BMI, obese was used as the reference. The R-squared value for the model including all four independent variables is 0.39; b A positive value means a greater intake relative to the reference.

