Weight-Loss Outcomes: A Systematic Review and Meta-Analysis of Intermittent Energy Restriction Trials Lasting a Minimum of 6 Months


Abstract
:
1. Introduction
2. Materials and Methods
2.1. Data Sources
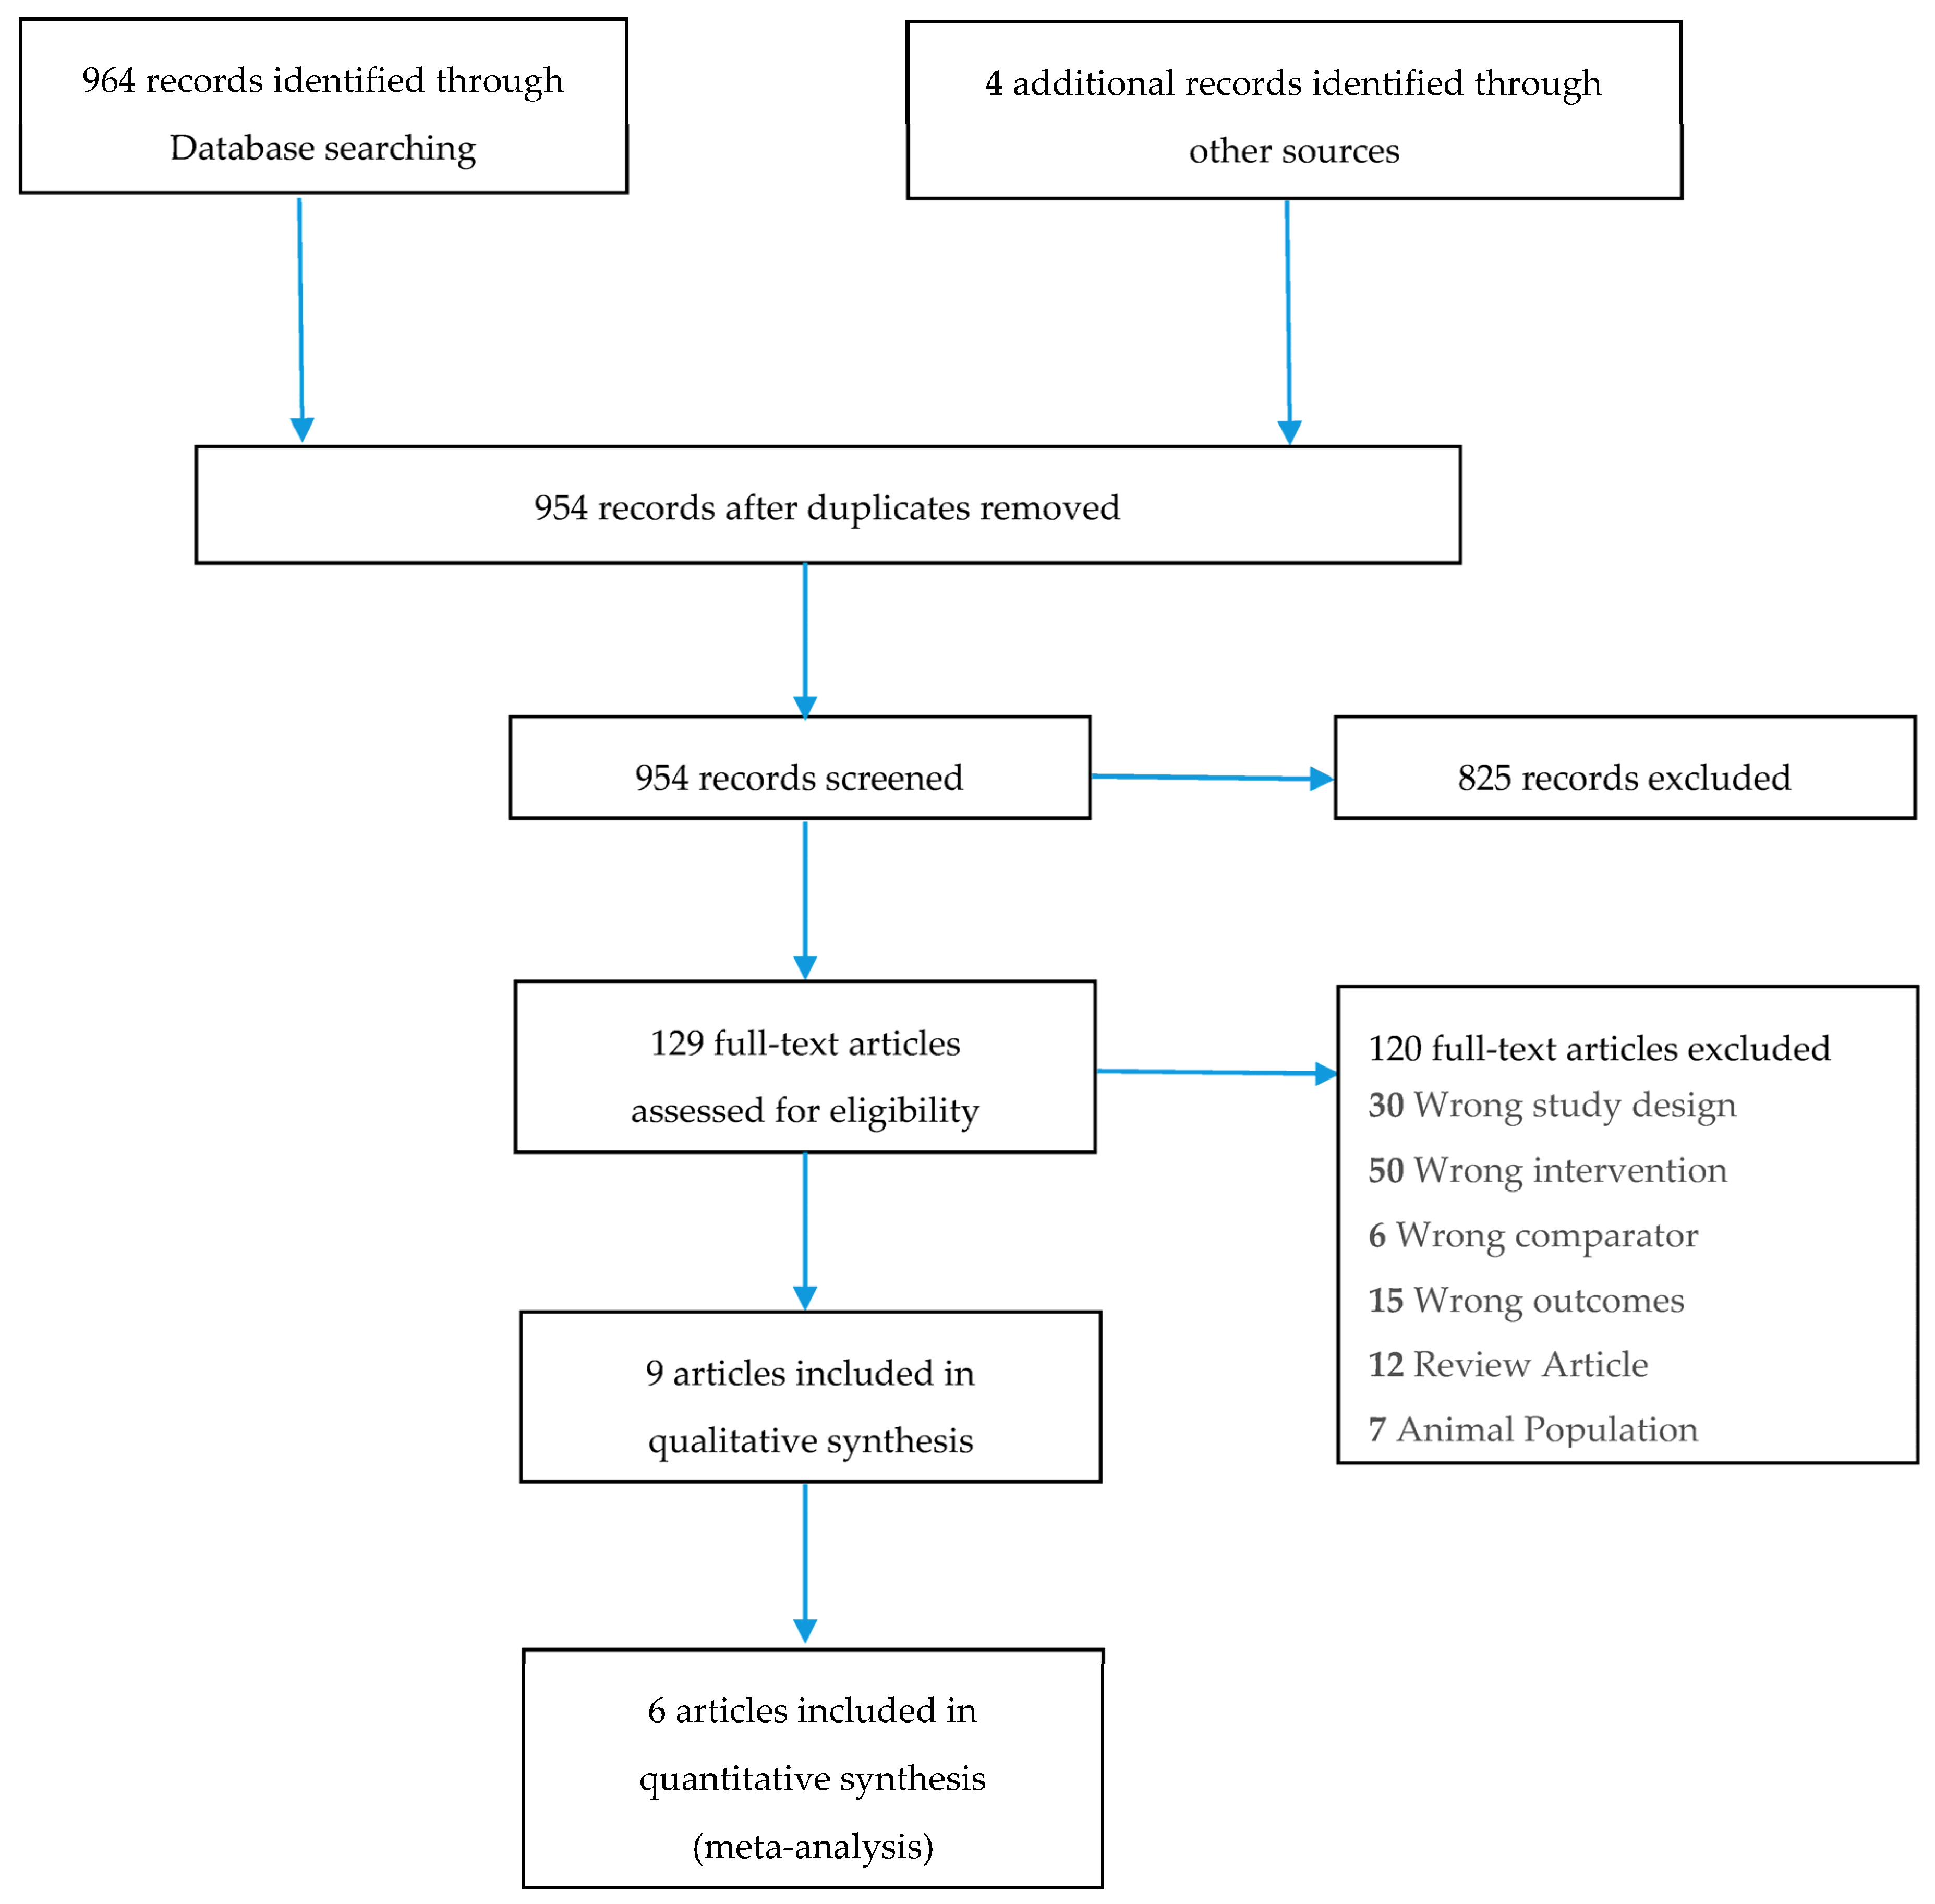
2.2. Study Selection
2.3. Data Analysis
3. Results
3.1. Systematic Review
3.1.1. Adverse Events
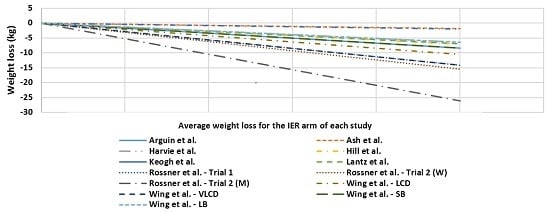
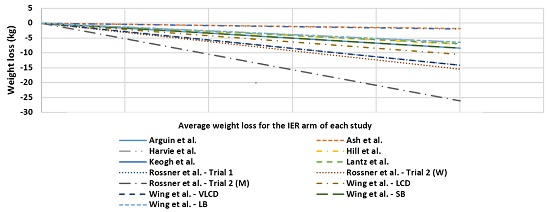
3.1.2. Study Characteristics and Weight Loss
3.1.3. Drop Outs
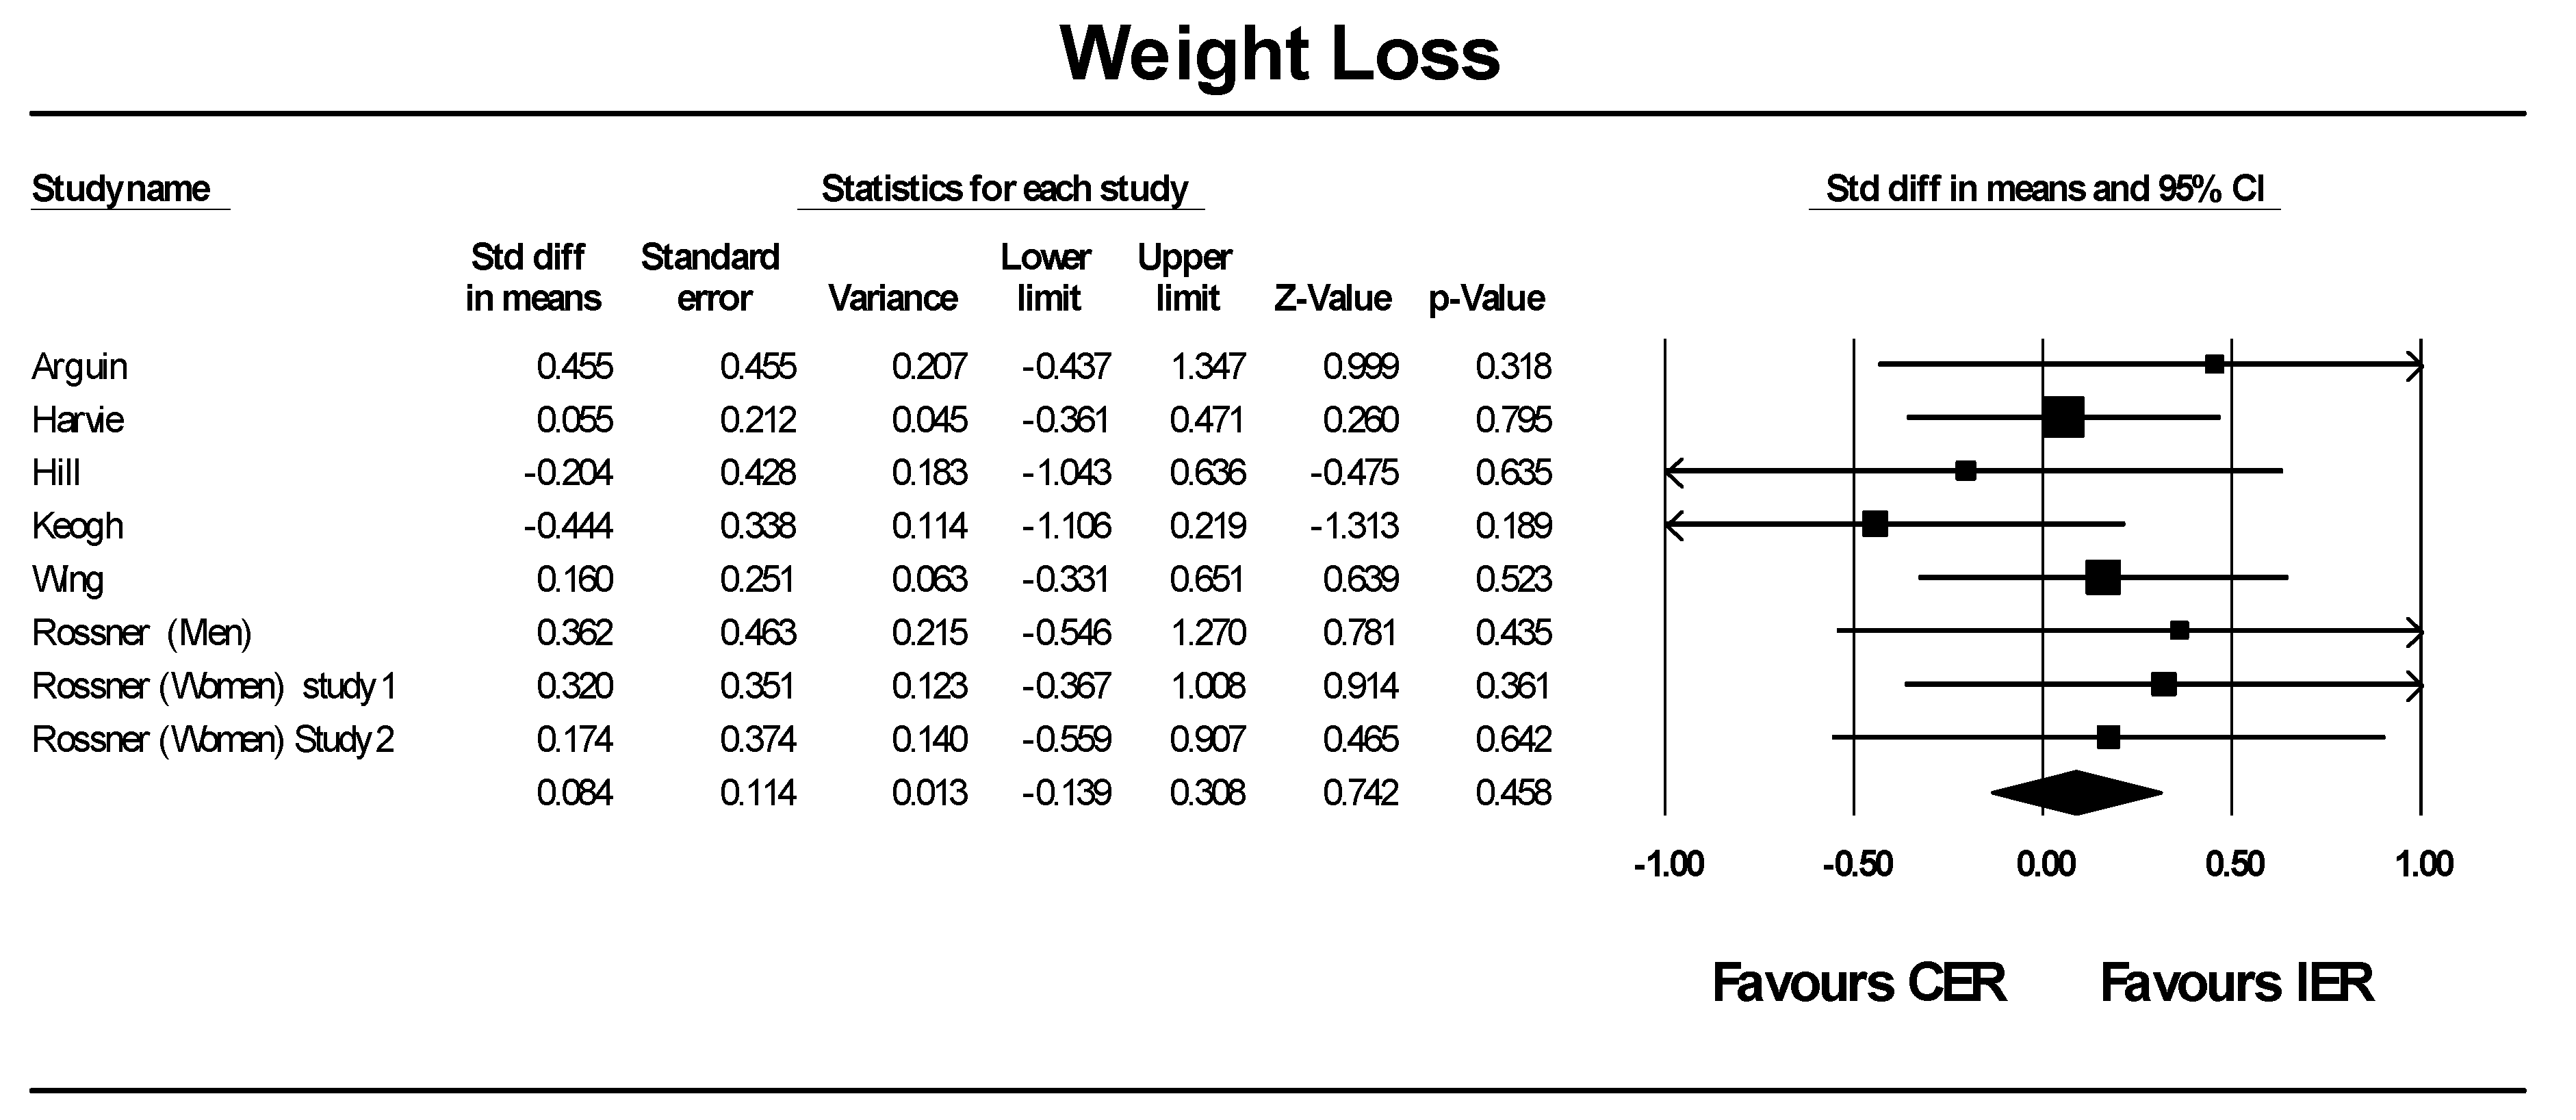
3.2. Meta-Analysis
4. Discussion
5. Conclusions
Acknowledgments
Author Contributions
Conflicts of Interest
Abbreviations
| BC | Body composition |
| BMI | Body mass index |
| BP | Blood pressure |
| BW | Body weight |
| BWMP | Behavioural weight management programs |
| CER | Continuous energy restriction |
| CRP | C-reactive protein |
| FFM | Fat free mass |
| FM | Fat mass |
| HbA1C | Glycated haemoglobin |
| HDL-C | High density lipoprotein cholesterol |
| HOMAR | Homeostatic model assessment of insulin resistance |
| IER | Intermittent energy restriction |
| LDL-C | Low density lipoprotein cholesterol |
| LED | Low energy diet |
| REE | Resting energy expenditure |
| SD | Standard deviation |
| TC | Total cholesterol |
| VLED | Very low energy diet |
| WC | Waist circumference |
References
- World Health Organization. Obesity and Overweight. Available online: http://www.who.int/mediacentre/factsheets/fs311/en/ (accessed on 1 April 2015).
- Fontana, L. Modulating human aging and age-associated diseases. Biochim. Biophys. Acta 2009, 1790, 1133–1138. [Google Scholar] [CrossRef] [PubMed]
- Galani, C.; Schneider, H. Prevention and treatment of obesity with lifestyle interventions: Review and meta-analysis. Int. J. Public Health 2007, 52, 348–359. [Google Scholar] [CrossRef] [PubMed]
- Di Buono, M.; Hannah, J.S.; Katzel, L.I.; Jones, P.J. Weight loss due to energy restriction suppresses cholesterol biosynthesis in overweight, midly hypercholesterolemic men. J. Nutr. 1999, 129, 1545–1548. [Google Scholar] [PubMed]
- Melanson, K.; Gootman, J.; Myrdal, A.; Kiline, G.; Rippe, J.M. Weight loss and total lipid profile changes in overweight women consuming beef or chicken as the primary protein source. Nutrition 2003, 19, 409–414. [Google Scholar] [CrossRef]
- Claessens, M.; van Baak, M.A.; Monsheimer, S.; Saris, W.H. The effect of a low-fat, high-protein or high-carbohydrate ad libitum diet on weight loss maintenance and metabolic risk factors. Int. J. Obes. 2009, 33, 296–304. [Google Scholar] [CrossRef] [PubMed]
- Neter, J.E.; Stam, B.E.; Kok, F.J.; Brobbee, D.E.; Geleijnse, J.M. Influence of weight reduction on blood pressure: A meta-analysis of randomized controlled trials. Hypertension 2003, 42, 878–884. [Google Scholar] [CrossRef] [PubMed]
- Ryan, A.S.; Nicklas, J.B. Reductions in plasma cytokine levels with weight loss improve insulin sensitivity in overweight and obese postmeopausal women. Diabetes Care 2004, 27, 1699–1705. [Google Scholar] [CrossRef] [PubMed]
- Varady, K.A. Intermittent versus daily calorie restriction: Which diet regimen is more effective for weight loss? Obes. Rev. 2011, 12, e593–e601. [Google Scholar] [CrossRef] [PubMed]
- Del Corral, P.; Chandler-Laney, P.C.; Casazza, K.; Gower, B.A.; Hunter, G.R. Effect of dietary adherence with or without exercise on weight loss: A mechanistic approach to a global problem. J. Clin. Endocrinol. Metab. 2009, 94, 1602–1607. [Google Scholar] [CrossRef] [PubMed]
- Varady, K.A.; Hellerstein, M.K. Alternate-day fasting and chronic disease prevention: A review of human and animal trials. Am. J. Clin. Nutr. 2007, 86, 7–13. [Google Scholar] [PubMed]
- Mattson, M.P.; Wan, R. Beneficial effects of intermittent fasting and caloric restriction on the cardiovascular and cerebrovascular systems. J. Nutr. Biochem. 2005, 16, 129–137. [Google Scholar] [CrossRef] [PubMed]
- Health News-NHS Choices. Does the 5:2 Intermittent Fasting Diet Work? Available online: http://www.nhs.uk/news/2013/01January/Pages/Does-the-5-2-intermittent-fasting-diet-work.aspx (accessed on 14 April 2015).
- Seimon, R.V.; Roekenes, J.A.; Zibellini, J.; Zhu, B.; Gibson, A.A.; Hills, A.P.; Wood, R.E.; King, N.A.; Byrne, N.M.; Sainsbury, A. Do intermittent diets provide physiological benefits over continuous diets for weight loss? A systematic review of clinical trials. Mol. Cell. Endocrinol. 2015. [Google Scholar] [CrossRef] [PubMed]
- Wing, R.R. Behavioral approaches to the treatment of obesity. In Handbook of Obesity; Bray, G.A., Bouchard, C., James, P., Eds.; Marcel Dekker Inc.: New York, NY, USA, 1998; pp. 855–873. [Google Scholar]
- Jeffery, R.W.; Drewnowski, A.; Epstein, L.H. Long-term maintenance of weight loss: Current status. Health Psychol. 2000, 19, 5–16. [Google Scholar] [CrossRef] [PubMed]
- Arguin, H.; Dionne, I.J.; Senechal, M.; Bouchard, D.R.; Carpentier, A.C.; Ardilouze, J.L.; Tremblay, A.; Leblanc, C.; Brochu, M. Short- and long-term effects of continuous versus intermittent restrictive diet approaches on body composition and the metabolic profile in overweight and obese postmenopausal women: A pilot study. Menopause 2012, 19, 870–876. [Google Scholar] [CrossRef] [PubMed]
- Ash, S.; Reeves, M.M.; Yeo, S.; Morrison, G.; Carey, D.; Capra, S. Effect of intensive dietetic interventions on weight and glycaemic control in overweight men with type II diabetes: A randomised trial. Int. J. Obes. 2003, 27, 797–802. [Google Scholar] [CrossRef] [PubMed]
- Harvie, M.; Pegington, M. The effects of intermittent or continuous energy restriction on weight loss and metabolic disease risk markers: A randomized trial in young overweight women. Int. J. Obes. 2011, 35, 714–727. [Google Scholar] [CrossRef] [PubMed]
- Hill, J.; Schlundt, D.G.; Sbrocco, T.; Sharp, T.; Pope-Cordle, J.; Stetson, B. Evaluation of an alternating-calorie diet with and without exercise in the treatment of obesity. Am. J. Clin. Nutr. 1989, 50, 248–254. [Google Scholar] [PubMed]
- Keogh, J.B.; Pedersen, E.; Petersen, K.S.; Clifton, P.M. Effects of intermittent compared to continuous energy restriction on short-term weight loss and long-term weight loss maintenance. Clin. Obes. 2014, 4, 150–156. [Google Scholar] [CrossRef] [PubMed]
- Lantz, H.; Peltonen, M.; Agren, L.; Torgerson, J.S. Intermittent versus on-demand use of a very low calorie diet: A randomized 2-year clinical trial. J. Intern. Med. 2003, 253, 463–471. [Google Scholar] [CrossRef] [PubMed]
- Rossner, S. Intermittent vs. continuous vlcd therapy in obesity treatment. Int. J. Obes. Relat. Metab. Disord. 1998, 22, 190–192. [Google Scholar] [CrossRef] [PubMed]
- Wing, R.R.; Blair, E.; Marcus, M.; Epstein, L.H.; Harvey, J. Year-long weight loss treatment for obese patients with type II diabetes: Does including an intermittent very-low-calorie diet improve outcome? Am. J. Med. 1994, 97, 354–362. [Google Scholar] [CrossRef]
- Wing, R.R.; Jeffery, R.W. Prescribed “breaks” as a means to disrupt weight control efforts. Obes. Res. 2003, 11, 287–291. [Google Scholar] [CrossRef] [PubMed]
- Wing, R.R.; Tate, D.F.; Gorin, A.A.; Raynor, H.A.; Fava, J.L. A self-regulation program for maintenance of weight loss. N. Engl. J. Med. 2006, 355, 1563–1571. [Google Scholar] [CrossRef] [PubMed]
- Franz, M.J.; VanWormer, J.J.; Crain, A.L.; Boucher, J.L.; Histon, T.; Caplan, W.; Bowman, J.D.; Pronk, N.P. Weight-loss outcomes: A systematic review and meta-analysis of weight-loss clinical trials with a minimum 1-year follow-up. J. Am. Diet. Assoc. 2007, 107, 1755–1767. [Google Scholar] [CrossRef] [PubMed]
- Curioni, C.C.; Lourenco, A.P. Long-term weight loss after diet and exercise: A systematic review. Int. J. Obes. 2005, 29, 1153–1167. [Google Scholar] [CrossRef] [PubMed]
- American Dietetic Association. Adult Weight Management Evidence-Based Nutrition Practice Guideline. Available online: http://www.adaevidencelibrary.com/topic.cfm?cat=2798&library=EBG (accessed on 15 February 2015).
- Perri, M.G.; Corsica, J.A. Improving the maintenance of weight lost in behavioural treatment of obesity. In Handbook of Obesity Treatment; Wadden, T.A., Stunkard, A.J., Eds.; Guilford Press: Hoboken, NJ, USA, 2002; pp. 357–379. [Google Scholar]
- Ross Middleton, K.M.; Patidar, S.M.; Perri, M.G. The impact of extended care on the long-term maintenance of weight loss: A systematic review and meta-analysis. Obes. Rev. 2012, 13, 509–517. [Google Scholar] [CrossRef] [PubMed]
- Johns, D.J.; Hartmann-Boyce, J.; Jebb, S.A.; Aveyard, P. Diet or exercise interventions vs. combined behavioural weight management programs: A sytematic review and meta-analysis of direct comparisons. J. Acad. Nutr. Diet. 2014, 114, 1557–1568. [Google Scholar] [CrossRef] [PubMed]


| Reference | Study Design | Study Participants | N | Prescribed Regimen | Outcome Measures | Intervention Adherence | Effects of Intervention | Weight Change | |
|---|---|---|---|---|---|---|---|---|---|
| Start | End | ||||||||
| Arguin et al. [17] | Randomized, controlled, parallel study of 5 weeks intervention, 5 weeks stabilization phase, and 1 year follow up. | F Age: Mean 60.5 years BMI: Obese | 22 IER: 12 CER: 10 | 20 IER: 11 CER: 9 | Intervention Intermittent Diet (IER)—2 cycles of 5 weeks of weight maintenance plus 5 weeks of moderate CER OR Continuous energy restriction (CER)—15 weeks of moderate CER | BW, BC, WC, RMB, lipid profile, glucose | Not reported. | ↓† seen in TC and triglycerides in both groups after initial 5 weeks intervention. | At the 1 year follow up (mean ± SD): ↓ 8.5 ± 4.2 kg (IER) ↓ 7.1 ± 4.7 kg (CER) p = 0.73 between groups. |
| Ash et al. [18] | Randomised, controlled, parallel-arm study of 3, 12 weeks interventions and 18 months follow up | M Age: >70 years BMI: 25–40 kg/m2 T2DM | 51 | 27 * | Intervention 4200 kJ/day for 4 consecutive days, 3 days ad libitum eating (Food provided on fasting days) OR PPM; Removal of food preparation cues (All food provided) Control group SSM; Prepare and select own foods (Food not provided). | BW, BC, WC, HbA1C, triglycerides | Not reported. | Mean ↓ in energy intake (2369 ± 2793 kJ/day, p < 0.001)), HbA1C (1.0% ± 1.4%, p < 0.001), WC (8.1 ± 46 cm, p < 0.001), % body fat (1.9% ± 1.5%, p < 0.001), and triglyceride levels (0.3 ± 0.6 mmol/L, p = 0.02) post 12 weeks intervention from baseline. No improvements were maintained at the 18 months follow up visit. | Mean Outcome Measures: Baseline: 98.5 ± 12.3 kg* 12 weeks: 92.1 ± 11.4 kg* (p < 0.001 from baseline) 18 months: 96.7 ± 12.1 kg* (NS from baseline) |
| Harvie et al. [19] | Randomised, controlled, parallel study of a 6 months intervention | F Age: 30–45 years BMI: 24–40 kg/m2 | 107 IER: 53 CER: 54 | 89 IER: 42 CER: 47 | Intervention 75% ER (~2710 kJ/day) for 2 non consecutive days/week and CER on the other 5 days-IER (Food not provided) OR 25% ER (~6276 kJ/day) for 7 days/week-CER (Food not provided) | BW, insulin sensitivity and metabolic disease risk markers | IER 70% completed 2 VLED days/week at 1 month, 56% at 3 months and 64% at 6 months. CER 71%, 61% and 55% at 1, 3 and 6 months respectively. | Comparable ↓ noted for leptin, CRP, TC, LDL-C, triglycerides, and BP compared to baseline values for each group. IER intervention resulted in greater reductions (p < 0.05) in fasting insulin (2.1 µU·mL−1) and insulin resistance (0.4 µU·mmol−1·L−1) compared to CER (1.1 µUmL−1 and 0.3 µU·mmol−1·L−1) after 6 months. Tests were performed on a non-fasting day a minimum 5 days post weekly VLED treatment. Acute Response of serum markers A subset (15 IER and 9 CER) provided fasting samples the morning after a 2-day VLED which showed acute reductions for the IER group in fasting insulin (−23%), HOMAR (−29%) and TC (−18%). No changes reported in CER group. | At 6 months (mean & range): ↓ 6.4 (↓ 7.9 to ↓4.8 ) kg (IER) ↓ 5.6 (↓6.9 to ↓4.4) kg (CER) p = 0.26 |
| Hill et al. [20] | Randomised four-arm parallel study of 12 weeks with follow up at 26 weeks | F Age: ≥18 years Weight: 130%–160% of ideal body weight | 40 IER: 20 CER: 20 | 32 IER: 16 CER: 16 | Intervention Severe ER (2512 kJ/day) on fast days, moderate CER (7536 kJ/day) on alternating days–IER IER plus moderate aerobic training on 5 days/week—IER + EX OR Moderate CER (5024 kJ/day)—CER CER plus moderate aerobic training on 5 days/week—CER + EX | BW, BC, REE, TC, Triglycerides, glucose, insulin | 95% of participants who completed the study. | FM ↓ during the study with no difference between diets (6.1 ± 0.6 vs. 6.0 ± 0.8 kg for constant and alternating dies respectively. REE ↓ by 5% in the group as a whole (p < 0.05), with no diet or exercise effects TC ↓ in the group as a whole (5.30 ± 0.18 to 4.73 ± 0.18 mmol/L, p < 0.05). Subjects in the IER conditions showed greater reductions than did the subjects following CER conditions (5.46 ± 0.26 to 4.68 ± 0.23 mmol/L vs. 5.09 ± 0.23 to 4.81 ± 0.26 mmol/L, p < 0.05) Triglycerides ↓ with weight reduction (1.21 ± 0.11 to 1.02 ± 0.11 mmol/L, p < 0.05) with no diet or exercise effect. Fasting glucose ↑ without any change in fasting insulin, with no diet or exercise effect. | Following the 12-week intervention: Total weight loss during 12 weeks was 7.6 kg (NS between diets). At the six-month follow up (mean ± SEM): ↓ 9.5 ± 2.9 kg (CER) ↓ 7.2 ± 2.7 (IER) NS difference between groups |
| Keogh et al. [21] | Parallel, randomized control trial, of 8 weeks with a 12-month follow-up. | F Age: ≥18 years BMI: >27 kg/m2 | 75 IER: 39 CER: 36 | 36 IER: 19 CER: 17 | Intervention Intermittent Energy Restriction (IER) 5500 kJ/day for 1 week followed by 1 week of usual dietary habits OR Continuous Energy Restriction (CER) 5500 kJ/day for the duration of the study | BW, BC, diet quality scores | 24 women (12 from each treatment group) did not adhere to the diet for the 44 weeks between 8 weeks and follow-up. 11 reported continuing their allocated diets for the duration of the study (4 CER, 7 IER). | ↓ in waist and hip circumference over time (p < 0.01) in both groups, no difference between groups. ↑ in Healthy eating index at 12 months in the CER compared to IER (8.4 ± 9.1 vs. −0.3 ± 8.4, p = 0.006). | In completers only: After 8 Weeks (mean ± SD): ↓ 3.2 ± 2.1 kg (CER) ↓ 2.0 ± 1.9 kg (IER) p = 0.06 between groups. 12 months follow-up (mean ± SD): ↓ 4.2 ± 5.6 kg (CER) ↓ 2.1 ± 3.8 kg (IER) p = 0.19 between groups. |
| Lantz et al. [22] | Randomised, parallel study of 2 years trial. | MF Age: 18–60 years BMI: >30 kg/m2 | 334 IER: 161 On-Demand: 173 | 117 IER: 57 On-Demand: 60 | VLED (1890 kJ/day) for 16 weeks, VLED for 2 weeks every third month (Intermittent). OR VLED for 16 weeks, VLED on-demand when body weight increased above desired cut-off (On demand). | BW, FFM, BP, glucose, insulin, TC, HDL-C, LDL-C, triglycerides | Not reported. | No significant differences between the groups at baseline or over time. Completers were pooled from both groups to show changes of the following variables: ↓ in systolic (−7 mmHg) and diastolic (−3 mmHG) BP after 1 year † but not after 2 years. TC ↓† after 24 weeks (−0.2 mmol L−1) but not at 1 or 2 years. HDL-C and LDL-C ↓ by 0.2 mmol L−1 and −0.2 mmol L−1 respectively after 100 weeks †. ↓ in glucose, insulin and relative insulin by −0.4 mmol L−1, −7.6 mU L−1, and −2.1 respectively after 48 weeks †. With only serum insulin (−4.9 mU L−1) and relative insulin resistance (−1.1) remaining improved after 100 weeks † | At the end of 2 years (mean ± SD): ↓ 7.0 ± 11.0 kg (Intermittent) ↓ 9.1 ± 9.7 kg (On-demand) NS between groups |
| Rossner et al. [23] | Randomised parallel, controlled trial of 18 weeks with follow up at 14 and 26 weeks | MF Age: 21–60 years BMI: >30 kg/m2 | 101 IER: 20 (Trial 1) 29 (Trial 2) Control: 20 (Trial 1) 32 (Trial 2) | 81 IER: 17 (Trial 1) 22 (Trial 2) Control: 16 (Trial 1) 26 (Trial 2) | TRIAL 1—Women only Intervention Three periods of 2 weeks with VLED (1764 kJ/day) separated by 4 weeks of moderate CER (6592 kJ/day) Control Six weeks continuous treatment with VLED (1764 kJ/day) TRIAL 2—Men and Women Intervention Three periods of 2 weeks with VLED (2226 kJ/day) separated by 4 weeks of moderate CER (6592 kJ/day) Control Six weeks continuous treatment with VLED (2226 kJ/day) | BW | Measured via urinary ketone bodies, but results not reported. | - | Mean outcome measures: (mean weight ± SD) TRIAL 1—Women only Intervention Baseline; 106.2 ± 14.2 kg At 26 weeks; 92.1 ± 14.6 kg Control Baseline; 105.6 ± 10.5 kg At 26 weeks; 95.5 ± 11.1 kg TRIAL 2 Intervention Baseline; Men; 135.0 ± 21.6 kg Women; 114.5 ± 13.0 kg At 26 weeks: Men; 108.8 ± 24.4 kg Women; 99.0 ± 16.8 kg Control Baseline: Men; 127.4 ± 9.6 kg Women; 107.7 ± 17.6 kg At 26 weeks: Men; 107.7 ± 12.9 kg Women; 94.9 ± 12.6 kg NS difference between groups. |
| Wing et al. [24] | Randomised, two—arm parallel study of 50 weeks + 2 years follow up. | MF BMI: >30 kg/m2 | 93 IER: 45 CER: 48 | 79 IER: 38 CER: 41 | Intervention LED (4200–5040 kJ/day) for the whole 50 weeks (LED) OR 2 × 12 weeks periods of VLED (1680–2100 kJ/day) alternating with the balanced LED (VLED). | BW, glucose, BP, lipids | Not reported. | ↓ in cholesterol for both groups from baseline after 1 year † with greater difference seen in the LCD group (p = 0.058) Significant and comparable ↑in HDL-C and ↓ in triglycerides after 1 year † ↓ in HBA1C levels of 10.6% to 8.3% and 10.2% and 8.8% for the VLED and LED groups respectively (p <0.001). No difference between the groups. ↓ in fasting glucose and insulin levels from baseline after 1 year † for both groups. Changes were comparable for the two treatments At the 2 years follow up levels of fasting glucose, HBA1C and insulin levels were comparable between the two groups. | At 50 weeks follow up (mean ± SD): ↓ 14.2 ± 10.3 kg (VLED) ↓ 10.5 ± 11.6 kg (LED) p = 0.057 |
| Wing et al. [25] | Randomised 3-arm parallel study of 20 weeks IER and 14 weeks CER, with follow-up at 20 & 48 weeks. | MF BMI: >30 kg/m2 | 142 IER: 47 (LB) ∏ 47 (SB) Control: 48 | 96 IER: 32 (LB) 33 (SB) Control: 31 | Intervention 7 weeks of moderate CER (4200–6300 kJ/day), 6 weeks break, 7 weeks of moderate CER—Long Break IER (LB) 3 cycles of 3 weeks of moderate CER (4200–6300 kJ/day), 2 weeks break, 5 weeks of moderate CER—Short Break IER (SB) Control 14 weeks moderate CER (4200–6300 kJ/day) plus restriction of 13 specified high-fat foods | 68% of Long Break IER, 70% Short Break IER, & 64% CER | Posttreatment (5 months) (mean ± SD): ↓ 8.2 ± 3.7 kg (Control) ↓ 7.0 ± 5.0 kg (LB) ↓ 8.2 ± 6.3 kg (SB) NS significant difference between groups At 48 weeks follow up (mean ± SD): ↓ 7.3 ± 5.1 kg (Control) ↓ 6.5 ± 5.9 kg (LB) ↓ 8.4 ± 8.2 kg (SB) NS difference between groups. | ||
© 2016 by the authors; licensee MDPI, Basel, Switzerland. This article is an open access article distributed under the terms and conditions of the Creative Commons Attribution (CC-BY) license (http://creativecommons.org/licenses/by/4.0/).
Share and Cite
Headland, M.; Clifton, P.M.; Carter, S.; Keogh, J.B. Weight-Loss Outcomes: A Systematic Review and Meta-Analysis of Intermittent Energy Restriction Trials Lasting a Minimum of 6 Months. Nutrients 2016, 8, 354. https://doi.org/10.3390/nu8060354
Headland M, Clifton PM, Carter S, Keogh JB. Weight-Loss Outcomes: A Systematic Review and Meta-Analysis of Intermittent Energy Restriction Trials Lasting a Minimum of 6 Months. Nutrients. 2016; 8(6):354. https://doi.org/10.3390/nu8060354
Chicago/Turabian StyleHeadland, Michelle, Peter M. Clifton, Sharayah Carter, and Jennifer B. Keogh. 2016. "Weight-Loss Outcomes: A Systematic Review and Meta-Analysis of Intermittent Energy Restriction Trials Lasting a Minimum of 6 Months" Nutrients 8, no. 6: 354. https://doi.org/10.3390/nu8060354
APA StyleHeadland, M., Clifton, P. M., Carter, S., & Keogh, J. B. (2016). Weight-Loss Outcomes: A Systematic Review and Meta-Analysis of Intermittent Energy Restriction Trials Lasting a Minimum of 6 Months. Nutrients, 8(6), 354. https://doi.org/10.3390/nu8060354