Article

Dietary Flavonols Intake and Risk of Esophageal and Gastric Cancer: A Meta-Analysis of Epidemiological Studies

1
Stem Cell Biology and Therapy Laboratory, Lab medicine of Maternity and Child Care Hospital of Yubei District, Ministry of Education Key Laboratory of Child Development and Disorders, the Children’s Hospital of Chongqing Medical University, Chongqing 400014, China
2
Orthopedic Department II, Chongqing Key Laboratory of Pediatrics, Ministry of Education Key Laboratory of Child Development and Disorders, the Children’s Hospital of Chongqing Medical University, Chongqing 400014, China
*
Author to whom correspondence should be addressed.
Nutrients 2016, 8(2), 91; https://doi.org/10.3390/nu8020091
Submission received: 5 December 2015 / Revised: 10 January 2016 / Accepted: 4 February 2016 / Published: 16 February 2016

Abstract

:
Background: Esophageal cancer (EC) and gastric cancer (GC) are common cancers and leading causes of cancer deaths worldwide. Many studies have investigated the association between dietary flavonols intake and the risk of EC and GC, but the results are inconsistent. Hence, we conducted a systematic analysis of relevant population-based studies to assess the association and derive a more precise estimation. Methods: The Cochrane, PubMed and Embase databases were searched to identify articles published through January 2016 that met the predetermined inclusion criterion. Twelve studies involving 4593 patients and 519,378 controls were included. Results: The summary odds ratios (ORs) of EC, GC and the two combined were respectively 0.88 (95% CI: 0.73–1.08), 0.80 (95% CI: 0.70–0.91) and 0.83 (95% CI: 0.74–0.92) for the highest category of dietary flavonols intake compared with the lowest. No significant heterogeneities were observed in these studies. Further analysis showed that the pooled ORs of EC and GC for cohort, population-based case-control and hospital-based case-control studies were 0.90 (95% CI: 0.61–1.34), 0.92 (95% CI: 0.72–1.18), 0.68 (95% CI: 0.38–1.24) and 0.83 (95% CI: 0.65–1.06), 0.84 (95% CI: 0.45–1.59), 0.70 (95% CI: 0.56–0.88). The subgroup analyses revealed a significant association of flavonol intake with a reduced risk of noncardia gastric adenocarcinoma but not gastric cardia adenocarcinoma. Moreover, significant inverse associations of flavonol intake with GC risk were observed in women but not in men, in smokers but not in nonsmokers, in European populations but not in American populations. Similarly, a significant inverse association of flavonols intake with EC risk was also observed in smokers but not in nonsmokers. Conclusion: High intake of dietary flavonols is significantly related to a reduced risk of GC, especially in women and smokers.

1. Introduction

Esophageal cancer (EC) and gastric cancer (GC) are, respectively, the eighth and the fourth most common cancer and leading causes of cancer deaths worldwide [1,2]. It is worth noting that over the past two decades, esophageal adenocarcinoma (EAC) and gastric cardia adenocarcinoma (GCA) have been among the most rapidly increasing cancer types in the United States and many other Western countries [3,4]. EC and GC, especially EAC and GCA, are often considered to be similar clinical entities because they are both epithelial cancers originating in or near the gastroesophageal junction and have similar five-year survival rates [5]. Previous reports have suggested the intimate association between diet and the risk of cancers. Because the alimentary tract contacts and interacts with dietary components directly, EC and GC, as well as colorectal cancer, may be more closely related to diet. The high consumption of meat, especially red and processed meats, saturated fat, salt and salted food may increase the risk of EC and GC, whereas the consumption of vegetables, fruit and carotene may decrease the risk [6,7,8]. Therefore, the identification of modifiable risk factors, particularly in the diet, for EC and GC is important because it may lead to potential prevention opportunities.
High fruit and vegetable consumptions are associated with beneficial health effects, and these effects have been partly attributed to flavonoids, a group of polyphenolic compounds, which occur ubiquitously in plant foods. Dietary flavonols, mainly including quercetin, myricetin and kaempferol, are a subclass of flavonoids in a daily diet. Dietary flavonols mostly exist in black tea, onions, broccoli, beer, apples, wine and mixed salads in western country diets [9,10]. In recent decades, studies have suggested that dietary flavonols, such as quercetin and myricetin, may be potent anti-carcinogenic substances. Flavonols seem to be effective in vitro anti-proliferative and pro-apoptotic agents in a series of tumor cells. Quercetin and myricetin can impact the etiology of certain diseases ranging from oxidative stress and inflammation to carcinogenesis and cancer progression [11,12]. Epidemiological studies have been performed to estimate the association between dietary flavonols and various types of cancer, including EC and GC. However, it is difficult to assess the effects of dietary flavonols on EC and GC. As mentioned above, hot beverages, wine and beer are important sources of dietary flavonols in western country diets, yet hot beverages and alcohol intake are risk factors for EC and GC. Therefore, diet patterns with high intake of flavonols might be associated with high risk of EC and GC. In fact, population-based studies have reported inconsistent findings for the role of dietary flavonols in EC and GC incidence. To derive a more precise estimation of the relationship between dietary flavonols intake and the risk of EC and GC, we performed a meta-analysis to summarize the available evidence from prospective and case-control studies.

2. Methods

2.1. Search Strategy

A systematic search of the literature published through 2 January 2016, was conducted using the Cochrane, PubMed and Embase databases. The following search terms were used: “flavonoid”, “flavonoids”, “flavonols”, “flavonol”, “quercetin”, “myricetin”, “kaempferol”, “gastric cancer”, “stomach cancer”, “esophagus cancer” and “oesophageal cancer” ((Flavonoid OR flavonoids OR flavonols OR flavonol OR quercetin OR kaempferol OR myricetin) AND (gastric cancer OR stomach cancer OR oesophageal cancer OR esophagus cancer)). We also performed a manual search via reference lists. Only full-length journal articles with a prospective cohort, population-base case-control (PBCC) or hospital-based case-control (HBCC) study design were considered.

2.2. Study Selection

Articles were eligible for the present meta-analysis if they conformed to the following criteria: (i) the study design was a population-based study, including a cohort, PBCC or HBCC study; (ii) a relatively complete assessment of dietary flavonols intake was performed; (iii) the association of dietary flavonols intake with the risk of EC or GC was specifically evaluated; and (iv) the relative risk (RR), hazard ratio (HR), or odds ratio (OR) and the corresponding 95% confidence interval (95% CI) values were available.

2.3. Data Extraction

The data from each study and article fulfilling the inclusion criteria were extracted carefully by two independent reviewers. The following information from each article was recorded: (i) the first author’s name and publication year; (ii) the country of origin, the follow-up time used in the study and the study design (prospective cohort study, PBCC study or HBCC study); (iii) the population (numbers of cases and controls); (iv) baseline intake of flavonols (mediam, mg/d); (v) dietary flavonols included in the dietary assessment; (vi) the level of dietary flavonols intake (mg/day); (vii) the RR or OR values from the most fully adjusted model and their 95% CI values; (viii) the listed confounders adjusted for the multivariate analysis. In addition, due to the low incidence of EC and GC, the OR was assumed to be the same as the RR, and the summary results were reported as OR for simplicity [13].

2.4. Statistical Analysis

The summary ORs and corresponding 95% CIs of the included studies were used as a measure to assess the association of dietary flavonols intake and the risk of EC and GC. We estimated between-study heterogeneity in each meta-analysis by the Q test and I2 statistics. Heterogeneity is considered to be significant for p < 0.10 or I2 > 50%. Summary ORs calculations used the Mantel-Haenszel fixed-effects model [14] and the Der Simonian and Laird random-effects model [15,16]. In the absence of between-study heterogeneity, the two methods provide almost identical results. Since fixed-effects models assume that all studies aim at evaluating a common truth and results differ by chance alone. If no obvious heterogeneity existed, the fixed-effects model was selected to pool the data; otherwise, random-effects models are preferable. When statistical heterogeneity was detected, a sensitivity analysis was performed to explore potential sources of heterogeneity, both in the overall pooled estimate and within the subgroups. The potential publication bias was examined by the funnel plot and Egger’s test (p < 0.10). All of the analyses were performed using STATA version 11.0 (Stata Corp, College Station, TX, USA). A p value < 0.05 was considered to be statistically significant unless otherwise specified.

3. Results

3.1. The Characteristics of the Included Studies

The present systematic search of the related literatures identified a total of 579 studies. Figure 1 showed the procedure of the study selection. In total, 547 studies were excluded after screening titles or abstracts. The remaining 32 full-text articles were subjected to a more detailed evaluation. Among those 32 studies, 20 were then excluded as irrelevant or because they did not meet the inclusion criteria. Finally, 12 studies relevant to the role of dietary flavonols intake and the risk of esophageal and gastric cancer were included in the present systematic analysis, including four prospective cohort and eight case-control studies [17,18,19,20,21,22,23,24,25,26,27,28].
Figure 1. Flow chart showing the study selection procedure.
Nutrients 08 00091 g001
The characteristics of the 12 included studies are shown in Table 1. These selected studies in the final meta-analysis included 4593 cases (1603 EC and 2990 GC) and 519,378 controls. All of the articles were published in English, between 1999 and 2015, a period that spans 16 years.
Among these 12 studies, two were conducted in the USA, one was conducted in Korea, and the other nine were conducted in Europe (one in Sweden, two in Finland, one in Greece, one in Spain, two in Italy and two in 10 European countries). One study only adjusted for age and dietary supplements, and the other 11 studies all adjusted for a wide range of potential confounders of cancer, including age, sex, total energy intake, physical activity, body mass index, smoking status, educational level, alcohol intake, fruit and vegetables consumption, and red and processed meat consumption.

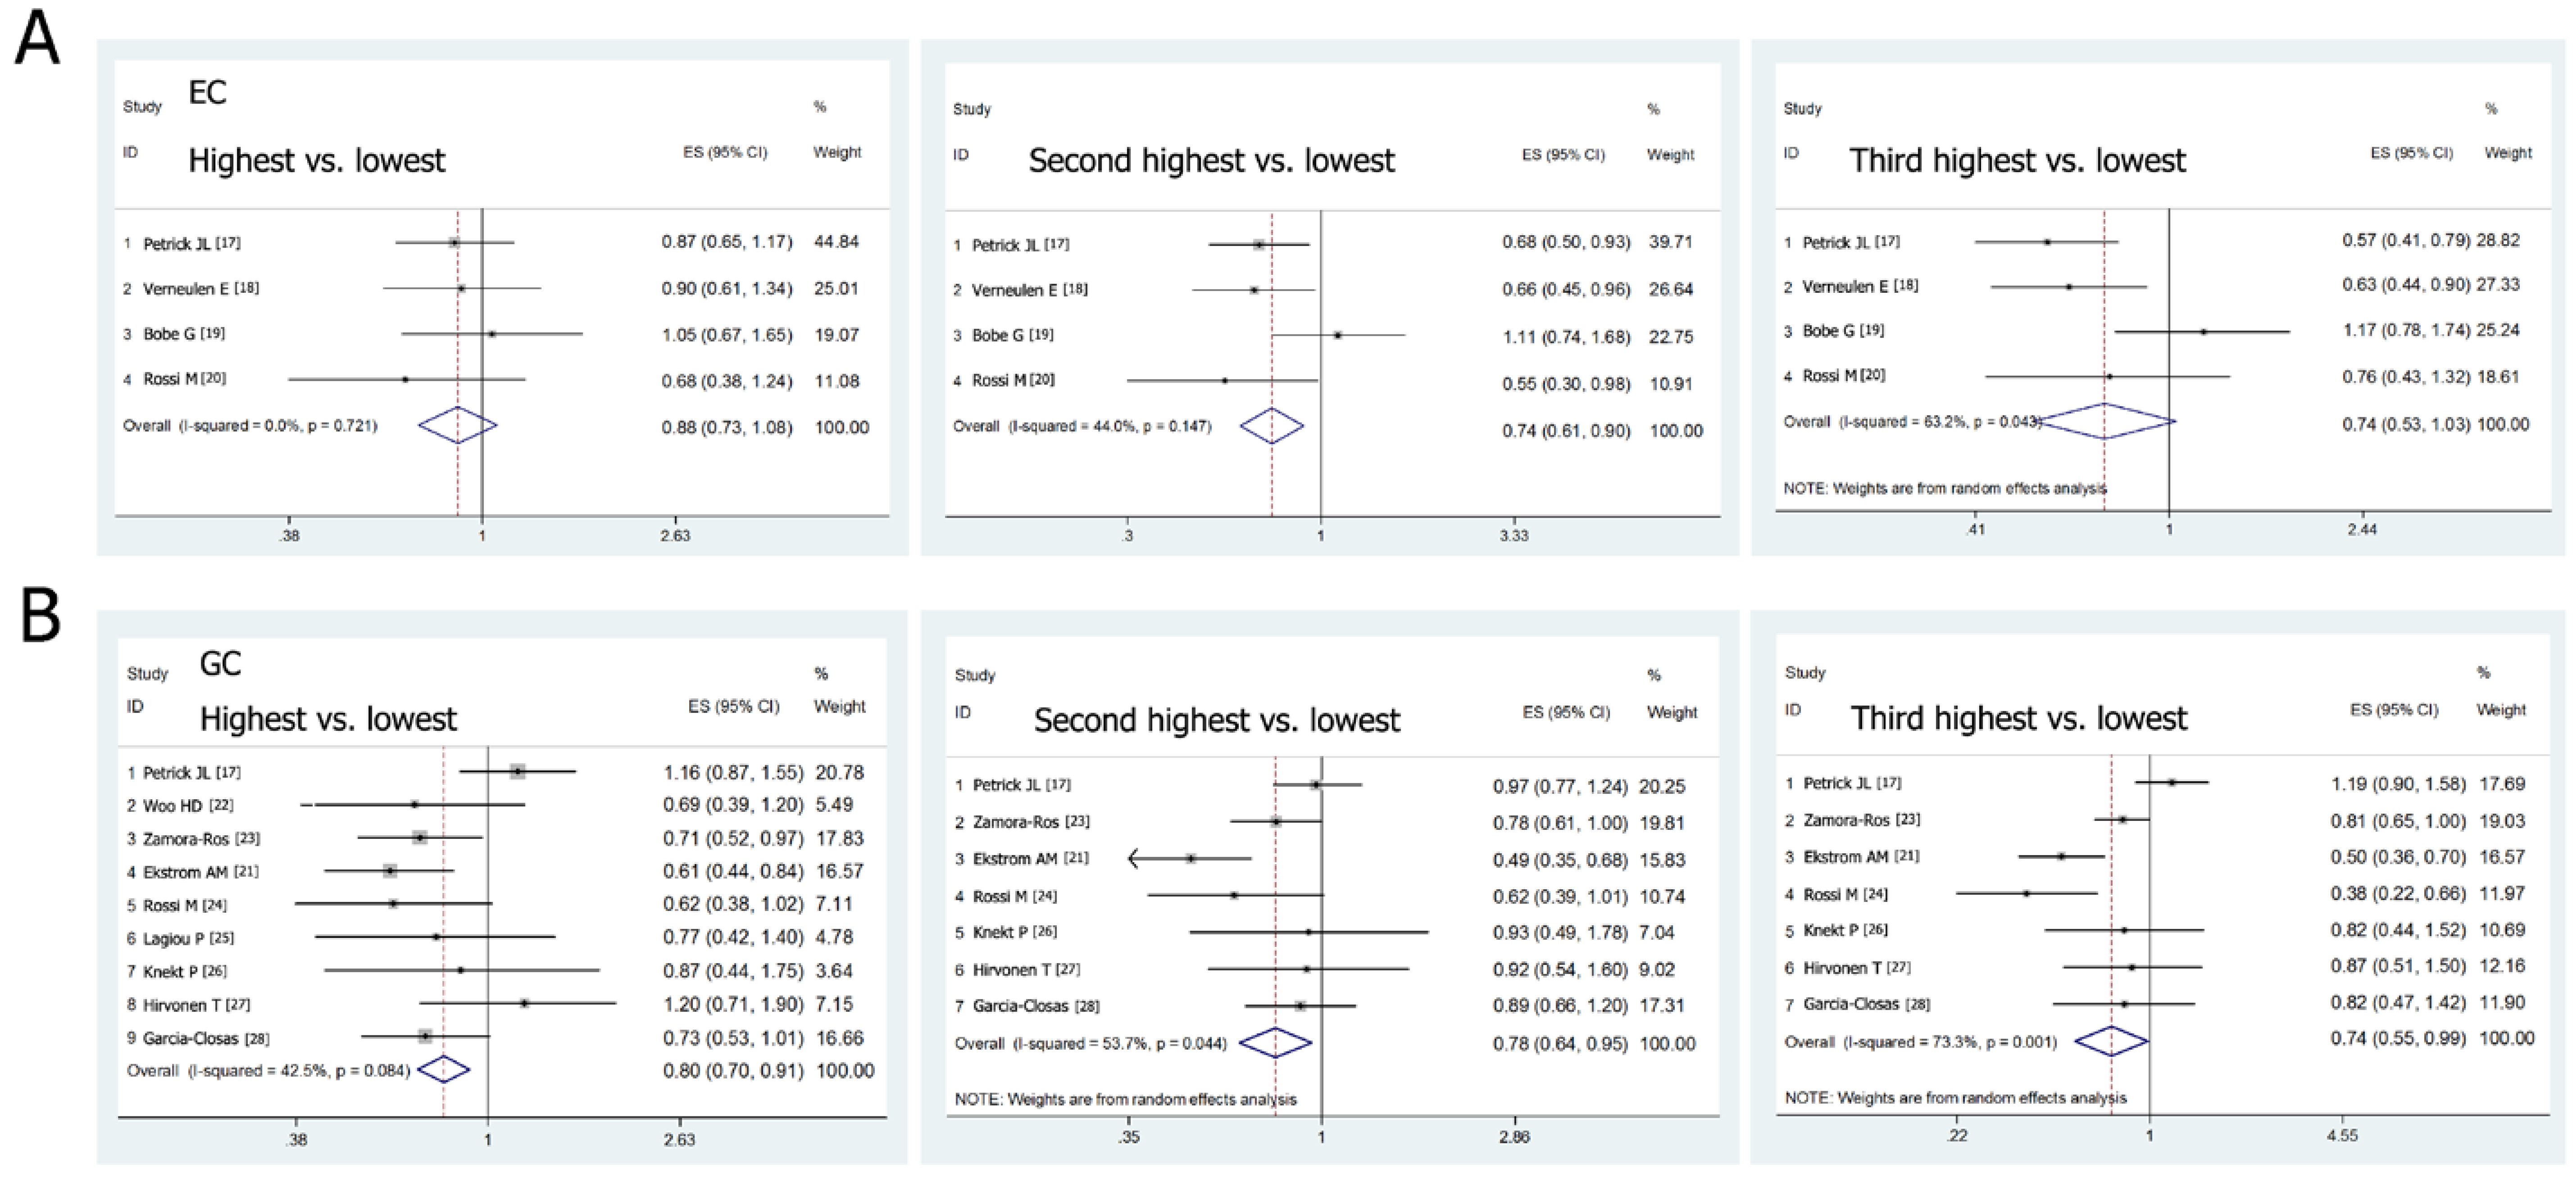
3.2. Flavonols Intake and the Risk of Esophageal and Gastric Cancer

We calculated the summary OR values of EC and GC from the combination of the included studies. Forest plots in Figure 2 showed the summary ORs of EC and GC for the high dietary flavonols intakes versus the low intakes. The meta-analysis data indicated that the pooled ORs of EC, GC and the two combined for the highest category of flavonols intake compared with the lowest category were 0.88 (95% CI: 0.73–1.08), 0.80 (95% CI: 0.70–0.91) and 0.83 (95% CI: 0.74–0.92), respectively. No significant heterogeneities were observed in these studies. The meta-analysis results suggested that the highest intake of dietary flavonols was associated with a reduced, but not statistically, risk of EC, and a significantly inverse association was found between flavonols intake and the risk of GC. Additionally, to assess the effect of the dose of flavonol intake on the association, we selected out the studies in which the levels of dietary flavonol intake were categorized into quartiles. The pooled ORs of EC and GC for the second and the third highest flavonol intake compared with the lowest were 0.74 (95% CI: 0.61–0.90), 0.74 (95% CI: 0.53–1.03) and 0.78 (95% CI: 0.64–0.95), 0.74 (95% CI: 0.55–0.99) respectively. The results suggested that the risk of EC and GC did not decrease with the increasing level of dietary flavonols intake, and no dose-dependent effects were showed. Nevertheless, the high intakes of flavonols were all associated with a reduced risk of EC and GC.
Furthermore, we conducted subgroup analyses by study design, cancer subtype, sex, smoking, population and publication time. As shown in Table 2, the pooled ORs of EC and GC for prospective cohort studies, population-based case-control studies and hospital-based case-control studies were 0.90 (95% CI: 0.61–1.34), 0.92 (95% CI: 0.72–1.18), 0.68 (95% CI: 0.38–1.24) and 0.83 (95% CI: 0.65–1.06), 0.84 (95% CI: 0.45–1.59), 0.70 (95% CI: 0.56–0.88), respectively. No substantial heterogeneities existed across these studies except population-based case-control studies of GC. The subgroup analyses also revealed a significant association for highest dietary flavonol intake with a reduced risk of noncardia gastric adenocarcinoma (NCGA) (OR = 0.73 95% CI: 0.56–0.96), but not gastric cardia adenocarcinoma (GCA) (OR = 1.17 95% CI: 0.82–1.67). Moreover, significant inverse associations between dietary flavonol intake and the risk of GC were observed in women (OR = 0.56, 95% CI: 0.36–0.88) but not in men (OR = 0.96, 95% CI: 0.72–1.27), in smokers (OR = 0.85, 95% CI: 0.73–0.99) but not in nonsmokers (OR = 0.94, 95% CI: 0.76–1.17), in European populations (OR = 0.73, 95% CI: 0.62–0.85) but not in American populations (OR = 1.16, 95% CI: 0.87–1.55), and among the studies published after 2010 (OR = 0.78, 95% CI: 0.67–0.92) but not in those published before 2010 (OR = 0.84, 95% CI: 0.66–1.06). Additionally, a significant inverse association between dietary flavonols intake and the risk of EC was also observed in smokers (OR = 0.73, 95% CI: 0.60–0.90) but not in nonsmokers (OR = 1.25, 95% CI: 0.98–1.58).
Table 1. Characteristics of the included studies.
Author, YearRegion, Period and DesignCases/ControlsBaseline Intake of FlavonolsFlavonols IncludedFlavonols Intake (mg/Day)RR or OR and 95% CIAdjustments
Petrick, et al. 2015 [17]USA
1993–1995, PBCC
465/662Control
14.46 ± 9.41
EAC
14.70 ± 9.68
ESCC
15.74 ± 10.41
Total flavonols
0–8.31
8.32–12.16
12.17–17.81
≥17.82
EC
1.00
0.57 (0.41–0.79)
0.68 (0.50–0.93)
0.87 (0.65–1.17)
EAC
1.00
0.56 (0.37–0.85)
0.67 (0.45-1.00)
0.80 (0.54–1.18)
ESCC
1.00
0.59 (0.36-0.98)
0.70 (0.43-1.14)
0.97 (0.62-1.53)
Age, sex, race, geographic centre, cigarette smoking, and dietary energy intake.
Verneulen, et al. 2013 [18]10 European countries
1992–2010, Cohort
341 (477312)Men2
7.1 ± 16.6
Women
27.2 ± 17.6
Total flavonolsQ1
Q2
Q3
Q4
1.00
0.63 (0.44–0.90)
0.66 (0.45–0.96)
0.90 (0.61–1.34)
Age, sex, energy intake, BMI, smoking intensity, educational level, physical activity, alcohol, red and processed meat, fiber, vitamin C and carotenoids.
Bobe, et al. 2009 [19]USA
1986–1989, PBCC
493/1235W-Con:19.5
W-EAC: 21.0
W-ESCC: 28.6
B-Con: 20.7
B-ESCC: 26.2
Isorhamnetin
Kaempferol
Myricetin
Quercetin
<6.89
6.89–11.0
11.1–15.9
>15.9
1.00
1.17 (0.78–1.74)
1.11 (0.74–1.68)
1.05 (0.67–1.65)
1.00
1.19 (0.66–2.17)
1.26 (0.67–2.38)
0.98 (0.47–2.01)
1.00
1.15 (0.67–1.94)
1.02 (0.59–1.74)
1.10 (0.62–1.97)
Smoking duration and intensity, geographical area, age, BMI, hot tea, hard liquor, beer, red and white wine, caloric intake, education and income.
Rossi, et al. 2007 [20]Italy
1992–1997, HBCC
304/74322.3Quercetin
Myricetin
Kaempferol
≤15.9
16.0–20.4
20.5–25.4
25.5–31.9
>31.9
1.00
1.02 (0.59–1.76)
0.76 (0.43–1.32)
0.55 (0.30–0.98)
0.68 (0.38–1.24)
Age, sex, study centre, education, alcohol consumption, tobacco smoking, BMI and energy intake.
Petrick, et al. 2015 [17]USA
1993–1995, PBCC
589/662Contro
l14.46 ± 9.41
GCA
16.04 ± 10.63
GCGA
14.9 ± 11.36
Total flavonols
0–8.31
8.32–12.16
12.17–17.81
≥17.82
GC
1.00
1.19 (0.90–1.58)
0.97 (0.77–1.24)
1.16 (0.87–1.55)
GCA
1.00
1.24 (0.81–1.91)
1.01 (0.65–1.57)
1.42 (0.93–2.17)
NCGA
1.00
1.16 (0.80–1.69)
0.96 (0.65–1.14)
0.98 (0.67–1.46)
Age, sex, race, geographic centre, cigarette smoking, and dietary energy intake.
Ekstrom, et al. 2011 [21]Sweden
1989–1995, PBCC
505/1116NMQuercetin0.16–3.88
3.89–6.02
6.03–8.17
8.18–11.9
≥11.9
1.00
0.68 (0.50–0.93)
0.50 (0.36–0.70)
0.49 (0.35–0.68)
0.61 (0.44–0.84)
1.00
0.39 (0.18–0.83)
0.44 (0.21–0.91)
0.45 (0.22–0.95)
0.76 (0.40–1.44)
1.00
0.76 (0.54–1.06)
0.52 (0.36–0.74)
0.50 (0.34–0.72)
0.57 (0.40–0.83)
Age, gender, socioeconomic status, number of siblings, body mass index, smoking and energy and salt intake.
Woo, et al. 2014 [22]Korea
2011–2014, HBCC
334/334Control
22.8 ± 19.5
Case
23.3 ± 21.4
Isorhamnetin
Kaempferol
Myricetin
Quercetin
(Median)
T1(10.9)
T2(14.4)
T3(30.8)
GC
1.00
0.86 (0.55–1.36)
0.69 (0.39–1.20)
Men
1.00
0.89 (0.49–1.61)
0.65 (0.32–1.35)
Women
1.00
0.85 (0.37–1.97)
1.22 (0.47–3.16)
Total energy intake, H. pylori, age, sex, education, smoking, alcohol, BMI, physical activity, pickled vegetable, red and processed meat, fruits and vegetable.
Zamora–Ros, et al. 2012 [23]10 European countries
1992–2010, Cohort
683 (477312)Men
26.5 ± 16.4
Women
26.7 ± 17.4
Isorhamnetin
Kaempferol
Myricetin
Quercetin

Q1
Q2
Q3
Q4
GC
1.00
0.81 (0.65–1.00)
0.78 (0.61–1.00)
0.71 (0.52–0.97)
Men
1.00
0.89 (0.66–1.18)
0.81 (0.57–1.13)
0.93 (0.63–1.37)
Women
1.00
0.72 (0.52–0.99)
0.75 (0.51–1.09)
0.45 (0.27–0.75)
Age, educational level, smoking status, physical activity, BMI, alcohol and energy intake, and daily consumption of fruit, vegetables, and red and processed meat.
Rossi, et al. 2010 [24]Italy
1997–2007, HBCC
230/54722.9 ± 19.1Total flavonols≤13.2
13.3–16.4
16.5–20.3
20.3–32.3
>32.3
1.00
0.80 (0.51–1.27)
0.38 (0.22–0.66)
0.62 (0.39–1.01)
0.62 (0.38–1.02)
Sex, age, education, year of interview, BMI, tobacco smoking, and total energy intake.
Lagiou, et al. 2004 [25]Greece
1981–1984, HBCC
110/100NMNMTper 10 mg1.00
0.77 (0.42–1.40)
Age, sex, place of birth, BMI, height, years of education, smoking, total energy intake, alcohol, fruits and vegetable.
Knekt, et al. 2002 [26]Finland
1967–1994, Cohort
74(9865)24.2Isorhamnetin
Kaempferol
Myricetin
Quercetin
Q1
Q2
Q3
Q4
1.00
0.82 (0.44–1.52)
0.93 (0.49–1.78)
0.87 (0.44–1.75)
Sex, age, geographic area, occupation, smoking, and BMI.
Hirvonen, et al. 2001 [27]Finland
1985–1993, Cohort
111 (27110)NMQuercetin
Myricetin
Kaempferol
(Median)
Q1(4.2)
Q2(6.7)
Q3(9.6)
Q4(16.3)

1.00
0.87 (0.51–1.50)
0.92 (0.54–1.60)
1.20 (0.71–1.90)
Age, dietary supplements of α-tocopherol and β-carotene.
Garcia-Closas, et al. 1999 [28]Spain
1987–1989, HBCC
354/3549.0 ± 7.3Quercetin
Myricetin
Kaempferol
Q1
Q2
Q3
Q4
1.00
0.82 (0.47–1.42)
0.89 (0.66–1.20)
0.73 (0.53–1.01)
Total energy intake, intake of nitrites, nitrosamines, vitamin C, total carotenoids and other specific flavonoids.
BMI: body mass index; 95% CI: 95% confidence intervals; EC: esophageal cancer; EAC: esophageal adenocarcinoma; ESCC: esophageal squamous cell carcinoma; GC: gastric cancer; GCA: gastric cardia adenocarcinoma; NCGA: noncardia gastric adenocarcinoma; HBCC: hospital-based case-control; PBCC: population-based case-control; W-Con: White-control; W-EAC: White-EAC; W-ESCC: White-ESCC; B-Con: Black-control; B-ESCC: Black-ESCC; NM: not mentioned.
Figure 2. Forest plots investigating the association of dietary flavonol intake and the risk of esophageal cancer (EC) and gastric cancer (GC).
Nutrients 08 00091 g002
Table 2. Summary estimates of dietary flavonols (highest vs. lowest) and esophageal and gastric cancer risk.
StudyECGC
naRR (95% CI)HeterogeneitynaRR (95% CI)Heterogeneity
PbI2 (%)PbI2 (%)
Design
Cohort10.90 (0.61–1.34)--30.83 (0.65–1.06)0.20836.2
Case-control30.88 (0.70–1.10)0.5150.060.79 (0.67–0.92)0.05953.0
PBCC20.92 (0.72–1.18)0.4930.020.84 (0.45–1.59)0.00488.2
HBCC10.68 (0.38–1.24)--40.70 (0.56–0.88)0.9420.0
Cancer type
EAC20.84 (0.59–1.18)0.6300.0
ESCC30.91 (0.67–1.24) 0.4910.0
GCA21.17 (0.82–1.67)0.11160.7
NCGA20.73 (0.56–0.96)0.04774.7
Gender
Men0---30.96 (0.72–1.27)0.3790.0
Women0---20.56 (0.36–0.88)0.07169.4
Smoking
Smokers20.73 (0.60–0.90)0.8470.020.85 (0.73–0.99)0.14952.0
Nonsmokers21.25 (0.98–1.58)0.8430.010.94 (0.76–1.17)--
Population
American20.92 (0.72–1.18)0.4930.011.16 (0.87–1.55)--
European20.83 (0.60–1.15)0.4390.070.73 (0.62–0.85)0.4420.0
Asian0---10.69 (0.39–1.20)--
Publication time
2010–201520.88 (0.70–1.11)0.8920.050.78 (0.67–0.92)0.02863.1
Before 201020.90 (0.63–1.28)0.25223.840.84 (0.66–1.06)0.4180.0
a No. of selected studies; 95% CI: 95% confidence intervals; EC: esophageal cancer; EAC: esophageal adenocarcinoma; ESCC: esophageal squamous cell carcinoma; GC: gastric cancer; GCA: gastric cardia adenocarcinoma; NCGA: noncardia gastric adenocarcinoma; HBCC: hospital-based case-control; PBCC: population-based case-control.

3.3. Sensitivity Analysis

No statistical heterogeneities were found across the studies in the overall pooled estimate. Sensitivity analysis was then performed to evaluate the stability of the results, in which each individual study was sequentially dropped. The analysis was conducted by excluding any single study in turn and pooling the OR of the remaining studies. The summary ORs did not substantially change, with a range from 0.85 (95% CI: 0.68–1.06) to 0.91 (95% CI: 0.74–1.13) for EC and 0.73 (95% CI: 0.63–0.84) to 0.84 (95% CI: 0.73–0.97) for GC, for the highest intake category compared with the lowest.

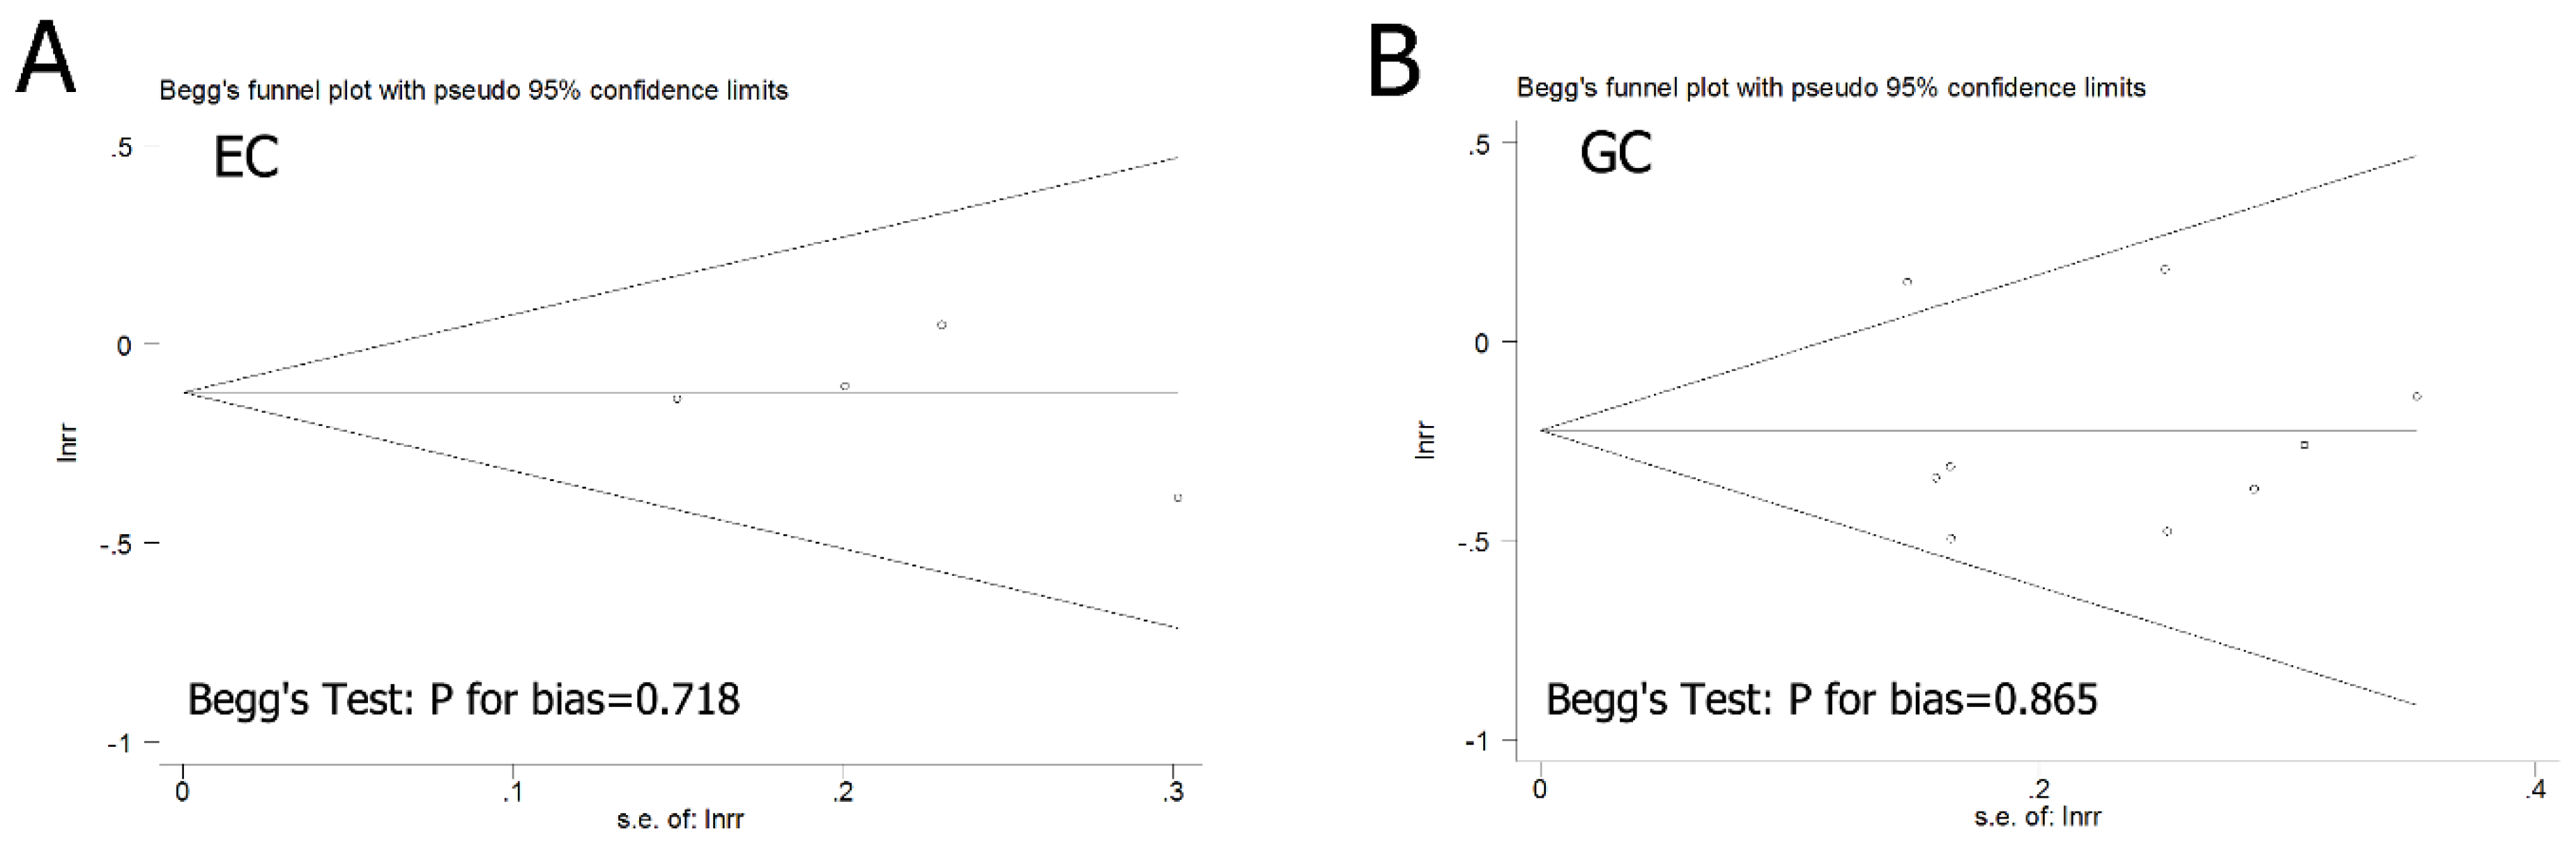
3.4. Publication Bias

Begg’s funnel plots and Egger’s tests were performed to assess the potential publication bias in the included studies. As shown in Figure 3, the shape of the funnel plot did not reveal any evidence of apparent asymmetry. Egger’s test, which provides statistical evidence of the funnel plot symmetry, indicated little evidence of publication bias. Therefore, no substantial publication bias was found in these included studies.
Figure 3. Funnel plot of flavonol intake and the risk of esophageal and gastric cancer.
Nutrients 08 00091 g003

4. Discussion

The WHO has indicated that over the next 20 years there will be an approximately 50% increase in new cancer cases attributed to the steadily increasing proportion of elderly people in the world. If the current smoking levels and the adoption of unhealthy lifestyles persist, the increase will be even greater [1,2]. Therefore, the identification of crucial modifiable risk factors in the diet is important for cancer prevention [29,30]. The chemopreventive effects of flavonoids have been extensively investigated in cellular and animal research models; however, the epidemiologic studies assessing the association between flavonoid intake and certain cancer risks have yielded inconsistent results. One potential reason is that different flavonoid subclasses vary in chemical structures and bioactivities.
The present meta-analysis supports a significant association of dietary flavonols intake with a reduced risk of GC, as well as EC and GC combined, especially in smokers. However, the interpretation of the results should be cautious. The present study has several potential limitations. The main limitation of this meta-analysis is the small number of perspective cohort studies and EC cases included. Especially the number of included studies for subgroup analysis was largely limited, some summary estimates even could not be calculated in several subgroup analyses due to the limited number of studies. So the results, especially subgroup analysis, should be interpreted with caution. More population-based studies are needed to validate the suggestions of the present meta-analysis. Furthermore, another potential confounding factor is the bioavailability of dietary flavonol compounds when estimating the amount of flavonol intake necessary to reduce the risk of EC and GC. In fact, little is known about flavonol absorption in the gastrointestinal tract; the metabolism of flavonols varies by individual, and the degree to which flavonols might have direct effects on epithelial surfaces as they traverse the esophagus and stomach is unclear.
Studies have indicated that dietary flavonol compounds have a variety of bioactivities that may repress carcinogenesis and cancer progression, such as anti-oxidant, anti-inflammation, anti-proliferative and anti-angiogenic activities [31,32,33,34] and may also suppress the effects of cytokines, growth factors, and some crucial enzymes [35,36]. Indeed, quercetin, the main flavonol compound in the daily diet, is able to reduce tumor cell viability, induce apoptosis, and decrease the production of reactive oxygen species via modulation of several key signaling pathways, such as IRE1/JNK, PI3K/Akt, and FOXO3A [37,38]. The chemopreventive effects of flavonols may be exerted by the combination of a series of related bioactivities and would be influenced by many established risk factors for cancer, including smoking status, alcohol consumption, total energy intake, and menopausal status [39,40]. In our study, a significant inverse association of high dietary flavonols intake with a reduced risk of EC and GC was observed in smokers (OR = 0.81, 95% CI: 0.71–0.91) but not in nonsmokers (OR = 1.07, 95% CI: 0.91–1.25). Tobacco smoking can cause oxidative stress, and both oxidative stress and smoking tobacco are related to an increased risk of EC and GC [41,42]. The possible chemopreventive mechanism of dietary flavonols may be attributed to their anti-oxidant properties, not only direct anti-oxidant action, but more importantly the ability to modulate related enzymatic pathways.
We are unaware of any previous sysmatic analysis of the association for dietary flavonols with risk of EC. The present meta-analysis shows that the pooled ORs of EC for the highest and the second highest flavonols intake compared with the lowest were 0.88 (95% CI: 0.73–1.08) and 0.74 (95% CI: 0.61–0.90), respectively. The results suggested that the higher, but not the highest, flavonols intake may be associated with a significant reduced risk of EC. The phenomenon may be attributed to the reason mentioned before. The diet with highest intake of flavonols tends to have high consumption of hot beverages and alcohol, which are risk factors for EC. Therefore, carefully identifying the sources of dietary flavonols and minimizing the effects of confounding factors are important and essential for evaluating the association between flavonols and cancer risks. Woo and Kim conducted a meta-analysis of GC risk and dietary flavonoids previously; a significant association was found only between flavonols and GC risk based on a limited number of selected studies (OR (95%CI) = 0.68 (0.46–0.99)) [43]. The present study showed similar results. Notably, in our study the pooled ORs of GC for the highest, the second and the third highest flavonols intake compared with the lowest were 0.80 (95% CI: 0.70–0.91), 0.78 (95% CI: 0.64–0.95) and 0.74 (95% CI: 0.55–0.99) respectively. Although all the high intakes of dietary flavonols significantly are associated with reduced risks of GC, the protective effect of dietary flavonols seems decreased with the increasing intake. The phenomenon and the potential reasons might be similar to that in the relation of EC risk and dietary flavonols.

5. Conclusions

In conclusion, the present study indicated a significant association of dietary flavonols intake with a decreased risk of GC, as well as EC and GC combined, especially in smokers. Nevertheless, the results should be interpreted with caution. Residual confounding by alcohol, hot beverages consumption, smoking and total energy intake, etc. is a great concern in studies of EC and GC. Therefore, more carefully designed studies, especially cohort studies, should be conducted to investigate the association of dietary flavonols intake with the risk of EC and GC.

Acknowledgments

This work was supported by a research grant from the National Natural Science Foundation of China (81001197, Su YX, and the National Key Specialty Construction of Clinical Project (#2013-544). The funders had no role in the study design, data collection and analysis, decision to publish, or preparation of the manuscript.

Author Contributions

Xie Y. and Su. Y.X. conceived and designed the study; Xie Y. and Huang S.F. conducted the systematic search of the literatures; Xie Y., Huang S.F. and Su Y.X. performed data extractions from each included studies; Xie Y. and Su Y.X. analyzed the data; Su Y.X. wrote the paper.

Conflicts of Interest

The authors declare no conflict of interest.

References

  1. Global Burden of Disease Cancer Collaboration; Fitzmaurice, C.; Dicker, D.; Pain, A.; Hamavid, H.; Moradi-Lakeh, M.; MacIntyre, M.F.; Allen, C.; Hansen, G.; Woodbrook, R.; et al. The Global Burden of Cancer 2013. JAMA Oncol. 2015, 1, 505–527. [Google Scholar] [CrossRef] [PubMed]
  2. Torre, L.A.; Bray, F.; Siegel, R.L.; Ferlay, J.; Lortet-Tieulent, J.; Jemal, A. Global cancer statistics, 2012. CA Cancer J. Clin. 2015, 65, 87–108. [Google Scholar] [CrossRef] [PubMed]
  3. Devesa, S.S.; Blot, W.J.; Fraumeni, J.F., Jr. Changing patterns in the incidence of esophageal and gastric carcinoma in the United States. Cancer 1998, 83, 2049–2053. [Google Scholar] [CrossRef]
  4. Simard, E.P.; Ward, E.M.; Siegel, R.; Jemal, A. Cancers with increasing incidence trends in the United States: 1999 through 2008. CA Cancer J. Clin. 2012, 62, 118–128. [Google Scholar] [CrossRef] [PubMed]
  5. Wijnhoven, B.P.; Siersema, P.D.; Hop, W.C.; van Dekken, H.; Tilanus, H.W. Adenocarcinomas of the distal oesophagus and gastric cardia are one clinical entity. Rotterdam Oesophageal Tumour Study Group. Br. J. Surg. 1999, 86, 529–535. [Google Scholar] [CrossRef] [PubMed]
  6. Abnet, C.C.; Corley, D.A.; Freedman, N.D.; Kamangar, F. Diet and upper gastrointestinal malignancies. Gastroenterology 2015, 148, 1234–1243.e4. [Google Scholar] [CrossRef] [PubMed]
  7. Somi, M.H.; Mousavi, S.M.; Naghashi, S.; Faramarzi, E.; Jafarabadi, M.A.; Ghojazade, M.; Majidi, A.; Naseri Alavi, S.A. Is there any relationship between food habits in the last two decades and gastric cancer in North-Western Iran? Asian Pac. J. Cancer Prev. 2015, 16, 283–290. [Google Scholar] [CrossRef] [PubMed]
  8. Lin, S.H.; Li, Y.H.; Leung, K.; Huang, C.Y.; Wang, X.R. Salt processed food and gastric cancer in a Chinese population. Asian Pac. J. Cancer Prev. 2014, 15, 5293–5298. [Google Scholar] [CrossRef] [PubMed]
  9. Wang, Z.M.; Zhao, D.; Nie, Z.L.; Zhao, H.; Zhou, B.; Gao, W.; Wang, L.S.; Yang, Z.J. Flavonol intake and stroke risk: A meta-analysis of cohort studies. Nutrition 2014, 30, 518–523. [Google Scholar] [CrossRef] [PubMed]
  10. Chang, H.; Xie, Q.; Zhang, Q.Y.; Peng, X.L.; Zhu, J.D.; Mi, M.T. Flavonoids, flavonoid subclasses and breast cancer risk: A meta-analysis of epidemiologic studies. PLoS ONE 2013, 8, e54318. [Google Scholar]
  11. Miles, S.L.; McFarland, M.; Niles, R.M. Molecular and physiological actions of quercetin: need for clinical trials to assess its benefits in human disease. Nutr. Rev. 2014, 72, 720–734. [Google Scholar] [CrossRef] [PubMed]
  12. Xue, W.; Song, B.A.; Zhao, H.J.; Qi, X.B.; Huang, Y.J.; Liu, X.H. Novel myricetin derivatives: Design, synthesis and anticancer activity. Eur. J. Med. Chem. 2015, 97, 155–163. [Google Scholar] [CrossRef] [PubMed]
  13. Greenland, S. Quantitative methods in the review of epidemiologic literature. Epidemiol. Rev. 1987, 9, 1–30. [Google Scholar] [PubMed]
  14. Mantel, N.; Haenszel, W. Statistical aspects of the analysis of data from retrospective studies of disease. J. Natl. Cancer Inst. 1959, 22, 719–748. [Google Scholar] [PubMed]
  15. DerSimonian, R.; Laird, N. Meta-analysis in clinical trials. Control. Clin. Trials 1986, 7, 177–188. [Google Scholar] [CrossRef]
  16. Ioannidis, J.P.; Ntzani, E.E.; Trikalinos, T.A.; Contopoulos-Ioannidis, D.G. Replication validity of genetic association studies. Nat. Genet. 2001, 29, 306–309. [Google Scholar] [CrossRef] [PubMed]
  17. Petrick, J.L.; Steck, S.E.; Bradshaw, P.T.; Trivers, K.F.; Abrahamson, P.E.; Engel, L.S.; He, K.; Chow, W.H.; Mayne, S.T.; Risch, H.A.; et al. Dietary intake of flavonoids and oesophageal and gastric cancer: incidence and survival in the United States of America (USA). Br. J. Cancer 2015, 112, 1291–1300. [Google Scholar] [CrossRef] [PubMed]
  18. Vermeulen, E.; Zamora-Ros, R.; Duell, E.J.; Luján-Barroso, L.; Boeing, H.; Aleksandrova, K.; Bueno-de-Mesquita, H.B.; Scalbert, A.; Romieu, I.; Fedirko, V.; et al. Dietary flavonoid intake and esophageal cancer risk in the European prospective investigation into cancer and nutrition cohort. Am. J. Epidemiol. 2013, 178, 570–581. [Google Scholar] [CrossRef] [PubMed]
  19. Bobe, G.; Peterson, J.J.; Gridley, G.; Hyer, M.; Dwyer, J.T.; Brown, L.M. Flavonoid consumption and esophageal cancer among black and white men in the United States. Int. J. Cancer 2009, 125, 1147–1154. [Google Scholar] [CrossRef] [PubMed]
  20. Rossi, M.; Garavello, W.; Talamini, R.; La Vecchia, C.; Franceschi, S.; Lagiou, P.; Zambon, P.; Dal Maso, L.; Bosetti, C.; Negri, E. Flavonoids and risk of squamous cell esophageal cancer. Int. J. Cancer 2007, 120, 1560–1564. [Google Scholar] [CrossRef] [PubMed]
  21. Ekström, A.M.; Serafini, M.; Nyrén, O.; Wolk, A.; Bosetti, C.; Bellocco, R. Dietary quercetin intake and risk of gastric cancer: Results from a population-based study in Sweden. Ann. Oncol. 2011, 22, 438–443. [Google Scholar] [CrossRef] [PubMed]
  22. Woo, H.D.; Lee, J.; Choi, I.J.; Kim, C.G.; Lee, J.Y.; Kwon, O.; Kim, J. Dietary flavonoids and gastric cancer risk in a Korean population. Nutrients 2014, 6, 4961–4973. [Google Scholar] [CrossRef] [PubMed]
  23. Zamora-Ros, R.; Agudo, A.; Luján-Barroso, L.; Romieu, I.; Ferrari, P.; Knaze, V.; Bueno-de-Mesquita, H.B.; Leenders, M.; Travis, R.C.; Navarro, C.; et al. Dietary flavonoid and lignan intake and gastric adenocarcinoma risk in the European Prospective Investigation into Cancer and Nutrition (EPIC) study. Am. J. Clin. Nutr. 2012, 96, 1398–1408. [Google Scholar] [CrossRef] [PubMed]
  24. Rossi, M.; Rosato, V.; Bosetti, C.; Lagiou, P.; Parpinel, M.; Bertuccio, P.; Negri, E.; La Vecchia, C. Flavonoids, proanthocyanidins, and the risk of stomach cancer. Cancer Causes Control. 2010, 21, 1597–1604. [Google Scholar] [CrossRef] [PubMed]
  25. Lagiou, P.; Samoli, E.; Lagiou, A.; Peterson, J.; Tzonou, A.; Dwyer, J.; Trichopoulos, D. Flavonoids, vitamin C and adenocarcinoma of the stomach. Cancer Causes Control. 2004, 15, 67–72. [Google Scholar] [CrossRef] [PubMed]
  26. Knekt, P.; Kumpulainen, J.; Järvinen, R.; Rissanen, H.; Heliövaara, M.; Reunanen, A.; Hakulinen, T.; Aromaa, A. Flavonoid intake and risk of chronic diseases. Am. J. Clin. Nutr. 2002, 76, 560–568. [Google Scholar] [PubMed]
  27. Hirvonen, T.; Virtamo, J.; Korhonen, P.; Albanes, D.; Pietinen, P. Flavonol and flavone intake and the risk of cancer in male smokers (Finland). Cancer Causes Control. 2001, 12, 789–796. [Google Scholar] [CrossRef] [PubMed]
  28. Garcia-Closas, R.; Gonzalez, C.A.; Agudo, A.; Riboli, E. Intake of specific carotenoids and flavonoids and the risk of gastric cancer in Spain. Cancer Causes Control. 1999, 10, 71–75. [Google Scholar] [CrossRef] [PubMed]
  29. Siegel, R.L.; Miller, K.D.; Jemal, A. Cancer statistics, 2015. CA Cancer J. Clin. 2015, 65, 5–29. [Google Scholar] [CrossRef] [PubMed]
  30. Fedewa, S.A.; Sauer, A.G.; Siegel, R.L.; Jemal, A. Prevalence of major risk factors and use of screening tests for cancer in the United States. Cancer Epidemiol. Biomark. Prev. 2015, 24, 637–652. [Google Scholar] [CrossRef] [PubMed]
  31. Rajesh, E.; Sankari, L.S.; Malathi, L.; Krupaa, J.R. Naturally occurring products in cancer therapy. J. Pharm. Bioallied. Sci. 2015, 7, S181–S183. [Google Scholar] [CrossRef] [PubMed]
  32. Russo, G.L.; Russo, M.; Spagnuolo, C. The pleiotropic flavonoid quercetin: from its metabolism to the inhibition of protein kinases in chronic lymphocytic leukemia. Food Funct. 2014, 5, 2393–2401. [Google Scholar] [CrossRef] [PubMed]
  33. Liu, Y.; Wu, Y.M.; Zhang, P.Y. Protective effects of curcumin and quercetin during benzo(a)pyrene induced lung carcinogenesis in mice. Eur. Rev. Med. Pharmacol. Sci. 2015, 19, 1736–1743. [Google Scholar] [PubMed]
  34. Sak, K. Dependence of DPPH radical scavenging activity of dietary flavonoid quercetin on reaction environment. Mini Rev. Med. Chem. 2014, 14, 494–504. [Google Scholar] [CrossRef] [PubMed]
  35. Miyamoto, N.; Izumi, H.; Miyamoto, R.; Kondo, H.; Tawara, A.; Sasaguri, Y.; Kohno, K. Quercetin induces the expression of peroxiredoxins 3 and 5 via the Nrf2/NRF1 transcription pathway. Invest. Ophthalmol. Vis. Sci. 2011, 52, 1055–1563. [Google Scholar] [CrossRef] [PubMed]
  36. Men, K.; Duan, X.; Wei, X.W.; Gou, M.L.; Huang, M.J.; Chen, L.J.; Qian, Z.Y.; Wei, Y.Q. Nanoparticle-delivered quercetin for cancer therapy. Anticancer Agents Med. Chem. 2014, 14, 826–832. [Google Scholar] [CrossRef] [PubMed]
  37. Tseng, H.L.; Li, C.J.; Huang, L.H.; Chen, C.Y.; Tsai, C.H.; Lin, C.N.; Hsu, H.Y. Quercetin 3-O-methyl ether protects FL83B cells from copper induced oxidative stress through the PI3K/Akt and MAPK/Erk pathway. Toxicol. Appl. Pharmacol. 2012, 264, 104–113. [Google Scholar] [CrossRef] [PubMed]
  38. Lu, Q.; Ji, X.J.; Zhou, Y.X.; Yao, X.Q.; Liu, Y.Q.; Zhang, F.; Yin, X.X. Quercetin inhibits the mTORC1/p70S6K signaling-mediated renal tubular epithelial-mesenchymal transition and renal fibrosis in diabetic nephropathy. Pharmacol. Res. 2015, 99, 237–247. [Google Scholar] [CrossRef] [PubMed]
  39. Touvier, M.; Druesne-Pecollo, N.; Kesse-Guyot, E.; Andreeva, V.A.; Fezeu, L.; Galan, P.; Hercberg, S.; Latino-Martel, P. Dual association between polyphenol intake and breast cancer risk according to alcohol consumption level: a prospective cohort study. Breast Cancer Res. Treat. 2013, 137, 225–236. [Google Scholar] [CrossRef] [PubMed]
  40. Milenkovic, D.; Vanden Berghe, W.; Boby, C.; Leroux, C.; Declerck, K.; Szarc vel Szic, K.; Heyninck, K.; Laukens, K.; Bizet, M.; Defrance, M.; et al. Dietary flavanols modulate the transcription of genes associated with cardiovascular pathology without changes in their DNA methylation state. PLoS ONE 2014, 9, e95527. [Google Scholar] [CrossRef] [PubMed] [Green Version]
  41. Li, G.; Wulan, H.; Song, Z.; Paik, P.A.; Tsao, M.L.; Goodman, G.M.; MacEachern, P.T.; Downey, R.S.; Jankowska, A.J.; Rabinowitz, Y.M.; et al. Regulatory B Cell Function Is Suppressed by Smoking and Obesity in H. pylori-Infected Subjects and Is Correlated with Elevated Risk of Gastric Cancer. PLoS ONE 2015, 10, e0134591. [Google Scholar] [CrossRef] [PubMed]
  42. De Stefani, E.; Ronco, A.; Mendilaharsu, M.; Deneo-Pellegrini, H. Diet and risk of cancer of the upper aerodigestive tract--II. Nutrients.Oral Oncol. 1999, 35, 22–26. [Google Scholar] [CrossRef]
  43. Woo, H.D.; Kim, J. Dietary flavonoid intake and risk of stomach and colorectal cancer. World J. Gastroenterol. 2013, 19, 1011–1019. [Google Scholar] [CrossRef] [PubMed]

